

Machine Learning to Develop Credit Card Customer Churn Prediction

1
Department of Finance and Banking Sciences, Faculty of Business, Applied Science Private University, Amman 11931, Jordan
2
MIS Department, Faculty of Business, Sohar University, Sohar 311, Oman
3
Department of Computer Engineering, Faculty of Engineering and Architecture, Istanbul Gelisim University, 34310 Istanbul, Turkey
*
Author to whom correspondence should be addressed.
J. Theor. Appl. Electron. Commer. Res. 2022, 17(4), 1529-1542; https://doi.org/10.3390/jtaer17040077
Submission received: 11 September 2022
/
Revised: 28 October 2022
/
Accepted: 9 November 2022
/
Published: 16 November 2022
(This article belongs to the Topic Artificial Intelligence Applications in Financial Technology)
Abstract
:The credit card customer churn rate is the percentage of a bank’s customers that stop using that bank’s services. Hence, developing a prediction model to predict the expected status for the customers will generate an early alert for banks to change the service for that customer or to offer them new services. This paper aims to develop credit card customer churn prediction by using a feature-selection method and five machine learning models. To select the independent variables, three models were used, including selection of all independent variables, two-step clustering and k-nearest neighbor, and feature selection. In addition, five machine learning prediction models were selected, including the Bayesian network, the C5 tree, the chi-square automatic interaction detection (CHAID) tree, the classification and regression (CR) tree, and a neural network. The analysis showed that all the machine learning models could predict the credit card customer churn model. In addition, the results showed that the C5 tree machine learning model performed the best in comparison with the three developed models. The results indicated that the top three variables needed in the development of the C5 tree customer churn prediction model were the total transaction count, the total revolving balance on the credit card, and the change in the transaction count. Finally, the results revealed that merging the multi-categorical variables into one variable improved the performance of the prediction models.
1. Introduction
At present, the market is dynamic and highly competitive due to the availability of large numbers of service providers, especially banks, worldwide. One of the main challenges for this sector is the change in customer behavior. Customers are the core of all industries, especially customer-dependent organizations, such as the banking sector, which is responsible for accepting deposits, making investments, and granting loans. Long-term customers are directly connected to the production of profits; hence, banks should avoid losing customers [1,2,3,4]. The Harvard Business Review believes that a 5% defection in customers can lead to an increase in profits for firms of between 25% and 85% [4,5]. Thus, given that customers are the most important assets with strong effects on a bank’s profit, there are five essential pillars for the modern banking business: capital, liquidity, risk, assets, and customer management [6,7]. Focusing effectively on the five pillars can ensure that management effectively maximizes the profits of a bank [7,8].
Therefore, customer churn is a fundamental challenge for banks. Customer churn can be defined as the loss of a customer to a competitor, which leads to losses in profits. To manage churning, it is essential to identify those customers who are likely to move to a competing bank [9,10,11]. In addition, Risselada et al. (2010) [12] showed that churning management is important in establishing appropriate long-term relationships between firms and customers to maximize the value of the customer base. Customer churn can be divided into two groups: voluntary churn and nonvoluntary churn. Nonvoluntary churn occurs when the bank withdraws services from customers, and it is easy to detect. On the other hand, voluntary churn is more difficult to identify, because it is a conscious decision by a customer to terminate their relationship with a certain bank. Moreover, it can be subdivided into incidental churn and deliberate churn: incidental churn occurs when there are changes in a customer’s circumstances that prevent them from dealing with their bank (e.g., financial conditions), and this represents a small percentage [9,10,11]; deliberate churn is caused by various factors, including new technological services, better prices, and quality factors [13].
Accordingly, banks should regularly monitor customers to detect warning signs regarding a customer’s behavior that may lead to churn. Currently, researchers and bank mangers study patterns and trends in the data to develop models that can predict whether a customer is planning to churn or not [14]. Furthermore, data provide vital tools in banks; to discover the hidden patterns within large databases, it is recommended to apply clustering procedures, including neural network classification based on customer features. These procedures assist in building churn prediction models [15,16,17,18].
Customer churn prediction utilizing big data is a research area within machine learning technology, which works to classify distinctive types of customers into either churning or non-churning customers [14,19,20]. Many studies in the literature have created multiple prediction models relying on statistical and data mining techniques (machine learning models), such as linear regression, decision trees, random forests, logistic regression, neural networks, support vector machines, and deep neural networks [1,2,5,21,22].
The prediction of credit card customer churn is not a new field; many researchers have developed various prediction models. Kaya et al. (2018) [23] developed a prediction model which considered the individual transaction records of customers. The model mainly used information related to spatiotemporal factors, as well as choice and behavioral trait factors. The results showed that the developed model had more accurate prediction than the traditional models that considered demographics-based features. Moreover, early researchers tried to address the question of how machine learning models could be developed to predict customer churn, as discussed in Miao and Wang (2022) [24]. The authors developed a credit card customer churn prediction model by considering three machine learning approaches: random forest, linear regression, and k-nearest neighbor (KNN). The collected dataset contained 10,000 datum with 21 features, and the model was evaluated using the ROC, AUC, and confusion matrix. The results found that random forest had the best performance compared with the other machine learning models, with 96.3% accuracy. The results revealed that the top three important variables were the total transaction amount, the count in the last 12 months, and the total revolving balance. In addition, de Lima Lemos et al. (2022) [25] investigated churned customers in the banking sectors in Brazil. The study aimed to understand and predict the main variables that affected the customers who closed or stopped their accounts in the last six months. The study used various machine learning models, including random forest, k-nearest neighbor, decision tree, logistic regression, elastic net, and support vector machine models. The results found that random forest outperformed the other machine learning models in several performance metrics. The results found that customers with a stronger relationship with an institution, who borrowed more from the bank, were less likely to close their accounts. The results revealed that the model successfully predicted the losses of up to 10% of the operating results reported by the largest banks in Brazil.
Moreover, retail banking churn prediction was considered by Bharathi et al. (2020) [26]; the sample covered 602 young adult bank customers. To validate the developed model, different machine learning models were used, including ridge classifier cross-validation, the k-nearest neighbor classifier, decision tree, logistic regression, support vector classifier (SVC), and linear SVC. The results showed that the extra-tree classifier model had the highest performance compared with other models. The research showed that the top features to develop a prediction model were the absence of mobile banking, zero-interest personal loans, zero balance, and other services online. Saias et al. (2022) [27] developed a churn risk prediction model for customers of cloud service providers. The aim of the study was to create an alert system to avoid losing cloud customers based on neural network model AdaBoost and random forest. The results found that random forest outperformed other models. Moreover, many researchers developed a prediction system for different churned customers in various fields such as the telecommunication industries [28], and the E-commerce industry [29].
Bank churn prediction aims to understand the possibility of customers moving from one bank to another. The reasons for movement include the availability of the latest technology, low interest rates, services offered, and credit card benefits [30]. This study aims to predict churned customers based on credit card and customer information (i.e., age and gender). Meanwhile, researchers have attempted to find credit card fraud detection using machine learning models [31,32] or by developing optimization algorithms with machine learning models [33].
Most of the prediction models in the literature have focused on developing prediction models for various problems in the banking system with a little interest in credit card customers. Therefore, the authors of this paper tried to fill the gaps of the previous studies in the field. The contributions of this paper are as follows:
- Prediction models developed based on forwarding different numbers of independent variables.
- The capability of the prediction models was validated based on two-step clustering and k-nearest neighbors.
- The capabilities of the machine learning models to predict credit card customer churn in banks were predicted.
- The top features for developing a credit card churn prediction method were determined.
The primary aims of this article are as follows:
- To use different independent variables in building a prediction model based on two-step clustering and k-nearest neighbors.
- To select the appropriate machine learning models with top features for predicting churn customers.
2. Research Methodology
Various studies have developed models for predicting customer churn without utilizing significant variables. To overcome this issue, it has been suggested that categorical variables are merged into one variable. Therefore, this research gap prompted the authors to find an appropriate model for predicting customer churn.
The primary step for developing a customer churn prediction model is to collect, analyze, and clean the dataset. Poorly cleaned data are unable to establish a relationship between input and output variables; in turn, this affects the performance of the prediction model. Therefore, the cleaned dataset can be applied in three models to build customer churn prediction models. The methods aim to select input variables depending on different independent variables that are selected by feeding all the independent variables in the dataset (continuous and categorical), selecting variables based on two-step clustering and logistic regression (continuous and cluster number variable), and selecting variables based on a feature-selection method. The outputs of the three models are applied in various machine learning models, including random forest, neural network, CR-Tree, C5 tree, Bayesian network, CHAID tree, support vector machine, quest tree, multinomial logistic regression, and a linear regression model. For brevity, only the top five machine learning models were considered in this study. This section is divided into subsections: data collection, developed prediction models, machine learning models, and performance metrics.
2.1. Data Collection
This paper depends on the dataset of credit card customer churn for banks; the dataset was collected from https://leaps.analyttica.com (accessed on 10 September 2021). Customers have the option to choose one of four credit card types: blue, silver, gold, or platinum. When customers decide to change their bank, they are recorded as churn customers. Consequently, churn customers cause the profits of a banking system to decrease. Therefore, there has been increased interest from banking professionals to design an early-warning system to classify a bank’s customers into churn or non-churn customers. The system would be able to notify the bank’s managers so that they can communicate with customers who are expected to churn to improve their services, which is an appropriate way to keep the customers satisfied with their bank. The dataset contains 20 variables: 1 dependent variable and 19 independent variables. The total number of customers is 10,127, with 1627 churn customers.
The dataset contains the following data: a churn value (dependent), age, gender, number of dependents, education level, marital status, income category, product variable (type of credit card—blue, silver, gold, platinum), period of relationship with bank, total number of products held by the customer, number of months inactive of the last 12 months, number of contacts in the last 12 months, credit limit on the credit card, total revolving balance on the credit card, open to buy credit line (average of last 12 months), change in transaction amount (Q4 over Q1), total transaction amount (last 12 months), total transaction count (last 12 months), change in transaction count (Q4 over Q1), and average card utilization ratio. The full analysis of the dataset can be found in the DAS link.
Firstly, the dataset was divided into categorical and continuous variables as independent variables and one dependent variable (churn customers). Next, we analyzed the variables using different statistical metrics including min, max, variance, standard deviation, chi square (for categorical variable), and correlation analysis (for continuous variable). The initial analysis showed that the linear relationship between variables does not exist; therefore, a nonlinear model was applied to develop a prediction model for customer churn.
2.2. Developed Customers Churn Prediction Models
To develop a prediction model, three methods were utilized to control the number of independent variables used in the prediction model. First, all independent variables were directed to one of the applied machine learning models, which is referred to as Model 1. Next, we improved the independent variables by applying a two-step clustering method to the categorical variables only. Afterwards, the continuous variables with the cluster values were forwarded to each one of the machine learning models. To make the model more realistic, a logistic regression approach was used to predict the cluster number based on the categorical variables. This model is denoted as Model 2.
Model 2 was divided into two phases: the clustering phase and the prediction phase. In the clustering phase, the dataset was divided into groups using two-step clustering, and the continuous variables with a group variable were used to build a prediction model using the neural network. In the clustering model, the categorical variables were used to divide the customers into a specific number of groups. This step aimed to minimize the number of input variables forwarded to the machine learning model, in addition to simplifying the meta data of the customers. Moreover, the k-nearest neighbor model was used to ensure that the developed model was suitable for the online scenario and to avoid repeating the clustering analysis for future data. The k-nearest neighbors model uses customers’ categorical meta data as input and the cluster number from the two-step clustering step as output. Furthermore, in the prediction phase, one of the machine learning models was used to build a prediction model by receiving the inputs from the two-step clustering step and the continuous meta data of the customers. To build a prediction model which depends on machine learning, the dataset should be divided into training, validating, and testing data. The training data was used to learn the network from the previous information about the churn and non-churn customers. The test data were used to test the capability of the machine learning model in predicting the future churn customers. Based on previous research, the best percentages for building training, validating, and testing data for a dataset were found to be 70%, 15%, and 15%, respectively. Figure 1 shows how all the proposed phases of building the prediction model collaborated.
Two-step clustering is a tool designed to handle the nature of the data and to find main insights. The differences between the two-step method and other clustering models include the following: it can use both categorical and continuous variables; then, it can automatically choose the appropriate number of clusters. Grouping data using the two-step clustering method involves an initial use of the distance measure to divide the data into groups; then, probabilistic approach is applied to select the optimal group.
For Model 3, all the independent variables, including the categorical and continuous variables, were forwarded to the feature-selection method to select the features that were related to the churn customers. The feature-selection method ranked the features as important, marginal, and unimportant. Only the important variables were forwarded to the machine learning models to be used in building the prediction models. A summary of the applied models is shown in Table 1.
2.3. Machine Learning Models
This study adopted three methods for selecting independent variables, which aimed to understand the most suitable model for improving the performance of the prediction model based on machine learning models. The study applied ten machine learning models: random forest, neural network, CR-Tree, C5 tree, Bayesian network, CHAID tree, support vector machine, quest tree, multinomial logistic regression, and a linear regression model. The initial results denoted that the top five machine learning algorithms for the developed models in Table 1 were Bayesian network, C5 tree, CHAID tree, CR-Tree, and the neural network [34,35,36,37,38].
2.4. Performance Metrics
To design a predictor, the dataset was divided into training, validating, and testing datasets, with cutoff percentages of 70%, 15%, and 15% for training, testing, and validating the data, respectively.
The performance of churn customers prediction models can be evaluated by using classification parameter variables: recall, precision, accuracy, false omission rate, and F1 score. To find the performance metrics, a confusion matrix is generated first using the output of the classification results. The confusion matrix contains four parts: true positive (TP), true negative (TN), false positive (FP), and false negative (FN). The definitions of the confusion matrix are:
- True positives (TP): Number of churn customers correctly predicted as true churn.
- True negatives (TN): Number of non-churn customers correctly predicted as non-churn.
- False positives (FP): Number of churn customers incorrectly predicted as non-churn.
- False negatives (FN): Number of non-churn customers incorrectly predicted as churn.
To calculate performance metrics, the following equations are used:
3. Results Discussion and Analysis
To validate the developed models, the top five machine learning models were considered: Bayesian network, C5 tree, CHAID tree, CR-Tree, and the neural network. This section is divided based on the developed models explained previously in the methodology section.
3.1. Model 1: Develop Customers Churn Based on All Variables
Model 1 used all the categorical and continuous variables in the dataset. The independent variables were age, gender, number of dependents, education level, marital status, income category, product variable, period of relationship with bank, total number of products, number of months inactive in the last 12 months, no. of contacts in the last 12 months, credit limit on the credit card, total revolving balance on the credit card, open to buy credit line (average of last 12 months), change in transaction amount (Q4 over Q1), total transaction amount (last 12 months), total transaction count (last 12 months), change in transaction count (Q4 over Q1), and average card utilization ratio. The dependent variable was the status of the customer (churn or non-churn).
The training, testing, and validation results for Model 1 are shown in Table 2. The results showed that, for the training dataset, the accuracy and the FOR variables achieved more than 0.9, whereas the precision, recall, and F1 score showed variation between the machine learning models, with the best results achieved for the C5 tree model. To improve the performance of the training model, a validation dataset was used. The initial results showed that the Bayesian network, CHAID, and the neural network failed to enhance the performance of the prediction model. Additionally, the C5 tree and CR-Tree models showed improvements for the validation dataset compared with the training dataset, with best results derived using the C5 tree model. Finally, the dataset was tested to check the capability of the developed model to predict the future dataset. All the models’ results show that their capabilities in predicting the churn customers is acceptable, with the highest performance derived with the C5 tree model. The accuracy, precision, recall, FOR, and F1 score for the C5 tree model with the testing dataset were 0.964, 0.914, 0.880, 0.974, and 0.897, respectively. The results indicated that the C5 tree model showed higher capability in predicting the training, validating, and testing datasets compared with the other four machine learning models applied.
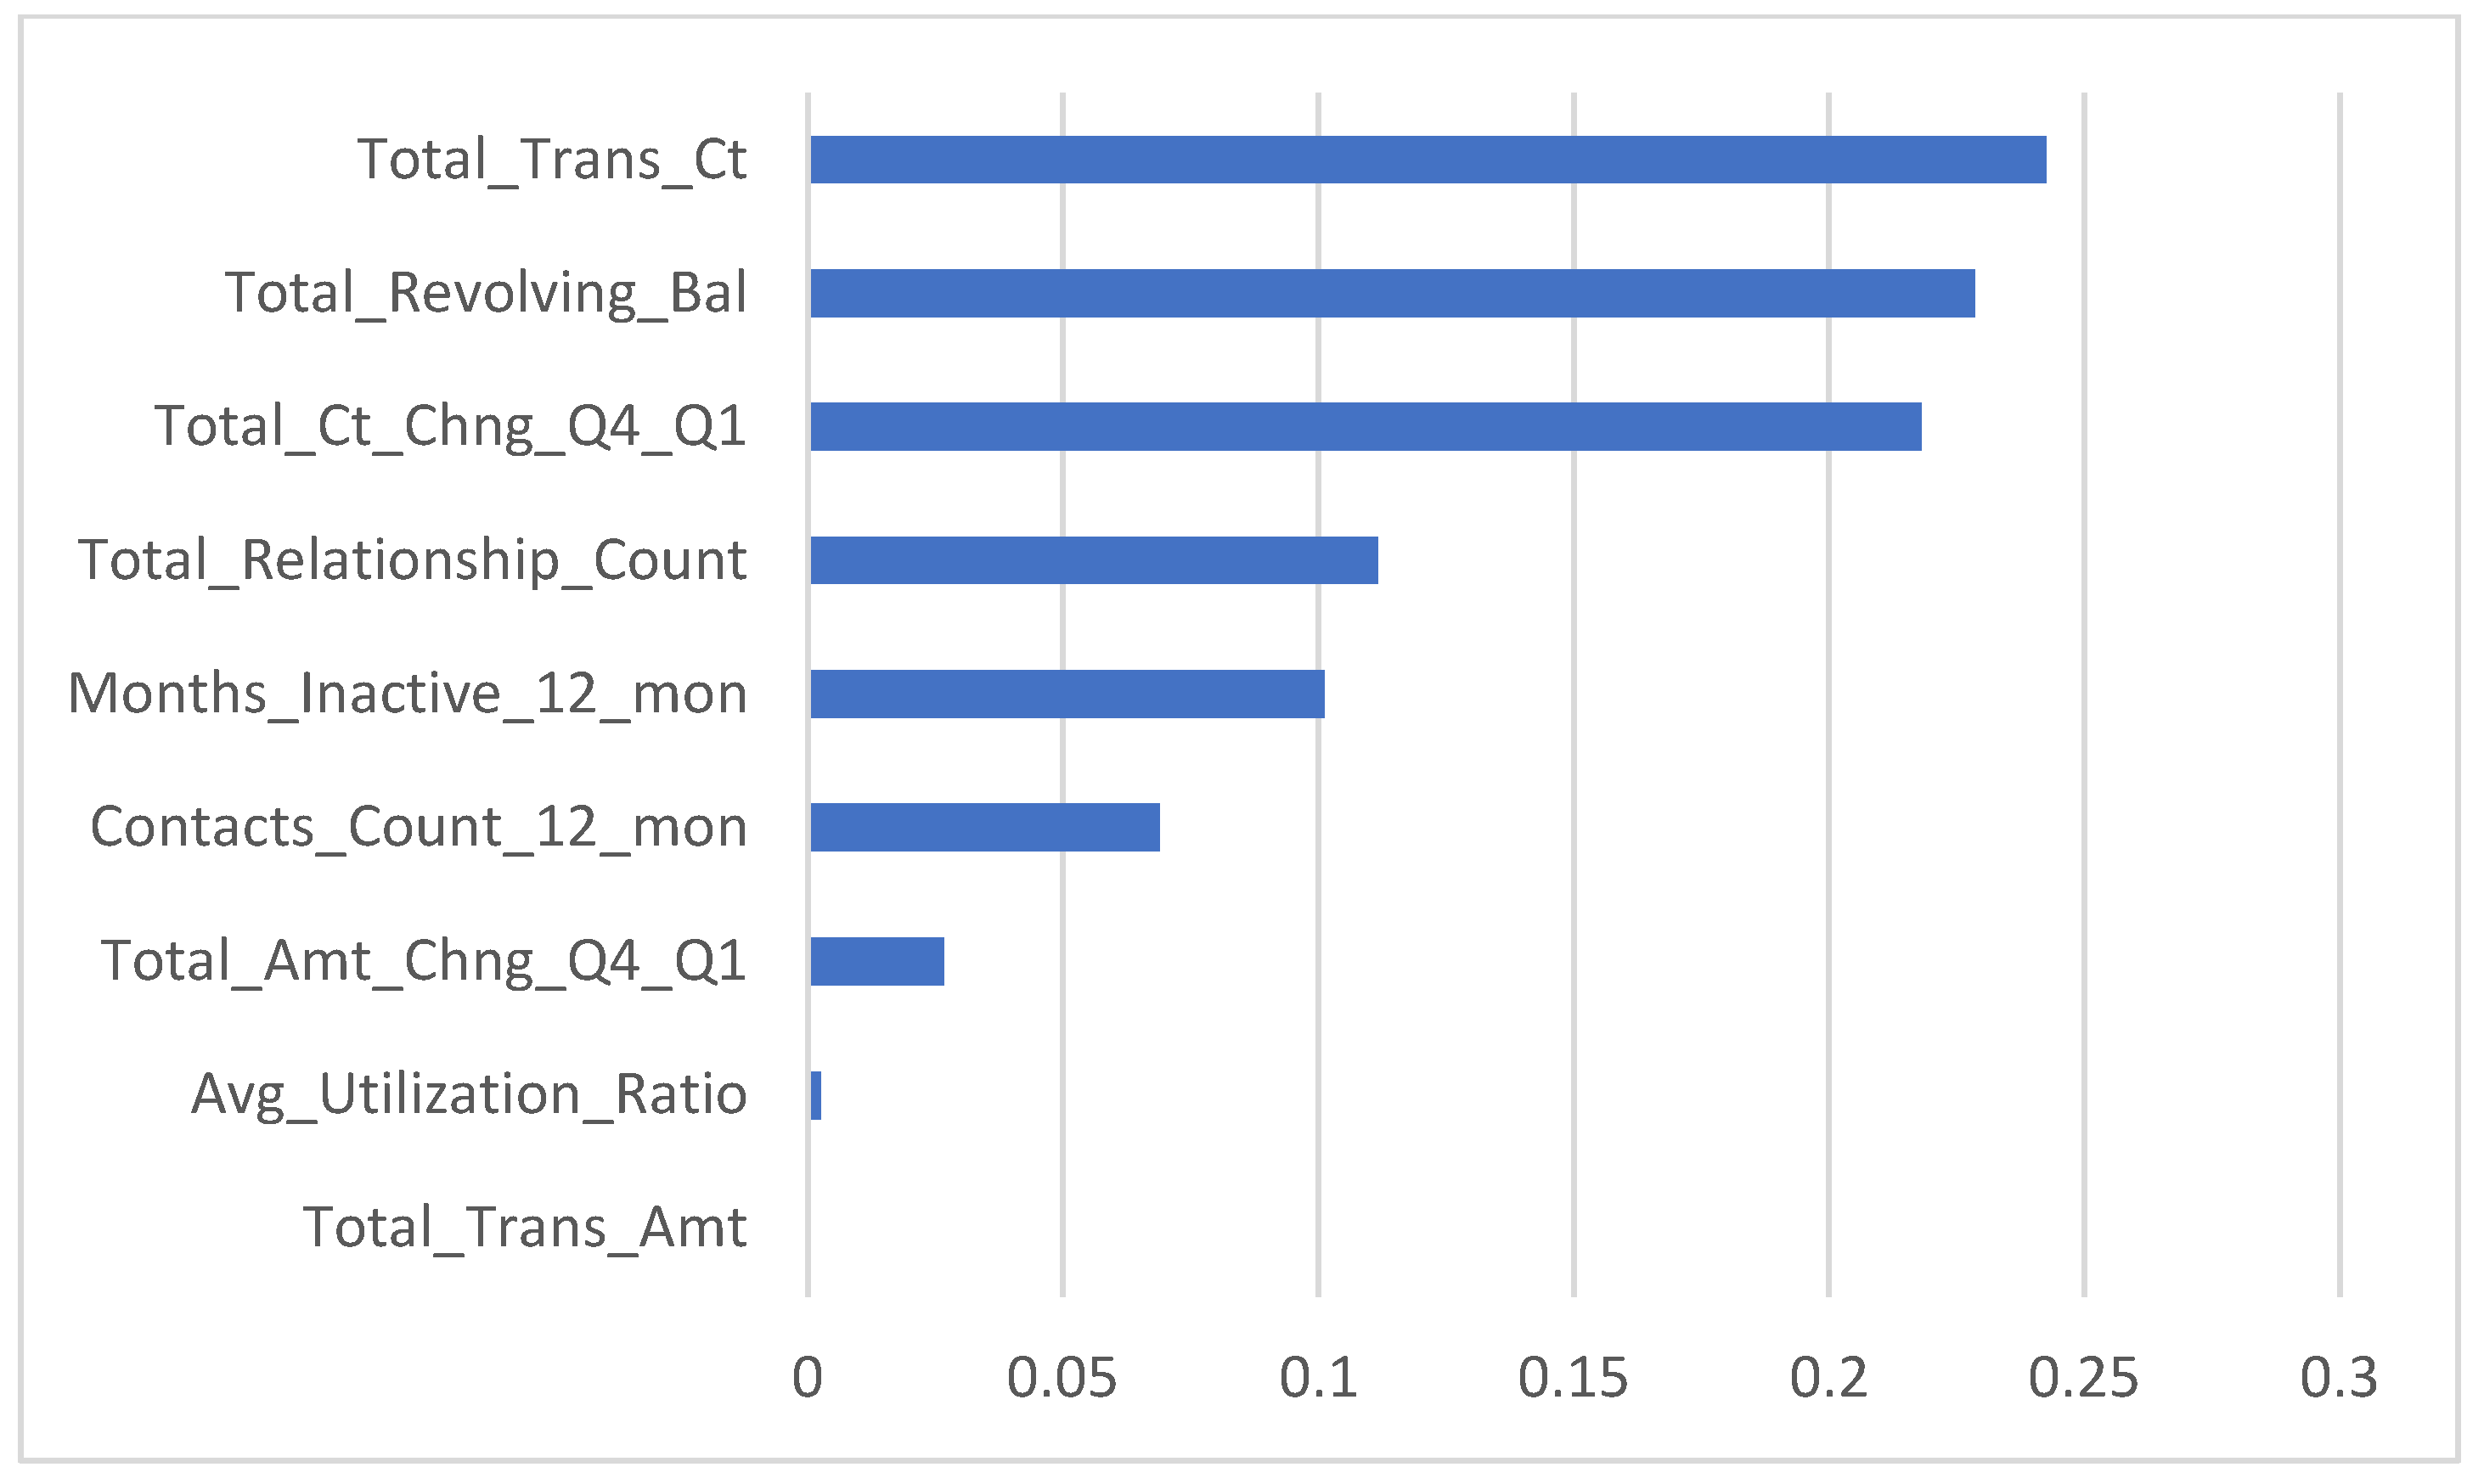
To merge the collected results and the studied variables, the importance of the variables included as independent variables is shown in Figure 2. The importance of each variable analysis revealed that the top three variables were: change in transaction count, total revolving balance on the credit card, and total transaction count. Here, open-to-buy credit lines and the total transaction amounts showed very weak relations in building the C5 tree prediction model.
3.2. Model 2: Developed Churn Customers Based on Two-Step Clustering and K-Nearest Neighbors
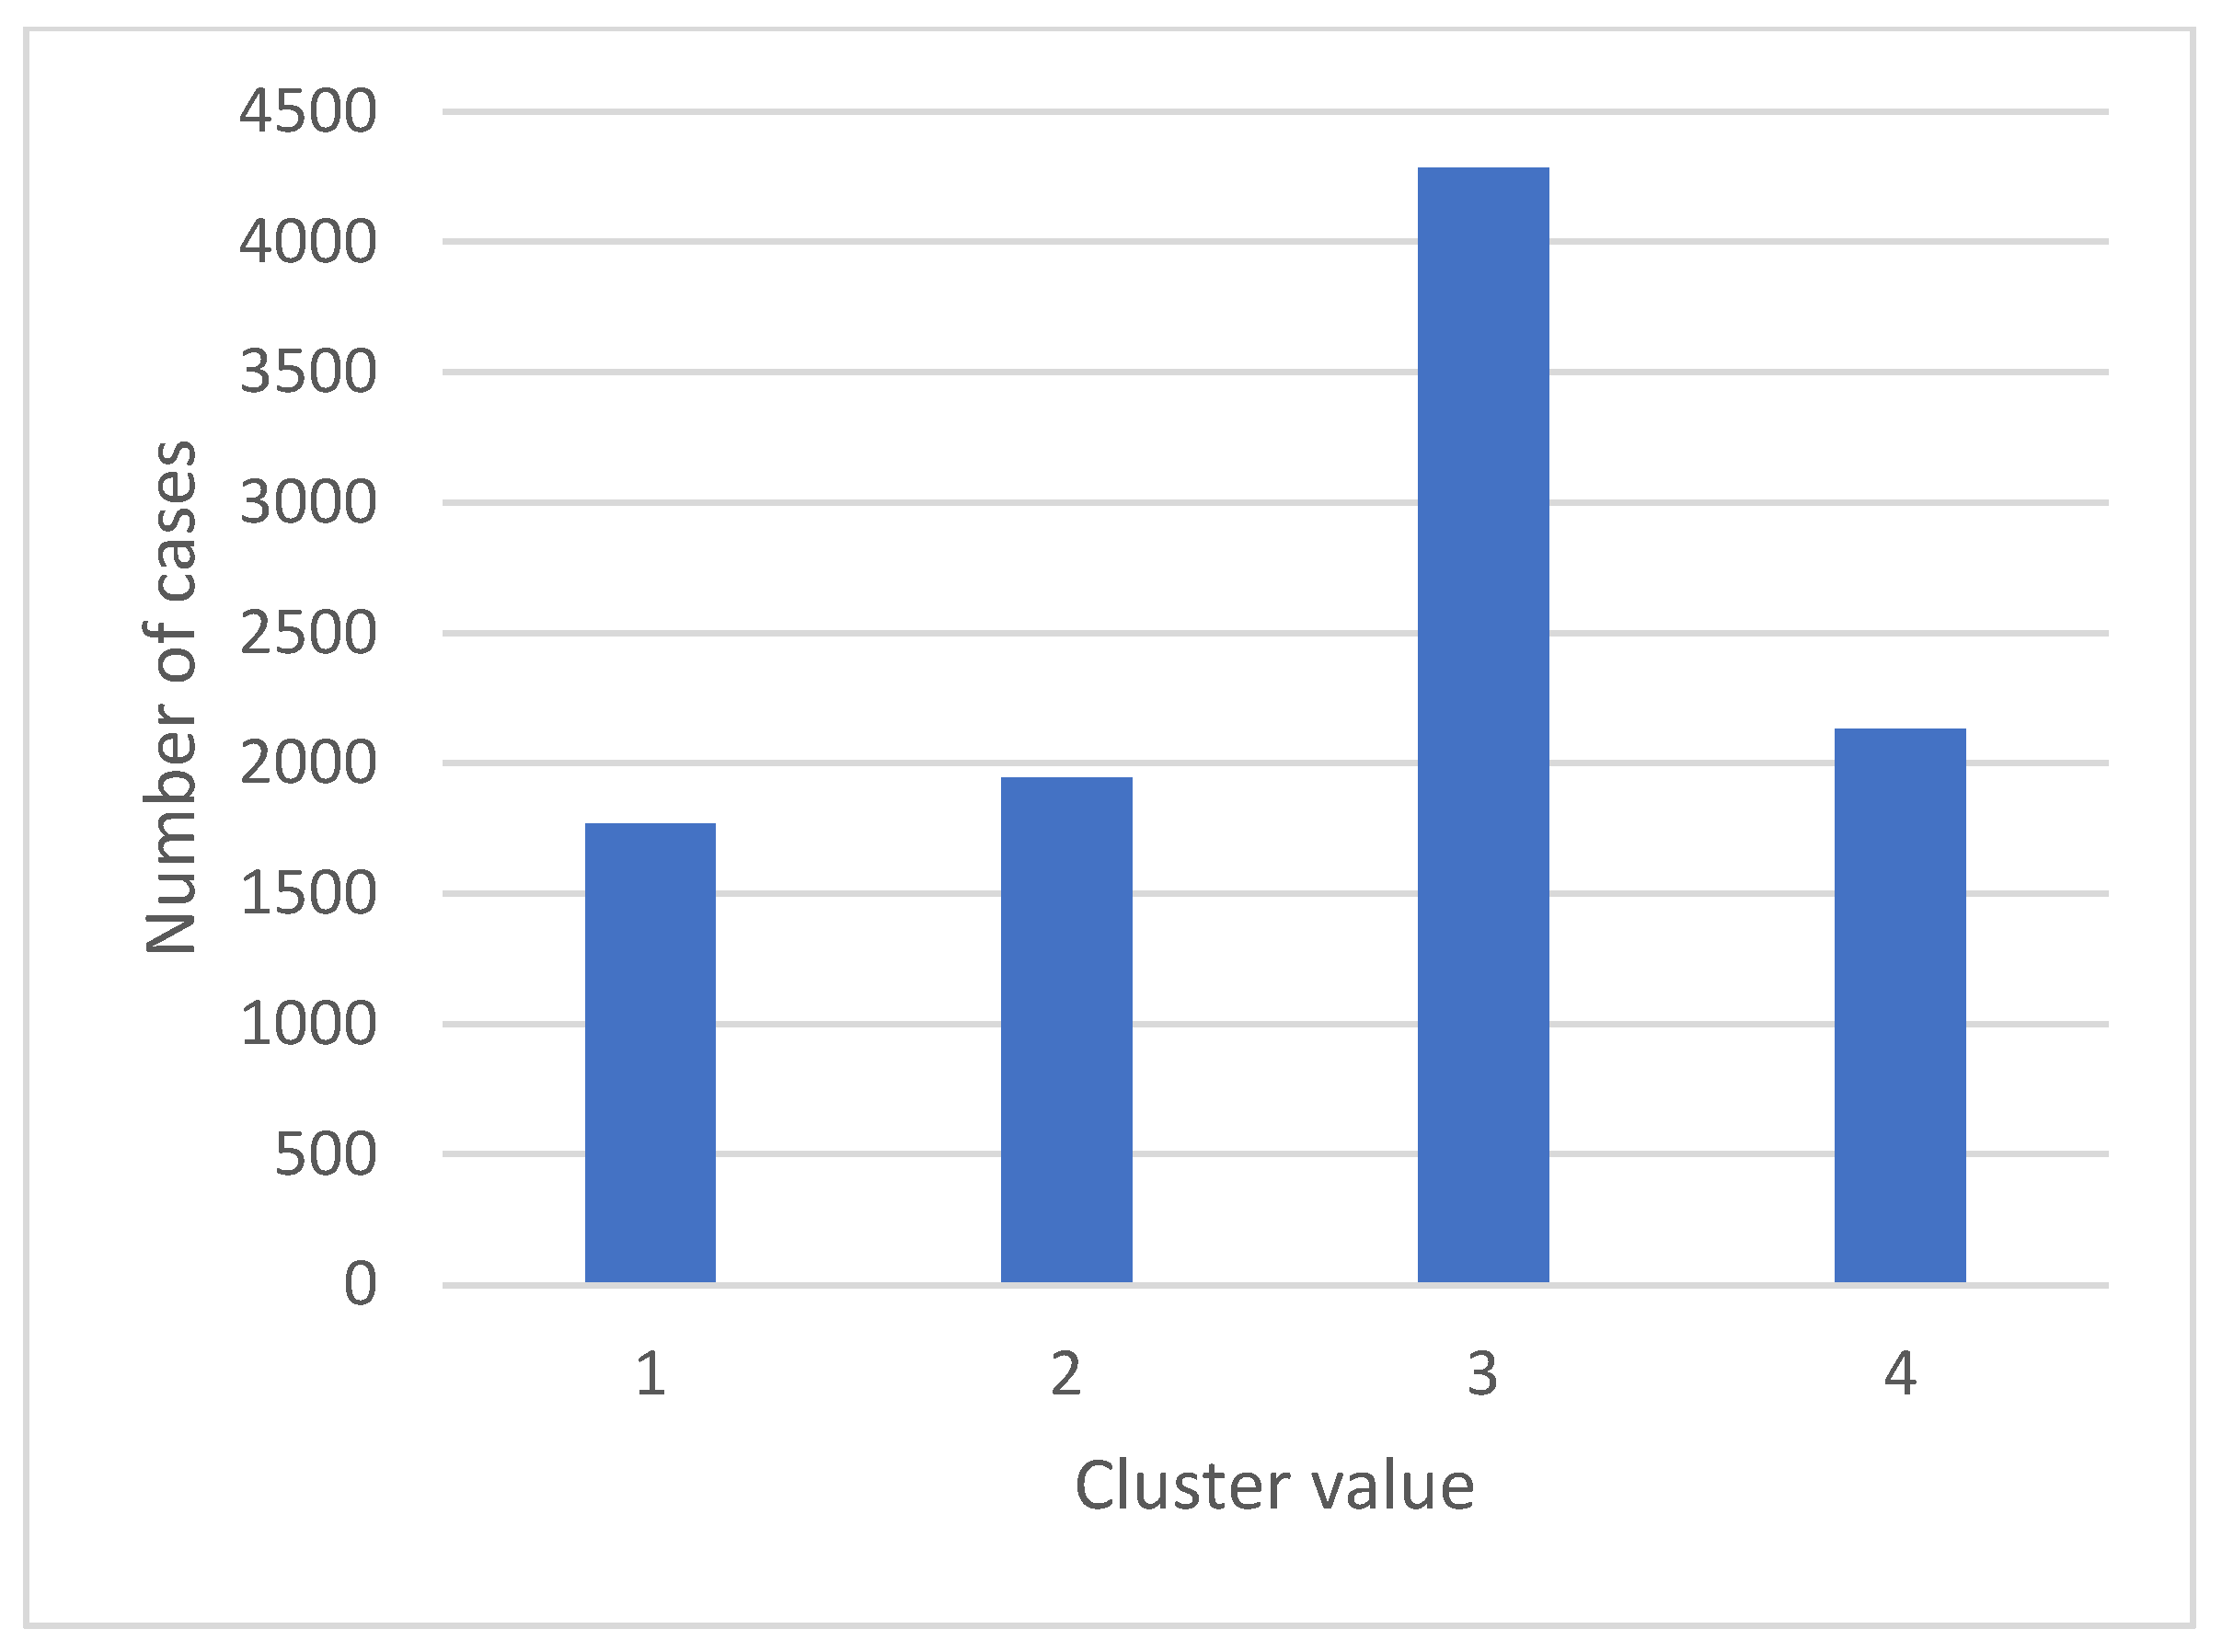
As discussed in the methodology section, the independent variables were divided into continuous and categorical variables. The categorical variables included gender, education level, marital status, income category, and product variable. The rest of the independent variables were continuous. The categorical variables were forwarded to the two-step clustering model to merge the variables into one categorical variable that described all the categorical variables in the dataset. The results showed that the two-step clustering approach can create four categories for the input variables, as shown in Figure 3. The generated clusters are used with the k-nearest neighbor model to ensure that the developed model is similar to the real environment; here, k is the number of clusters generated using two-step clustering, as shown in the study methodology. The predicted values were used in the three datasets to validate the capability of the k-nearest neighbor model in predicting cluster values using the categorical variables. The accuracy results of the training, testing, and validating datasets were 0.93, 0.94, and 0.95, respectively. The results from the k-nearest neighbors approach indicated that the model is capable of predicting the generated cluster value using the categorical value.
The predicted values were forwarded with all the continuous values to one of the five machine learning models to develop a prediction model, as shown in Table 3.
The results from Model 2 show that the accuracy and FOR variables for all models were more than 0.9. The precision, recall, and F1 score variables were between 0.70 and 0.97 for the training, testing, and validation datasets. The training dataset showed that the C5 tree achieved the highest performance, where the accuracy, precision, recall, FOR, and F1 score were 0.963, 0.911, 0.851, 0.972, and 0.880, respectively. To improve the performance of the prediction model, a validation dataset was used. The validation results showed that the C5 tree and CR-Tree models improved the performance of the prediction models, while the rest of the prediction models did not. Moreover, to validate the performance of the future data, a testing dataset was used. The results showed that the C5 tree model had the highest performance compared with the other models. The test results of the C5 model were 0.967, 0.919, 0.891, 0.977, and 0.905 for accuracy, precision, recall, FOR, and F1 score, respectively. Finally, Model 2 showed that the C5 tree approach was more robust in creating a prediction model for churn customers.
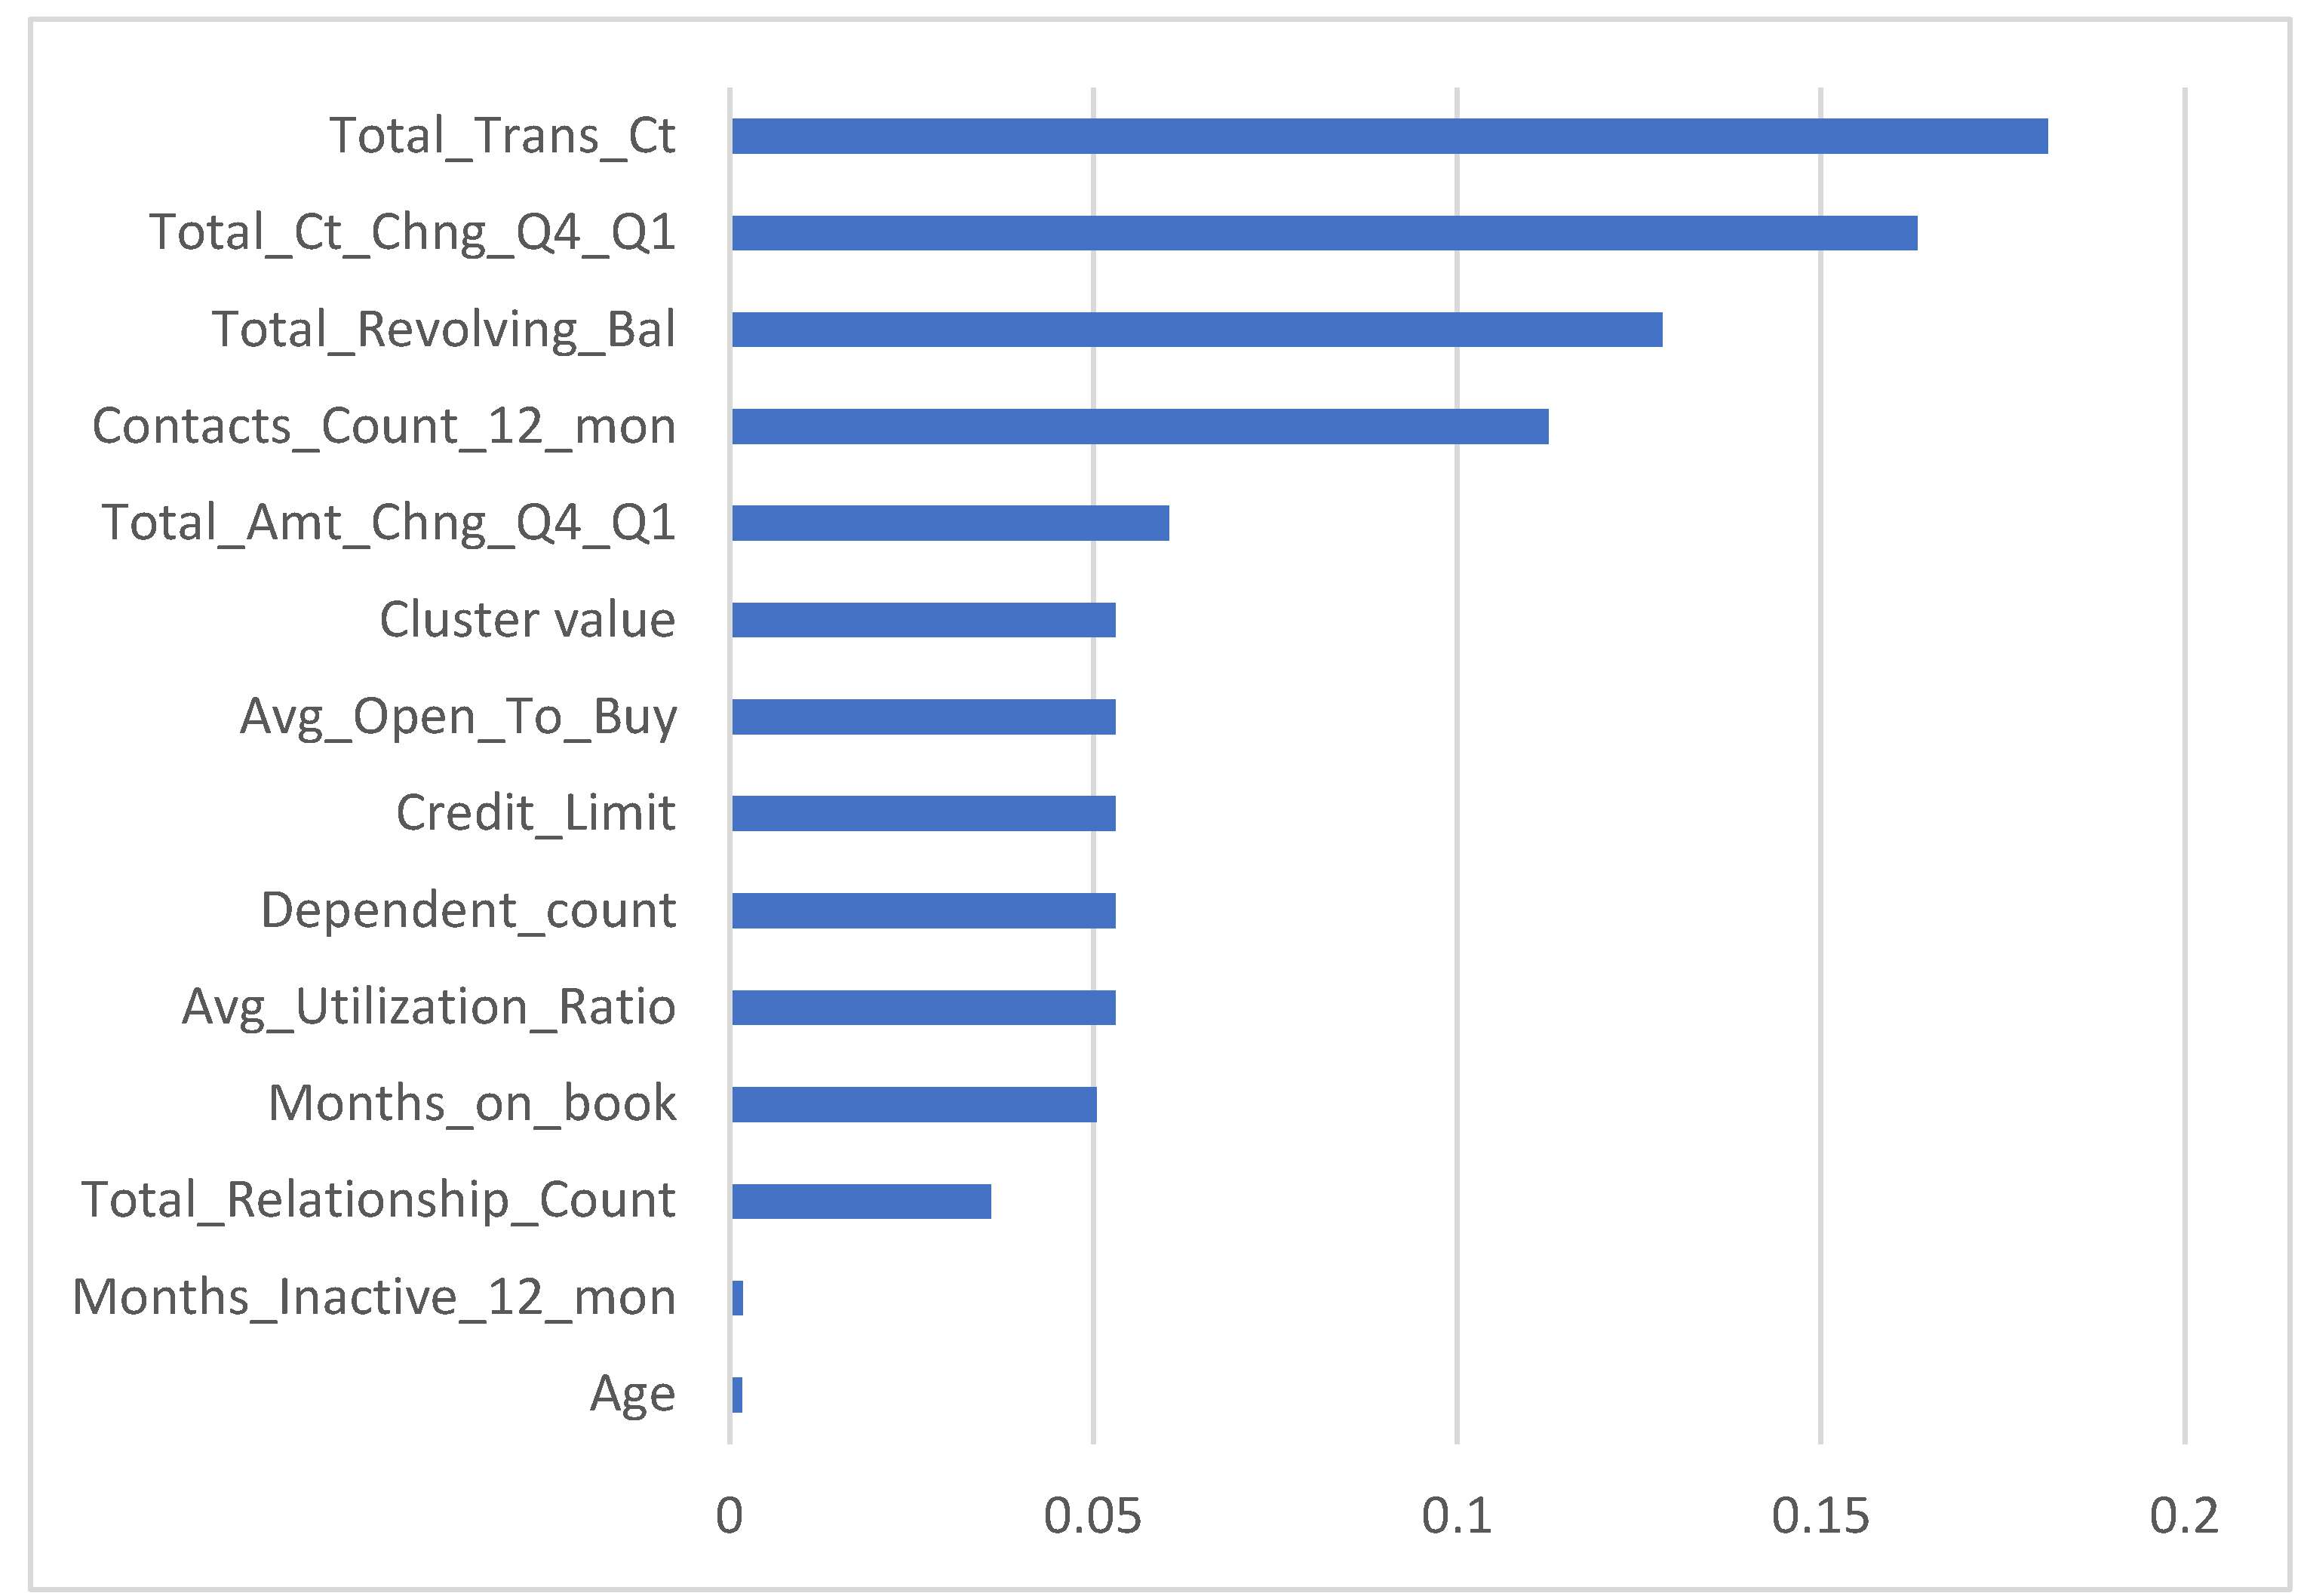
To merge the collected results and the studied variables, the importance of each variable applied in the C5 tree model is shown in Figure 4. The results revealed that the top three variables in building the C5 tree prediction model were total transaction count, total revolving balance on the credit card, and change in transaction count; here, age- and month-inactive variables were very weak variables in building a C5 tree prediction model. In addition, the new cluster value generated in Model 2 was found to be among the top six most important variables in developing the customer churn prediction model.
3.3. Model 3: Developed Churn Customers Based on Feature-Selection Model
Model 3 used a feature-selection model to select the most important variable(s) for the customers churn prediction (i.e., dependent variable). The output of the feature-selection model was divided into important, marginal, and unimportant, with cutoff percentages greater than 0.95, 0.90, and 0, respectively, as shown in Table 4. The feature-selection model used a Person model for the categorical variable.
The results showed that Total_Trans_Ct, Total_Ct_Chng_Q4_Q1, Total_Revolving_Bal, Contacts_Count_12_mon, Avg_Utilization_Ratio, Total_Trans_Amt, Total_Relationship_Count, Months_Inactive_12_mon, and Total_Amt_Chng_Q4_Q1 are the important variables to be used in building Model 3. The rest of the variables were omitted, as they were either marginal or unimportant. The important variables were forwarded to five machine learning models to develop the customer churn prediction model.
The results of Model 3 showed that all five models predicted the churned customers with different accuracy values, ranging between 0.9 and 0.99 for all the collected datasets, as shown in Table 5. The training dataset shows that the C5 tree model was the most accurate model in building a prediction model for customer churn. The training results were 0.976, 0.921, 0.928, 0.986, and 0.924 for accuracy, precision, recall, FOR, and F1 score, respectively. To improve the performance of prediction models, a validation dataset was applied. The validation results showed that the trained models were not optimized, indicating that the validation dataset was not able to improve the performance of the trained models. To check the predictability of the machine learning model, the testing dataset was used. The test results showed that all five models could accurately predict the churn customers with different performance metrics. The best results were supported by applying the C5 tree prediction model, where the accuracy, precision, recall, FOR, and F1 score results were 0.940, 0.813, 0.861, 0.970, and 0.836, respectively.
To investigate the optimal variables used in the C5 tree customers churn prediction model, Figure 5 is used to explain the importance of each variable applied in the C5 tree model. The results showed that total transaction count, the total revolving balance on the credit card, and the change in the transaction count are the most important variables for predicting churn customers; the total transaction amount is not considered in the customer churn prediction model.
3.4. Discussion and Analysis
Three models were adopted to develop a machine learning model that can be used to predict churn customers. The models were built after considering the independent variables selection method. To select the variables, three models were considered: all variables selection (Model 1), two-step clustering and k-nearest neighbor selection (Model 2), and a feature-selection algorithm (Model 3). The results revealed that all the applied machine learning models were capable of predicting the churn customers with different efficiency values. In all the developed models (Models 1–3), the C5 tree prediction model showed the highest performance in customer churn prediction, with the best performance derived by Model 2. The accuracy, precision, recall, FOR, and F1 score using the training dataset were 0.967, 0.919, 0.891, 0.977, and 0.905, respectively. These results indicated that the C5 tree model is highly capable of predicting the churn customers, with fewer variables than Model 1 and extra analysis compared with Model 3. The results showed that the top three variables for all the developed models in building the C5 tree model were the total transaction count, the total revolving balance on the credit card, and the change in the transaction count. In addition, the results showed that the total transaction amount was not important in developing a prediction model.
However, achieving the highest performance is not always the goal; thus, researchers can obtain good performance with a less complex model by using a feature-selection model with the given dataset. Accordingly, they can reduce the number of independent variables that are forwarded to the machine learning models. In addition, using all the variables with the C5 tree model can guarantee good performance with more processing time to predict the churn customers. Overall, the results indicated that the machine learning models have a high capability to adapt to different numbers of input variables in predicting the churn customers. In addition, the C5 tree model showed a higher capability of predicting the churn customers. Finally, determining the appropriate number of independent variables is a very important step in developing and building a machine learning model.
All models can be used to predict credit card customer churn in banking systems. Model 1 requires that all independent variables are used to predict the churn cases. Model 2 requires all continuous variables and one combined categorical variable to predict the churn cases. Model 3 uses only variables with high importance in predicting the churn cases. The models clearly indicate the desired direction which an expert should take to retain the bank’s clients. Experts and scholars in the field can use all the models to predict churn customers, and Model 1 can be used if nonexperts use the model, given that all variables will be included in the model. Models 2 and 3 can be used by experts in the field because of the additional analyses required in developing prediction models for customer churn.
4. Conclusions
This paper aimed to investigate the capability of machine learning to predict the credit card customer churn rate in the banking sector. The collected dataset contains two types of data: categorical and continuous variables. These data describe 10,127 customers in the bank; 1627 of these customers were churn customers. To develop different credit card customer churn prediction models, the independent variables were changed to different forms. To change the number of independent variables, three models were proposed. The models were named Model 1 (all variables—categorical and continuous variables), Model 2 (two-step clustering and k-nearest neighbors), and Model 3 (feature-selection model). In addition, five machine learning models were suggested: Bayesian network, C5 tree, CHAID, CR-Tree, and a neural network. Then, the original dataset was divided into three datasets: training, testing, and validation, comprising 70%, 15%, and 15% of the original dataset, respectively. The three models were used with five machine learning models and the results showed that the machine learning models were capable of predicting the credit card customer churn. The results supported that, for Models 1–3, the C5 tree model outperformed all other machine learning models. The results revealed that the total transaction count, the total revolving balance on the credit card, and the change in the transaction count are the top three important variables to develop any churn customer prediction model. In addition, it is not necessary to use all the categorical variables (such as gender, education level, marital status, income category, and product variable) in developing a churn customer prediction model. On the other hand, adding a single categorical variable describing all the categorical variables in the dataset can improve the performance of the churn customer prediction model. The results also revealed that, to improve the churn customer prediction model, the selection of independent variables is an important step. This step can be implemented using one of the feature-selection models, or a combination of several variables. The credit card customer churning rate is the percentage of a bank’s customers who try to leave the service. Building an early-prediction model to predict the status of a bank’s customers may help them to avoid losing their customers.
In summary, the results indicated that clustering with KNN and the C5 tree model outperformed previous models in various performance metrics, including R2, precision, and recall. Clustering the independent variables can improve the prediction performance in various sciences [39,40,41,42], and the number of transactions is dominant in identifying churn customers. The results proved that C5 tree models can outperform other functional models [16,41,42].
In future work, analyses to further understand the optimal independent variables are required to develop a more robust, more accurate, faster, less complicated, and more efficient churn prediction model. Such a study will cover more datasets with extra variables to extract the most important variables; in addition, new machine learning models will be executed to determine which is the optimal model. The use of the conventional machine learning model will not always guarantee the best results for a given dataset. Therefore, the accuracy and efficiency of prediction models should be improved in the future.
Author Contributions
Formal analysis, H.A.-N.; investigation, D.A.-N., N.A.-R. and H.A.-N.; methodology, D.A.-N., N.A.-R. and H.A.-N.; writing—original draft preparation, D.A.-N., N.A.-R. and H.A.-N.; writing—review and editing, D.A.-N., N.A.-R. and H.A.-N. All authors have read and agreed to the published version of the manuscript.
Funding
This research received no external funding.
Data Availability Statement
Publicly available datasets were analyzed in this study. These data can be found here: [from https://leaps.analyttica.com (accessed on 10 September 2021)].
Conflicts of Interest
The authors declare no conflict of interest.
References
- Jagadeesan, A.P. Bank customer retention prediction and customer ranking based on deep neural networks. Int. J. Sci. Dev. Res. 2020, 5, 444–449. [Google Scholar]
- Amuda, K.A.; Adeyemo, A.B. Customers churn prediction in financial institution using artificial neural network. arXiv 2019, arXiv:1912.11346. [Google Scholar]
- Kim, S.; Shin, K.-S.; Park, K. An application of support vector machines for customer churn analysis: Credit card case. In Proceedings of the International Conference on Natural Computation, Changsha, China, 27–29 August 2005; Springer: Berlin/Heidelberg, Germany; pp. 636–647. [Google Scholar]
- Kumar, D.A.; Ravi, V. Predicting credit card customer churn in banks using data mining. Int. J. Data Anal. Tech. Strateg. 2008, 1, 4–28. [Google Scholar] [CrossRef]
- Keramati, A.; Ghaneei, H.; Mirmohammadi, S.M. Developing a prediction model for customer churn from electronic banking services using data mining. Financ. Innov. 2016, 2, 10. [Google Scholar] [CrossRef] [Green Version]
- Bastan, M.; Akbarpour, S.; Ahmadvand, A. Business dynamics of iranian commercial banks. In Proceedings of the 34th International Conference of the System Dynamics Society, Delft, The Netherlands, 17–21 July 2016. [Google Scholar]
- Bastan, M.; Bagheri Mazrae, M.; Ahmadvand, A. Dynamics of banking soundness based on CAMELS Rating system. In Proceedings of the 34th International Conference of the System Dynamics Society, Delft, The Netherlands, 17–21 July 2016. [Google Scholar]
- Iranmanesh, S.H.; Hamid, M.; Bastan, M.; Hamed Shakouri, G.; Nasiri, M.M. Customer churn prediction using artificial neural network: An analytical CRM application. In Proceedings of the International Conference on Industrial Engineering and Operations Management, Bangkok, Thailand, 5–7 March 2019; pp. 23–26. [Google Scholar]
- Domingos, E.; Ojeme, B.; Daramola, O. Experimental analysis of hyperparameters for deep learning-based churn prediction in the banking sector. Computation 2021, 9, 34. [Google Scholar] [CrossRef]
- Chen, S.C.; Huang, M.Y. Constructing credit auditing and control & management model with data mining technique. Expert Syst. Appl. 2011, 38, 5359–5365. [Google Scholar]
- Hadden, J.; Tiwari, A.; Roy, R.; Ruta, D. Computer assisted customer churn management: State-of-the-art and future trends. Comput. Oper. Res. 2007, 34, 2902–2917. [Google Scholar] [CrossRef]
- Risselada, H.; Verhoef, P.C.; Bijmolt, T.H. Staying power of churn prediction models. J. Interact. Mark. 2010, 24, 198–208. [Google Scholar] [CrossRef]
- Kim, H.S.; Yoon, C.H. Determinants of subscriber churn and customer loyalty in the Korean mobile telephony market. Telecommun. Policy 2004, 28, 751–765. [Google Scholar] [CrossRef]
- Xia, G.; He, Q. The research of online shopping customer churn prediction based on integrated learning. In Proceedings of the 2018 International Conference on Mechanical, Electronic, Control and Automation Engineering (MECAE 2018), Qingdao, China, 30–31 March 2018; pp. 30–31. [Google Scholar]
- Olaniyi, A.S.; Olaolu, A.M.; Jimada-Ojuolape, B.; Kayode, S.Y. Customer churn prediction in banking industry using K-means and support vector machine algorithms. Int. J. Multidiscip. Sci. Adv. Technol. 2020, 1, 48–54. [Google Scholar]
- Nie, G.; Rowe, W.; Zhang, L.; Tian, Y.; Shi, Y. Credit card churn forecasting by logistic regression and decision tree. Expert Syst. Appl. 2011, 38, 15273–15285. [Google Scholar] [CrossRef]
- Seng, J.L.; Chen, T.C. An analytic approach to select data mining for business decision. Expert Syst. Appl. 2010, 37, 8042–8057. [Google Scholar] [CrossRef]
- Tsai, C.F.; Lu, Y.H. Customer churn prediction by hybrid neural networks. Expert Syst. Appl. 2009, 36, 12547–12553. [Google Scholar] [CrossRef]
- Rahman, M.; Kumar, V. Machine learning based customer churn prediction in banking. In Proceedings of the 2020 4th International Conference on Electronics, Communication and Aerospace Technology (ICECA), Coimbatore, India, 5–7 November 2020; IEEE: Piscataway, NJ, USA; pp. 1196–1201. [Google Scholar]
- Khodabandehlou, S.; Rahman, M.Z. Comparison of supervised machine learning techniques for customer churn prediction based on analysis of customer behaviour. J. Syst. Inf. Technol. 2017, 19, 65–93. [Google Scholar] [CrossRef]
- Miguéis, V.L.; Van den Poel, D.; Camanho, A.S.; e Cunha, J.F. Modeling partial customer churn: On the value of first product-category purchase sequences. Expert Syst. Appl. 2012, 39, 11250–11256. [Google Scholar] [CrossRef]
- Kolajo, T.; Adeyemo, A.B. Data Mining technique for predicting telecommunications industry customer churn using both descriptive and predictive algorithms. Comput. Inf. Syst. Dev. Inform. J. 2012, 3, 27–34. [Google Scholar]
- Kaya, E.; Dong, X.; Suhara, Y.; Balcisoy, S.; Bozkaya, B. Behavioral attributes and financial churn prediction. EPJ Data Sci. 2018, 7, 41. [Google Scholar] [CrossRef] [Green Version]
- Miao, X.; Wang, H. Customer churn prediction on credit card services using random forest method. In Proceedings of the 2022 7th International Conference on Financial Innovation and Economic Development (ICFIED 2022), Online, 14–16 January 2022; Atlantis Press: Paris, France; pp. 649–656. [Google Scholar]
- de Lima Lemos, R.A.; Silva, T.C.; Tabak, B.M. Propension to customer churn in a financial institution: A machine learning approach. Neural Comput. Appl. 2022, 4, 11751–11768. [Google Scholar] [CrossRef]
- Bharathi, S.V.; Pramod, D.; Raman, R. An ensemble model for predicting retail banking churn in the youth segment of customers. Data 2022, 7, 61. [Google Scholar] [CrossRef]
- Saias, J.; Rato, L.; Gonçalves, T. An approach to churn prediction for cloud services recommendation and user retention. Information 2022, 13, 227. [Google Scholar] [CrossRef]
- Thakkar, H.K.; Desai, A.; Ghosh, S.; Singh, P.; Sharma, G. Clairvoyant: AdaBoost with cost-enabled cost-sensitive classifier for customer churn prediction. Comput. Intell. Neurosci. 2022, 2022, 9028580. [Google Scholar] [CrossRef] [PubMed]
- Xiahou, X.; Harada, Y. Customer churn prediction using AdaBoost classifier and BP neural network techniques in the E-commerce industry. Am. J. Ind. Bus. Manag. 2022, 12, 277–293. [Google Scholar] [CrossRef]
- Nie, G.; Wang, G.; Zhang, P.; Tian, Y.; Shi, Y. Finding the hidden pattern of credit card holder’s churn: A case of china. In Proceedings of the International Conference on Computational Science, Vancouver, BC, Canada, 29–31 August 2009; Springer: Berlin/Heidelberg, Germany; pp. 561–569. [Google Scholar]
- Kulatilleke, G.K. Challenges and complexities in machine learning based credit card fraud detection. arXiv 2022, arXiv:2208.10943. [Google Scholar]
- Alfaiz, N.S.; Fati, S.M. Enhanced credit card fraud detection model using machine learning. Electronics 2022, 11, 662. [Google Scholar] [CrossRef]
- Jovanovic, D.; Antonijevic, M.; Stankovic, M.; Zivkovic, M.; Tanaskovic, M.; Bacanin, N. Tuning machine learning models using a group search firefly algorithm for credit card fraud detection. Mathematics 2022, 10, 2272. [Google Scholar] [CrossRef]
- Al-Najjar, D.; Assous, H.F.; Al-Najjar, H.; Al-Rousan, N. Ramadan effect and indices movement estimation: A case study from eight Arab countries. J. Islam. Mark. 2022. ahead-of-print. [Google Scholar] [CrossRef]
- Al-Najjar, D.; Al-Najjar, H.; Al-Rousan, N. Evaluation of the prediction of COVID-19 recovered and unrecovered cases using symptoms and patient’s meta data based on support vector machine, neural network, CHAID and QUEST Models. Eur. Rev. Med. Pharmacol. Sci. 2021, 25, 5556–5560. [Google Scholar]
- Al-Rousan, N.; Al-Najjar, H.; Alomari, O. Assessment of predicting hourly global solar radiation in Jordan based on Rules, Trees, Meta, Lazy and Function prediction methods. Sustain. Energy Technol. Assess. 2021, 44, 100923. [Google Scholar] [CrossRef]
- Al-Najjar, D.; Al-Najjar, H.; Al-Rousan, N.; Assous, H.F. Developing Machine Learning Techniques to Investigate the Impact of Air Quality Indices on Tadawul Exchange Index. Complexity 2022, 2022, 1–12. [Google Scholar] [CrossRef]
- Al-Najjar, H.; Al-Rousan, N. A classifier prediction model to predict the status of Coronavirus COVID-19 patients in South Korea. Eur. Rev. Med. Pharmacol. Sci. 2020, 24, 3400–3403. [Google Scholar]
- Rajamohamed, R.; Manokaran, J. Improved credit card churn prediction based on rough clustering and supervised learning techniques. Clust. Comput. 2018, 21, 65–77. [Google Scholar] [CrossRef]
- AL-Rousan, N.; Mat Isa, N.A.; Mat Desa, M.K.; AL-Najjar, H. Integration of logistic regression and multilayer perceptron for intelligent single and dual axis solar tracking systems. Int. J. Intell. Syst. 2021, 36, 5605–5669. [Google Scholar] [CrossRef]
- Al-Najjar, H.; Alhady, S.S.N.; Saleh, J.M. Improving a run time job prediction model for distributed computing based on two level predictions. In Proceedings of the 10th International Conference on Robotics, Vision, Signal Processing and Power Applications, Pulau Pinang, Malaysia, 14–15 August 2018; Springer: Singapore; pp. 35–41. [Google Scholar]
- Al-Najjar, H.; Alhady, S.S.N.; Mohamad-Saleh, J.; Al-Rousan, N. Scheduling of workflow jobs based on twostep clustering and lowest job weight. Concurr. Comput. Pract. Exp. 2021, 33, e6336. [Google Scholar] [CrossRef]
Figure 1.
The proposed Model 2 based on k-nearest neighbors and two-step clustering.
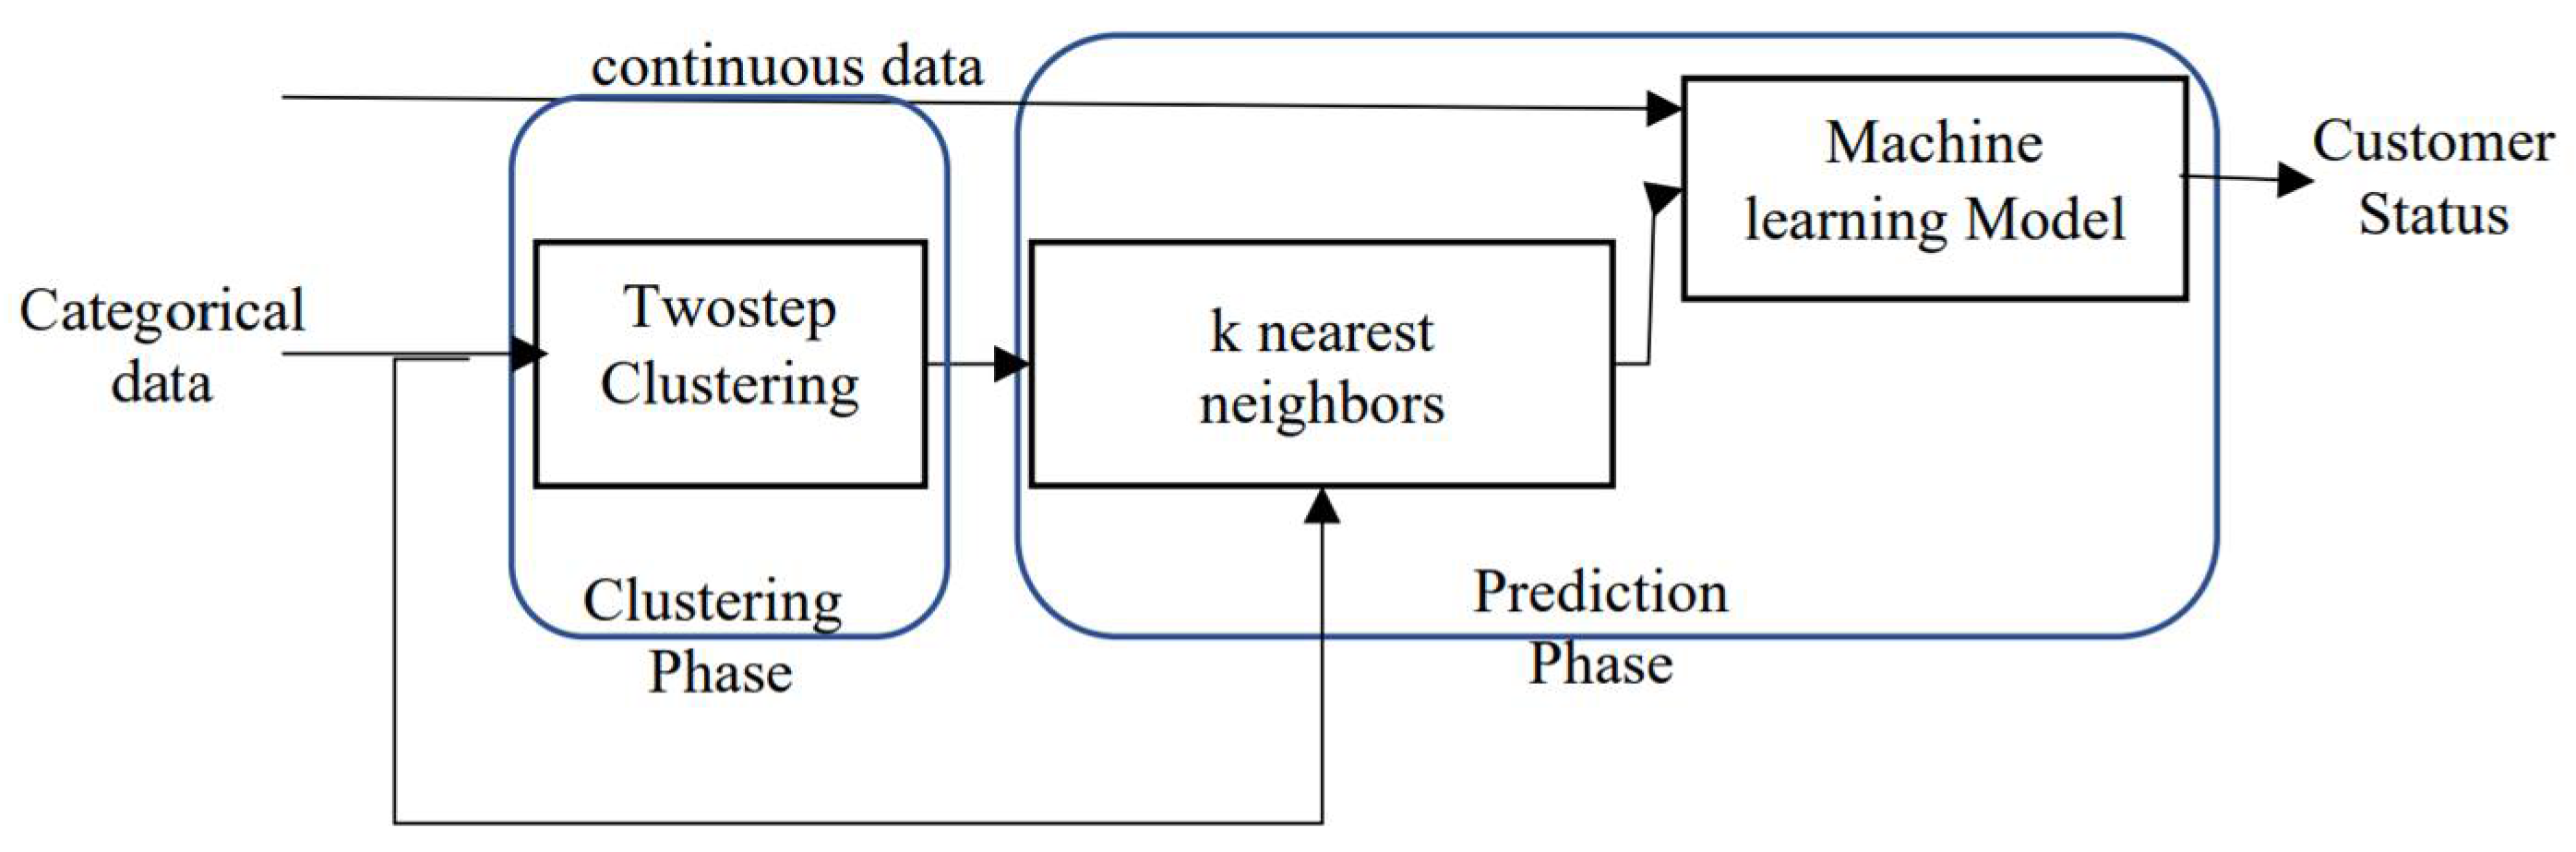
Figure 2.
The importance of variables for Model 1 after applying C5 tree model.

Figure 3.
Number of clusters after using two-step clustering.

Figure 4.
The importance of the variables for Model 2 after applying C5 tree model.

Figure 5.
The importance of variables for Model 3 after applying C5 tree customer churn model.

Table 1.
Summary of the developed models.
| Model | Variables |
|---|---|
| Model 1 | All variables |
| Model 2 | All continuous variables and cluster value |
| Model 3 | The selected variables after the feature-selection method |
Table 2.
The developed models based on all variables.
| Dataset | Models | Accuracy | Precision | Recall | FOR | F1 Score |
|---|---|---|---|---|---|---|
| Train | Bayesian Network | 0.935 | 0.831 | 0.740 | 0.952 | 0.783 |
| Train | C5-Tree | 0.966 | 0.918 | 0.860 | 0.974 | 0.888 |
| Train | CHAID | 0.906 | 0.776 | 0.569 | 0.923 | 0.656 |
| Train | CR-Tree | 0.924 | 0.750 | 0.785 | 0.959 | 0.767 |
| Train | Neural Network | 0.913 | 0.806 | 0.595 | 0.927 | 0.684 |
| Test | Bayesian Network | 0.941 | 0.865 | 0.790 | 0.955 | 0.826 |
| Test | C5-Tree | 0.964 | 0.914 | 0.880 | 0.974 | 0.897 |
| Test | CHAID | 0.910 | 0.824 | 0.629 | 0.924 | 0.713 |
| Test | CR-Tree | 0.929 | 0.773 | 0.854 | 0.968 | 0.811 |
| Test | Neural Network | 0.919 | 0.854 | 0.655 | 0.929 | 0.742 |
| Validate | Bayesian Network | 0.935 | 0.826 | 0.728 | 0.952 | 0.774 |
| Validate | C5-Tree | 0.975 | 0.961 | 0.873 | 0.977 | 0.915 |
| Validate | CHAID | 0.913 | 0.758 | 0.632 | 0.935 | 0.689 |
| Validate | CR-Tree | 0.930 | 0.750 | 0.816 | 0.966 | 0.782 |
| Validate | Neural Network | 0.905 | 0.784 | 0.526 | 0.919 | 0.630 |
Table 3.
Two-step clustering and k-nearest neighbors for the developed model.
| Dataset | Models | Accuracy | Precision | Recall | FOR | F1 Score |
|---|---|---|---|---|---|---|
| Train | Bayesian Network | 0.931 | 0.817 | 0.726 | 0.949 | 0.769 |
| Train | C5 Tree | 0.963 | 0.911 | 0.851 | 0.972 | 0.880 |
| Train | CHAID | 0.906 | 0.776 | 0.569 | 0.923 | 0.656 |
| Train | CR-Tree | 0.924 | 0.750 | 0.785 | 0.959 | 0.767 |
| Train | Neural Network | 0.932 | 0.838 | 0.708 | 0.946 | 0.767 |
| Test | Bayesian Network | 0.941 | 0.868 | 0.787 | 0.955 | 0.825 |
| Test | C5 Tree | 0.967 | 0.919 | 0.891 | 0.977 | 0.905 |
| Test | CHAID | 0.910 | 0.824 | 0.629 | 0.924 | 0.713 |
| Test | CR-Tree | 0.929 | 0.773 | 0.854 | 0.968 | 0.811 |
| Test | Neural Network | 0.936 | 0.849 | 0.779 | 0.953 | 0.813 |
| Validate | Bayesian Network | 0.929 | 0.812 | 0.702 | 0.947 | 0.753 |
| Validate | C5 Tree | 0.975 | 0.953 | 0.882 | 0.979 | 0.916 |
| Validate | CHAID | 0.913 | 0.758 | 0.632 | 0.935 | 0.689 |
| Validate | CR-Tree | 0.930 | 0.750 | 0.816 | 0.966 | 0.782 |
| Validate | Neural Network | 0.923 | 0.796 | 0.667 | 0.941 | 0.726 |
Table 4.
The output of the feature-selection method.
| Status | Rank | Field | Importance | Value | Importance |
|---|---|---|---|---|---|
| TRUE | 1 | Total_Trans_Ct | 0 | 1 | important |
| TRUE | 2 | Total_Ct_Chng_Q4_Q1 | 0 | 1 | important |
| TRUE | 3 | Total_Revolving_Bal | 0 | 1 | important |
| TRUE | 4 | Contacts_Count_12_mon | 0 | 1 | important |
| TRUE | 5 | Avg_Utilization_Ratio | 0 | 1 | important |
| TRUE | 6 | Total_Trans_Amt | 0 | 1 | important |
| TRUE | 7 | Total_Relationship_Count | 0 | 1 | important |
| TRUE | 8 | Months_Inactive_12_mon | 0 | 1 | important |
| TRUE | 9 | Total_Amt_Chng_Q4_Q1 | 0 | 1 | important |
| FALSE | 10 | Gender | 1 | 0.95 | Marginal |
| FALSE | 11 | Age | 1 | 0.93 | Marginal |
| FALSE | 12 | Dependent_count | 2 | 0.85 | Unimportant |
| FALSE | 13 | Income_Category | 2 | 0.83 | Unimportant |
| FALSE | 14 | Education_Level | 2 | 0.76 | Unimportant |
| FALSE | 15 | Avg_Open_To_Buy | 2 | 0.76 | Unimportant |
| FALSE | 16 | Months_on_book | 2 | 0.65 | Unimportant |
| FALSE | 17 | Credit_Limit | 2 | 0.52 | Unimportant |
| FALSE | 18 | Marital_Status | 2 | 0.26 | Unimportant |
| FALSE | - | Card_Category | Removed | ||
Table 5.
The developed customer churn model based on feature selection.
| Models | Accuracy | Precision | Recall | FOR | F1_Score | |
|---|---|---|---|---|---|---|
| Train | Bayesian Network | 0.929 | 0.823 | 0.701 | 0.945 | 0.757 |
| Train | C5 Tree | 0.976 | 0.921 | 0.928 | 0.986 | 0.924 |
| Train | CHAID | 0.905 | 0.779 | 0.559 | 0.921 | 0.651 |
| Train | CR-Tree | 0.929 | 0.785 | 0.763 | 0.956 | 0.774 |
| Train | Neural Network | 0.925 | 0.830 | 0.667 | 0.939 | 0.739 |
| Test | Bayesian Network | 0.930 | 0.855 | 0.730 | 0.943 | 0.788 |
| Test | C5 Tree | 0.940 | 0.813 | 0.861 | 0.970 | 0.836 |
| Test | CHAID | 0.905 | 0.838 | 0.581 | 0.915 | 0.686 |
| Test | CR-Tree | 0.937 | 0.816 | 0.831 | 0.963 | 0.824 |
| Test | Neural Network | 0.926 | 0.839 | 0.723 | 0.942 | 0.777 |
| Validate | Bayesian Network | 0.926 | 0.821 | 0.662 | 0.941 | 0.733 |
| Validate | C5 Tree | 0.944 | 0.814 | 0.825 | 0.968 | 0.819 |
| Validate | CHAID | 0.902 | 0.752 | 0.544 | 0.921 | 0.631 |
| Validate | CR-Tree | 0.927 | 0.763 | 0.763 | 0.957 | 0.763 |
| Validate | Neural Network | 0.917 | 0.813 | 0.592 | 0.930 | 0.685 |
Publisher’s Note: MDPI stays neutral with regard to jurisdictional claims in published maps and institutional affiliations. |
© 2022 by the authors. Licensee MDPI, Basel, Switzerland. This article is an open access article distributed under the terms and conditions of the Creative Commons Attribution (CC BY) license (https://creativecommons.org/licenses/by/4.0/).
Share and Cite
MDPI and ACS Style
AL-Najjar, D.; Al-Rousan, N.; AL-Najjar, H. Machine Learning to Develop Credit Card Customer Churn Prediction. J. Theor. Appl. Electron. Commer. Res. 2022, 17, 1529-1542. https://doi.org/10.3390/jtaer17040077
AMA Style
AL-Najjar D, Al-Rousan N, AL-Najjar H. Machine Learning to Develop Credit Card Customer Churn Prediction. Journal of Theoretical and Applied Electronic Commerce Research. 2022; 17(4):1529-1542. https://doi.org/10.3390/jtaer17040077
Chicago/Turabian StyleAL-Najjar, Dana, Nadia Al-Rousan, and Hazem AL-Najjar. 2022. "Machine Learning to Develop Credit Card Customer Churn Prediction" Journal of Theoretical and Applied Electronic Commerce Research 17, no. 4: 1529-1542. https://doi.org/10.3390/jtaer17040077