
Lattice Expansion and Crystallite Size Analyses of NiO-BaCe0.54Zr0.36Y0.1O3-δ Anode Composite for Proton Ceramic Fuel Cells Application


 , and
, and
Abstract

1. Introduction
2. Materials and Methods
3. Results
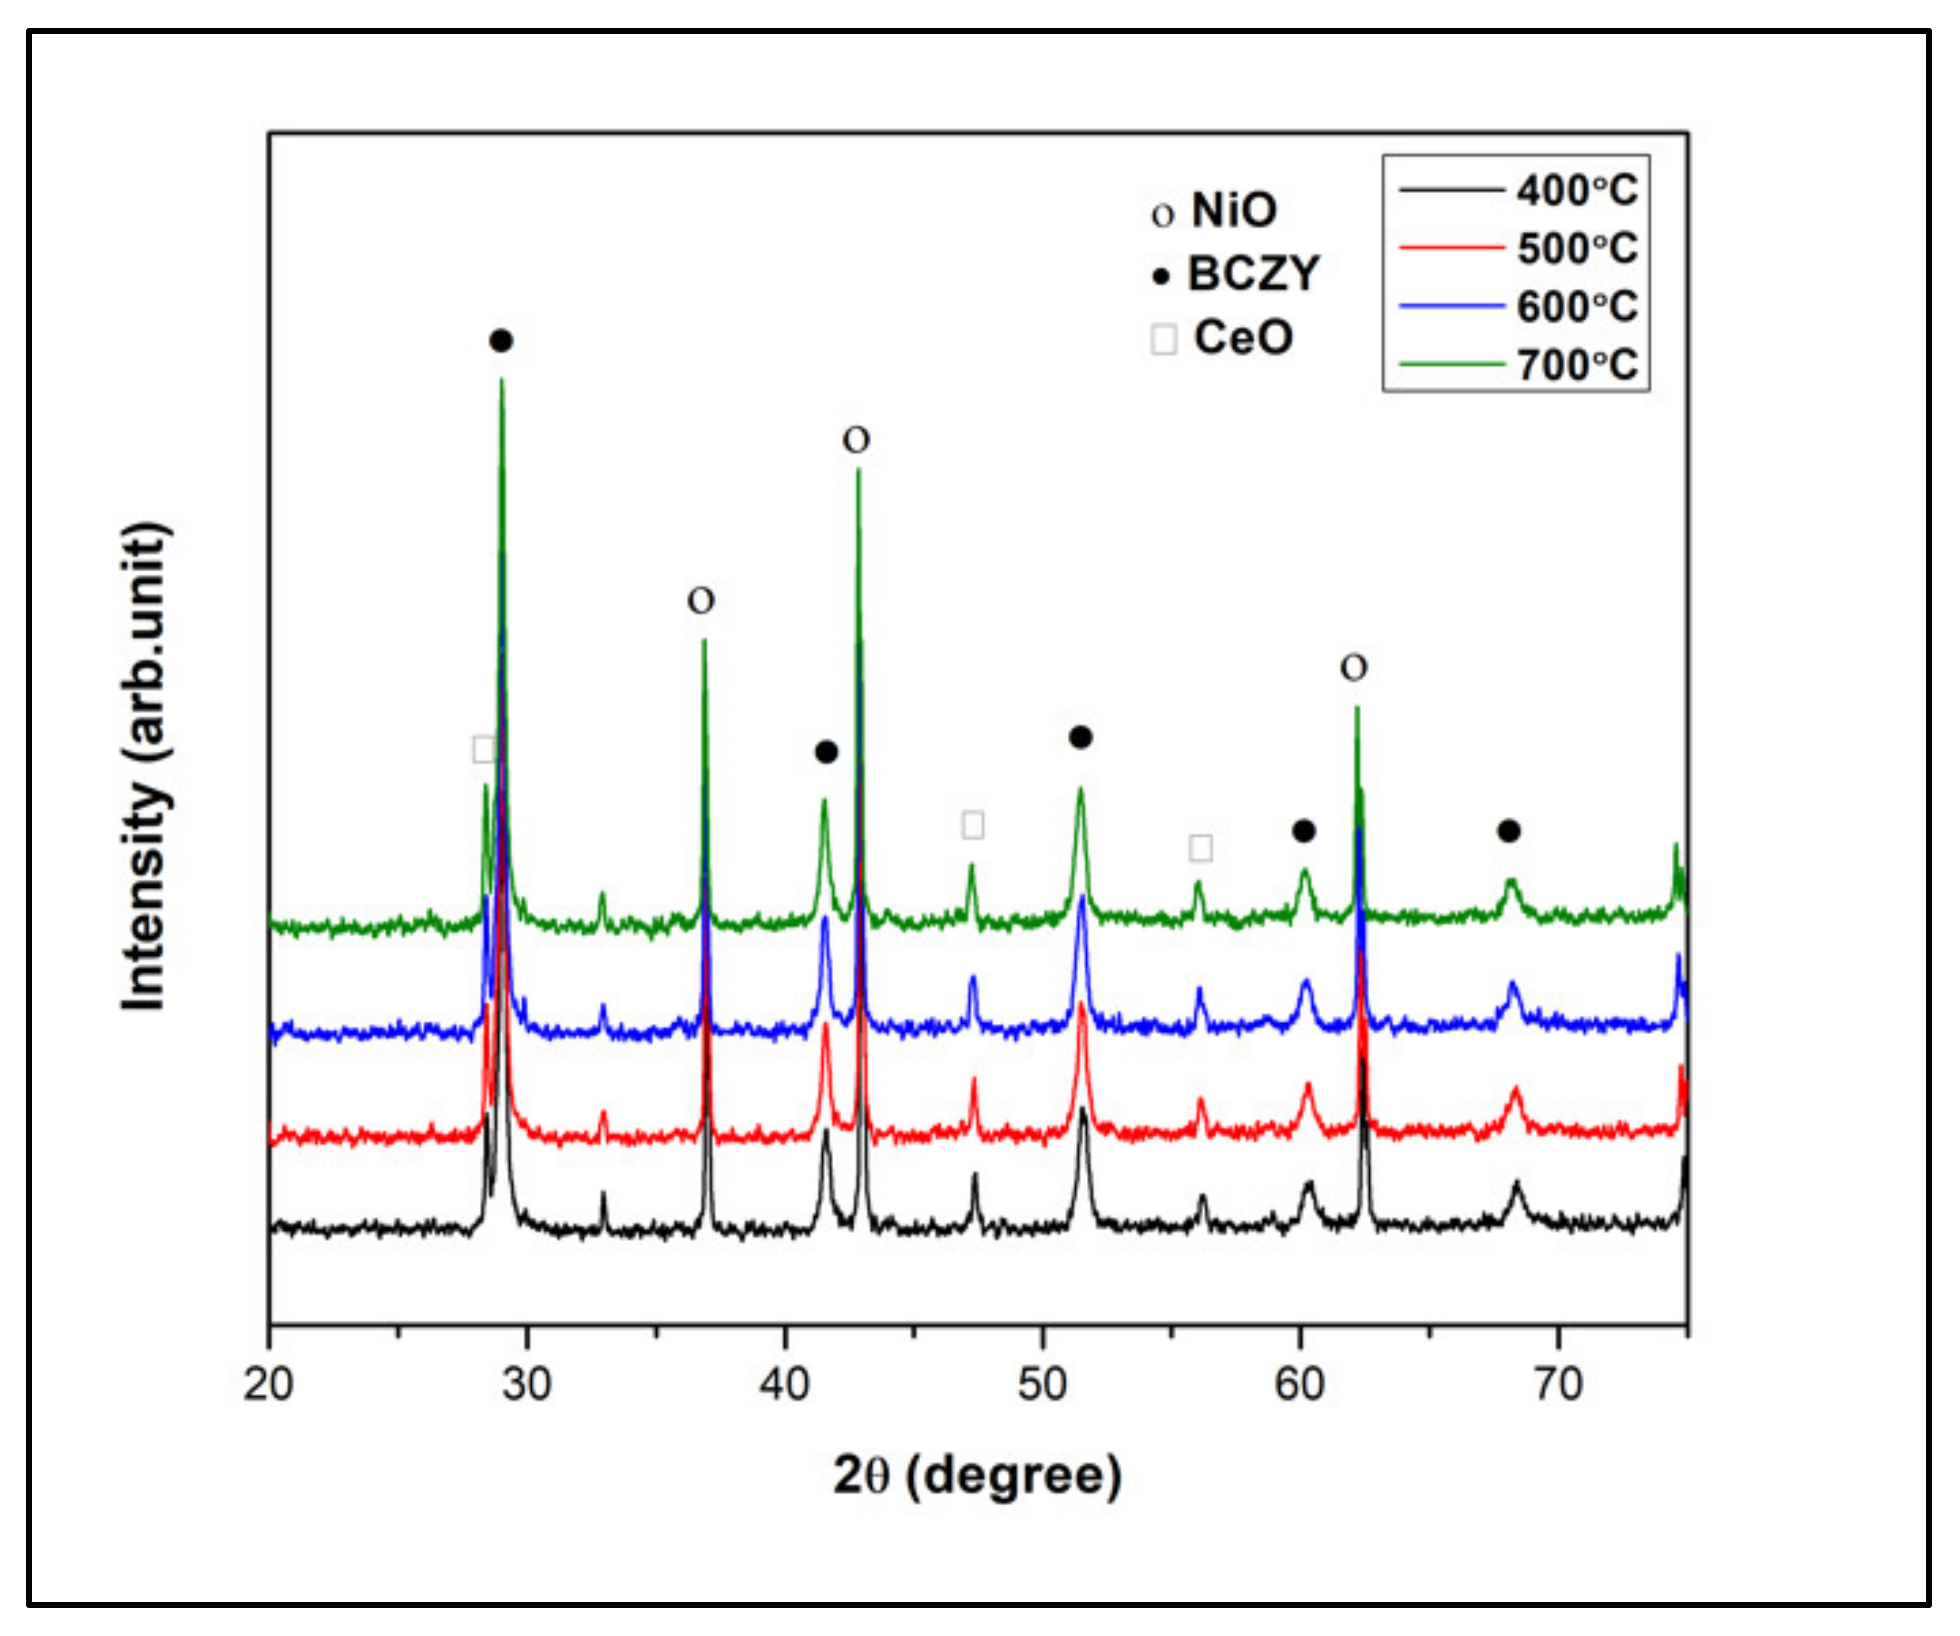
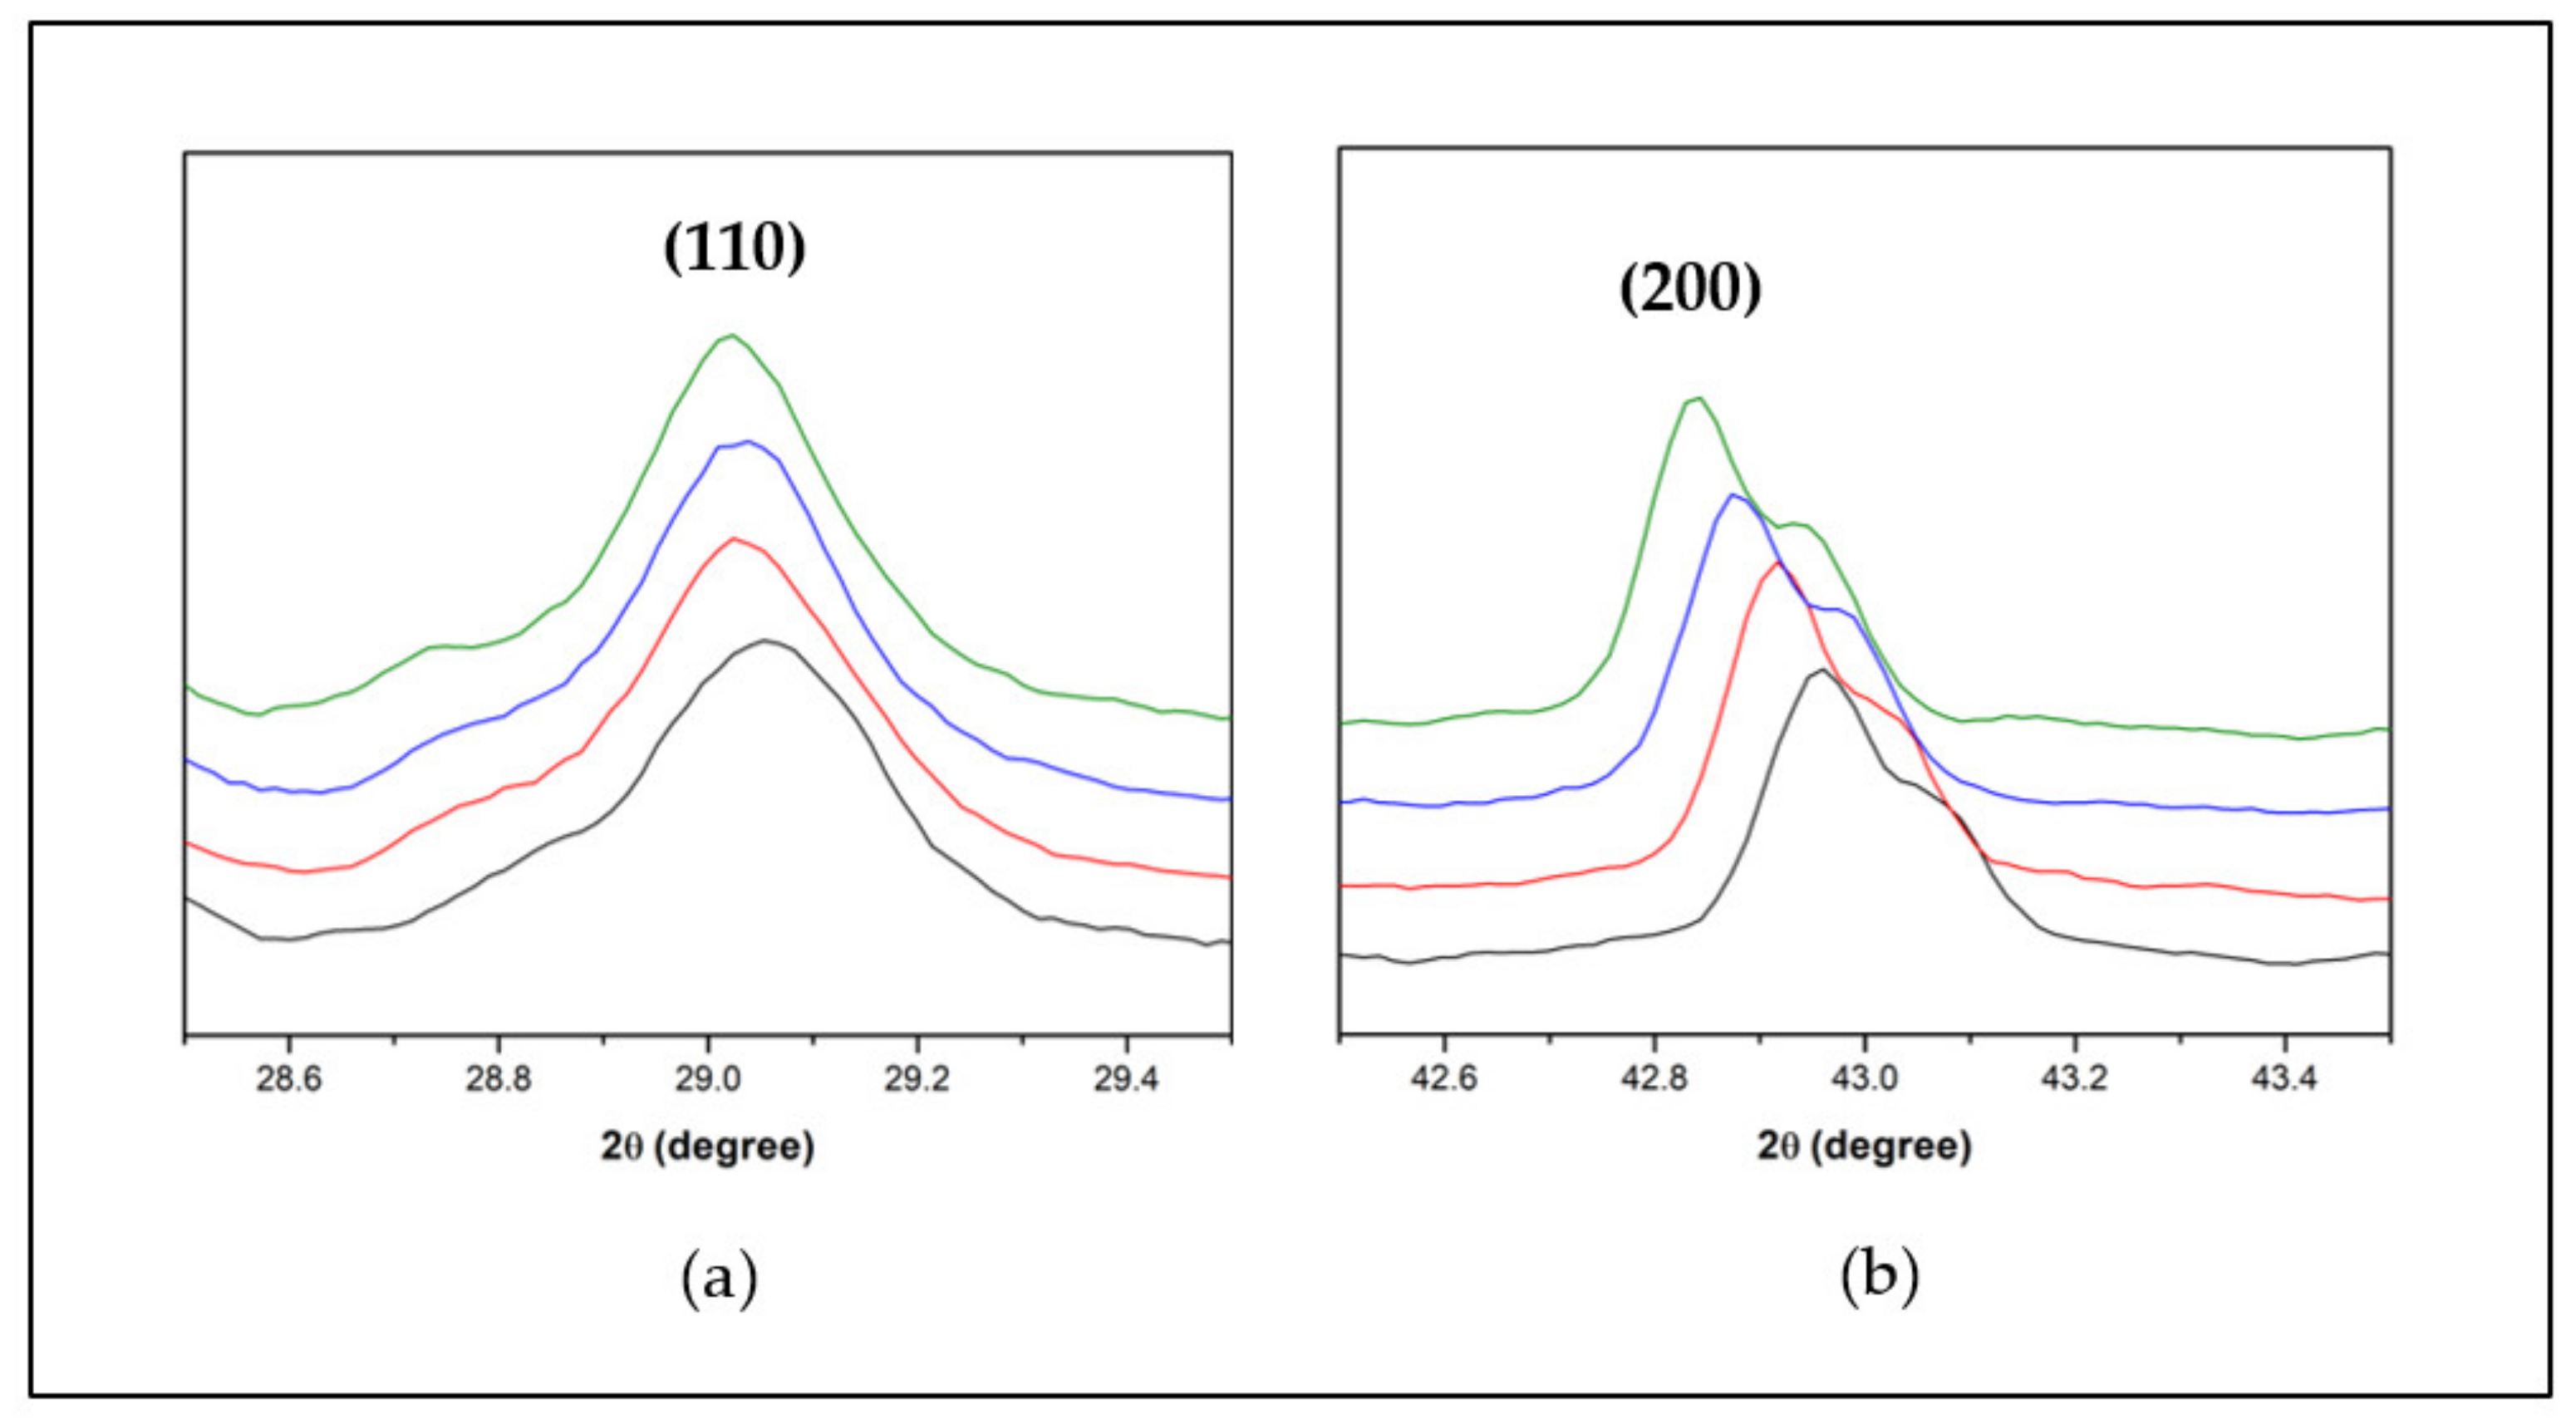
3.1. XRD Pattern
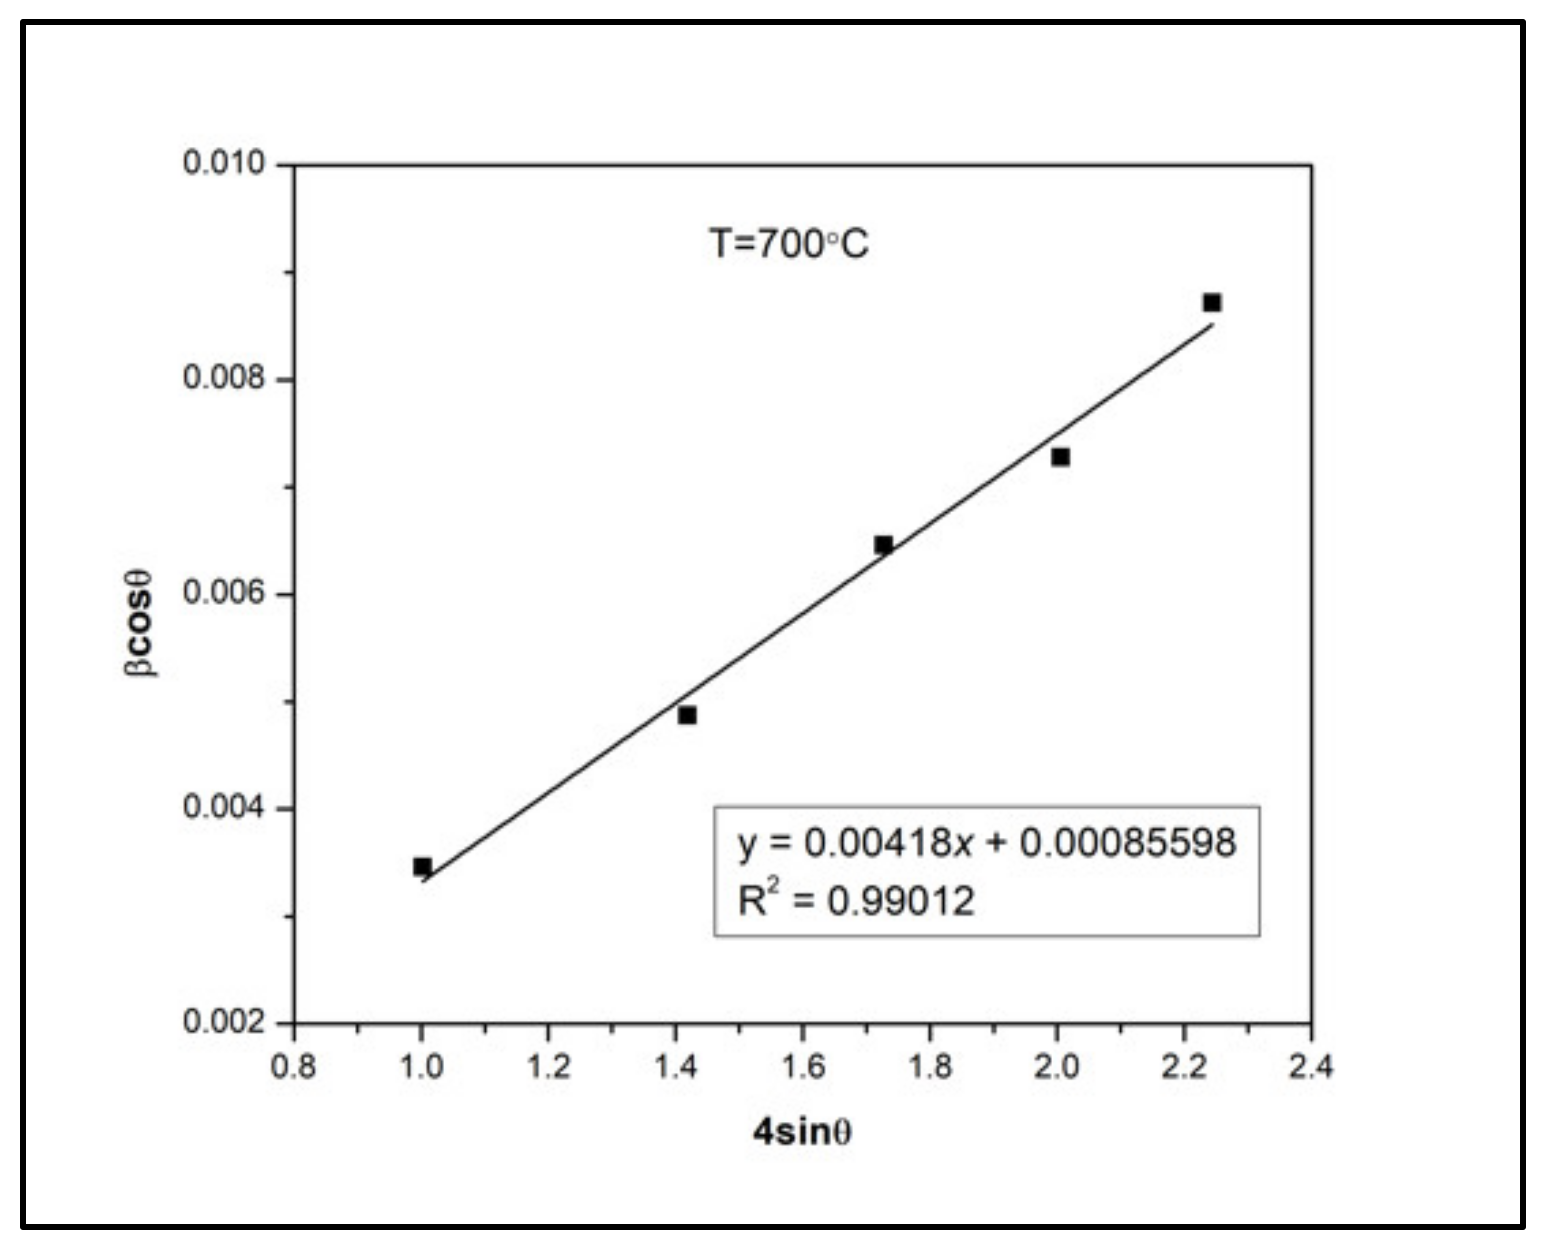
3.2. Crystallite Size
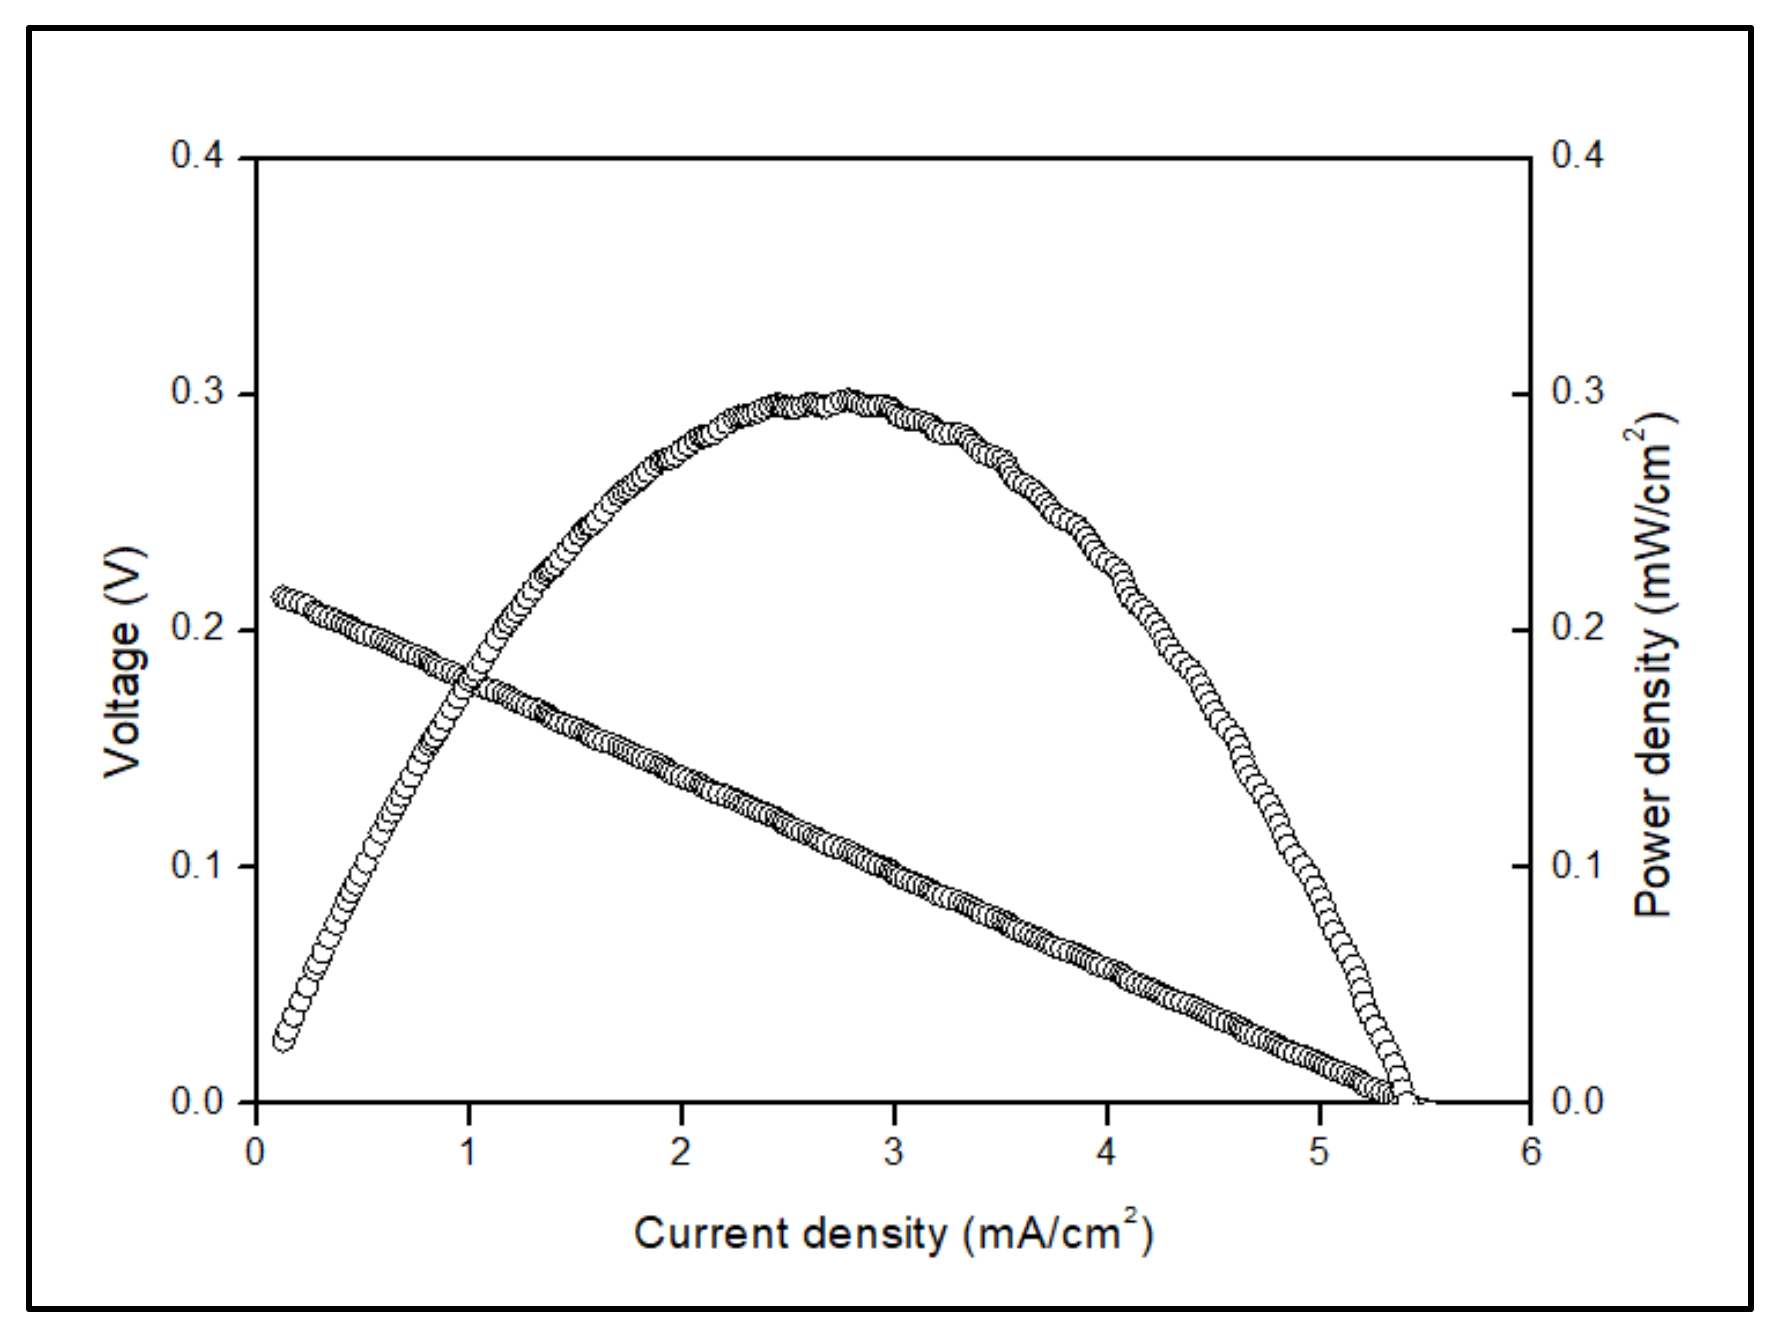
3.3. Electrochemical Measurement
4. Conclusions
Author Contributions
Funding
Data Availability Statement
Acknowledgments
Conflicts of Interest
References
- Iwahara, H.; Esaka, T.; Uchida, H.; Maeda, N. Proton conduction in sintered oxides and its application to steam electrolysis for hydrogen production. Solid State Ion. 1981, 3, 359–363. [Google Scholar] [CrossRef]
- Iwahara, H.; Uchida, H.; Ono, K.; Ogaki, K. Proton Conduction in Sintered Oxides Based on BaCeO3. J. Electrochem. Soc. 1988, 135, 529–533. [Google Scholar] [CrossRef]
- Felseghi, R.A.; Carcadea, E.; Raboaca, M.S.; Trufin, C.N.; Filote, C. Hydrogen fuel cell technology for the sustainable future of stationary applications. Energies 2019, 12, 4593. [Google Scholar] [CrossRef]
- Jeong, J.; Azad, A.K.; Schlegl, H.; Kim, B.; Baek, S.W.; Kim, K.; Kang, H.; Kim, J.H. Structural, thermal and electrical conductivity characteristics of Ln0.5Sr0.5Ti0.5Mn0.5O3±d (Ln: La, Nd and Sm) complex perovskites as anode materials for solid oxide fuel cell. J. Solid State Chem. 2015, 226, 154–163. [Google Scholar] [CrossRef]
- Shao, Z.; Tadé, M.O. Anodes for IT-SOFCs. In Intermediate-Temperature Solid Oxide Fuel Cells; Springer: Berlin/Heidelberg, Germany, 2016; pp. 127–175. ISBN 9783662529362. [Google Scholar]
- Lam, N.H.; Smith, R.P.; Le, N.; Thi, C.; Thuy, T.; Tamboli, M.S.; Tamboli, A.M.; Alshehri, S.; Ghoneim, M.M.; Tam, N.; et al. Evaluation of the Structural Deviation of Cu/Cu2O Nanocomposite Using the X-ray Diffraction Analysis Methods. Crystals 2022, 12, 566. [Google Scholar] [CrossRef]
- Shen, C.T.; Lee, Y.H.; Xie, K.; Yen, C.P.; Jhuang, J.W.; Lee, K.R.; Lee, S.W.; Tseng, C.J. Correlation between microstructure and catalytic and mechanical properties during redox cycling for Ni-BCY and Ni-BCZY composites. Ceram. Int. 2017, 43, S671–S674. [Google Scholar] [CrossRef]
- Lee, S.; Park, S.; Wee, S.; Baek, H.W.; Shin, D. One-dimensional structured La0.6Sr0.4Co0.2Fe0.8O3−δ—BaCe0.5Zr0.35Y0.15O3−δ composite cathode for protonic ceramic fuel cells. Solid State Ion. 2018, 320, 347–352. [Google Scholar] [CrossRef]
- Lee, K.R.; Tseng, C.J.; Jang, S.C.; Lin, J.C.; Wang, K.W.; Chang, J.K.; Chen, T.C.; Lee, S.W. Fabrication of anode-supported thin BCZY electrolyte protonic fuel cells using NiO sintering aid. Int. J. Hydrogen Energy 2019, 44, 23784–23792. [Google Scholar] [CrossRef]
- Yoo, Y.; Lim, N. Performance and stability of proton conducting solid oxide fuel cells based on yttrium-doped barium cerate-zirconate thin-film electrolyte. J. Power Sources 2013, 229, 48–57. [Google Scholar] [CrossRef]
- Barros Julião, P.S. A-site cation influences on performance, structure and conductivity of a lanthanide-based perovskite electrode for symmetrical solid oxide fuel cells. J. Power Sources 2020, 450, 227723. [Google Scholar] [CrossRef]
- Zhu, X.; Qian, C.; Sun, F.; Zhang, L.; Liu, X.; Li, D. Perovskite-type Nd0.5Sr0.5Co0.5Fe0.5O3-δ as a novel cathode material for intermediate-temperate solid oxide fuel cell. J. Alloys Compd. 2019, 802, 415–421. [Google Scholar] [CrossRef]
- Liu, H.; Akhtar, Z.; Li, P.; Wang, K. Mathematical modeling analysis and optimization of key design parameters of proton-conductive solid oxide fuel cells. Energies 2014, 7, 173–190. [Google Scholar] [CrossRef]
- Bi, L.; Fabbri, E.; Sun, Z.; Traversa, E. BaZr0.8Y0.2O3−δ-NiO Composite Anodic Powders for Proton-Conducting SOFCs Prepared by a Combustion Method. J. Electrochem. Soc. 2011, 158, B797. [Google Scholar] [CrossRef]
- Zunic, M.; Chevallier, L.; Radojkovic, A.; Brankovic, G.; Brankovic, Z.; Di Bartolomeo, E. Influence of the ratio between Ni and BaCe0.9Y 0.1O3-δ on microstructural and electrical properties of proton conducting Ni-BaCe0.9Y0.1O3-δ anodes. J. Alloys Compd. 2011, 509, 1157–1162. [Google Scholar] [CrossRef]
- Zakaria, N.H.; Yazid, H.; Osman, N. A Short Review on the Development of Anode Materials for Proton Conducting Fuel Cell. Solid State Sci. Technol. Lett. 2018, 19, 15–18. [Google Scholar]
- Azad, A.K.; Abdalla, A.M.; Afif, A.; Azad, A.; Afroze, S.; Idris, A.C.; Park, J.Y.; Saqib, M.; Radenahmad, N.; Hossain, S.; et al. Improved mechanical strength, proton conductivity and power density in an ‘ all—protonic ’ ceramic fuel cell at intermediate temperature. Sci. Rep. 2021, 11, 19382. [Google Scholar] [CrossRef]
- Løken, A.; Ricote, S.; Wachowski, S. Thermal and Chemical Expansion in Proton Ceramic Electrolytes and Compatible Electrodes. Crystals 2018, 8, 365. [Google Scholar] [CrossRef]
- Tarancón, A. Strategies for lowering solid oxide fuel cells operating temperature. Energies 2009, 2, 1130–1150. [Google Scholar] [CrossRef]
- Heydari, F.; Maghsoudipour, A.; Alizadeh, M. Synthesis and evaluation of effective parameters in thermal expansion coefficient of Ln 0.6 Sr 0.4 Co 0.2 M 0.8 O 3−δ (Ln = La,Nd and M = Mn,Fe) perovskite oxide. Bull. Mater. Sci. Indian Acad. Sci. 2015, 38, 1009–1014. [Google Scholar] [CrossRef][Green Version]
- Osinkin, D.A.; Bronin, D.I.; Beresnev, S.M.; Bogdanovich, N.M. Thermal expansion, gas permeability, and conductivity of Ni-YSZ anodes produced by different techniques. SOLID STATE Electrochem 2014, 18, 149–156. [Google Scholar] [CrossRef]
- Kibasomba, P.M.; Dhlamini, S.; Maaza, M.; Liu, C.P.; Rashad, M.M.; Rayan, D.A.; Mwakikunga, B.W. Strain and grain size of TiO2 nanoparticles from TEM, Raman spectroscopy and XRD: The revisiting of the Williamson-Hall plot method. Results Phys. 2018, 9, 628–635. [Google Scholar] [CrossRef]
- Monshi, A.; Foroughi, M.R.; Monshi, M.R. Modified Scherrer Equation to Estimate More Accurately Nano-Crystallite Size Using XRD. World J. Nano Sci. Eng. 2012, 02, 154–160. [Google Scholar] [CrossRef]
- Rabiei, M.; Palevicius, A.; Dashti, A.; Nasiri, S.; Monshi, A.; Doustmohammadi, A.; Vilkauskas, A.; Janusas, G. X-ray Diffraction Analysis and Williamson-Hall Method in USDM Model for Estimating More Accurate Values of Stress-Strain of Unit Cell and Super Cells (2 × 2 × 2) of Hydroxyapatite, Confirmed by Ultrasonic Pulse-Echo Test. Materials 2021, 14, 2949. [Google Scholar] [CrossRef] [PubMed]
- Pandya, S.G.; Corbett, J.P.; Jadwisienczak, W.M.; Kordesch, M.E. Structural characterization and X-ray analysis by Williamson-Hall method for Erbium doped Aluminum Nitride nanoparticles, synthesized using inert gas condensation technique. Phys. E Low-Dimensional Syst. Nanostruct. 2016, 79, 98–102. [Google Scholar] [CrossRef]
- Rhidwan, I.; Triyono, D.; Laysandra, H. Crystallite size dependence on electrical properties of LaFeO3.0.1Fe3O4 nanocomposite material. IOP Conf. Ser. Mater. Sci. Eng. 2017, 188, 012058. [Google Scholar] [CrossRef]
- Ermiş, İ.; Sertkol, M.; Çorumlu, V.; Dagdemir, Y.; Arı, M. Synthesis of (Bi2O3)0.9-x(Tb4O7)0.1(Sm2O3)x electrolyte for IT-SOFCs. Synth. React. Inorg. Met. Nano-Metal Chem. 2016, 48, 91–95. [Google Scholar] [CrossRef]
- Osman, N.; Ismail, I.; Samat, A.A.; Md Jani, A.M. Reactivity study of LaSrCoFeO3—Ba(Ce,Zr)O3 composite cathode material. Mater. Sci. Forum 2016, 846, 58–62. [Google Scholar] [CrossRef]
- Ismail, I.; Osman, N.; Md Jani, A.M. Tailoring the microstructure of La0.6Sr0.4Co0.2Fe0.8O3−α cathode material: The role of dispersing agent. J. Sol-Gel Sci. Technol. 2016, 80, 259–266. [Google Scholar] [CrossRef]
- Zakaria, N.H.A.; Affandi, N.S.M.; Zainon, A.N.; Yazid, H.; Osman, N. Electrical Conductivity of Anode Supported NiO- BCZY|BCZY|LSCF-BCZY Button Cell at Intermediate Temperatures. Solid State Sci. Technol. 2019, 27, 15–21. [Google Scholar]
- Bunaciu, A.A.; Udriştioiu, E.G.; Aboul-Enein, H.Y. X-Ray Diffraction: Instrumentation and Applications. Crit. Rev. Anal. Chem. 2015, 45, 289–299. [Google Scholar] [CrossRef]
- Mazlan, N.W.; Osman, N.; Hassan, O.H. Thermal expansion and lattice parameter of solid electrolyte based on cerate-zirconate ceramics. AIP Conf. Proc. 2018, 2031, 020014. [Google Scholar] [CrossRef]
- Mazlan, N.W.; Osman, N.; Hassan, O.H.; Mohamed, Z. Lattice Expansion of BaCe0.54Zr0.36Y0.1O3-δ Ceramic Electrolyte. Solid State Phenom. 2020, 307, 149–153. [Google Scholar] [CrossRef]
- Mohd Abd Fatah, A.F.; Rosli, A.Z.; Mohamad, A.A.; Muchtar, A.; Muhammed, M.A.; Hamid, N.A. Electrochemical Evaluation of Nickel Oxide Addition toward Lanthanum Strontium Cobalt Ferrite Cathode for Intermediate Temperature Solid Oxide Fuel Cell (IT-SOFCS). Energies 2022, 15, 5188. [Google Scholar] [CrossRef]
- Baral, A.K.; Choi, S.; Kim, B.K.; Lee, J.H. Processing and characterizations of a novel proton-conducting BaCe0.35Zr0.50Y0.15O3-δ electrolyte and its nickel-based anode composite for anode-supported IT-SOFC. Mater. Renew. Sustain. Energy 2014, 3, 35. [Google Scholar] [CrossRef]
- Osman, N.; Mazlan, N.W.; Hassan, O.H.; Wan Zulkifli, W.Z.; Mohamed, Z. Phase Analysis of Cerate and Zirconate Ceramics Powder Prepared by Supercritical Ethanol Using High Temperature-High Pressure Batch Wise Reactor System. Solid State Phenom. 2020, 307, 171–175. [Google Scholar] [CrossRef]
- Sultan, N.M.; Albarody, T.M.B.; Al-jothery, H.K.M.; Abdullah, M.A.; Mohammed, H.G.; Obodo, K.O. Thermal Expansion of 3C-SiC Obtained from In-Situ X-ray Diffraction at High Temperature and First-Principal Calculations. Materials 2022, 15, 6229. [Google Scholar] [CrossRef]
- Prabhakar Rao, P.A.N. Studies on Structure, Lattice Thermal Expansion and Oxide Ion Conducting Properties of Some Rare Earth Based Zirconate Pyrochlores. Ph.D. Thesis, National Institute for Interdisciplinary Science and (CSIR), Thiruvananthapuram, India, 2012. [Google Scholar]
- Hardy, J.S.; Templeton, J.W.; Edwards, D.J.; Lu, Z.; Stevenson, J.W. Lattice expansion of LSCF-6428 cathodes measured by in situ XRD during SOFC operation. J. Power Sources 2012, 198, 76–82. [Google Scholar] [CrossRef]
- Prabhu, Y.T.; Rao, K.V. X-Ray Analysis by Williamson-Hall and Size-Strain Plot Methods of ZnO Nanoparticles with Fuel Variation. World J. Nano Sci. Eng. 2014, 4, 21–28. [Google Scholar] [CrossRef]
- Ilyas, S.; Heryanto; Abdullah, B.; Tahir, D. X-ray diffraction analysis of nanocomposite Fe3O4/activated carbon by Williamson–Hall and size-strain plot methods. Nano-Struct. Nano-Objects 2019, 20, 100396. [Google Scholar] [CrossRef]
- Rajesh Kumar, B.; Hymavathi, B. X-ray peak profile analysis of solid-state sintered alumina doped zinc oxide ceramics by Williamson–Hall and size-strain plot methods. J. Asian Ceram. Soc. 2017, 5, 94–103. [Google Scholar] [CrossRef]
- Kim, H.; Park, N. Importance of tailoring lattice strain in halide perovskite crystals. NPG Asia Mater. 2020, 12, 78. [Google Scholar] [CrossRef]
- Nath, D.; Singh, F.; Das, R. X-ray diffraction analysis by Williamson-Hall, Halder-Wagner and size-strain plot methods of CdSe nanoparticles- a comparative study. Mater. Chem. Phys. 2020, 239, 122021. [Google Scholar] [CrossRef]
- Yusoff, A.H.M.; Salimi, M.N.; Jamlos, M.F. Dependence of lattice strain of magnetite nanoparticles on precipitation temperature and pH of solution. J. Phys. Conf. Ser. 2017, 908, 012065. [Google Scholar] [CrossRef]
- Osman, N.; Senari, S.M.; Md Jani, A.M. Characterization of NiO-BCZY as composite anode prepared by a one-step sol-gel method. Malays. J. Fundam. Appl. Sci. 2020, 16, 450–452. [Google Scholar] [CrossRef]
- Ismail, I.; Jani, A.M. La0.6Sr0.4Co0.2Fe0.8O3−δ powder: A simple microstructure modification strategy. J. Sol-Gel Sci. Technol. 2020, 94, 435–447. [Google Scholar] [CrossRef]
- Senari, S.M.; Osman, N.; Jani, A.M.M. Impedance Study on NiO-BaCe0.54Zr0.36Y0.1O2.95 Composite Anode for Proton-Conducting Fuel Cell. J. Phys. Conf. Ser. 2018, 1083, 012026. [Google Scholar] [CrossRef]
- Hossain, S.; Abdalla, A.M.; Zaini, J.H.; Savaniu, C.D.; Irvine, J.T.S.; Azad, A.K. Highly dense and novel proton conducting materials for SOFC electrolyte. Int. J. Hydrogen Energy 2017, 42, 27308–27322. [Google Scholar] [CrossRef]
- Sata, N.; Matsuta, H.; Akiyama, Y.; Chiba, Y.; Shin, S.; Ishigame, M. Fabrication of proton conducting thin films of SrZrO3 and SrCeO3 and their fundamental characterization. Solid State Ion. 1997, 97, 437–441. [Google Scholar] [CrossRef]
- Norby, T.; Widerøe, M.; Glöckner, R.; Larring, Y. Hydrogen in oxides. Dalt. Trans. 2004, 19, 3012–3018. [Google Scholar] [CrossRef]
- Fan, Z.; Li, N.; Du, P.; Yang, W.; Chen, Q. Influence of Lattice Dynamics on the Proton Transport in BaZrY-Oxide Perovskites under High Pressure. J. Phys. Chem. C 2020, 124, 22376–22382. [Google Scholar] [CrossRef]
- Abdul Malik, L.; Mahmud, N.A.; Mohd Affandi, N.S.; Mazlan, N.W.; Zakaria, N.H.A.; Abd Malek, N.I.; Hassan, O.H.; Md Jani, A.M.; Osman, N. Effect of nickel oxide—Modified BaCe0.54Zr0.36Y0.1O2.95 as composite anode on the performance of proton-conducting solid oxide fuel cell. Int. J. Hydrogen Energy 2021, 46, 5963–5974. [Google Scholar] [CrossRef]
- Bi, L.; Fabbri, E.; Traversa, E. Solid oxide fuel cells with proton-conducting La0.99Ca0.01NbO4 electrolyte. Electrochim. Acta 2018, 260, 748–754. [Google Scholar] [CrossRef]
- Agarwal, V.; Liu, M. Electrochemical Properties of BaCe08Gd02O3 Electrolyte FilmsDeposited on Ni-BaCe08Gd02O3 Substrates. Electrochem Soc. 1997, 144, 1035. [Google Scholar] [CrossRef]
- Yang, C.; Zhang, X.; Zhao, H.; Shen, Y.; Du, Z.; Zhang, C. Electrochemical properties of BaZr0.1Ce0.7Y0.1Yb0.1O3—δ-Nd1.95NiO4 + δ composite cathode for protonic ceramic fuel cells. Int. J. Hydrogen Energy 2015, 40, 2800–2807. [Google Scholar] [CrossRef]


| Temp. (°C) | Lattice Parameter, a (Å) | |
|---|---|---|
| NiO | BCZY | |
| 400 | 4.2004 | 4.3331 |
| 500 | 4.2064 | 4.3400 |
| 600 | 4.2115 | 4.3433 |
| 700 | 4.2152 | 4.3462 |
| NiO | ||||||||||
|---|---|---|---|---|---|---|---|---|---|---|
| Temp, (°C) | Scherrer Method | Williamson-Hall Method | ||||||||
| UDM | USDM | UDEDM | ||||||||
| D (nm) | D (nm) | ε (×10−3) | D (nm) | ε (×10−3) | σ | D (nm) | ε (×10−3) | σ | U (×10−5) | |
| 400 | 48.71 | 33.37 | 12.00 | 33.37 | 0.19 | 28.53 | 33.37 | 1.22 | 186.20 | 11.32 |
| 500 | 48.79 | 34.98 | 11.00 | 34.98 | 0.77 | 118.04 | 34.98 | 1.07 | 163.80 | 8.76 |
| 600 | 49.01 | 36.48 | 8.90 | 35.15 | 0.18 | 28.04 | 35.32 | 1.19 | 183.00 | 10.94 |
| 700 | 49.34 | 38.01 | 8.60 | 35.32 | 0.18 | 27.47 | 34.65 | 1.17 | 179.40 | 10.51 |
| BaCe0.54Zr0.36Y0.1O3-δ | ||||||||||
|---|---|---|---|---|---|---|---|---|---|---|
| Temp, (°C) | Scherrer Method | Williamson-Hall Method | ||||||||
| UDM | USDM | UDEDM | ||||||||
| D (nm) | D (nm) | ε (×10−3) | D (nm) | ε (×10−3) | σ | D (nm) | ε (×10−3) | σ | U (×10−5) | |
| 400 | 30.91 | 109.71 | 3.09 | 109.71 | 3.09 | 472.97 | 109.71 | 3.09 | 472.90 | 73.01 |
| 500 | 31.62 | 132.86 | 5.07 | 132.85 | 5.07 | 777.38 | 132.85 | 5.07 | 777.30 | 197.20 |
| 600 | 34.31 | 135.34 | 4.88 | 135.34 | 4.88 | 746.83 | 135.34 | 4.88 | 746.80 | 182.00 |
| 700 | 41.82 | 169.18 | 4.18 | 169.18 | 4.18 | 639.60 | 169.18 | 4.18 | 639.50 | 133.50 |
| Temperature (°C) | Ro (Ωcm2) | Rp (Ωcm2) | Total Conductivity (×10−3 Scm−1) |
|---|---|---|---|
| 700 | 34.19 | 7.90 | 1.90 |
| 600 | 44.37 | 8.30 | 1.52 |
| 500 | 52.45 | 10.26 | 1.28 |
| Temperature (°C) | Power Density (mW/cm−2) |
|---|---|
| 700 | 0.48 |
| 600 | 0.30 |
| 500 | 0.18 |
Publisher’s Note: MDPI stays neutral with regard to jurisdictional claims in published maps and institutional affiliations. |
© 2022 by the authors. Licensee MDPI, Basel, Switzerland. This article is an open access article distributed under the terms and conditions of the Creative Commons Attribution (CC BY) license (https://creativecommons.org/licenses/by/4.0/).
Share and Cite
Mazlan, N.W.; Murat, M.S.; Tseng, C.-J.; Hassan, O.H.; Osman, N. Lattice Expansion and Crystallite Size Analyses of NiO-BaCe0.54Zr0.36Y0.1O3-δ Anode Composite for Proton Ceramic Fuel Cells Application. Energies 2022, 15, 8520. https://doi.org/10.3390/en15228520
Mazlan NW, Murat MS, Tseng C-J, Hassan OH, Osman N. Lattice Expansion and Crystallite Size Analyses of NiO-BaCe0.54Zr0.36Y0.1O3-δ Anode Composite for Proton Ceramic Fuel Cells Application. Energies. 2022; 15(22):8520. https://doi.org/10.3390/en15228520
Chicago/Turabian StyleMazlan, Nurul Waheeda, Munirah Shafiqah Murat, Chung-Jen Tseng, Oskar Hasdinor Hassan, and Nafisah Osman. 2022. "Lattice Expansion and Crystallite Size Analyses of NiO-BaCe0.54Zr0.36Y0.1O3-δ Anode Composite for Proton Ceramic Fuel Cells Application" Energies 15, no. 22: 8520. https://doi.org/10.3390/en15228520
APA StyleMazlan, N. W., Murat, M. S., Tseng, C.-J., Hassan, O. H., & Osman, N. (2022). Lattice Expansion and Crystallite Size Analyses of NiO-BaCe0.54Zr0.36Y0.1O3-δ Anode Composite for Proton Ceramic Fuel Cells Application. Energies, 15(22), 8520. https://doi.org/10.3390/en15228520