Next Article in Journal
Policies and Price Tags: The Public’s Perception of Face Transplantation and Its Funding
Previous Article in Journal
Recreational Motorized Vehicle Use Under the Influence of Alcohol or Drugs Significantly Increases Odds of Craniofacial Injury
 
 
Craniomaxillofacial Trauma & Reconstruction is published by MDPI from Volume 18 Issue 1 (2025). Previous articles were published by another publisher in Open Access under a CC-BY (or CC-BY-NC-ND) licence, and they are hosted by MDPI on mdpi.com as a courtesy and upon agreement with Sage.
Article

A Demographic Analysis of Craniomaxillofacial Trauma in the Era of COVID-19

by
Robert C. Clark
1,
Bijal Desai
1 and
Edward H. Davidson
2,*
1
Case Western Reserve University School of Medicine, Cleveland, OH, USA
2
Department of Plastic & Reconstructive Surgery, University Hospitals-Case Western Reserve University, 11100 Euclid Ave Ste 1200, Cleveland, OH 44106, USA
*
Author to whom correspondence should be addressed.
Craniomaxillofac. Trauma Reconstr. 2022, 15(4), 288-294; https://doi.org/10.1177/19433875211047037
Submission received: 1 November 2020 / Revised: 1 December 2020 / Accepted: 1 January 2021 / Published: 15 September 2021

Abstract

:
Study Design: Retrospective cohort study. Objective: The challenges of COVID-19 could magnify socioeconomic vulnerability for craniomaxillofacial (CMF) trauma. This study compares subjects who presented with CMF fractures to a regional healthcare system during the pandemic with those in 2019. We hypothesized societal circumstances of 2020 would correlate with disproportionately more CMF fractures in vulnerable patients compared to pre-pandemic trends. Methods: An IRB approved retrospective study of CMF fracture presentations in 2019 and 2020 was performed. Demographics, injury details, and management details were collected. A residence-based poverty index was calculated for each subject utilizing census data. Pre-pandemic and pandemic cases were compared to identify differences between cohorts. Results: A large decrease in presentations was noted between pre-pandemic and pandemic cohorts. There was significantly greater poverty the pre-pandemic cohort as compared to the pandemic cohort (P = .026). Overall, there was a significant correlation between higher poverty and violent MOI (P < .001). This association was maintained pre-pandemic, (P = .001) but was insignificant in the pandemic cohort (P = .108). Difference between cohorts with respect to violent injury was non-significant (P = .559) with non-significant difference in demographics including age (P = .390), place of injury (P = .136), employment status (P = .905), insurance status (P = .580), marital status (P = .711), ethnicity (P = .068), and gender (P = .656). Management was not significantly different between cohorts including percent hospital admission (P = .396), surgical intervention (P = .120), and time to operation (P = .109). Conclusions: Contrary to our hypothesis, this analysis indicates that the societal changes brought on by the COVID-19 pandemic did not magnify vulnerable populations. Some changes were noted including in volume of presentation, demographic distribution, and injury detail.

Introduction

Craniomaxillofacial (CMF) trauma can have lifelong physical, emotional, and demographic effects in those afflicted.[1,2] While this is a naturally indiscriminate set of injuries, previous studies have analyzed epidemiological patterns, finding associations with the younger adult male demographic.[3] Commonly reported causes include interpersonal violence and motor vehicle accidents, thus giving weight to the conception that this is a more traditionally urban affliction.[4,5,6] Although the relationship of socioeconomic status (SES) with chronic disease and trauma has been extensively reported,[7,8,9,10] few data are available analyzing related demographic factors in the setting of CMF trauma. Further study describing common mechanisms of injury and demographic trends in presentation may be helpful in guiding systems for targeted CMF trauma prevention and treatment. This is of particular interest as we face the societal changes brought on by the COVID-19 pandemic. The effect of SES, ethnicity, sex, and other demographic values on the prevalence of facial fractures is especially relevant during the unprecedented social and interpersonal environment surrounding COVID-19. The national effects COVID-19 has had on daily life in the United States are unprecedented, with emphasis on staying home and social distancing creating an isolated population. Measures to fight the spread of the virus leave many confined alone or among only their own closest individuals. This social isolation, confounded by general anxieties of the times, may have detrimental effects mental-health and wellbeing on a massive scale.[11] Along with this, the outbreak of COVID-19 has resulted in major life-style changes across the globe including changes to prior societal and social norms such as new stressors, increased unemployment, and reduced sources of support and relaxation.[12,13]
It follows that with the increased stress and social isolation of the pandemic, comes increased risk of interpersonal and domestic violence.[14] Many reports have been published since the beginning of the pandemic providing editorial views or anecdotal evidence of increased incidence of violence, but little in the way of evidence-based analysis exists.[15] Due to the large body of literature and sparsity of data, we became interested in the effect that the COVID-19 pandemic would have on CMF trauma presentations to our large regional healthcare system.
This study was performed to analyze and describe the demographic parameters of those afflicted by CMF fractures in Ohio’s Cuyahoga County presenting to the University Hospitals system along with the most common mechanisms of injury, place of trauma, and fracture details. Furthermore, we sought to compare demographic and clinical details between pre-pandemic presentations of 2019 and pandemic presentations of 2020. We hypothesized that, overall, presentations would be more commonly from urban environments and occur in those of lower SES and more vulnerable populations. We further hypothesized that these risk factors would be magnified by the unprecedented social and societal circumstances of the COVID-19 pandemic and that mechanism of injury would be increasingly related to domestic and interpersonal violence.

Materials and Methods

An IRB approved retrospective review of all CMF fracture presentations to a large regional healthcare system between March and July of each 2019 and 2020 was performed. Those presenting in 2019 were designated as the prepandemic cohort and those presenting in 2020 were designated as the pandemic cohort. From each case, data regarding demographics, injury, and acute clinical course were collected, and deidentified. Demographic parameters included subject age, gender, ethnicity, place of residence, insurance status, employment status, and marital status. Injury parameters included place of trauma, mechanism of injury, CMF fracture details, other bodily injuries, and intoxication at time of injury. Clinical course data included admission, inpatient surgical interventions, and time from presentation to intervention. Proportion of presentations per month during the 2 time periods was also described.
Utilizing 2009 census data demonstrating proportion of population below the poverty line in each district of Cleveland and Cuyahoga County,[16] an index of poverty was created. Areas with 0-10% of the population below the poverty line were designated as low poverty. Those with 10.1-25% were designated as intermediate poverty. Those with more than 25% were designated as high poverty. The address of residence of each study subject was plotted on this map to generate a deidentified measure of socioeconomic status. Ethnicity was categorized as Caucasian and other. Insurance status was categorized as private or public/ none. Employment status was classified as employed or other (retired, unemployed, etc.). Marital status was classified as married or other (single, child, divorced, or widowed).
Mechanism of injury (MOI) for each case was classified into categories of fall or accident, sport-related, bicyclerelated, motor vehicle accident (MVA), fight/assault or gunshot wound (GSW), and domestic assault. These were further subclassified into violent injury (fight/assault, domestic, GSW) or non-violent injury (fall, accident, athletic, bicycle, MVA). Location of injury occurrence was categorized as home, public, bar, park/sport, school or work, or other. These were categorized into either athome or not-at-home for analysis. CMF fractures were classified as isolated or multiple. Presence or absence of other injuries on admission was also analyzed.
Demographic, injury, and clinical data were described for the overall cohort. Pre-pandemic and pandemic cohorts were compared to identify differences in demographics, presentations, and management. Subject age and time from presentation to surgical intervention were not normally distributed as determined by the Shapiro-Wilk test, and the Mann-Whitney U test was performed for significance. All other variables were categorical, and Pearson Chi-Square tests were performed for significance. Calculated P-values of less than 0.05 were considered statistically significant. All data were analyzed utilizing SPSS 27 statistical package.[17] Figures were created utilizing a combination of Microsoft Excel, Microsoft PowerPoint, and Adobe Illustrator.[18,19,20]

Results

There were 165 total craniomaxillofacial fracture presentations during the periods of study. There were notably fewer presentations during the pandemic period as compared to the pre-pandemic period with 125 presentations during 2019 and 40 during 2020. Monthly proportion of presentations during the study period was normally distributed in both 2019 and 2020 cohorts (Figure 1).
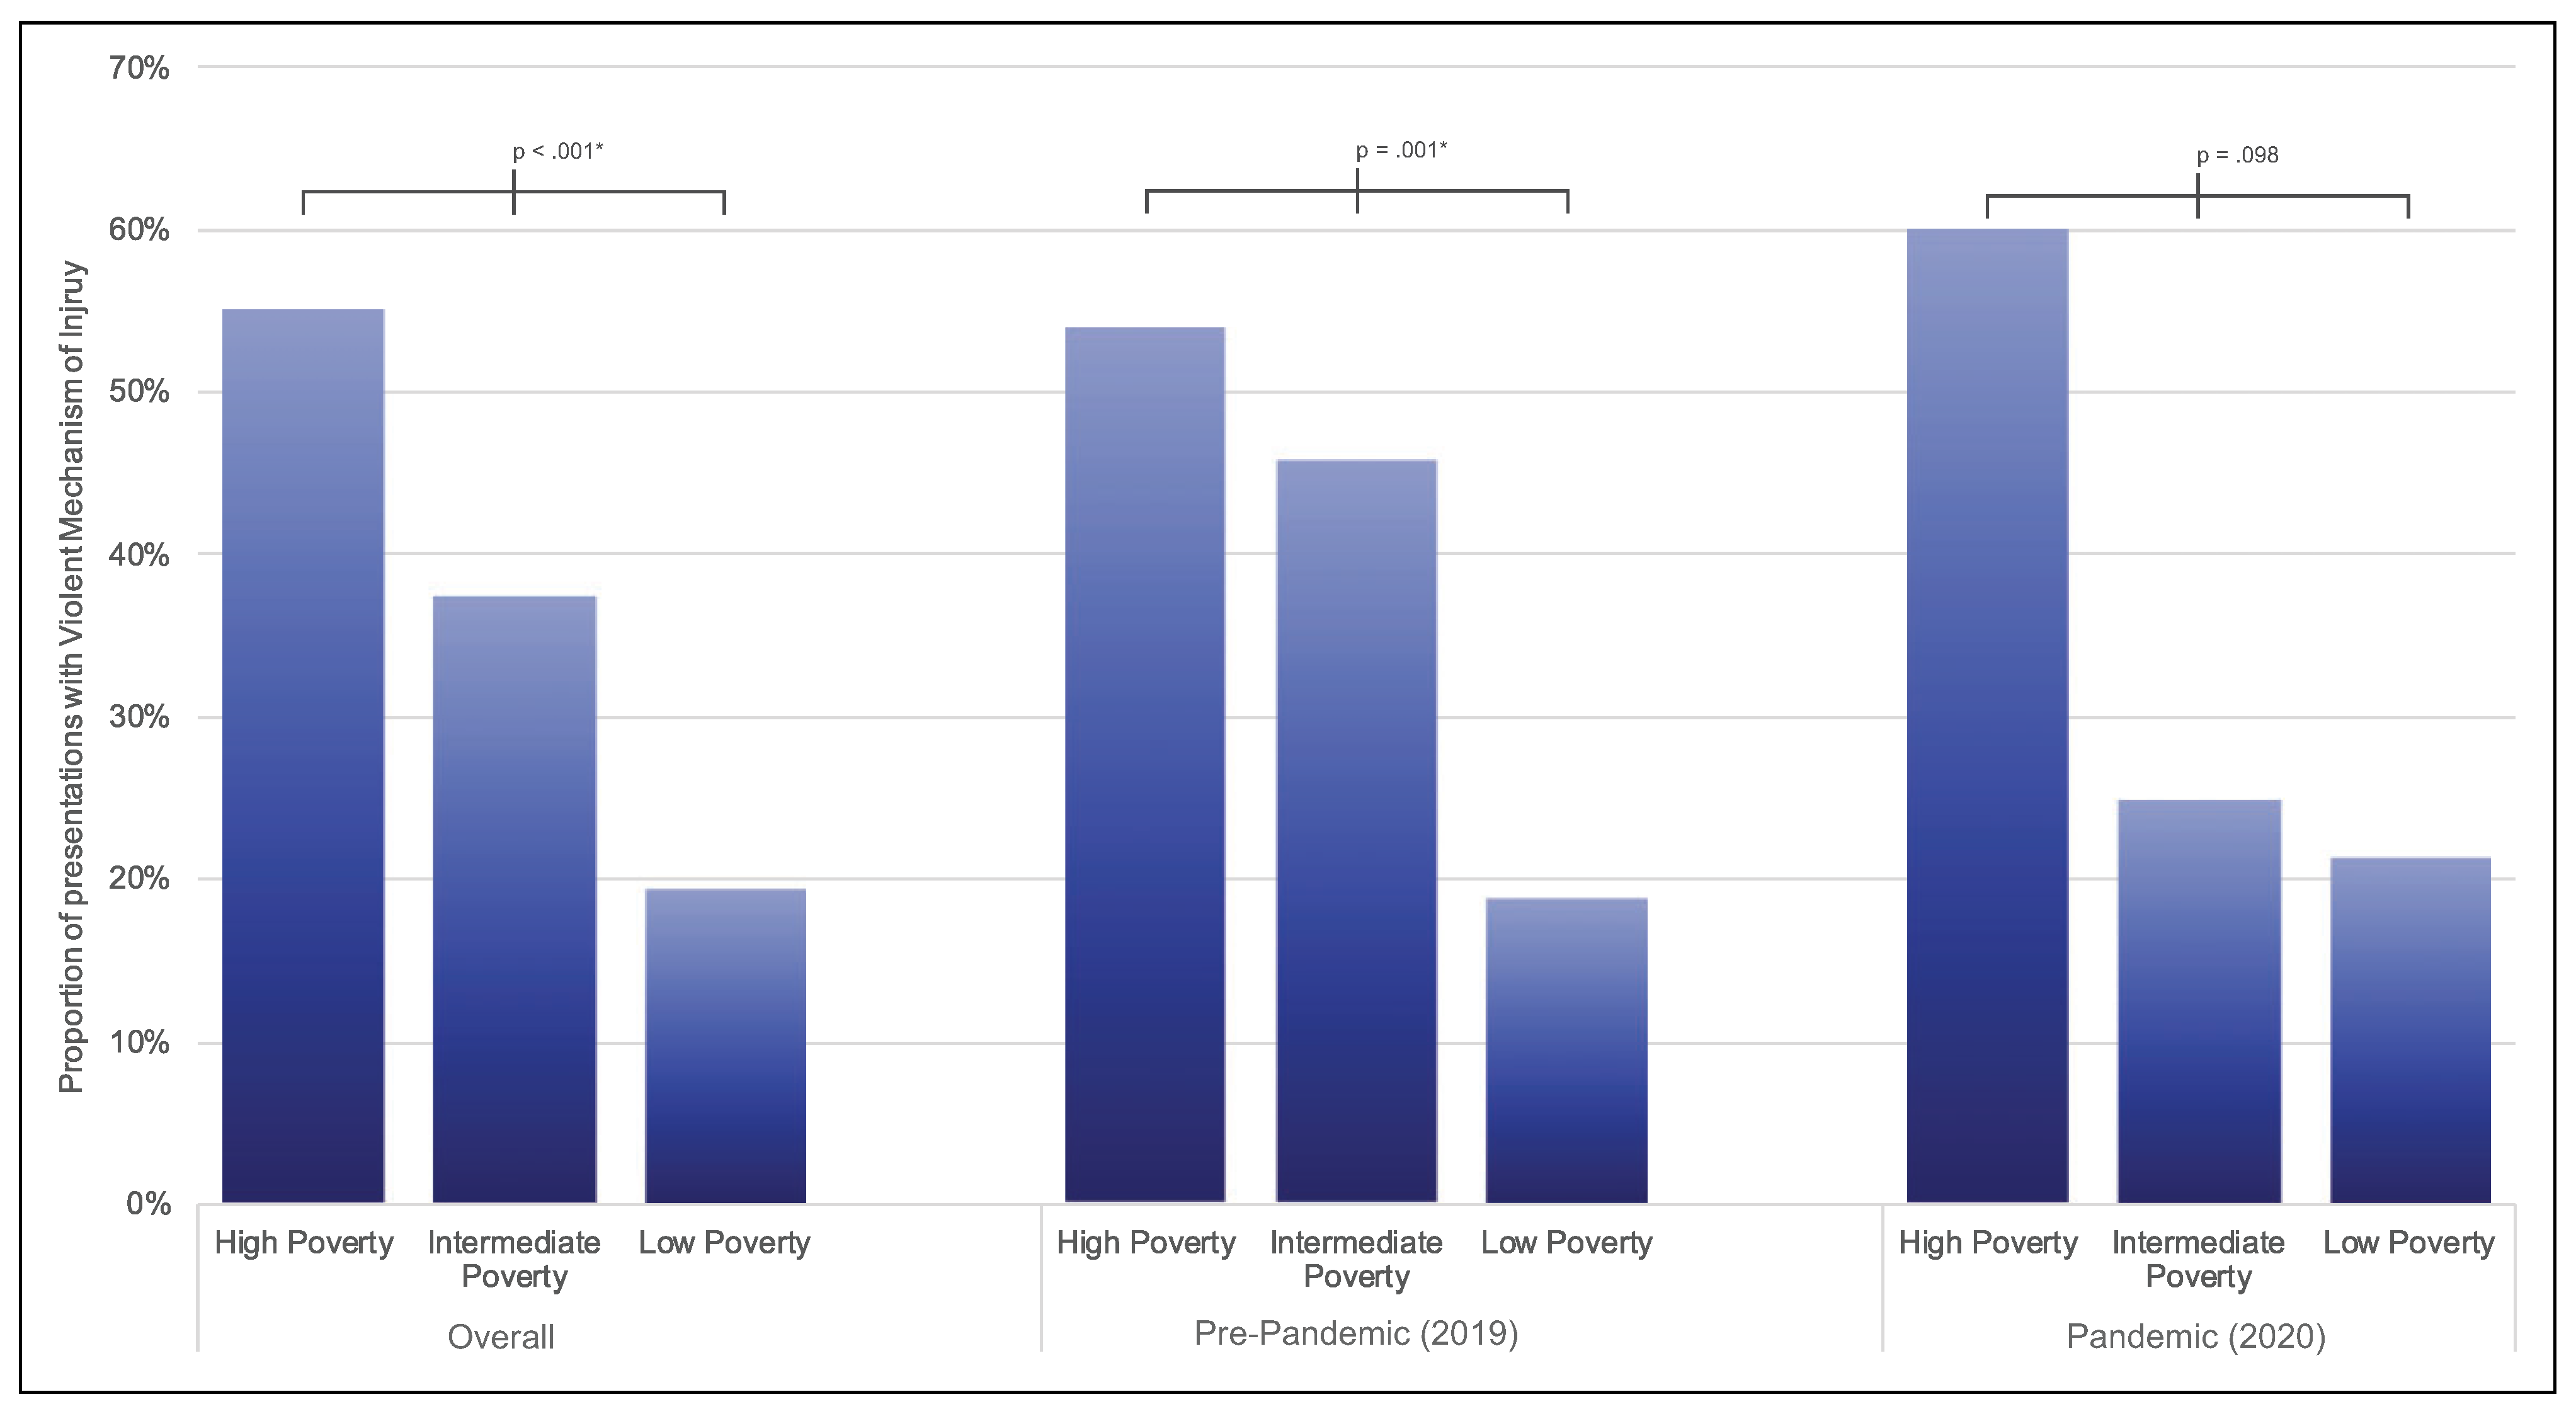
Overall, there was a statistically significant correlation between residence in higher poverty areas and violent MOI (Figure 2). In the high poverty group, 55.0% of CMF fracture presentations were due to violence, as opposed to 37.5% in the intermediate group, and 19.4% in the low poverty group (P < .001). This association held true within the 2019 cohort with 54.0%, 45.8%, and 18.8% violent MOIs in high, intermediate, and low poverty groups respectively (P = .001) but was non-significant in 2020 cohort with 60.0% 25.0%, 21.4% violent MOIs in high, intermediate, and low poverty groups respectively (P = .098).
Poverty index was significantly different between pandemic and pre-pandemic cohorts with significantly fewer presentations from high poverty areas in 2020 than 2019 (P = .026) (Table 1). Overall, 38.3% of presenting subjects lived in low poverty areas, 24.7% in intermediate poverty areas, and 37.0% in high poverty areas. In the pre-pandemic cohort 39.3% lived in low poverty, 19.7% in intermediate poverty, and 41% in high poverty areas. Conversely, in the pandemic cohort 35% of subjects lived in low poverty, while 40% lived in intermediate poverty, and 25% in high poverty areas.
Median subject age was 45 years and gender was 70.3% male with no significant difference between 2019 and 2020 (P = .390, P = .656 respectively). Ethnicity showed borderline non-significant different between cohorts with 57.6% Caucasian subjects overall, 53.6% in 2019 and 70.0% in 2020 (P = .068).
Other analyzed social parameters weren’t significantly different between pandemic and pre-pandemic presentations. Subjects reported being married in 27.3% of presentations overall [2019: 28%, 2020: 25% (P = .711)]. Subjects had private insurance in 38.8% of cases [2019: 37.6%, 2020: 42.5% (n = 17) (P = .580)] and were unemployed in 21.8% of cases [2019: 21.6%, 2020: 22.5% (P = .905)]. Psychiatric history was reported in 17.6% of cases overall [2019: 18.4%, 2020: 15% (P = .623)].
In analysis of injury and management parameters, significant difference between cohorts was found in regard to lower incidence of concurrent bodily injuries with CMF fracture presentation during the pandemic (Table 2). Overall, CMF fracture without other bodily injury was present in 63.6% of presentations. In 2019 CMF fracture was an isolated injury in 58.4% as compared to 80.0% of cases in 2020 (P = .013*).
All other injury details were insignificant between cohorts. Injury occurred at home in 37.6% of cases overall [2019: 34.4%, 2020: 47.5% in 2020 (P = .136)]. Subjects were reportedly intoxicated at time of injury in 27.3% of cases [2019: 30.4%, 2020: 17.5% (P = .111)]. CMF fracture was isolated to a single bone in 44.2% of cases [2019: 46.4% 2020: 37.5% (P = .324)].
No significant difference was found in management parameters between pandemic and pre-pandemic cohorts. Subjects were admitted in 46.7% of cases overall [2019: 44.8%, 2020: 52.5% (P = .396)]. Inpatient surgical intervention was performed in 17% of cases overall [2019: 14.4%, 2020: 25% (P = .120)]. In cases in which inpatient surgical intervention was performed median time from presentation to intervention was 7 days overall, 5 days in 2019, and 9 days in 2020 (P = .109).
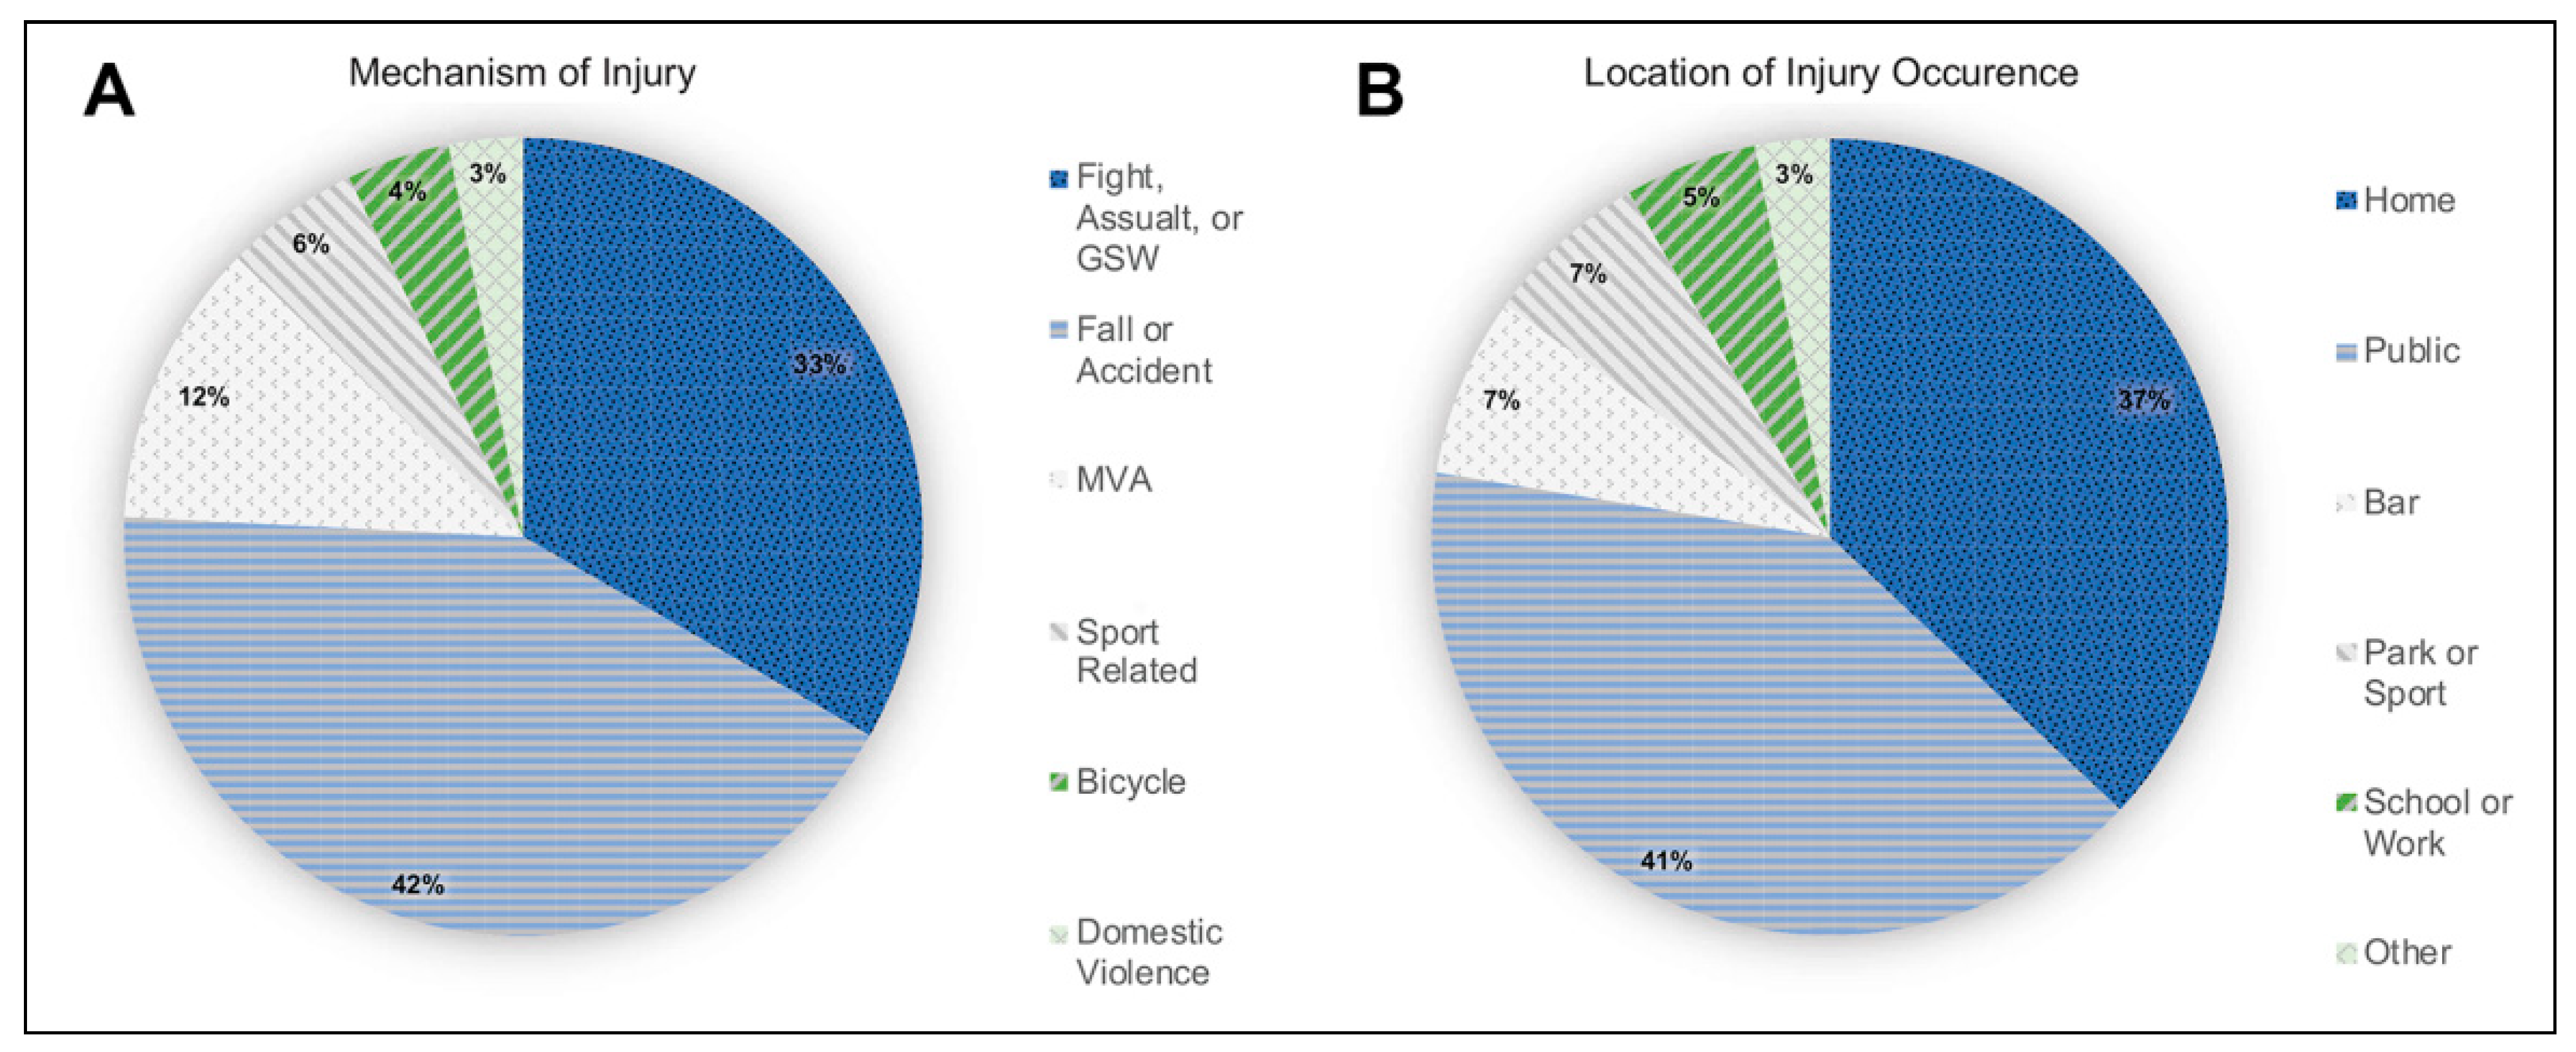
Overall mechanism of injury and location of injury occurrence were further categorized and reported (Figure 3). Injury was most commonly due to fall or accident (42.5%), followed by fight/assault/GSW (33.3%), MVA (11.5%), sport-related (5.5%), bicycle-related (4.2%), and domestic violence (3.0%). Location of injury occurrence (LOI) was most commonly in public (40.6%), followed by home (37.0%), bar (7.3%), park or sport (6.7%), school or work (5.4%), and other (3.0%).

Discussion

Contrary to our hypothesis that the social and societal changes of COVID-19 would disproportionately affect lower SES and marginalized populations, we found that the period of the pandemic did not broadly correlate with statistically significant difference in demographics, injury details, or acute management of craniomaxillofacial trauma presentations. Although most study values were similar between cohorts, there were some differences including in volume of presentation, demographic distribution, mechanism of injury, and concurrent bodily injury. Of initial notability was the large decrease in presentations during the 2020 pandemic period (40 cases) as compared to in 2019 (125 cases). This could reflect a broadly publicized newfound reluctance to access care[21,22,23] or be due to reduced incidence of CMF trauma associated with quarantine measures.[24,25,26]
There was also significant demographic difference between cohorts in poverty index, a study measure designed to distribute cases based on proportion of the population below poverty level in each district of residence. During the pandemic a smaller proportion of subjects presented from high poverty areas than in the year before. This could be explained by decreased infrastructure for health education in impoverished areas creating greater fear of the healthcare system during the pandemic[21,27] or by quarantine measures having some greater effect in high poverty neighborhoods.
We found violent mechanism of injury for craniomaxillofacial trauma to be significantly associated with poverty index of residence. Overall and in 2019, violent mechanism of injury was significantly most frequent in high poverty areas and least frequent in low poverty areas. This association was insignificant in 2020, although a similar trend was indicated. This may be due to the smaller sample size of the pandemic cohort or due to differential effect modifications of quarantine measures on neighborhoods of varying levels of poverty.
Regarding injury and management, significantly more pandemic cohort presentations had isolated CMF fractures without other bodily injury than the pre-pandemic cohort. This association could be related to reduced frequency of high-impact mechanisms such as motor vehicle accidents[28] or sport-related injuries. Despite nearly universal difficulties faced by healthcare systems during the pandemic,[29] analyzed metrics of acute management including proportion of presentations admitted to the hospital, the proportion of surgical interventions, and time from presentation to operation were not significantly different between 2019 and 2020.
Despite showing little difference between pre-pandemic and pandemic CMF fracture presentations, overall cohort data from this study provides demographic and mechanistic information which is relatively underreported in the literature. Demographic analysis showed the average presenting subject to be of the young-adult, unmarried male population. This is in accordance with previously published data.[3] Ethnicity and employment status of presenting subjects were equivalent to that of the population of the area of study[30] Overall mechanism of injury was most commonly due to fall or accident followed closely by interpersonal violence. These 2 mechanisms made up more than 75% of presentations. Location of Injury occurrence was most commonly in public areas followed closely by at home with these 2 locations making up more than 75% of presentations.
Some limitations of this study include a limited period of data collection comparing just 2 years of presentations and a limited distribution of study subjects. We examined subjects presenting to only 1 of 3 major hospital systems in the county. This could introduce selection bias and limit the external validity of the study. Finally, with a determined alpha value of .05, the high number of performed analyses allows for the possibility of falsely significant associations.
This study provides demographic, mechanistic, and acute management data of 165 craniomaxillofacial fracture presentations to a large regional healthcare system during a 2-year period and demonstrates a correlation between level of poverty and violent mechanism of injury. It further compares presentations between pre-pandemic (2019) and pandemic (2020) cohorts showing notable decrease in presentation during the COVID-19 pandemic. Along with this, it found significantly fewer pandemic-era presentations from high poverty areas and a greater prevalence of isolated CMF fractures. These results indicate that, likely through a multifactorial mechanism, the altered social dynamics of 2020 have correlated with some alteration in CMF facture presentations.

Funding

The author(s) received no financial support for the research, authorship, and/or publication of this article.

Authors’ Note

This study was presented at OVSPS, PSTM.

Ethical Approval

This study was approved by the Departmental Institutional Review Board (Study #: STUDY20200851).

Conflicts of Interest

The author(s) declared no potential conflicts of interest with respect to the research, authorship, and/or publication of this article.

References

  1. van den Elzen, M.E.P.; Versnel, S.L.; Hovius, S.E.R.; Passchier, J.; Duivenvoorden, H.J.; Mathijssen, I.M.J. Adults with congenital or acquired facial disfigurement: impact of appearance on social functioning. J Craniomaxillofac Surg. 2012, 40, 777–782. [Google Scholar] [CrossRef] [PubMed]
  2. De Sousa, A. Psychological issues in acquired facial trauma. Indian J Plast Surg. 2010, 43, 200–205. [Google Scholar] [CrossRef] [PubMed]
  3. Allareddy, V.; Allareddy, V.; Nalliah, R.P. Epidemiology of facial fracture injuries. J Oral Maxillofac Surg. 2011, 69, 2613–2618. [Google Scholar] [CrossRef]
  4. Jin, K.-S.; Lee, H.; Sohn, J.-B.; et al. Fracture patterns and causes in the craniofacial region: an 8-year review of 2076 patients. Maxillofac Plast Reconstr Surg. 2018, 40, 29. [Google Scholar] [CrossRef]
  5. Roden, K.S.; Tong, W.; Surrusco, M.; Shockley, W.W.; Van Aalst, J.A.; Hultman, C.S. Changing characteristics of facial fractures treated at a regional, level 1 trauma center, from 2005 to 2010: an assessment of patient demographics, referral patterns, etiology of injury, anatomic location, and clinical outcomes. Ann Plast Surg. 2012, 68, 461–466. [Google Scholar] [CrossRef]
  6. Chrcanovic, B.R. Factors influencing the incidence of maxillofacial fractures. Oral Maxillofac Surg. 2012, 16, 3–17. [Google Scholar] [CrossRef]
  7. Corfield, A.R.; MacKay, D.F.; Pell, J.P. Association between trauma and socioeconomic deprivation: a registry-based, Scotland-wide retrospective cohort study of 9,238 patients. Scand J Trauma Resusc Emerg Med. 2016, 24, 90. [Google Scholar] [CrossRef]
  8. Brattstro¨ m, O.; Eriksson, M.; Larsson, E.; Oldner, A. Socioeconomic status and co-morbidity as risk factors for trauma. Eur J Epidemiol. 2015, 30, 151–157. [Google Scholar] [CrossRef]
  9. Dalstra, J.A.A.; Kunst, A.E.; Borrell, C.; et al. Socioeconomic differences in the prevalence of common chronic diseases: an overview of eight European countries. Int J Epidemiol. 2005, 34, 316–326. [Google Scholar] [CrossRef]
  10. Shaw, K.M. Chronic disease disparities by county economic status and metropolitan classification, behavioral risk factor surveillance system, 2013. Prev Chronic Dis. [CrossRef]
  11. Banerjee, D.; Rai, M. Social isolation in Covid-19: the impact of loneliness. Int J Soc Psychiatry. 2020, 66, 525–527. [Google Scholar] [CrossRef]
  12. Balanzá-Martínez, V.; Kapczinski, F.; de Azevedo Cardoso, T.; et al. The assessment of lifestyle changes during the COVID-19 pandemic using a multidimensional scale. Rev Psiquiatr Salud Ment. 2021, 14, 16–26. [Google Scholar] [CrossRef] [PubMed]
  13. Williams, S.N.; Armitage, C.J.; Tampe, T.; Dienes, K. Public perceptions and experiences of social distancing and social isolation during the COVID-19 pandemic: a UK-based focus group study. BMJ Open. 2020, 10, e039334. [Google Scholar] [CrossRef] [PubMed]
  14. Noman, A.H.M.; Griffiths, M.D.; Pervin, S.; Ismail, M.N. The detrimental effects of the COVID-19 pandemic on domestic violence against women. J Psychiatr Res. 2021, 134, 111–112. [Google Scholar] [CrossRef] [PubMed]
  15. Viero, A.; Barbara, G.; Montisci, M.; Kustermann, K.; Cattaneo, C. Violence against women in the Covid-19 pandemic: A review of the literature and a call for shared strategies to tackle health and social emergencies. Forensic Sci Int. 2021, 319, 110650. [Google Scholar] [CrossRef]
  16. Northern Ohio Data and Information Service. Cleveland State University. Updated February, 2021. Available online: http://levin.urban.csuohio.edu/nodis/maps_thematic.html (accessed on 8 February 2021).
  17. IBM Corp. IBM SPSS Statistics; Version 27.0; IBM Corp, 2020. [Google Scholar]
  18. Microsoft Corp. Microsoft Excel; Microsoft Corp, 2018. [Google Scholar]
  19. Microsoft Corp. Microsoft Powerpoint; Microsoft Corp, 2018. [Google Scholar]
  20. Adobe Inc. Adobe Illustrator; Adobe Systems, 2019. [Google Scholar]
  21. Birkmeyer, J.D.; Barnato, A.; Birkmeyer, N.; Bessler, R.; Skinner, J. The impact of the COVID-19 pandemic on hospital admissions in the United States. Health Aff. 2020, 39, 2010–2017. [Google Scholar] [CrossRef]
  22. Garrafa, E.; Levaggi, R.; Miniaci, R.; Paolillo, C. When fear backfires: emergency department accesses during the Covid-19 pandemic. Health Policy. 2020, 124, 1333–1339. [Google Scholar] [CrossRef]
  23. Wong, L.E.; Hawkins, J.E.; Langness, S.; Murrell, K.L.; Iris, P.; Sammann, A. Where are all the patients? Addressing Covid-19 fear to encourage sick patients to seek emergency care. In NEJM Catalyst Innovations in Care Delivery; Published online May 14, 2020. Available online: https://catalyst.nejm.org/doi/full/10.1056/CAT.20.0193 (accessed on 20 May 2021).
  24. Campedelli, G.M.; Aziani, A.; Favarin, S. Exploring the immediate effects of COVID-19 containment policies on crime: an empirical analysis of the short-term aftermath in Los Angeles. Am J Crim Just. 2020, 1–24. [Google Scholar] [CrossRef]
  25. Payne, J.L.; Morgan, A.; Piquero, A.R. COVID-19 and social distancing measures in Queensland, Australia, are associated with short-term decreases in recorded violent crime. J Exp Criminol 2020, 1–25. [Google Scholar] [CrossRef]
  26. Garude, K.; Natalwala, I.; Hughes, B.; West, C.; Bhat, W. Patterns of adult and paediatric hand trauma during the COVID-19 lockdown. J Plast Reconstr Aesthet Surg. 2020, 73, 1575–1592. [Google Scholar] [CrossRef]
  27. Bozkurt, A.; Jung, I.; Xiao, J.; et al. A global outlook to the interruption of education due to COVID-19 pandemic: navigating in a time of uncertainty and crisis. Asian Journal of Distance Education. 2020, 15, 1–126. [Google Scholar]
  28. Brodeur, A.; Cook, N.; Wright, T. On the effects of COVID-19 safer-at-home policies on social distancing, car crashes and pollution. Journal of Environmental Economics and Management. 2021, 106, 102427. [Google Scholar] [CrossRef] [PubMed]
  29. Rosenbaum, L. The untold toll—the pandemic’s effects on patients without Covid-19. New England Journal of Medicine. 2020, 382, 2368–2371. [Google Scholar] [CrossRef] [PubMed]
  30. U.S. Census Bureau. QuickFacts: Cuyahoga County, OH; United States. Available online: https://www.census.gov/quickfacts/fact/table/cuyahogacountyohio,US/PST045219 (accessed on 20 May 2021).
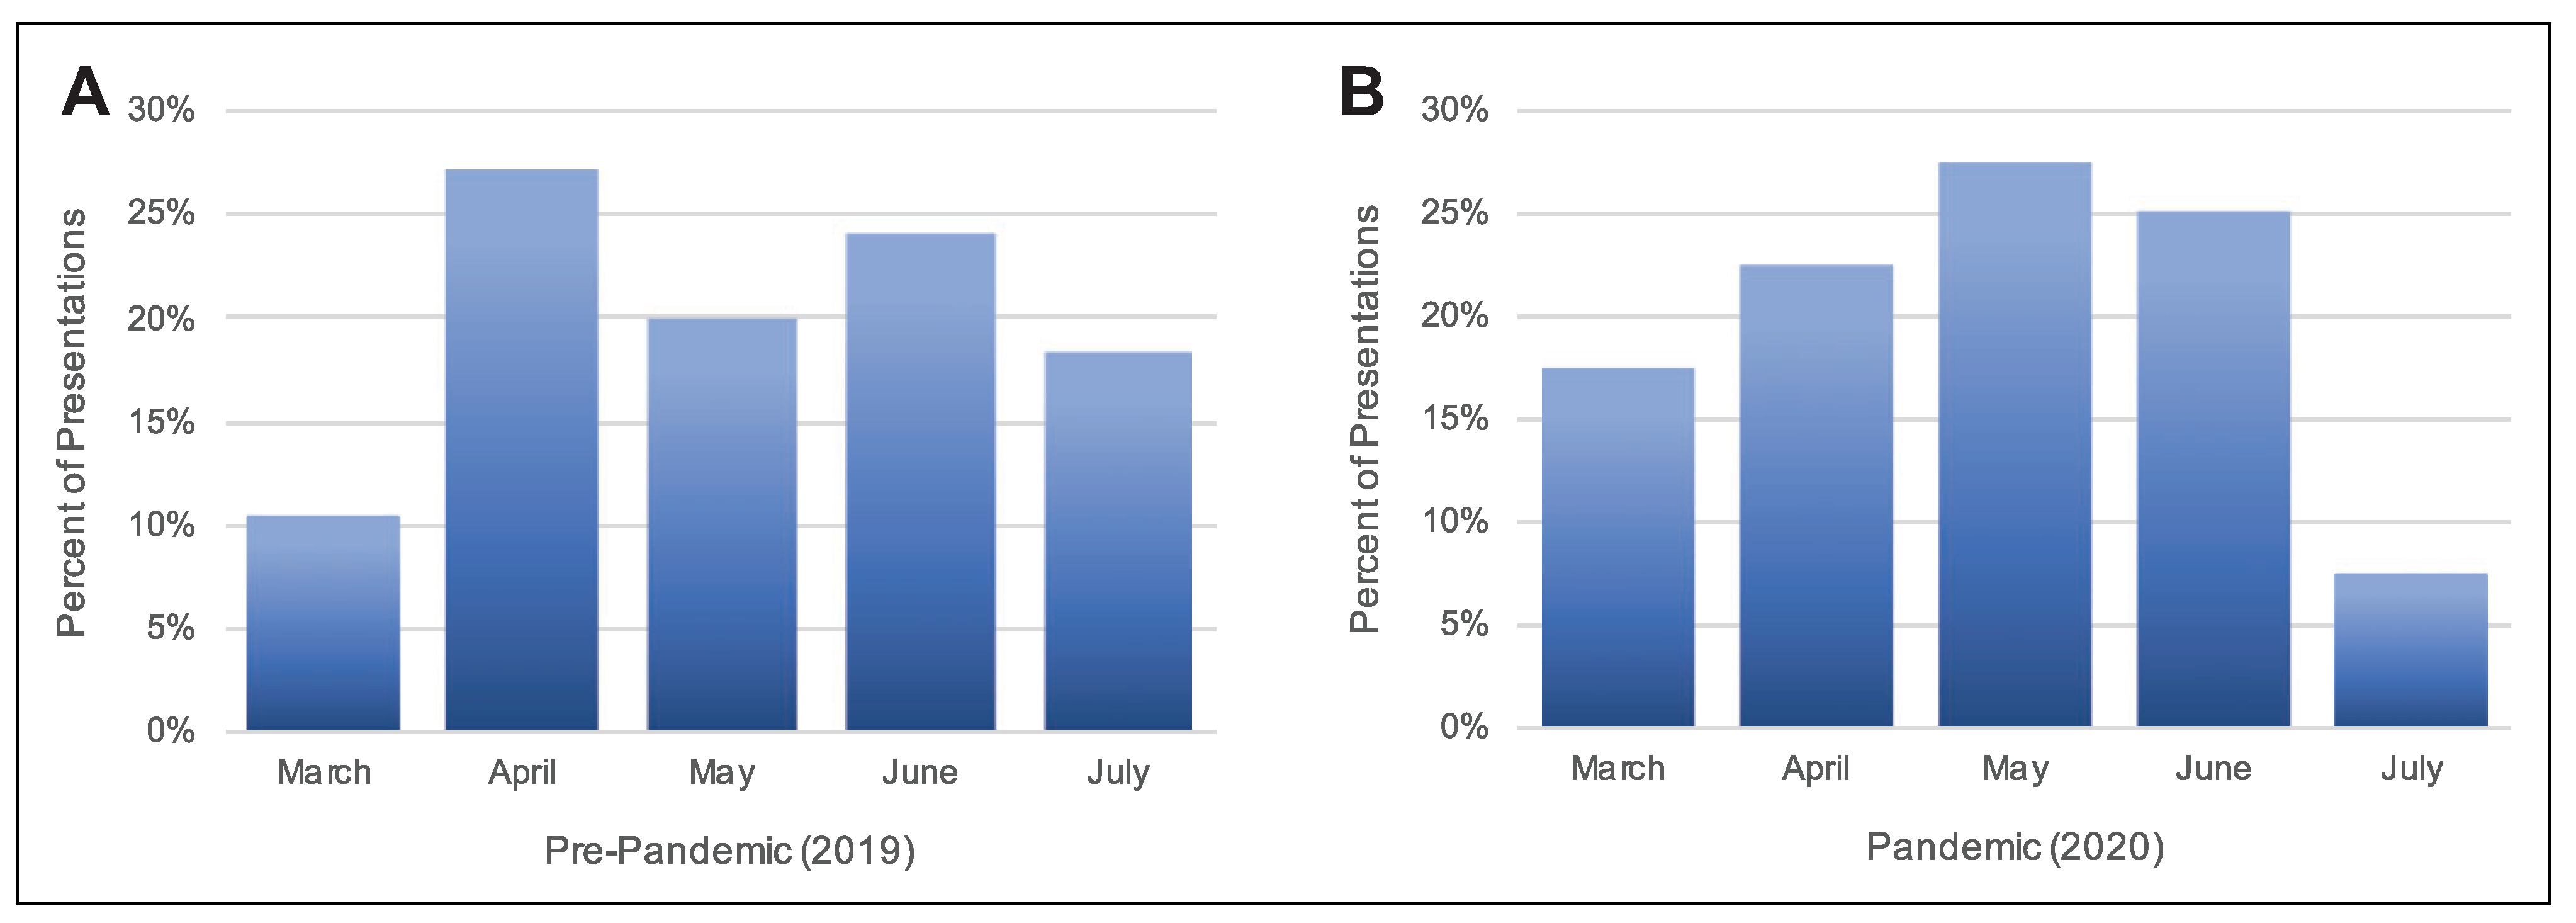
Figure 1. Proportion of subjects presenting per month during the study period of 2019 and 2020. Month of presentation was normally distributed across the period of study in both 2019 and 2020 (Shapiro-Wilks; P = .835 and P = .482 respectively). A, During 2019, 10.4% (13) of subjects presented in March, 27.2% (34) in April, 20.0% (25) in May, 24% (30) in June, and 18.4% (23) in July (P = .835). B, During 2020, 17.5% (7) of subjects presented in March, 22.5% (9) presented in April, 27.5% (11) in May, 25% (10) in June, and 7.5% in July (3) (P = .482).
Cmtr 15 00039 g001
Figure 2. Proportion of presentations with violent mechanism of injury overall, during the pre-pandemic period, and during the pandemic period. High Poverty: area with >25% of population below poverty line. Intermediate Poverty: area with 10.1% to 25% of population below poverty line. Low Poverty: area with ≤10% of population below poverty line. A statistically significant correlation was noted between poverty index and violent mechanism of injury overall and in 2019. A non-significant difference with was noted in 2020. *P-values <.05 were considered statistically significant.
Cmtr 15 00039 g002
Figure 3. Overall cohort categorizations of mechanism of injury and location of injury. A, Mechanism of injury was most commonly due to fall or accident (42%), followed by fight/assault/GSW (33%), MVA (12%), sport related (6%), bicycle-related (4%), and domestic violence (3%). B, Location of injury occurrence was most commonly in public (41%), followed by at home (37%), at a bar (7%), at a park or sport (7%), at school or work (5%), and all other locations (3%). MVA indicates motor vehicle accident.
Cmtr 15 00039 g003
Table 1. Patient Demographics.a.
Total Cohort Pre-Pandemic (2019) Pandemic (2020)
n = 165n = 125 n = 40 Statistics
Detail25th/50th/75th or No. (%)Mean + SD or No. (%)Mean + SD or No. (%)P-value
Age28 y/45 y/67 y27 y/44 y/67 y33 y/51 y/84 y0.390
Male116 (70.3%)89 (71.2%)27 (67.5%)0.656
Caucasian95 (57.6%)67 (53.6%)28 (70.0%)0.068
Married45 (27.3%)35 (28.0%)10 (25.0%)0.711
Private Insurance64 (38.8%)47 (37.6%)17 (42.5%)0.580
Unemployed36 (21.8%)27 (21.6%)9 (22.5%)0.905
Psychiatric History29 (17.6%)23 (18.4%)6 (15.0%)0.623
≤10% Poverty62 (38.3%)48 (39.3%)14 (35.0%)0.026*
10.1-25% Poverty40 (24.7%)24 (19.7%)16 (40.0%)
>25% Poverty60 (37.0%)50 (41.0%)10 (25.0%)
aDemographic details of overall cohort and pre-pandemic and pandemic subsets. Poverty index designations refer to proportion of population below poverty level in the study subject’s area of residence. Significant difference was noted in poverty index between 2019 and 2020 with a smaller proportion of subjects presenting from high poverty areas during 2020. Patient age was abnormally distributed (Shapiro-Wilks P < .05, MannWhitney U test statistic). All other variables were categorical (Pearson Chi-Squared test statistic). The statistics column demonstrates results of analysis comparing the 2019 and 2020 cohorts. *P-values <.05 were considered statistically significant.
Table 2. Injury Details.a.
Total Pre-Pandemic (2019) Pandemic (2020)
Cohort n = 165n = 125n = 40Statistics
Detail25th/50th/75th or No. (%)25th/50th/75th or No. (%)25th/50th/75th or No. (%)P-value
Injury at Home62 (37.6%)43 (34.4%)19 (47.5%)0.136
Intoxication45 (27.3%)38 (30.4%)7 (17.5%)0.111
Violent MOI60 (36.4%)47 (37.6%)13 (32.5%)0.559
Isolated Fracture73 (44.2%)58 (46.4%)15 (37.5%)0.324
Isolated Injury105 (63.6%)73 (58.4%)32 (80.0%)0.013*
Hospital Admission77 (46.7%)56 (44.8%)21 (52.5%)0.396
Surgical Intervention28 (17.0%)18 (14.4%)10 (25.0%)0.120
Time to Operation1 d/7 d/11 d1 d/5 d/10 d6 d/9 d/12 d0.109
Abbreviation: MOI, mechanism of injury. aInjury details of overall cohort and pre-pandemic and pandemic subsets. Significant difference was noted in proportion of isolated CMF fracture without other bodily injury between 2019 and 2020 with a larger proportion of subjects presented with isolated injury in 2020. Time from presentation to operation was abnormally distributed (Shapiro-Wilks P < .05, Mann-Whitney U test statistic). All other variables were categorical (Pearson Chi-Squared test statistic). The statistics column demonstrates results of analysis comparing the 2019 and 2020 cohorts. *P-values <.05 were considered statistically significant.