Communication

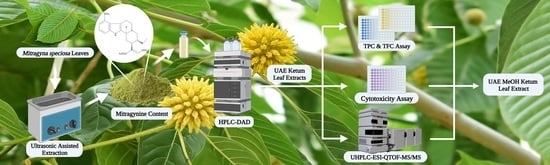
RP-HPLC-DAD Analysis of Mitragynine Content in Mitragyna speciosa Korth. (Ketum) Leaf Extracts Prepared Using Ultrasound Assisted Extraction Technique and Their Cytotoxicity

by
Thiruventhan Karunakaran
1,2,*,
Yong Sean Goh
1,
Rameshkumar Santhanam
3,
Vikneswaran Murugaiyah
1,4,
Mohamad Hafizi Abu Bakar
5 and
Surash Ramanathan
1
1
Centre for Drug Research, Universiti Sains Malaysia, Pulau Pinang 11800 USM, Malaysia
2
School of Chemical Sciences, Universiti Sains Malaysia, Pulau Pinang 11800 USM, Malaysia
3
Faculty of Science and Marine Environment, Universiti Malaysia Terengganu, Kuala Nerus 21030, Terengganu, Malaysia
4
School of Pharmaceutical Sciences, Universiti Sains Malaysia, Pulau Pinang 11800 USM, Malaysia
5
Bioprocess Technology Division, School of Industrial Technology, Universiti Sains Malaysia, Pulau Pinang 11800 USM, Malaysia
*
Author to whom correspondence should be addressed.
Separations 2022, 9(11), 345; https://doi.org/10.3390/separations9110345
Submission received: 12 October 2022 / Revised: 30 October 2022 / Accepted: 2 November 2022 / Published: 3 November 2022
(This article belongs to the Special Issue Novel Approach for Natural Product Separation from Plants)

Abstract

:
Mitragynine and its congeners are one of the major phytoconstituents present in Mitragyna speciosa Korth. (ketum) leaves and a well-known factor that contributes to ketum’s pharmacological activities. This study describes the usage of a green extraction method to yield botanical leaf extracts of ketum. The leaf extracts were assessed for mitragynine content, total phenolic and flavonoid content, and cytotoxicities. The Ultrasound Assisted Extraction (UAE) method showed a varying dry yield of the extracts (0.22–1.92 g) that were obtained with solvents of variable polarities. However, the mitragynine content was consistent among the organic solvent extracts (7.22–9.40%). This method calls for a minimal extraction solvent volume (solid to solvent ratio, 1:30) and a shorter extraction period (20 min). Of the solvents tested, the methanolic extract showed the highest content of total phenolic (419.50 ± 2.50 GAE mg/g) and flavonoids (177.33 ± 3.00 QE mg/g). The extract was nontoxic towards kidney (HEK-293) and Chang liver (HeLa) cell lines. Analysis via UHPLC-ESI-QTOF-MS/MS made it possible to identify mitragynine congeners, such as mitragynine, paynantheine, and speciociliatine, in the leaves extract. In conclusion, the UAE method using methanol as the extraction solvent provides a noncytotoxic ketum botanical extract for future preclinical and clinical studies.

Graphical Abstract

1. Introduction

Mitragyna speciosa Korth. (Rubiaceae) is a medicinal plant native to Southeast Asia, and it is primarily found in northern Malaysia and southern Thailand. It is used by local residents to relieve fatigue and opioid addiction withdrawal [1,2]. Ketum leaves are reported to have stimulant effects similar to cocaine when they are used at small doses, but they have morphine-like sedative and narcotic effects at large doses [3,4]. Ketum leaves have been shown to contain chemical components from a variety of phyto-chemical categories, including alkaloids, triterpenoids, saponins, flavonoids, and its glycoside. [5]. This plant has been used in local folklore medicine, especially in Malay traditional medicine, to treat diseases, such as fever, malaria, diarrhoea, cough, and expulsing worms [6,7].
Ultrasound-assisted extraction (UAE), also known as ultrasonic extraction, is a commonly used technique during the extraction of natural products, especially in the herbal extraction process. UAE utilizes ultrasound to break down cell walls to extract the active constituents from the plant. The utilization of ultrasound during the extraction enhances heat transfer and penetration of the solute, improving extraction efficiency [8,9]. Advantages of UAE include moderate solvent usage and less time needed for extraction. Additionally, UAE is suitable for unstable and heat-sensitive compounds [10]. From previous studies, UAE has been used for the extraction of ketum leaves. [11,12,13,14].
In this work, we focus on increasing the understanding of the extraction of chemical constituents from ketum leaves utilizing the UAE approach in combination with solvents, including methanol, ethanol, ethyl acetate, and water. The impact of the UAE method utilizing various solvents on the extraction yield, mitragynine content, total phenolic and flavonoid content, and cytotoxicity of UAE ketum leaf extracts is discussed.

2. Materials and Methods

2.1. Chemicals

Chemicals and reagents employed in this work were purchased from the suppliers and manufacturers mentioned in our previous literatures [15], which can be found in the Supplementary Table S1.

2.2. Analytical Instruments

RP-HPLC (Gradient-mode) analysis was conducted using the Agilent 1200 Series HPLC System (Santa Clara, CA, USA) coupled with a diode array detector (DAD). The system consists of an autosampler injector, a column oven, solvent reservoirs, and a quaternary pump. For data analysis, Chemstation LC3D software (Agilent Technologies, Santa Clara, CA, USA) was utilized. Chromatographic separation was carried out using the Agilent Zorbax Eclipse Plus C18 (4.6 × 150 mm, 3.5 μm) (Agilent Technologies, Santa Clara, CA, USA) column at 25 °C (r.t). The mobile phase preparation was prepared accordingly, as stated in the previous report [15]. The analysis ran for 18 min (total run time) with mitragynine eluted at 10.24 min. The injection volume was set at 10 μL, and the chromatograms were observed at a wavelength of 254 nm. Characterization of the isolated mitragynine was carried out using an Agilent GC 6890N MS 5973i spectrometer with the assistance of MSD Chemstation software (Agilent Technologies, Santa Clara, CA, USA). 1H -NMR and 13C-NMR spectra were analyzed using BRUKER ASCENDTM 700 MHz and 175 MHz spectrometers (Karlsruhe, Germany), respectively. A UHPLC-QTOF-MS instrument (Agilent 1290 Infinity and 6550 iFunnel, Santa Clara, CA, USA) and a dual AJS ESI detector were used to identify the chemical profiles of the UAE MeOH ketum leaves extract using the positive ion mode. The instrument also consisted of a binary pump, a column compartment (thermostatically controlled), a HiP sampler, and a diode array detector (DAD). The sample were filtrated via a nylon filter (0.45 μm). The scanning range MS/MS in the positive mode of ionisation was 100–1700 m/z. Separation was achieved through a C18 column (4.6 × 100 mm, 3.5 μm–Agilent Zorbax Eclipse Plus). The gradient mobile phase used consisted of Solvent A–0.1% formic acid + water and Solvent B–acetonitrile, flow rate–1.0 mL/min and injection volume–10 μL. The gradient elution program was set to 10% B (0 to 10.5 min), 45% B (10.5–12 min), 70% B (12–16 min), and 10% B (16–18 min). The source parameter was set at a gas temperature of 200 °C, with the gas flow at 14 L/min, the nebulizer at 35 psig, the sheat gas temperature at 350 °C, and the sheat gas flow at 11 L/min. Data analysis and interpretation utilized the MassHunter Qualitative Analysis-Metlin Database (Agilent Technologies, Santa Clara, CA, USA). The resolved peaks were analyzed in detail with the assistance of the reported data from previous reports [15,16].

2.3. Plant Material

Fresh ketum leaves (1 kg) were collected from the district of Permatang Pauh, Penang, Malaysia. The leaves were identified and confirmed by an expert botanist, Dr. Rosazlina Binti Rusly, from the School of Biological Sciences, University Science Malaysia (USM), Malaysia. The voucher specimen No. is 11074.

2.3.1. Preparation of Plant Extracts

Collected leaves were air-dried and powdered. Then, 10 g of ground Ketum leaves powder were soaked in 300 mL of solvent and sonicated for 20, 40, and 60 min using a Branson 5510R-MT Ultrasonic extraction chamber with an output of 40 kHz and 135 W, following protocol [13], but with slight modifications. The temperature of the water bath was measured using a thermometer and maintained at 60 °C. Ketum leaves powder was further extracted with water, methanol, ethanol, or ethyl acetate for the optimized extraction time. The extracts were filtered using a vacuum pump, and solvent was removed under vacuum. Each extraction was repeated in triplicate, and they were then freeze-dried and kept frozen for further analysis.

2.3.2. Isolation and Quantification of the Mitragynine

Mitragynine with 98% peak purity was isolated and quantified following the procedures described by Goh et al. [15]. The peak purity UV spectrum (HPLC-DAD) is provided as Figure S1 in the Supplementary Materials. The spectroscopic characterization of mitragynine using GCMS, 1D NMR were published in [15].

2.4. Total Phenolic Flavonoid Content Analysis

2.4.1. Total Phenolic Contents (TPC)

TPC of ketum leaf extracts were carried out by following the FC method from [17]. Samples (1 mg/mL,100 µL) were prepared in 95% ethanol and then mixed in a 2% Na2CO3 solution (2 mL) and kept in the dark for 5 min. Then, 100 μL of FC reagent was added to each extract. The mixture was then incubated for a further 30 min in a dark room, and the absorbance value of 750 nm was determined using a microplate reader (Multiskan Go spectrophotometer, Thermo Scientific, Waltham, MA, USA). The total phenolic content present in the sample was determined using the standard calibration curve, which was obtained using gallic acid (25–800 µg/mL) as the standard. The results were expressed as GAE mg/g.

2.4.2. Total Flavonoid Contents (TFC)

TFC evaluation in ketum leaves extract was evaluated according to the aluminium chloride colorimetric method published by [17], with slight modifications. A standard curve for TFC was produced using quercetin (Sigma-Aldrich Co., St. Louis, MO, USA) (6.25–200 µg/mL). Each tested sample was prepared in 95% ethanol. Following that, the tube was filled with the sample (100 μL), 30% ethanol (1133 µL), 0.5 M of NaNO2 solution (50 μL) and 0.3 M of AlCl3.6H2O (50 μL) solution. Following a five-minute dark incubation period, 1 M NaOH solution (333 µL) was added to the mixture. All the reagents were included in the “blank”, except AlCl3.6H2O. The absorbance was analyzed at 415 nm using the same microplate reader. The results were expressed as QE mg/g.

2.5. Cell Cultures and Conditions

HeLa Chang liver cells (HeLa) (ATCC CCL-13) and Human embryonic kidney (HEK-293) (ATCC CRL-1573), as mentioned in our previous literature [15], were provided by Professor Dr. Sharif Mansor from the Centre for Drug Research, Universiti Sains Malaysia [18]. Both cells were grown in EMEM supplemented with 10% FBS and 1% penicillin/streptomycin in a humid environment with 5% CO2 at 37 °C.

2.5.1. Preparation of Extracts and Cell Treatment

Various concentration range of samples (from 7.8125 µg/mL to 500 µg/mL) were prepared from the stock solution (1 mg/mL of UAE ketum leaf extracts) dissolved in 1000 µL of EMEM media [18].

2.5.2. MTT Cell Viability Assay

Cells were grown until they were 70–80% confluent and then centrifuged for 3 min at 1200 rpm/25 °C. The cells were seeded into 96 well plates (1 × 10⁵ cells/100 µL). After 24 h of incubation (5% CO2) at 37 °C, the cells were treated with 100 µL of different concentrations of UAE ketum leaves extract/positive controls and left for 20 h in the CO2 incubator. Finally, 20 µL of MTT reagent (5 mg/mL) was added to each well and further incubated for 4 h. Then, the media were removed, and the formed formazan crystals were dissolved using DMSO (100 µL). After 15 min of incubation in a dark place, the absorbance was measured using a microplate reader at 570 nm. The formula below was utilized to calculate cell viability:
C e l l   v i a b i l i t y = A b s o r b a n c e   o f   t r e a t e d   c e l l s A b s o r b a n c e   o f   u n t r e a t e d   c e l l s × 100 %  

2.6. Statistical Analysis

Triplicates of each experiment were run. The GraphPad Prism software, version 6.0, was used for the statistical analyses, which included one-way analysis of variance (ANOVA) and Dunnett’s test. A p-value < 0.05 was considered significantly different.

3. Results

The HPLC-DAD assay of mitragynine was validated following the method outlined in a previous report [6]. The calibration curve of mitragynine was linear, in the range from 3.125 to 100 µg/mL, with a coefficient correlation of more than 0.99. The linear regression equation was y = 21.78 x − 13.04. The LOD and LOQ values were 0.63 μg/mL and 2.10 μg/mL, respectively. The quantification range and the limit obtained through the study was sufficient to quantify the mitragynine content in the UAE ketum leaf extracts.
Water was initially employed as the extraction solvent to extract ketum leaves using the UAE method, with the time points being 20, 40, and 60 min. Nevertheless, there were no distinct changes observed in the dry yield (1.80–2.24 g) or the mitragynine content (2.27–2.41%) (see Table 1). Apart from those findings, there were no significant differences observed in the dry yields nor the mitragynine contents when the extraction duration of UAE was increased up to 60 min. Hence, a 20 min extraction time was selected for the UAE technique to be further studied using different solvents.
The extraction of ketum leaves was carried out using selected organic solvents of differing polarities (see Table 2). This extraction resulted in the dry yield and the mitragynine content of the the UAE leaf extracts ranging from 0.22 to 1.92 g and 7.22 to 9.40%, respectively. The HPLC chromatograms of the analyzed leaf extracts are shown in Figure 1. Despite the fact that the dry yield percentage varies between the extracts, the mitragynine percentages were reconcilable, and no significant difference was observed in the respective organic solvent extracts.
The TPC and TFC for the UAE ketum leaf extracts were established. The UAE MeOH ketum leaves extract had the highest TPC (419.50 ± 2.50 GAE mg/g) and TFC (177.33 ± 3.00 QE mg/g) compared to the other UAE ketum leaf extracts (see Table 3 and Table 4).
The cytotoxicity of the extracts, mitragynine, and positive control was evaluated on the respective cell lines, and all the tested samples showed high IC50 values against HEK-293 and HeLa cell lines shown in Table 5. All the UAE ketum leaf extracts were non-cytotoxic to HEK-293 and HeLa cell lines at low concentrations < 62.5 µg/mL. However, as the concentration increased (> 62.5 µg/mL) in a dose dependent manner, the cell viability decreased (Figure 2 and Figure 3). Similar pattern of results were seen in the extracts obtained via the accelerated solvent extraction (ASE) technique [15].
Five mitragynine congeners were identified tentatively through UHPLC-ESI-QTOF-MS/MS chemical profiling analysis on UAE MeOH ketum leaves extract, and the result was matched with the MassHunter Qualitative Analysis-Metlin Database and compared to previous literatures [5,15,16]. Table S2 summarizes the indole alkaloids, which are mainly mitragynine congeners. The chemical structures of the tentatively identified mitragynine congeners reported in Table S2 are shown in Figure 4. The identification of these phytoconstituents was confirmed with the published literatures [5,15,16].

4. Discussion

The extraction conditions, the type of solvents, and the techniques used play vital roles in the extraction of phytochemicals and their compositions in studied plants [13,19]. The solvent extraction technique is one of the most crucial steps in the preparation of the sample for natural product analysis, particularly for herbal extracts. UAE is one of the advanced extraction techniques used in the current herbal extraction techniques [9,13]. Advantages of the UAE technique include moderate solvent usage and less time consumption. UAE utilizes ultrasound to disrupt the cell walls in order to extract active constituents from the plant, and it is frequently used in the extraction of natural products.
The extraction time in the UAE approach was optimized and set at 20 min. This is because after the samples were extracted using water as a solvent at three distinct points, no notable changes in the mitragynine content and the dry yield were observed. The UAE technique was further tested for its extraction efficacy in terms of dry yield and mitragynine content by employing solvents, including water, MeOH, EtOH, and EtOAc. The UAE technique produced 0.22–1.92 g of dry yield and a mitragynine content of 7.22–9.40%. The optimized UAE technique successfully yielded higher mitragynine content compared to previous studies by [6] (1.96%).
The phytochemical properties of these UAE ketum leaf extracts were also determined in terms of their TPC and TFC. Relatively higher TPC values were encountered for UAE leaf extracts. The TPC values of MeOH (419.50 ± 2.50 GAE mg/g), EtOH (295.75 ± 1.25 GAE mg/g), and EtOAc (224.08 ± 0.59 GAE mg/g) organic solvent leaf extracts were relatively higher than the value of the aqueous leaves extract (192.83 ± 4.17 GAE mg/g) (refer to Table 3). As for TFC, the value of the EtOH extract (148.17 ± 2.20 QE mg/g) was lower than the other two organic solvent leaf extracts (EtOAc: 181.50 ± 2.89 QE mg/g and MeOH: 177.33 ± 3.00 QE mg/g), but it was still significantly higher than the aqueous leaves extract (69.00 ± 2.89 QE mg/g) (refer to Table 4). With a few exceptions for the UAE method, organic solvent leaf extracts had better TFC and TPC values than the aqueous leaves extract. These results show that methanol in combination with the UAE extraction technique is the best approach to enrich the yielded extracts with high phenolics and flavonoids content from ketum leaves. Polar organic solvents, such as methanol and ethanol, may interact with more polar and semi-polar phenolics and facilitate the diffusion of high molecular weight phenolics from the plant matrix [8,20,21]. It can be safely deduced that the UAE ketum organic solvent leaf extracts might show good antioxidant properties based on the results obtained from the phenolics and flavonoids content [22,23].
All extracts of UAE ketum leaves were tested in concentrations that ranged from 7.8125 to 500 µg/mL against HEK-293 and HeLa cell lines where mitragynine and doxorubicin were used as positive controls. The cytotoxicity exhibited by UAE MeOH (>100 µg/mL) and aqueous (>100 µg/mL) ketum leaf extracts were considered to be non-cytotoxic compared to the UAE EtOAc (<100 µg/mL) and EtOH (<100 µg/mL) ketum leaf extracts. The American National Cancer Institute guideline states that an extract or compound is toxic only if the IC50 value of the pure compound is less than 4 µg/mL or 10 µM and the extract is less than 30 µg/mL [17,24]. Thus, it can be safely deduced that UAE aqueous and MeOH ketum leaf extracts are non-cytotoxic. The UAE MeOH ketum leaf extract had reasonable amounts of TPC and TFC, and subsequently, the phenolics and flavonols especially might contribute to the low cytotoxicity against HeLa Chang liver and HEK-293 kidney cell lines [15,25]. Whereas in the UAE aqueous extract, low contents of mitragynine and perhaps other minor alkaloids might contribute to the low cytotoxicity effect. In the present study, UHPLC-ESI-QTOF-MS/MS natural product analysis and spectral matching showed that mitragynine congeners were the major constituents profiled in the UAE MeOH ketum leaves extract [15]. To extract alkaloids from ketum leaves, especially mitragynine and its diastereomers, this approach could be considered as an alternative method. Based on the overall results obtained, the UAE technique, coupled with MeOH as an extraction solvent, provide a non-cytotoxic and phenolics- and flavonoids-enriched ketum botanical extract.

5. Conclusions

An effective UAE technique was developed to extract ketum leaves for its further preclinical assessment. The method produced a dry yield of 0.22–1.92 g in a short time (20 min) with a low amount of solvent usage (<300 mL). In this ketum study, the UAE technique produced constant values of mitragynine content in the organic solvent extracts (7.22–9.40%), despite the usage of differing polarity solvents in the extraction of the ketum leaves. UAE methanol ketum leaves extract was non-cytotoxic (IC50 > 100 μg/mL) towards HeLa and HEK-293 cell lines. In conclusion, UAE methanol ketum leaves extract could be further developed for future preclinical and clinical assessments, especially in detail toxicity and antinociceptive assessments.

Supplementary Materials

The following are available online at https://www.mdpi.com/article/10.3390/separations9110345/s1, Figure S1: Peak purity UV spectrum (HPLC-DAD) of isolated mitragynine, Table S1: Chemicals and Reagents, Table S2: MS/MS data of mitragynine congeners identified tentatively in UAE MeOH ketum leaves extract using UHPLC-ESI-QTOF-MS/MS.

Author Contributions

T.K.: supervision, conceptualization, methodology, investigation, formal analysis, data curation, writing, validation, and funding acquisition. Y.S.G.: writing, conceptualization, formal analysis, investigation, and resources. R.S.: conceptualization, formal analysis, validation, and resources. V.M.: co-supervision, conceptualization, formal analysis, investigation, and data curation. M.H.A.B.: conceptualization, formal analysis, validation, and resources. S.R.: co-supervision, writing, conceptualization, investigation, formal analysis, and data curation. All authors have read and agreed to the published version of the manuscript.

Funding

The Malaysian Ministry of Higher Education, through the Fundamental Research Grant Scheme (FRGS-1/2020), with project code FRGS/1/2020/STG04/USM/02/6; the HICoE programme, 311/CDADAH/4401009; and the University of Sains Malaysia (USM), through the Short-Term Grant (STG), 304/CDADAH/6315366, funded the research projects carried out by Thiruventhan Karunakaran and coresearchers on M. speciosa (ketum).

Institutional Review Board Statement

Not applicable.

Informed Consent Statement

Not applicable.

Data Availability Statement

Not applicable.

Acknowledgments

The authors would like to thank Malaysian Ministry of Higher Education under Fundamental Research Grant Scheme (FRGS-1/2020) with project code, FRGS/1/2020/STG04/USM/02/6 and Centre for Drug Research, Universiti Sains Malaysia (USM) for providing us excellent research facilities and good financial supports. HICoE programme (311/CDADAH/4401009) under the Malaysian Ministry of Higher Education is acknowledged for their support in the research project conducted.

Conflicts of Interest

The authors declare no conflict of interest.

References

  1. Singh, D.; Chear, N.J.Y.; Narayanan, S.; Leon, F.; Sharma, A.; McCurdy, C.R.; Avery, B.A.; Balasingam, V. Patterns and reasons for kratom (Mitragyna speciosa) use among current and former opioid poly-drug users. J. Ethnopharmacol. 2020, 249, 112462. [Google Scholar] [CrossRef] [PubMed]
  2. Karunakaran, T.; Ngew, K.Z.; Zailan, A.A.D.; Jong, V.Y.M.; Abu Bakar, M.H. The chemical and pharmacological properties of mitragynine and its diastereomers: An insight review. Front. Pharmacol. 2022, 13, 805986. [Google Scholar] [CrossRef] [PubMed]
  3. Vicknasingam, B.; Narayanan, S.; Beng, G.T.; Mansor, S.M. The informal use of ketum (Mitragyna speciosa) for opioid withdrawal in the northern states of peninsular Malaysia and implications for drug substitution therapy. Int. J. Drug Policy 2010, 21, 283–288. [Google Scholar] [CrossRef] [PubMed]
  4. Ilmie, M.U.; Mansor, S.M.; Abdullah, J.M. Behavioural and electrophysiological evidence of impaired learning and memory in male sprague dawley rats following subchronic exposure to standardized methanolic extract of Mitragyna speciosa Korth. Malays. J. Med. Sci. 2015, 22, 45–51. [Google Scholar] [PubMed]
  5. Raffa, R.B. Kratom and Other Mitragynines: The Chemistry and Pharmacology of Opioids from a Non-Opium Source; CRC Press: Boca Raton, FL, USA, 2015. [Google Scholar]
  6. Parthasarathy, S.; Ramanathan, S.; Murugaiyah, V.; Hamdan, M.R.; Said, M.I.M.; Lai, C.S.; Mansor, S.M. A simple HPLC–DAD method for the detection and quantification of psychotropic mitragynine in Mitragyna speciosa (ketum) and its products for the application in forensic investigation. Forensic Sci. Int. 2013, 226, 183–187. [Google Scholar] [CrossRef]
  7. Hassan, Z.; Muzaimi, M.; Navaratnam, V.; Yusoff, N.H.; Suhaimi, F.W.; Vadivelu, R.; Vicknasingam, B.K.; Amato, D.; von Hörsten, S.; Ismail, N.I.; et al. From kratom to mitragynine and its derivatives: Physiological and behavioural effects related to use, abuse, and addiction. Neurosci. Biobehav. Rev. 2013, 37, 138–151. [Google Scholar] [CrossRef]
  8. Kislik, V.S. Solvent Extraction: Classical and Novel Approaches; Elsevier: Oxford, UK, 2012. [Google Scholar]
  9. Zhang, Q.W.; Lin, L.G.; Ye, W.C. Techniques for extraction and isolation of natural products: A comprehensive review. Chin. Med. 2018, 13, 20. [Google Scholar] [CrossRef] [Green Version]
  10. Patil, A.S. Plant Secondary Metabolites: Isolation, Characterization & Biological Properties; Studera Press: Delhi, India, 2020. [Google Scholar]
  11. Kikura-Hanajiri, R.; Kawamura, M.; Maruyama, T.; Kitajima, M.; Takayama, H.; Goda, Y. Simultaneous analysis of mitragynine, 7-hydroxymitragynine, and other alkaloids in the psychotropic plant “kratom” (Mitragyna speciosa) by LC-ESI-MS. Forensic Toxicol. 2009, 27, 67–74. [Google Scholar] [CrossRef]
  12. Chan, K.B.; Pakiam, C.; Rahim, R.A. Psychoactive plant abuse: The identification of mitragynine in ketum and in ketum preparations. Bull. Narc. 2005, 2005, 249–256. [Google Scholar]
  13. Orio, L.; Alexandru, L.; Cravotto, G.; Mantegna, S.; Barge, A. UAE, MAE, SFE-CO2 and classical methods for the extraction of Mitragyna speciosa leaves. Ultrason. Sonochem. 2012, 19, 591–595. [Google Scholar] [CrossRef]
  14. Haris, H.M. An optimized recovery of mitragynine from Mitragyna speciosa using freeze drying and ultrasonic-assisted extraction method. Int. J. Sci. Technol. 2013, 15, 1077–1083. [Google Scholar]
  15. Goh, Y.S.; Karunakaran, T.; Murugaiyah, V.; Santhanam, R.; Abu Bakar, M.H.; Ramanathan, S. Accelerated Solvent Extractions (ASE) of Mitragyna speciosa Korth. (Kratom) leaves: Evaluation of its cytotoxicity and antinociceptive activity. Molecules 2021, 26, 3704. [Google Scholar] [CrossRef]
  16. Avula, B.; Sagi, S.; Wang, Y.H.; Wang, M.; Ali, Z.; Smillie, T.J.; Zweigenbaum, J.; Khan, I.A. Identification and characterization of indole and oxindole alkaloids from leaves of Mitragyna speciosa Korth using liquid chromatography–accurate QToF mass spectrometry. J. AOAC Int. 2015, 98, 13–21. [Google Scholar] [CrossRef]
  17. Farooq, M.U.; Mumtaz, M.W.; Mukhtar, H.; Rashid, U.; Akhtar, M.T.; Raza, S.A.; Nadeem, M. UHPLC-QTOF-MS/MS based phytochemical characterization and anti-hyperglycemic prospective of hydro-ethanolic leaf extract of Butea monosperma. Sci. Rep. 2020, 10, 3530. [Google Scholar] [CrossRef] [Green Version]
  18. Karunakaran, T.; Firouz, N.S.; Santhanam, R.; Jong, V.Y.M. Phytochemicals from Calophyllum macrocarpum Hook. f. and its cytotoxic activities. Nat. Prod. Res. 2022, 36, 654–659. [Google Scholar] [CrossRef]
  19. Choi, Y.H.; Verpoorte, R. Metabolomics: What you see is what you extract. Phytochem. Anal. 2014, 25, 289–290. [Google Scholar] [CrossRef]
  20. Do, Q.D.; Angkawijaya, A.E.; Tran-Nguyen, P.L.; Huynh, L.H.; Soetaredjo, F.E.; Ismadji, S.; Ju, Y.H. Effect of extraction solvent on total phenol content, total flavonoid content, and antioxidant activity of Limnophila aromatica. J. Food Drug Anal. 2014, 22, 296–302. [Google Scholar] [CrossRef] [Green Version]
  21. Nawaz, H.; Aslam, M.; Muntaha, S.T. Effect of solvent polarity and extraction method on phytochemical composition and antioxidant potential of corn silk. Free Radic. Antioxid. 2019, 9, 5–11. [Google Scholar] [CrossRef] [Green Version]
  22. Kothari, V.; Seshadri, S. Antioxidant activity of seed extracts of Annona squamosa and Carica papaya. Nutr. Food Sci. 2010, 40, 403–408. [Google Scholar] [CrossRef] [Green Version]
  23. Azieana, J.; Zainon, M.N.; Noriham, A.; Rohana, M.N. Total phenolic and flavonoid content and antioxidant activities of ten Malaysian wild mushrooms. Open Access Libr. 2017, 4, 80503. [Google Scholar] [CrossRef]
  24. Wiji, P.P.; Bahtiar, A.; Hayun, H. Synthesis and cytotoxicity evaluation of novel asymmetrical mono-carbonyl analogs of curcumin (AMACs) against Vero, HeLa, and MCF7 Cell Lines. Sci. Pharm. 2018, 86, 25. [Google Scholar] [CrossRef] [PubMed]
  25. Heinrich, M.; Williamson, E.M.; Gibbons, S.; Barnes, J.; Prieto-Garcia, J. Fundamentals of Pharmacognosy and Phytotherapy; Elsevier Health Sciences: Amsterdam, The Netherlands, 2017. [Google Scholar]
Figure 1. HPLC-UV representatives overlap chromatograms of (a) blank, (b) mitragynine, (c) UAE aqueous extract, (d) UAE MeOH extract, (e) UAE EtOH extract, and (f) UAE EtOAc extract. Chromatographic conditions were as follows: Agilent Zorbax Eclipse Plus C18 column (4.6 × 150 mm, 3.5 μm); the mobile phase was 0.1% formic acid and acetonitrile; the flow rate was 1.0 mL/min; the wavelength was 254 nm; the injection concentration was 100 µg/mL; and the injection volume was 10 μL. Adapted from Ref. [15].
Separations 09 00345 g001
Figure 2. Percentage viability of human embryonic kidney cells against various concentration of treatment with mitragynine, doxorubicin, and UAE ketum leaf extracts. Data were shown as mean ± SEM, (n = 6). * p < 0.05, ** p < 0.01, and *** p < 0.001 were compared with DMSO as blank (one-way ANOVA, followed by Dunnett’s test). Adapted from Ref. [15].
Separations 09 00345 g002
Figure 3. The percentage viability of HeLa Chang liver cells against various concentration of treatment with mitragynine, doxorubicin, and UAE ketum leaf extracts. Data were shown as mean ± SEM, n = 6. * p < 0.05, ** p < 0.01, *** p < 0.001 were compared with DMSO as blank (one-way ANOVA, followed by Dunnett’s test). Adapted with permission from Ref. [15].
Separations 09 00345 g003
Figure 4. Chemical structures of mitragynine and its congeners.
Separations 09 00345 g004
Table 1. The dry yield and mitragynine content in UAE ketum leaves extracted with water for 20, 40, and 60 min.
SampleTime (min)Mean of Dry Yield (g)Mean Percentage of Mitragynine (%)
Mean ± SEM (n)
UAE aqueous201.88 ± 0.132.27 ± 0.13
401.80 ± 0.262.39 ± 0.21
602.24 ± 0.112.41 ± 0.17
Data expressed as mean ± SEM, n = 3. Raw plant material mass = 10 g. Data shows no significant difference among the UAE aqueous extracts using three different extraction duration, with multiple comparison (one-way ANOVA, followed by Tukey’s test).
Table 2. The dry yield and the mitragynine content in UAE ketum leaves extracted with 100% water, MeOH, EtOH, and EtOAc.
SampleTime (min)Mean of Dry Yield (g)Mean Percentage of Mitragynine (%)
Mean ± SEM
UAE aqueous201.88 ± 0.13 c2.27 ± 0.13 a
UAE MeOH201.92 ± 0.22 c7.22 ± 0.48 b
UAE EtOH200.87 ± 0.04 b9.40 ± 0.91 b
UAE EtOAc200.22 ± 0.03 a8.10 ± 1.12 b
Data were expressed as mean ± SEM, n = 3. Raw plant material mass = 10 g. With multiple comparisons (one-way ANOVA followed by Tukey’s test), data with distinct alphabet superscript letters demonstrated significant differences at p < 0.05 among various solvents.
Table 3. Total phenolic contents (as GAE) in UAE ketum leaf extracts obtained from various extraction solvents.
Extract Mean of AbsorbanceTotal Phenolic Content in Dry Extract (GAE mg/g), Mean ± SEM
UAE aqueous0.220192.83 ± 4.17 a
UAE MeOH0.492419.50 ± 2.50 d
UAE EtOH0.344295.75 ± 1.25 c
UAE EtOAc0.258224.08 ± 0.59 b
Data were presented as mean ± SEM, with an n of 3. With multiple comparisons (one-way ANOVA, followed by Tukey’s test), data with distinct alphabet superscript letters demonstrated significant differences at p < 0.05 among various solvents.
Table 4. Total flavonoids content (as QE) in UAE ketum leaf extracts obtained from various extraction solvents.
ExtractMean of AbsorbanceTotal Flavonoids
Content in Dry Extract
(QE mg/g),
Mean ± SEM
UAE aqueous 0.03669.00 ± 2.89 a
UAE MeOH 0.079177.33 ± 3.00 c
UAE EtOH 0.068148.17 ± 2.20 b
UAE EtOAc 0.081181.50 ± 2.89 c
Data were presented as mean ± SEM, with an n of 3. With multiple comparisons (one-way ANOVA, followed by Tukey’s test), data with distinct alphabet superscript letters demonstrated significant differences at p < 0.05 among various solvents.
Table 5. IC50 values following treatment with mitragynine, doxorubicin, and UAE ketum leaf extracts in HEK-293 kidney cells and HeLa Chang liver cells.
SampleIC50 Value
HEK-293 Kidney CellsHeLa Chang Liver Cells
UAE aqueous extract>100 µg/mL>100 µg/mL
UAE MeOH extract>100 µg/mL>100 µg/mL
UAE EtOH extract48.46 ± 11.93 µg/mL86.61 ± 14.95 µg/mL
UAE EtOAc extract46.16 ± 9.37 µg/mL70.58 ± 8.10 µg/mL
Mitragynine112.30 ± 17.59 µM210.04 ± 0.80 µM
Doxorubicin a80.82 ± 12.05 µM86.23 ± 27.49 µM
Note: Each value of IC50 represented the mean ± SEM of three independent experiments. a Positive control substance. Adapted from Ref. [15].
Publisher’s Note: MDPI stays neutral with regard to jurisdictional claims in published maps and institutional affiliations.

