
Growth and Yield Potential of New Sugarcane Varieties during Plant and First Ratoon Crops

 , , , , , and
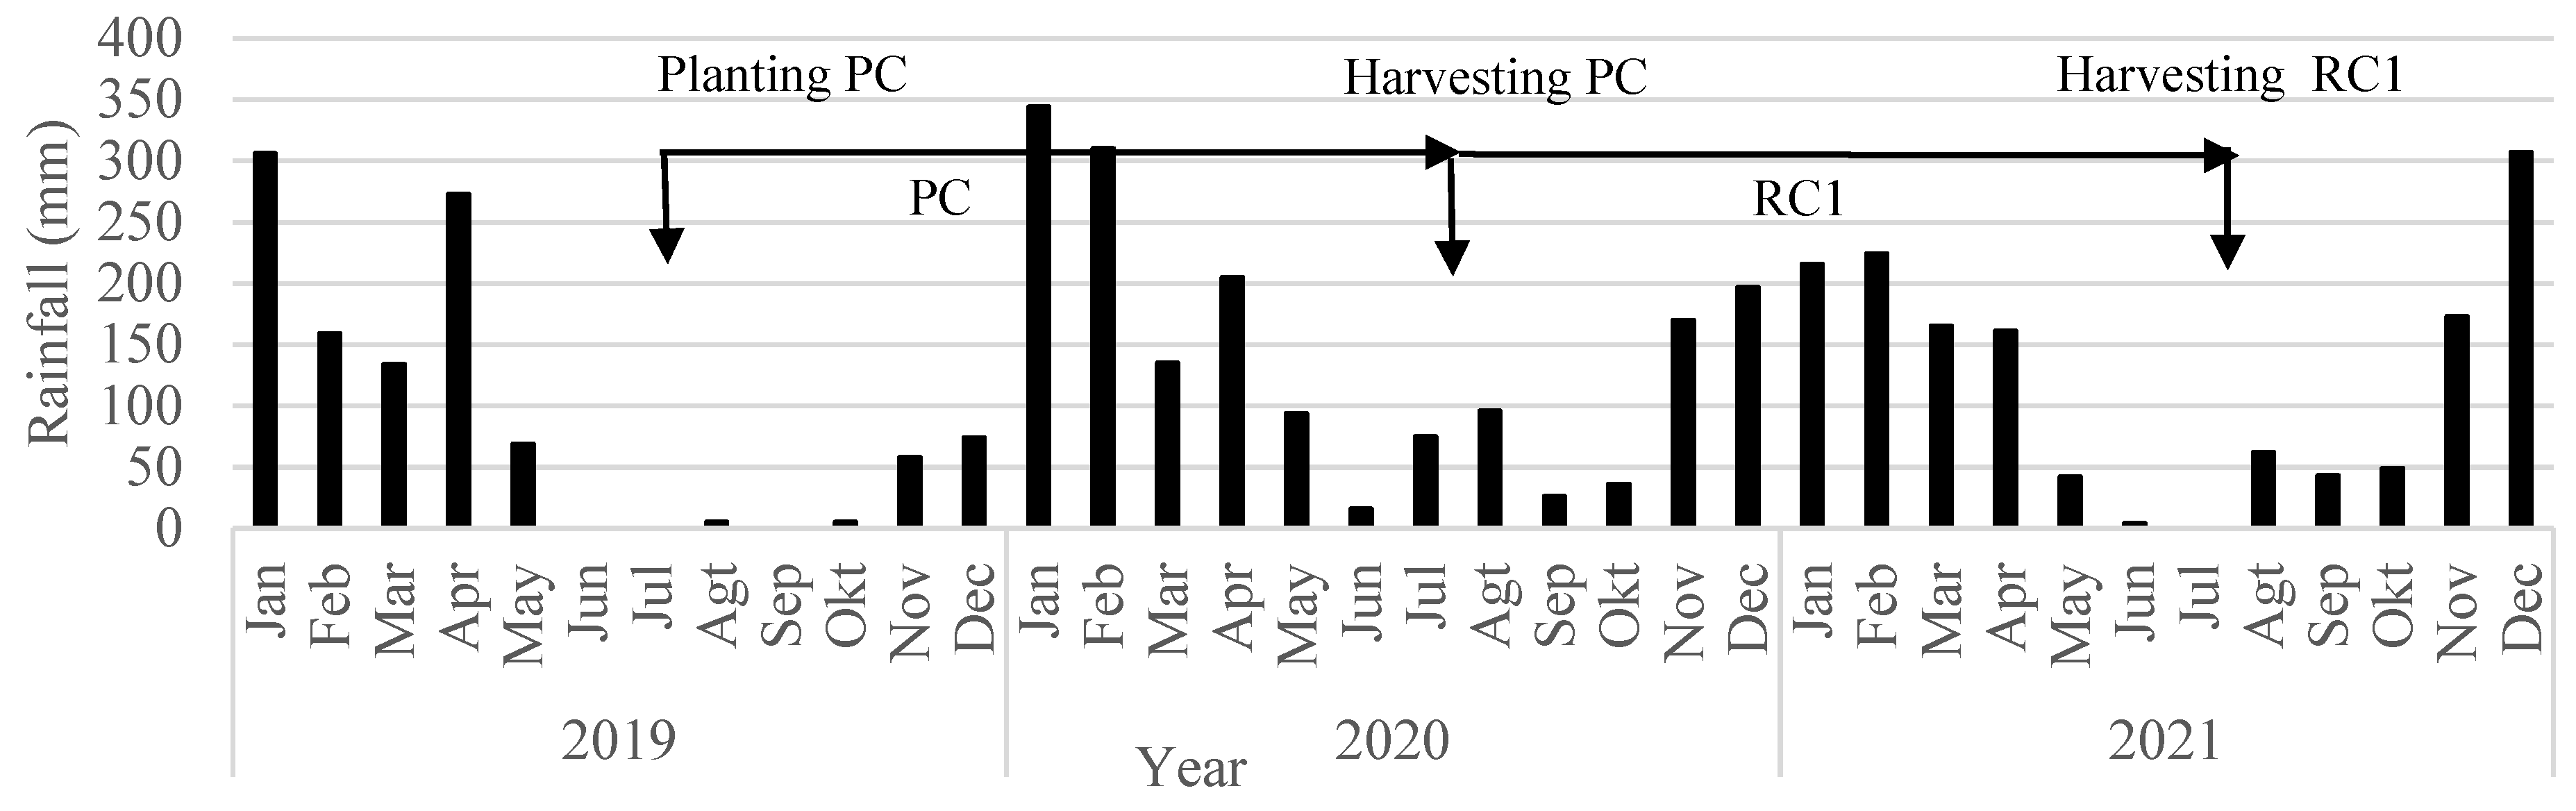
Abstract
1. Introduction
2. Materials and Methods
3. Results and Discussion
3.1. Environmental Factors
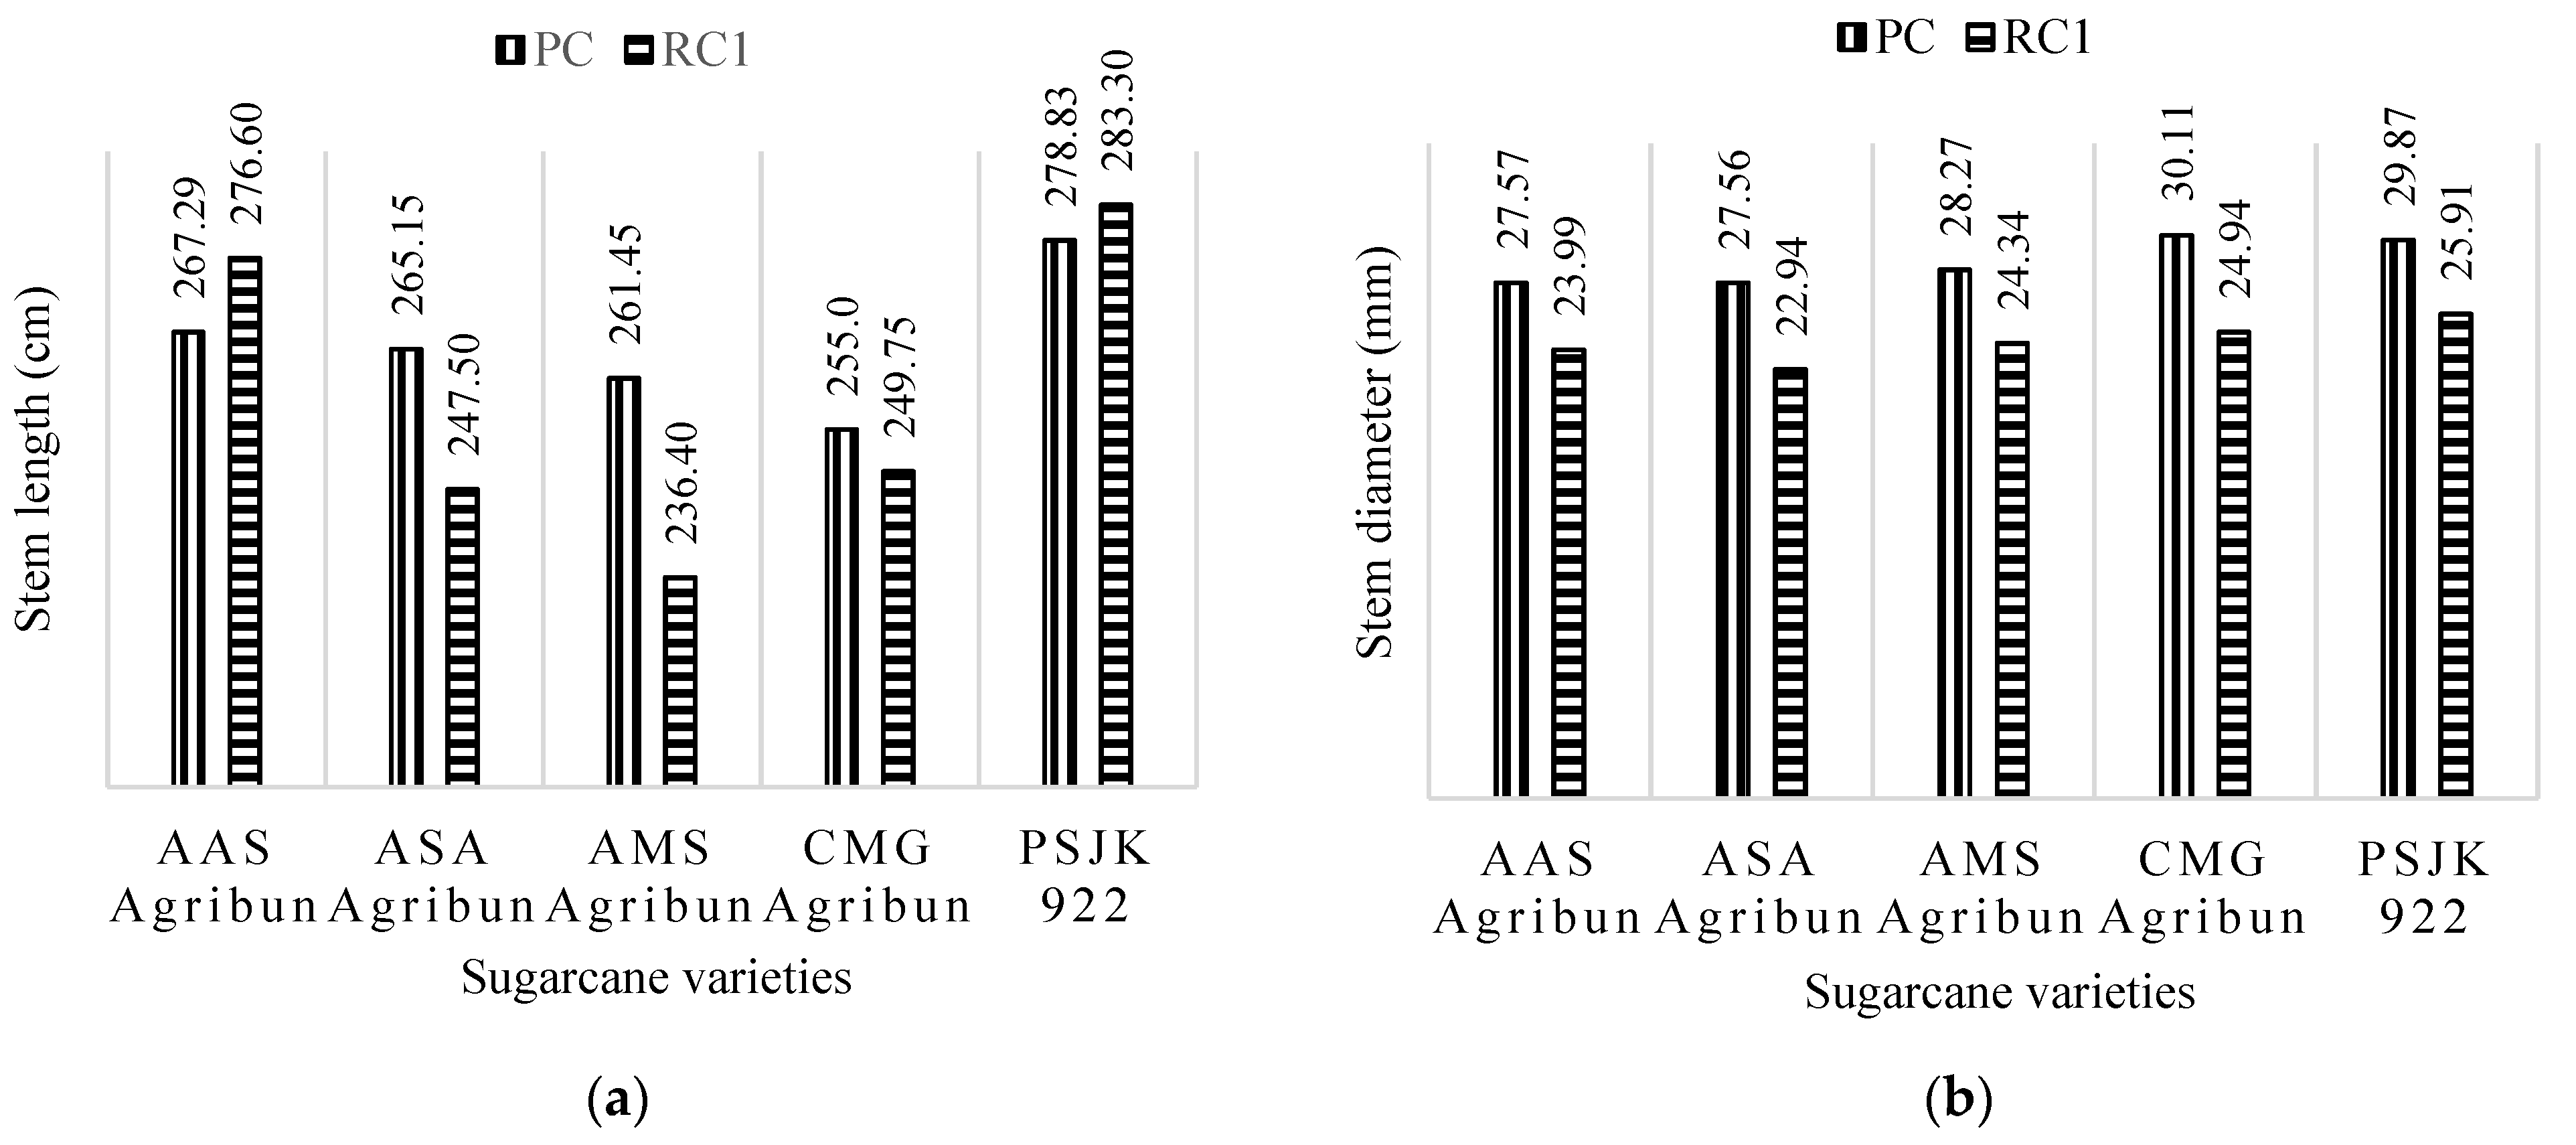
3.2. Sugarcane Growth Components
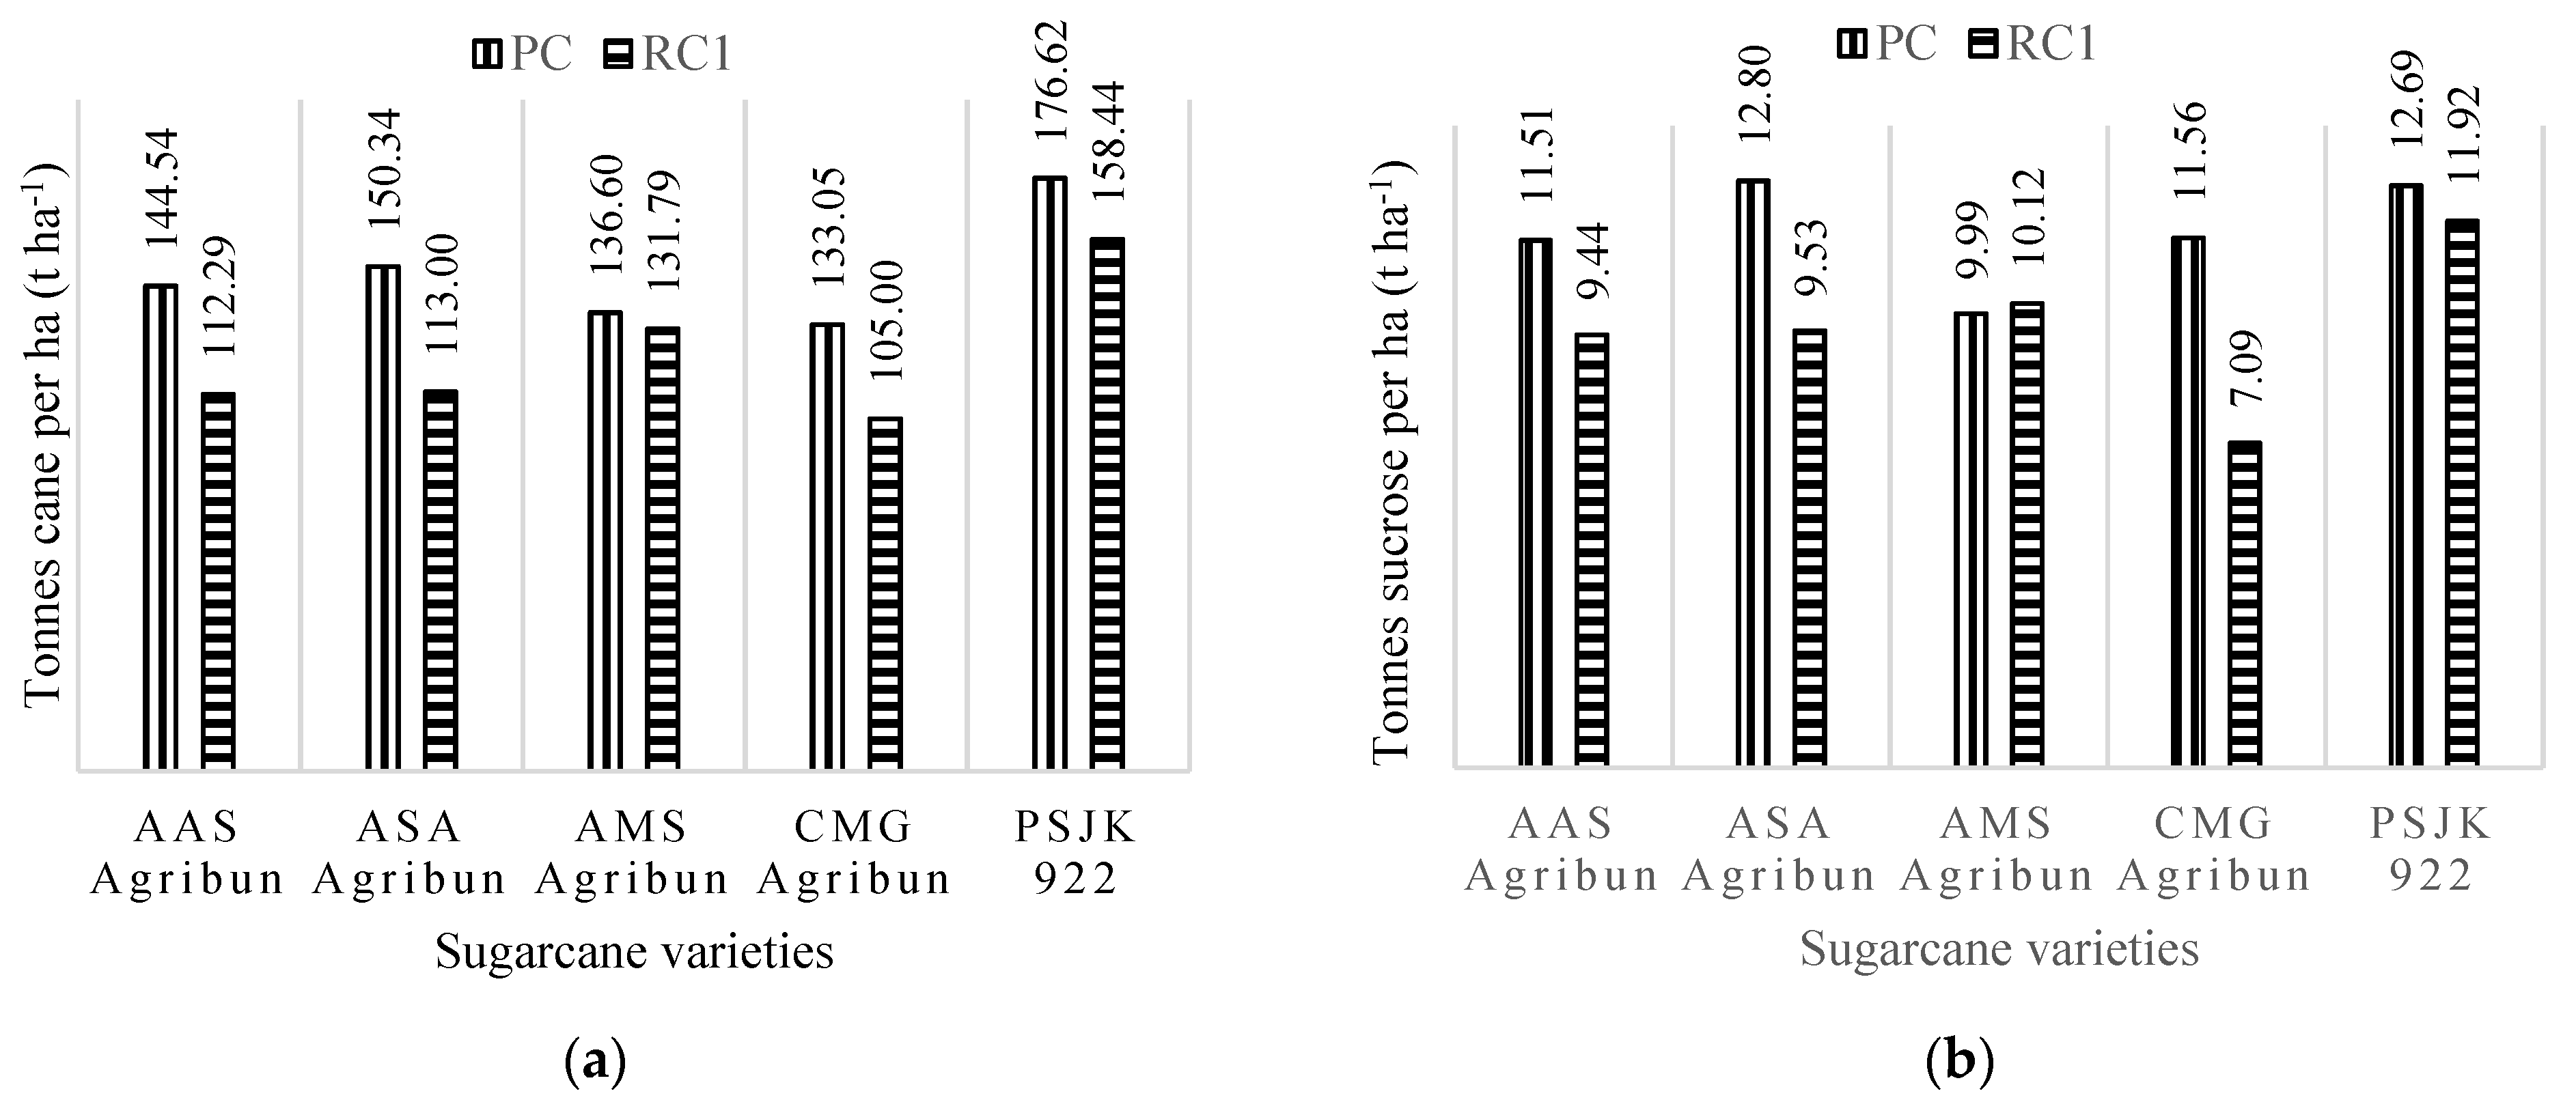
3.3. Sugarcane Yield Potentials
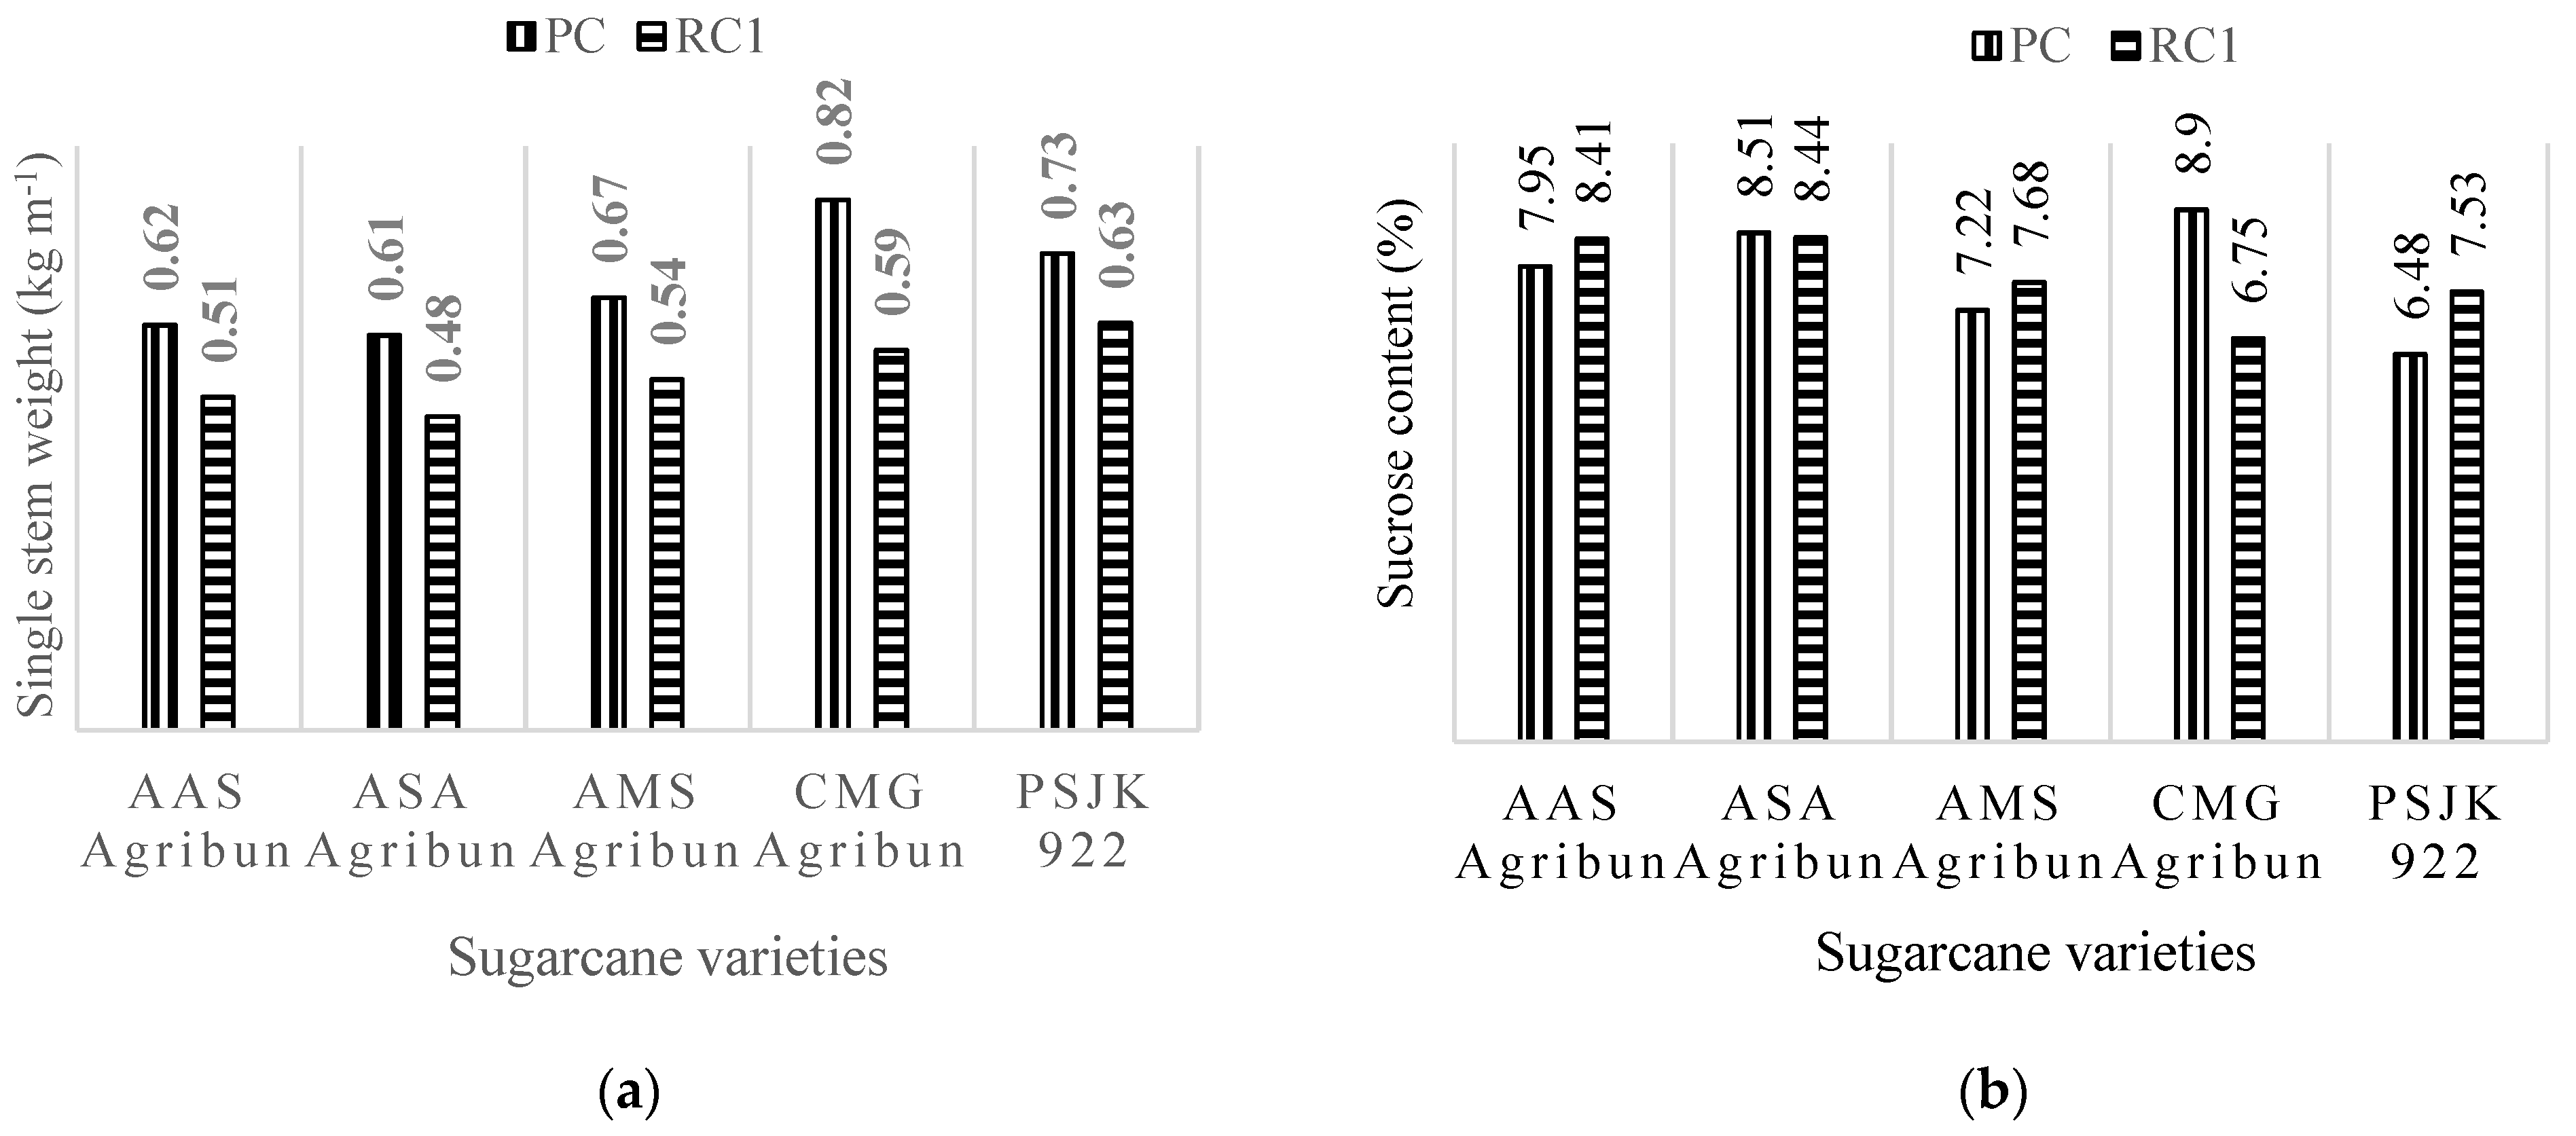
3.4. Physiological Characteristics
4. Conclusions
Author Contributions
Funding
Institutional Review Board Statement
Informed Consent Statement
Data Availability Statement
Acknowledgments
Conflicts of Interest
References
- BPS-Statistics Indonesia. Indonesian Sugarcane Statistics 2020. Available online: https://www.bps.go.id/publication/2021/11/30/e68b9816fa1b9b3447e4868d/statistik-tebu-indonesia-2020.html (accessed on 2 June 2022).
- Gomathi, R.; Rao, P.N.G.; Rakkiyappan, P.; Sundara, B.P.; Shiyamala, S. Physiological Studies on Ratoonability of Sugarcane Varieties under Tropical Indian Condition. Am. J. Plant Sci. 2013, 4, 274–281. [Google Scholar] [CrossRef]
- Soomro, A.F.; Tunio, S.; Oad, F.C. Effect of Supplemental Inorganic NPK and Residual Organic Nutrients on Sugarcane Ratoon Crop. Int. J. Sci. Eng. Res. 2012, 3, 1–11. [Google Scholar]
- Rehman, A.; Qamar, R.; Qamar, J. Economic Assessment of Sugarcane (Saccharum officinarum L.) through Intercropping. J. Agric. Chem. Environ. 2014, 3, 24–28. [Google Scholar] [CrossRef]
- Panhawar, R.N.; Unar, G.S.; Chocan, M.; Soomoro, A.F.; Ahmed, S. Comparative evaluation of some sugarcane genotypes for cane yield and quality attributes in advanced varietal trial. Pak. Sugar J. 2017, XXXII, 19–25. Available online: http://srdb.gop.pk/journal/index.php/PSJ/article/view/17/15 (accessed on 19 September 2022).
- Junejo, S.; Kaloi, G.M.; Panhwar, R.N.; Chohan, M.; Junejo, A.A.; Soomro, A.F. Performance of some newly developed sugarcane genotypes for some quantitative and qualitative traits under Thatta conditions. J. Anim. Plant Sci. 2010, 20, 40–43. [Google Scholar]
- Ramesh, P.; Mahadevaswamy, M. Effect of formative phase drought on different classes of shoots, shoot mortality, cane attributes, yield and quality of four sugarcane cultivars. J. Agron. Crop Sci. 2008, 185, 249–258. [Google Scholar] [CrossRef]
- Singh, I.; Verma, R.R.; Srivastava, T.K. Growth, Yield, Irrigation Water Use Efficiency, Juice Quality and Economics of Sugarcane in Pusa Hydrogel Application under Different Irrigation Scheduling. Sugar Tech 2017, 20, 29–35. [Google Scholar] [CrossRef]
- Dinh, T.H.; Watanabe, K.; Takaragawa, H.; Nakabaru, M.; Kawamitsu, Y. Photosynthetic response and nitrogen use efficiency of sugarcane under drought stress conditions with different nitrogen application levels. Plant Prod. Sci. 2017, 20, 412–422. [Google Scholar] [CrossRef]
- Binbol, N.L.; Adebayo, A.A.; Kwon-Ndung, E.H. Influence of climatic factors on the growth and yield of sugar cane at Numan, Nigeria. Clim. Res. 2006, 32, 247–252. [Google Scholar] [CrossRef]
- Inman-Bamber, N.G.; Smith, D.M. Water relations in sugarcane and response to water deficits. Field Crops Res. 2005, 92, 185–202. [Google Scholar] [CrossRef]
- Cardozo, N.P.; Sentelhas, P.C. Climatic effects on sugarcane ripening under the influence of cultivars and crop age. Sci. Agric. 2013, 70, 449–456. [Google Scholar] [CrossRef]
- Ferreira, T.H.; Tsunada, M.S.; Bassi, D.; Araújo, P.; Mattiello, L.; Guidelli, G.V.; Righetto, G.L.; Gonçalves, V.R.; Lakshmanan, P.; Menossi, M. Sugarcane water stress tolerance mechanisms and its implications on developing biotechnology solutions. Front. Plant Sci. 2017, 8, 1077. [Google Scholar] [CrossRef] [PubMed]
- Singels, A.; Jones, M.; Marin, F.; Ruane, A.; Thornburn, P. Predicting climate change impacts on sugarcane production at sites in Australia, Brazil and South Africa using the Canegro model. Sugar Tech 2013, 16, 347–355. [Google Scholar] [CrossRef]
- Dlamini, P.J. Drought stress tolerance mechanisms and breeding effort in sugarcane: A review of progress and constraints in South Africa. Plant Stress 2021, 2, 100027. [Google Scholar] [CrossRef]
- Chandiposha, M. Potential impact of climate change in sugarcane and mitigation strategies in Zimbabwe. Afr. J. Agric. Res. 2013, 8, 2814–2818. [Google Scholar]
- Medeiros, D.B.; da Silva, E.C.; Nogueira, R.; Teixeira, M.M.; Buckeridge, M.S. Physiological limitations in two sugarcane varieties under water suppression and after recovering. Theor. Exp. Plant Physiol. 2013, 25, 213–222. [Google Scholar] [CrossRef]
- Dias, H.B.; Sentelhas, P.C.; Inman-Bamber, G.; Everingham, Y. Sugarcane yield future scenarios in Brazil as projected by the APSIM-Sugar model. Ind. Crops Prod. 2021, 171, 113918. [Google Scholar] [CrossRef]
- Kumar, A.; Sharma, P. Climate Change and Sugarcane Productivity in India: An Econometric Analysis. J. Soc. Dev. Sci. 2014, 5, 111–122. [Google Scholar] [CrossRef]
- Begum, M.K.; Islam, M.S. Effect of drought stress on yield and yield components of sugarcane. J. Agrofor. Environ. 2012, 6, 105–109. [Google Scholar]
- Silva, M.D.A.; Alberto, J.; Enciso, J.; Sharma, V.; Jifon, J. Yield Components as Indicators of Drought Tolerance of Sugarcane. Sci. Agric. 2008, 65, 620–627. [Google Scholar] [CrossRef]
- Bell, M.J.; Garside, A.L. Shoot and stalk dynamics and the yield of sugarcane crops in tropical and subtropical Queensland, Australia. In Field Crops Research; Elsevier: Amsterdam, The Netherlands, 2005; pp. 231–248. [Google Scholar]
- Awadalla, A.O. Effect of Harvesting Age on Yield, Yield Components and Quality of Some Promising Sugarcane Varieties. J. Plant Prod. 2016, 7, 1501–1507. [Google Scholar]
- Urgesa, G.D.; Keyata, E.O. Effect of Harvesting Ages on Yield and Yield Components of Sugar Cane Varieties Cultivated at Finchaa Sugar Factory. Int. J. Food Sci. 2021, 2021, 2702095. [Google Scholar] [CrossRef] [PubMed]
- Chumphu, S.; Jongrungklang, N.; Songsri, P. Association of physiological responses and root distribution patterns of ratooning ability and yield of the second ratoon cane in sugarcane elite clones. Agronomy 2019, 9, 200. [Google Scholar] [CrossRef]
- Priya, S.R.K.; Balambiga, R.K.; Mishra, P.; Sankar, S. Smart Agricultural Technology Sugarcane yield forecast using weather based discriminant analysis. Smart Agric. Technol. 2023, 3, 100076. [Google Scholar] [CrossRef]
- Dlamini, N.E.; Zhou, M. Soils and seasons effect on sugarcane ratoon yield. Field Crops Res. 2022, 2022, 284. [Google Scholar] [CrossRef]
- Sanghera, G.S.; Bhatt, R. Water Stress Response of Sugarcane (Saccharum spp.) Clones/Varieties for Sugar Yield and its Components Traits. Res. J. Agric. Sci. 2018, 9, 488–494. [Google Scholar]
- Dumont, T.; Laurent AT chane Bernard, B.; Hoarau, J. Genetic Variabilities and Genetic Gains for Yield Components ’ union Island in Regional Sugarcane Breeding Programmes on Re. Sugar Tech 2019, 21, 868–878. [Google Scholar] [CrossRef]
- Riajaya, P.D.; Djumali, D.; Heliyanto, B. Yields of Promising Sugarcane Clones under Three Different Planting Arrangements. Agrivita 2022, 44, 119–129. [Google Scholar] [CrossRef]
- Endres, L.; Silva, J.V.; Ferreira, V.M.; de Barbosa, G.V.S. Photosynthesis and water relations in Brazilian sugarcane. Open Agric. J. 2010, 4, 31–37. [Google Scholar] [CrossRef]
- Inman-Bamber, N.G.; Lakshmanan, P.; Park, S. Sugarcane for water-limited environments: Theoretical assessment of suitable traits. Field Crops Res. 2012, 134, 95–104. [Google Scholar] [CrossRef]
- De Souza, A.P.; Buckeridge, M.S. Photosynthesis in Sugarcane and Its Strategic Importance to Face the Global Climatic Change. In Luis Augusto Barbosa Cortez (Coord.). Sugarcane Bioethanol—R&D for Productivity and Sustainability; Editora Edgard Blücher: São Paulo, Brazil, 2014; pp. 359–364. [Google Scholar] [CrossRef]
- Da Silva, V.; Da Silva, B.B.; Albuquerque, W.G.; Borges, C.J.R.; de Sousa, I.F.; Neto, J.D. Crop coefficient, water requirements, yield and water use efficiency of sugarcane growth in Brazil. Agric. Water Manag. 2013, 128, 102–109. [Google Scholar] [CrossRef]
- Zhao, P.; Jackson, P.A.; Basnayake, J.; Liu, J.; Chen, X.; Zhao, J.; Zhao, X.; Bai, Y.; Yang, L.; Zan, F.; et al. Genetic variation in sugarcane for leaf functional traits and relationships with cane yield, in environments with varying water stress. Field Crops Res. 2017, 213, 143–153. [Google Scholar] [CrossRef]


Publisher’s Note: MDPI stays neutral with regard to jurisdictional claims in published maps and institutional affiliations. |
© 2022 by the authors. Licensee MDPI, Basel, Switzerland. This article is an open access article distributed under the terms and conditions of the Creative Commons Attribution (CC BY) license (https://creativecommons.org/licenses/by/4.0/).
Share and Cite
Riajaya, P.D.; Hariyono, B.; Cholid, M.; Kadarwati, F.T.; Santoso, B.; Djumali; Subiyakto. Growth and Yield Potential of New Sugarcane Varieties during Plant and First Ratoon Crops. Sustainability 2022, 14, 14396. https://doi.org/10.3390/su142114396
Riajaya PD, Hariyono B, Cholid M, Kadarwati FT, Santoso B, Djumali, Subiyakto. Growth and Yield Potential of New Sugarcane Varieties during Plant and First Ratoon Crops. Sustainability. 2022; 14(21):14396. https://doi.org/10.3390/su142114396
Chicago/Turabian StyleRiajaya, Prima Diarini, Budi Hariyono, Mohammad Cholid, Fitriningdyah Tri Kadarwati, Budi Santoso, Djumali, and Subiyakto. 2022. "Growth and Yield Potential of New Sugarcane Varieties during Plant and First Ratoon Crops" Sustainability 14, no. 21: 14396. https://doi.org/10.3390/su142114396
APA StyleRiajaya, P. D., Hariyono, B., Cholid, M., Kadarwati, F. T., Santoso, B., Djumali, & Subiyakto. (2022). Growth and Yield Potential of New Sugarcane Varieties during Plant and First Ratoon Crops. Sustainability, 14(21), 14396. https://doi.org/10.3390/su142114396