Abstract
The variability of the natural environment and the complexity of human activities result in dynamic changes in oasis areas, which is directly related to the sustainable development of arid and semi-arid areas. In order to better balance economic development and environmentally sustainable development, based on land use data and social and economic data from 1980 to 2015, this paper analyzed the oasis change characteristics under natural and human factors in the Shiyang River Basin in Northwest China. The results indicated that the oasis in the Shiyang River Basin showed an expansion trend from 1980 to 2015, with the expansion mainly occurring in the diluvial and alluvial fan, and along the middle and lower reaches of the river. The oasis changed actively in areas at an elevation of 1350 m, with a slope of 2°, at the distance of 1500 m to rivers, and with precipitation of 120 mm and temperature of 15 °C. Furthermore, the oasis mainly evolved towards gentler slopes and lower altitudes, and migrated closer to rivers before 1992 and farther away from rivers afterwards. Population growth and economic development were the important inducers of oasis change, and government policies on agricultural benefits and ecological conservation also influenced the oasis change, especially after 2000. The evolution patterns of oasis distribution revealed in this study can provide a reference for promoting oasis ecological restoration and sustainable development.
1. Introduction
An oasis is a unique geographical landscape formed by the interaction of natural and anthropogenic factors in arid and semi-arid areas, which gathers advantageous resources such as water and soil in the desert and is suitable for vegetation growth and socioeconomic development [1,2]. Although the oasis in China only accounts for 3%~5% of the total area of the arid region, it is the cornerstone of life and production, supporting 90% of the population and 95% of the economic development in arid zones [3]. Since the reform and opening up, due to the rapid growth of the population, the continuous development of the economy, and the change of climate, the oasis in China has experienced a large-scale expansion [4,5]. Similarly, oasis expansion was also found in the arid areas of other countries in the past few decades, such as the oasis in the Manas River Basin [6], the middle reaches of the Qinghai Tibet Plateau [7], and Al-Aba Oasis (Kingdom of Saudi Arabia) [8]. Especially, the area of artificial oases dominated by cultivated land and construction land has increased, such as the oasis of Middle Draa Valley (Morocco) [9] and Todos Santos Oasis (Mexico) [10]. The oasis expansion provides more opportunities for human survival and development [11]. However, due to the low-level and disorderly development, excessive oasis expansion has also caused ecological environment problems, such as desertification, sand and dust storms, and groundwater reduction, endangering the sustainable development of the oasis [12]. The dynamic change of the oasis is related to the development of the regional ecology, economy, and society. Therefore, an improved understanding of the oasis change is of great significance to the sustainable development of the arid region.
In recent years, researchers have carried out a lot of research on the spatial and temporal changes of the oasis in arid zones [7,8,9,10,11,12,13,14,15,16,17,18], greatly advancing our knowledge on the vegetation coverage change [19], land use change [11], landscape pattern of oasis [20], the driving forces of oasis change [4], oasis stability [21], and oasis land-use change prediction [17]. The research areas of the oasis in China are mostly concentrated in the main distribution areas of the oasis such as Xinjiang [22,23] and the Hexi Corridor of Gansu Province [24,25,26,27]. Due to the limited data availability in early years and the insufficient coverage of the remote sensing data, it is difficult to obtain land use data spanning a long time period. Previous studies have thus mostly focused on the spatial and temporal changes of the oasis within 10–30 years [28,29,30,31,32], excluding few studies over 30 years [27,33,34,35,36].
Oasis change is closely related to natural and anthropogenic factors, however, previous studies [18,19] have paid more attention to the anthropogenic effect on oasis change. The finite nature and uneven distribution pattern of soil and water resources are the dominant factors controlling the size and distribution of oases [37], and topographic factors such as slope, aspect, and elevation directly or indirectly influence their extension and distribution [38]. Bie et al. [39] related the oasis distribution with topography, hydrology, and thermal constraints in the Hexi Corridor from 1986 to 2015, implying a tendency of oasis expansion towards lower elevations, flat topography, fewer water resources, and higher temperatures. Liu et al. [40] analyzed the distribution of land use types with elevation, slope, and slope orientation in Kashgar in 2007. Muyibul et al. [11] found the expansion of cultivated land was mainly along the Creya River based on land use data in 1995, 2005, and 2015. However, these studies have mainly focused on the spatial distribution patterns of land-use types in relation to selected natural factors [40,41], or inferred the oasis expansion direction based on their dynamics over a certain period of time [39], without providing an objective quantification on the oasis evolution tendency along the varied natural characteristics during the oasis migration process.
Shiyang River Basin (SRB) is one of the most densely populated inland river basins in China, with the highest exploitation degree of water and soil resources, the most prominent water use contradiction, and the most serious ecological environment problems. Under the influence of human activities, land use in SRB has dramatically changed, with residential land, cultivated land, and water bodies showing an overall trend of expansion, accompanied by a substantial reduction in forest land and grassland area [41,42], which has led to a series of ecological environment problems, such as desertification, soil and water erosion, changes in mountain runoff and the water environment, and so on [43,44]. Before the implementation of the key governance plan of the Shiyang River Basin in 2007, the oasis in the middle and lower reaches experienced an evolution of oasis-desertification-oasis from 1978 to 2018 [27], during which the total area of the natural oasis has decreased, while the area of the artificial oasis has increased accordingly [33].
Oases are always in a state of dynamic change due to the inherent ecological fragility, the variability of natural environment and the complexity of human activities [39]. Understanding the spatiotemporal changes of the oasis and their influencing factors is of great significance to understand the relationship between human activities and the ecological processes and to enhance the ecological restoration and sustainable development of the basin. Our study spans more than 30 years and provides a quantitative characterization of the oasis evolution in SRB. This study is aimed to (1) illustrate the spatiotemporal evolution patterns of the oases from 1980 to 2015; (2) quantify the oasis evolution directions along the varied natural factors; and (3) analyze the impact of natural and human factors on the oasis changes in SRB.
2. Research Area and Methods
2.1. Research Area
SRB, located in the east of the Hexi Corridor in Gansu Province, Northwest China, is an important part of the Silk Road and one of the important national commodity grain bases. The basin is located between latitudes 36°29′~39°27′and longitudes 101°41′~104°16′, with a total area of 41,600 km2 and an elevation of 1246~5210 m (Figure 1A,B). The administrative divisions of SRB mainly include Liangzhou District, Minqin County, most parts of Gulang County, and some parts of Tianzhu County in Wuwei City, Yongchang County, and Jinchuan District in Jinchang City, involving four cities and nine counties. Deep in the continental hinterland, the basin is a corridor plain formed by the Qilian mountainous region in the south and the desert region in the north. It is a temperate arid and semi-arid continental monsoon climate with little precipitation (50–600 mm) and intense evaporation (700–2600 mm) annually. Shiyang River originates in Qilian Mountains and has eight tributaries from east to west, which is mainly supplied by precipitation, snow melting, and glacial melting water of Qilian Mountains. The total water resources are 1.335 billion m3, of which the surface runoff is about 1.119 billion m3. Water resources in SRB are mainly used for agricultural irrigation, industrial development, and people’s living water in the basin. Since the 1980s, a series of economic development policies, such as the cancellation of agricultural taxes and food subsidies (2005), and ecological policies, such as returning farmland to forests (1999) and the comprehensive management project of SRB (2006), were implemented in SRB to promote economic development and ecological restoration (Figure 2).
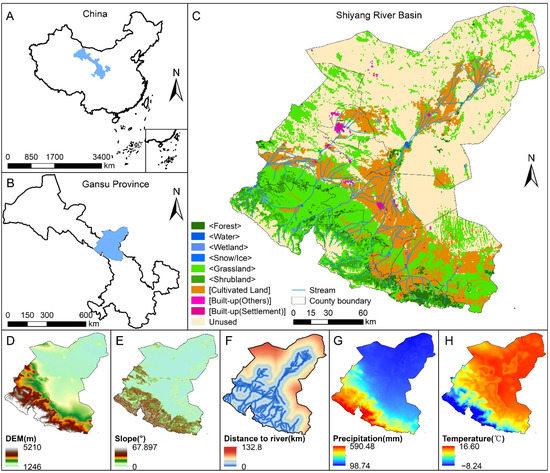
Figure 1.
Location of the Shiyang River Basin and spatial distribution of natural factors. (A,B) Basin location; (C) land use distribution in 2015 (the land use type in “<>” is natural oasis, while the land use type in “[]” is artificial oasis, and the oasis includes natural oasis and artificial oasis); (D) elevation; (E) slope; (F) Euclidean distance to the closest river; (G) precipitation; (H) temperature.
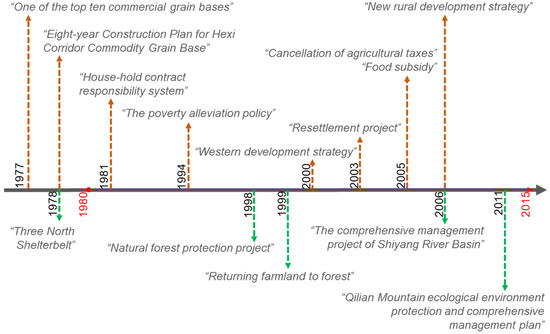
Figure 2.
Relevant Policies of the Shiyang River Basin. The orange dashed lines above the axis refer to the social and economic development policies, and the green dashed lines below the axis represent the ecological policies. The horizontal red line indicates the timescale of this study (1980–2015).
2.2. Data Sources
The basic data used in this paper mainly include four types: (1) land use data; (2) terrain data; (3) meteorological data (precipitation, temperature, and wind speed); (4) socioeconomic data.
(1) We mainly used the 1-km land use data from “the Annual 30m Land Use/Land Cover Map of China 1980–2015” [45], which includes 11 types of land use, and the main land use types are shown in Figure 1C. The raster values represent the area proportion of each land use type within the raster. We extracted the land use data within the SRB boundary and corrected the land use types near the tailrace of Minqin County by referring to the historical literature and information. With the help of Google Earth high-resolution remote sensing images, we randomly selected 180 samples to validate the classification results in 2015 and 2010, with the interpretation accuracy of 83% and 87%, respectively, meeting the research requirements. Furthermore, we combined the 11 land use types of the original data and classified oases as natural oasis and artificial oasis. Natural oasis mainly refers to forest-grassland-water, including forest, grassland, shrub land, wetland, water, snow/ice, while artificial oasis mainly includes socio-economic lands such as cultivated land, residential area, and other construction land (other industrial, mining, transportation land). The remaining land types are classified as unused land and excluded from our analysis.
(2) For the terrain data, we used the Digital Elevation Model STRM DEM data from the Geospatial Data Cloud (http://www.gscloud.cn), at a spatial resolution of 90 m, and derived the average elevation (Figure 1D) and slope (Figure 1E) based on the DEM data. We ran them at the resolution of 1 km.
(3) For the meteorological data, we applied the river network data from the Shiyang River Basin Basic Dataset in the National Tibetan Plateau Scientific Data Center (http://data.tpdc.ac.cn). For the influence of the distance to rivers, we converted the river shapefile data into raster data and calculated the Euclidean distance from each grid cell to the adjacent river at the resolution of 1 km through ArcGIS (Figure 1F). We adopted the monthly precipitation and temperature data from ″1 km monthly temperature and precipitation dataset for China from 1901 to 2017″ [46], with a time span of 1980–2015 and a spatial resolution of 1 km, and we calculated the annual precipitation and annual temperature based on the monthly precipitation and monthly temperature raster data, and then overlapped them to derive the multi-year average precipitation and temperature (Figure 1G,H). Further, wind speed data were downloaded from China Meteorological Service Center (https://data.cma.cn/en/).
(4) Additionally, the social and economic data used in this study, including population, GDP, grain yield and so on, were mainly from Gansu Water Resources Bulletin and Gansu Development Yearbook and spanned from 1985 to 2015.
2.3. Methods
We applied overlay analysis, grid cumulative change rate, and the probability density curve method to analyze the oasis change modes and the natural features of their spatial distributions. Then, we adopted the weighted center of gravity model to analyze the migration characteristics of the oasis and used Pearson correlation coefficient and principal component analysis to study the influencing factors of oasis change.
2.3.1. Characterization of the Oasis Change Modes
Based on the land use data, we analyzed the annual trends of the oasis area for the total oasis (sum of natural oasis and artificial oasis), the natural oasis, and the artificial oasis, in SRB over time. Furthermore, we overlapped the oasis data from multiple stages (1980, 1985, 1990, 1995, 2000, 2005, 2010, and 2015) and calculated the absolute grid cumulative change rate (AGCC) and the original grid cumulative change rate (OGCC) for each grid over each period between the two adjacent stages, the mathematical expressions of which are shown in the Equations (1) and (2) [26,47],
where is the count of the sample stage (), is sequence number of the sample stage (), and is the oasis area proportion in a grid at the beginning and at the end of the corresponding time period, respectively.
The and values could indicate the degree of the oasis area changes. The closer the or the is to 0, the more stable the oasis is; and the higher the , the more intense the oasis area change. According to the and values, we classified four categories of oasis change modes: (1) Stable oases, i.e., the oasis boundary did not change during the study period ( = 0 and = 0); (2) Expanding oases, i.e., the oasis showed expansion ( > 0 and −1 < <0); (3) Shrinking oases, i.e., the oasis showed shrinkage ( > 0 and 0 < ≤ 1); and (4) Fluctuating oases, i.e., the oasis changed repeatedly in expansion and shrinkage during the study period ( > 0 and = 0).
2.3.2. Distribution Characteristics of the Oasis Change Modes
The distribution and evolution of oasis are related to multiple natural factors. Here, we mainly considered the influence from topography (elevation and slope), hydrology (distance to rivers and precipitation), and thermal condition (temperature). In order to study the relationship between oasis change and natural factors, we overlaid the four oasis change modes (stable, expanding, shrinking, and fluctuating oasis) determined in Section 2.3.1 with the five natural factors (elevation, slope, distance to the river, precipitation, and temperature) [39]. For each oasis change mode, we analyzed the distribution characteristics by calculating the distribution frequency with the natural factors and plotting their probability density curves, which could directly indicate the peak and constraint conditions corresponding to the natural factors. By comparing the distribution characteristics for the four modes, we could infer the areas with active oasis changes.
2.3.3. Oasis Evolution Direction on the Natural Factors
The spatial distribution of oases in arid zones is the result of adapting to natural factors. Quantitative analysis of the relationship between oasis distribution and its restrictive factors in arid zones is of great significance to oasis development and management. To objectively quantify the impact of the natural factors on the oasis distribution, we defined the average level () of the natural factors for the oasis distribution, which was calculated based on the pixel values of the natural factors, using the proportion of oasis area as a weight (Equation (3)). We calculated corresponding to each type of oasis (the total, natural, and artificial oasis) for each natural factor over each year (1980–2015) and determined the oasis evolution direction along the varied natural factors based on their dynamic changes.
where indicates the natural factors restricting the spatial distribution of the oasis, including altitude, slope, distance to rivers; indicates the research year (1980–2015); indicates the pixel cell of analysis; indicates oasis types (total, natural, and artificial oasis); represents the average level of the influencing factor for oasis type in the year of ; represents the level of influencing factor in cell for year ; refers to the oasis area in cell for oasis type and for year ; and denotes the total count of cells.
2.3.4. Influencing Factors of the Oasis Change
Oasis changes are influenced by both natural resource conditions and human activities [18]. In order to comprehensively and quantitatively analyze the drivers of oasis area change, we selected 10 variables, including both natural factors (average annual precipitation, average annual temperature and wind) and anthropogenic factors (population, GDP, primary industry, secondary industry, tertiary industry, livestock stock, and grain yield), and conducted the correlation analysis between the area change and the ten influencing factors through Pearson correlation [48]. We considered the total, natural, and artificial oasis, respectively, and divided the entire study period (1980–2015) into the 1980–2000 phase and the 2001–2015 phase, since the dominant factors of oasis change vary for different types of oases and during different time periods. In order to further explore the driving effect of natural and human factors on the oasis area, we selected these 10 factors for principal component analysis.
3. Results
3.1. Natural Environmental Characteristics of the Distribution of Oasis Change Modes
From 1980 to 2015, the total oasis in SRB expanded from 30,990 km2 to 32,020 km2 (Figure 3A). The area of the artificial oasis continuously increased (Figure 3B), while the natural oasis expanded first and then shrank (Figure 3C), reaching the maximum in 2000 (20,720 km2). Still, the area proportions of the natural oasis (66.6–64.3%) have always been greater than those of the artificial oasis (33.4–35.7%) over time.
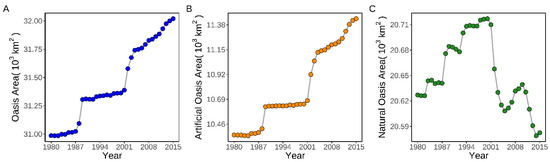
Figure 3.
Oasis area changes in the Shiyang River Basin. (A) Total oasis; (B) Artificial oasis; (C) Natural oasis.
Among the four oasis change modes (Figure 4), stable oases dominated, accounting for 81.24% of the entire oasis, and mainly concentrated on the upper SRB, the middle river plain, and the lower triangular alluvial fan, where water resources were relatively rich. Fluctuating oases accounted for 10.16% and were largely located in the oasis–desert ecotone, most of which were natural oases and subjected to changes in water resource conditions. The expanding oases mainly extended from the periphery of the stable oasis and were formed due to the reclamation of cultivated land [26]. The shrinking oases accounted for only 1.82% and mostly occurred in the lower reaches of the Shiyang River in Minqin County due to the degradation of natural vegetation and the abandonment of cultivated land [27].
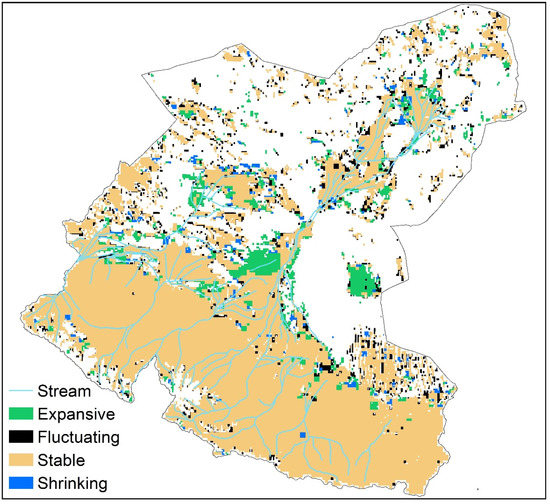
Figure 4.
Spatial distribution of oasis change modes in the Shiyang River Basin.
The spatial distribution of oases varies, obviously depending on geographical and environmental factors (as shown in Figure 5). Stable oases tended to be evenly distributed in the area with an altitude of 1200~4000 m, while the density peak value was near 1350 m for fluctuating and shrinking oases, 1350 m and 1500 m for expanding oases (Figure 5A). In the slope distributions, the peak value was 2° for stable oases, but closer to 0° for expanding, shrinking, and fluctuating oases (Figure 5B). In terms of the proximity to rivers, the peak density occurred about 1000 m to rivers for stable oases and roughly 1500 m for the other three modes (Figure 5C). In the temperature distributions, the oases had peaks around 15 °C, but the stable oases had a relatively broad temperature range (0–17 °C), while most of the other three modes were distributed within narrower ranges (10–17 °C) (Figure 5D). In the precipitation distributions, stable oases were evenly distributed within a precipitation range of 100–500 mm, while the other three modes were mostly distributed within a narrower range of between 100 mm and 250 mm, with peaks occurring at 120 mm for shrinking and fluctuating oases, and near 150 mm for expanding oases (Figure 5E). These also mean that the oasis was more active in areas with lower elevations, flatter terrain, away from rivers, higher temperatures, and less precipitation.
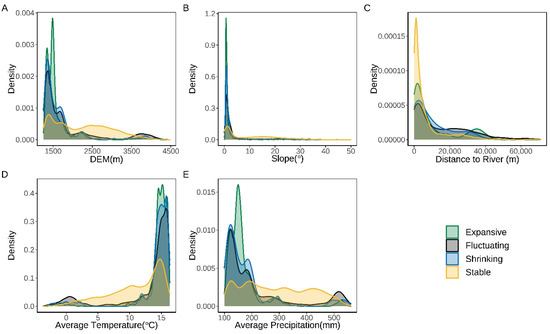
Figure 5.
Natural environment characteristics of spatial distribution of oasis change modes in the Shiyang River Basin, including (A) Altitude, (B) Slope, (C) Distance to rivers, (D) Temperature, and (E) Precipitation.
3.2. Oasis Evolution Direction on the Natural Factors
The oasis evolution is affected by topography of the terrain. From 1980 to 2015, the average elevation of the oases in SRB declined from 2192.7 m to 2170.2 m (Figure 6A). The elevation of the artificial oases declined from 1843.1 m to 1815 m (Figure 6B), while the elevation of natural oases first decreased from 2368.3 m to 2364 m in 2000, then increased to 2367.6 m (Figure 6C). Similarly, the average slope of the oases decreased from 9.14° to 8.88° (Figure 6D), in which the artificial oasis decreased from 4.04° to 3.75° (Figure 6E), while the natural oasis increased from 11.71° to 11.73°, reaching the lowest value of 11.66° in 2000 (Figure 6F). During the study period, total oases and artificial oases continuously migrated to low-altitude and gentle slope areas, while the distribution of the natural oases showed minor changes on elevation and slopes.
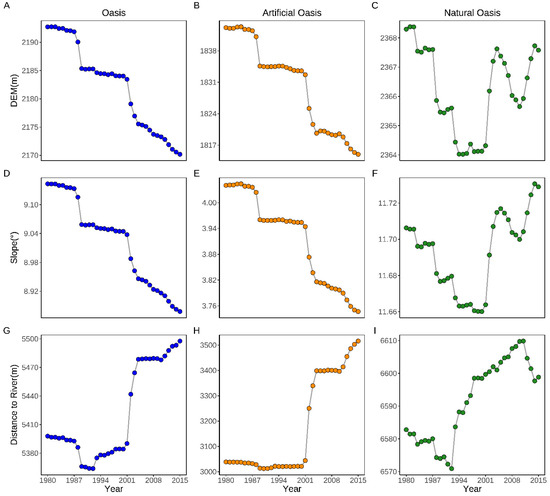
Figure 6.
Oasis migration features. (A–C) Elevation; (D–F) Slope; (G–I) Distances to rivers.
The quantity and distribution of water resources have been considered as the dominant factors controlling the change of oasis [36]. The average distance from oases to the closest river in SRB increased from 5398 m in 1980 to 5498 m in 2015. The oasis developed closer to rivers before 1992, and then gradually moved farther away from rivers, especially during 2001–2004 (Figure 6G). The artificial oasis was distributed relatively closer to rivers, and the distance to rivers changed from 2835 m in 1980 to 3310 m in 2015, with the shortest distance occurring in 2001, implying the oasis moving closer to the river before 2001, and then farther away afterwards (Figure 6H). The natural oasis was distributed farther away from rivers, increasing from 6583 m in 1980 to 6599 m in 2015, reaching the lowest value (6571 m) in 1992 and the highest value (6610 m) in 2011, respectively, (Figure 6I). It showed that the oasis evolution along rivers was greatly affected by the change of the natural oasis from 1980 to 1992 and the artificial oasis after 2001.
3.3. Influencing Factors of Oasis Evolution
During the period of our analysis, obvious changes took place in SRB, with rapid population growth, agricultural development, and economic progress. The population in SRB grew rapidly from 1.891 million in 1985 to 2.287 million in 2015, with an increase of 21%. The grain yield increased significantly from 760.9 thousand tons in 1983 to 1442.9 thousand tons in 2015. Additionally, the number of livestock on hand also increased from 2.076 million in 1983 to 6.115 million in 2015, with an increase of 194.5%. GDP grew slowly before 2001 but rapidly after 2001 due to the implementation of the western development strategy, with the three industries showed similar trends.
The oasis changes in SRB were the result of both natural resource conditions and human activities [23]. Most of the selected factors have significant correlation with the oasis area (Table 1). Throughout the study period (1980–2015), the total oasis areas and the artificial oasis areas were positively correlated with natural and anthropogenic factors considered (p < 0.001) except with wind speed, while the natural oasis was negatively correlated with factors although its correlation with rainfall, temperature, and population was not statistically significant. Grain yield and livestock stock were the factors showing the strongest correlation with the total oasis (0.96 and 0.95) and artificial oasis (0.95 and 0.97), while GDP had the largest correlation (−0.84) with the natural oasis.

Table 1.
Pearson’s correlation coefficient for the relationships between oasis area and influencing factors.
The factors influencing oasis change varied over time. During the period of 1980–2000, the total artificial and natural oasis areas were not significantly correlated with precipitation, but negatively correlated with wind speed (p < 0.05) and positively correlated with other natural factors and anthropogenic factors (p < 0.01). Besides, the total oasis and the artificial oasis had strong correlations with total GDP and GDP by different sectors, while the natural oasis had the strongest correlation with population. From 2001 to 2015, the oasis areas were not related to the natural factors (temperature, precipitation, and wind speed). For the anthropogenic factors, the total and artificial oasis areas were negatively correlated with population (p < 0.01) and positively correlated with the others (p < 0.001), while the natural oasis areas were negatively correlated with all but population (p < 0.01). Grain yield and livestock stock were the factors showing the strongest correlation with all of the three types of oases. Additionally, the correlations with the anthropogenic factors were generally larger than those with the climatic factors.
Principal component analysis is shown in Table 2. The first major component is mainly driven by socio-economic factors and agricultural development, with a contribution rate of 66%. The second major component is mainly driven by the population, with a contribution rate of 13%. The higher value of the load in the third main component is the natural factor, and its contribution rate is 9.8%. According to the above analysis, the main driving factor of oasis area change in SRB is human factors, followed by natural factors.
Table 2.
The load of each prediction factor on each principal component, in which the response is the change of oasis area.
4. Discussion
SRB is located in the arid region of Northwest China and is an important grain production base in China. The special geographical location and natural conditions of the oasis determine its ecological instability. Meanwhile, the ecological environment of the oasis is constantly changing under the impact of human activities. Understanding the restriction factors of oasis distribution and the driving factors of oasis change is of great significance to the ecological restoration and sustainable development of SRB. Here, based on the consecutive land use data and social and economic data, we detected the detailed changes of the oasis area in SRB from 1980 to 2015, analyzed the spatio-temporal characteristics of the oasis changes and oasis distribution and the influencing factors.
4.1. Temporal Variation of the Oasis Changes
This paper analyzed the characteristics of oasis change in SRB over the past 35 years. The study showed that from 1980 to 2015, the oasis area in SRB was in a state of continuous growth (Figure 3A), similar to the dynamics of many other oases in the northwest arid regions, such as the Jinta Oasis in the Heihe River Basin [36], Hexi Corridor Oasis [26], Minqin Oasis [49], and Turpan Gaochang Oasis [30]. Furthermore, our study revealed varied area trends between the artificial and natural oasis. We found that the artificial oasis kept expanding over time, while the natural oasis was in a shrinking state after 2000, indicating the dominating role of the artificial oasis in controlling the oasis area changes in SRB after 2000 (Figure 3).
Oasis changes inevitably have a positive or negative impact on the ecosystem. The increase in the natural oasis area, mainly including forest land and grassland, promotes the improvement of carbon fixation capacity of ecosystem [50]. The expansion of farmland and forest land for returning farmland to forests also improved water conservation [51]. Furthermore, the expansion of the oasis is mainly the expansion of the artificial oasis with the cultivated land area as the main part, and the reduction of wasteland in the basin, which is conducive to the increase of ecosystem services [52].
The continuous oasis expansion can cause substantial implications to the ecological environment [14]. Over the past 35 years, the expansion of the artificial oasis (Figure 3B) has resulted in a large increase in domestic and irrigation water use. Since the artificial oasis was mainly concentrated in the middle and lower plains, the available water in the lower reaches has decreased, and the water demand needs to be maintained by overexploiting groundwater, which has destroyed the balance between supply and demand of water resources [53]. In contrast, the natural oasis had an overall shrinkage during the study period (Figure 3C). The shortage of ecological water in SRB might be one of the factors limiting vegetation growth. Meanwhile, the livestock stock in SRB increased significantly. Overgrazing led to grassland degradation, reducing the ecological stability of the oasis.
4.2. Spatial Distribution of the Oasis Change
Water resources are the most fundamental factors affecting the spatial distribution of oases. Topography and geomorphology have also been shown to affect the spatial distribution of oases [41,54], which is especially the case for SRB since it has a corridor structure with mountainous areas in the south, desert in the north, and plains in the middle, forming a complex topography and great differences in elevation and slope from south to north [41] (Figure 1D,E). Here, we select environmental factors such as elevation, slope, and distance to rivers to reveal the relationship between oasis evolution and natural factors.
In this study, we divided oasis change modes in SRB into four categories: stable, expanding, shrinking, and fluctuating oasis (Figure 4), with oasis change being more active in areas near 1350 m in elevation, 2° in slope, 1500 m away from rivers, 15 °C in temperature, and 120 mm in precipitation (Figure 5). By using the weighted center of gravity migration model, we found that the evolution process of the total oasis on the terrain was in the direction of decreasing elevation (Figure 6A) and less steep slope (Figure 6D), with the artificial oasis showing the same trend (Figure 6B,E) and the natural oasis changing alternatively (Figure 6C,F). The migration process, with regard to the proximity to rivers, was from being adjacent to rivers to moving outward around 1992, especially from 2002 to 2004 when the oasis migrated the fastest away from rivers. With the construction of irrigation facilities such as reservoirs, dams, and irrigation canals [5], the problem of agricultural irrigation was further solved, and the oasis gradually expanded outwards from the rivers (Figure 6G). Therefore, the particularity of the geographical environment and the limitation of water resources restrict the spatial distribution of the oasis in SRB.
4.3. Influencing Factors of Oasis Evolution
Oasis change is the result of the interaction of socio-economic, technological, and natural factors [11]. This study found that before 2000, there were significant positive correlations between oases areas and various influencing factors, especially GDP (total: 0.95; artificial: 0.89; natural: 0.88), Primary, Secondary, and Tertiary Industries (total: 0.93, 0.95, 0.93; artificial: 0.85, 0.89, 0.91; natural: 0.89, 0.88, 0.85), and population (total: 0.83; artificial: 0.79; natural: 0.93), except precipitation; after 2000, the total oasis and the artificial oasis were negatively correlated with population (−0.72 and −0.7), but positively correlated with other anthropogenic factors, while the natural oasis was negatively correlated with anthropogenic factors except population, but they all had the highest correlation with grain yield (total: 0.97; artificial: 0.97; natural: −0.87) and livestock stock (total: 0.95; artificial: 0.94; natural: −0.79). Secondly, principal component analysis showed that the first (agricultural development, socio-economic factors) and the second (population) principal components were human factors, with a contribution rate of 79%; and the third principal component was natural factors (wind speed), with a contribution rate of 9.8%. Anthropogenic factors mainly related to agricultural industry were thus found to be the main factors driving the oasis change in SRB, which is similar to the previous research results in SRB [5], Ejina oasis in Inner Mongolia [55], Jinghe oasis in Xinjiang [20].
In addition, since the reform and opening up, the northwest arid region has implemented a series of policies to promote oasis development [31]. The social and economic policies implemented have greatly stimulated farmers’ enthusiasm, leading to large-scale land reclamation and agricultural land expansion [56]. Additionally, the rapid growth of the population from 1980 to 2004 has increased the housing and food demand and prompted the transformation of a large number of unused land and natural oases into artificial oases through artificial reclamation. Moreover, since 2005, the cancellation of agricultural taxes and food subsidy policies have largely promoted the farmers’ grain production initiative and made more forest land and grassland reclaimed. The over-expansion of artificial oasis has increased irrigation water consumption and reduced ecological water available downstream. The ecological protection policies, such as the policy of returning farmland to forestry (1999), have inhibited the expansion of the artificial oasis to a certain extent, indirectly increased the forest and grassland area of SRB, and promoted ecological restoration. Specifically, since the implementation of the comprehensive management project of SRB in 2006, the groundwater level in the lower reaches of SRB rose, the supply of surface water increased, the shrinkage rate of the natural oasis slowed down, and the ecology of the Minqin oasis gradually improved.
4.4. Limitation of the Study
Our analysis spanned from 1980 to 2015, which covered the major historical period of oasis area changes under the influence of both natural and human factors. Due to the limitation of the available dataset, the time scale of this analysis is up to 2015. Through further investigation of literature and comparison with other historical land use datasets, the oasis in SRB was found to have continued to expand since 2015, with the area of the artificial oasis increasing and that of the natural oasis decreasing [27,33,47,57], consistent with the trend detected from our analysis for the period of 2010–2015. Yet, the specific change modes and natural evolution direction of the oasis after 2015 are still uncertain. With the availability of more recent land use datasets, future work could update the latest oasis evolution patterns and provide reference for more effective policies. Additionally, with improvement of the economic level and degradation of the ecological environment, people’s awareness of environmental protection has been gradually improved. Future work could further quantify the impact of human environmental awareness on the oasis changes as well as the mutual conversion between natural oases and artificial oases.
5. Conclusions
This study analyzed the characteristics of the oasis change in SRB from 1980 to 2015 under the influence of natural and human factors. First, on the spatiotemporal patterns of the oasis evolution, we found that the total oasis in SRB generally showed an expansion trend from 1980 to 2015, and the oasis area increased from 30,990 km2 to 32,020 km2. The natural oasis expanded first and then shrank, while the artificial oasis continuously expanded. Most oases were in a stable mode, but the oasis changes were mostly active in areas with an altitude of 1350 m, a slope of 2°, a distance of rivers 1500 m, a precipitation of 120 mm, and a temperature of 15 °C.
Second, regarding the oasis evolution direction, the total oasis and the artificial oasis continued to migrate towards to areas with less steep slope and smaller altitude and evolve closer to rivers before 1992 and then farther away from rivers. The evolution directions along elevation and slope were consistent between the total oasis and the artificial oasis, while the natural oasis showed fluctuating directions in topographic and hydrological factors.
Third, on the influencing factors of oasis evolution, the oasis change in SRB is a comprehensive reflection of the joint influence of anthropogenic factors and natural factors. Since SRB is dominated by agricultural production, agricultural-related factors such as grain yield had the greatest correlation with the oasis area in SRB. Furthermore, the policies implemented by national and local governments have played an important role in oasis development. Although ecological protection policies, such as returning farmland to forestry, have slowed down natural degradation to a certain extent, social economic development policy, such as the food subsidy policy, have still stimulated farmers’ enthusiasm to reclaim the lands and contribute to the expansion of the artificial oases. Therefore, it is still necessary to improve the policies and promote the sustainable development of the ecological environment in the future.
Author Contributions
Methodology, Y.F.; software, X.W.; formal analysis, Y.F. and X.W.; data curation, X.W.; writing—original draft preparation, Y.F. and X.W.; writing—review and editing, Y.F., X.W., Y.C., and Z.W.; project administration, Y.F. and Z.W.; funding acquisition, Y.F. and Z.W. All authors have read and agreed to the published version of the manuscript.
Funding
This research was funded by Joint Open Research Fund Program of State key Laboratory of Hydroscience and Engineering and Tsinghua–Ningxia Yinchuan Joint Institute of Internet of Waters on Digital Water Governance (sk1hse-2021-Iow04), the National Natural Science Foundation of China (42001023), and National Key Research and Development Project of China (2021YFD1900801).
Institutional Review Board Statement
Not applicable.
Informed Consent Statement
Not applicable.
Data Availability Statement
All the source data used in this study are publicly available and open access.
Conflicts of Interest
The authors declare no conflict of interest.
References
- Rahmutulla, A.; Tashkin, J. Discussion on oasis concept and its classification. Arid. Land Geogr. 2000, 23, 129–132. [Google Scholar]
- Gao, H. Definition of oasis and its naming and classification. J. Northwest Norm. Univ. (Nat. Sci.) 1987, 64–70. Available online: https://kns.cnki.net/kcms/detail/detail.aspx?dbcode=CJFD&dbname=CJFD8589&filename=XBSF198701010&uniplatform=NZKPT&v=GIDZ9kskxkF-2qRUOrfeC9ahq3S_wZyN9DkmYvCp9-gqUOWWOj8ncJEiyzsVJE-o (accessed on 27 October 2022).
- Xie, Y.; Gong, J.; Qian, D. Discussion of quantitative methods on oasis spatio-temporal change. Arid Zone Res. 2015, 32, 1247–1254. [Google Scholar]
- Zhou, D.; Wang, X.; Shi, M. Human driving forces of oasis expansion in Northwestern China during the last decade—A case study of the Heihe River Basin. Land Degrad. Dev. 2016, 28, 412–420. [Google Scholar] [CrossRef]
- Chen, Y.; Yang, G.; Zhou, L.; Liao, J.; Wei, X. Quantitative analysis of natural and human factors of oasis change in the tail of Shiyang River over the past 60 years. Acta Geol. Sin. 2020, 94, 637–645. [Google Scholar] [CrossRef]
- Yang, G.; Li, F.; Chen, D.; He, X.; Xue, L.; Long, A. Assessment of changes in oasis scale and water management in the arid Manas River Basin, north western China. Sci. Total Environ. 2019, 691, 506–515. [Google Scholar] [CrossRef] [PubMed]
- Xiao, F.; Gao, G.; Shen, Q.; Wang, X.; Ma, Y.; Lü, Y.; Fu, B. Spatio-temporal characteristics and driving forces of landscape structure changes in the middle reach of the Heihe River Basin from 1990 to 2015. Landsc. Ecol. 2019, 34, 755–770. [Google Scholar] [CrossRef]
- Almadini, A.M.; Hassaballa, A.A. Depicting changes in land surface cover at Al-Hassa oasis of Saudi Arabia using remote sensing and GIS techniques. PLoS ONE 2019, 14, e221115. [Google Scholar]
- Tsegaye, D.; Moe, S.R.; Vedeld, P.; Aynekulu, E. Land-use/cover dynamics in Northern Afar rangelands, Ethiopia. Agric. Ecosyst. Environ. 2010, 139, 174–180. [Google Scholar] [CrossRef]
- Imaz-Lamadrid, M.A.; Wurl, J.; Arizpe-Covarrubias, O.; Romero-Vadillo, E. Deterioration of oases subject to climate change and coastal development: The case of Todos Santos Oasis, Baja California Sur, Mexico. Groundw. Sustain. Dev. 2020, 11, 100401. [Google Scholar] [CrossRef]
- Muyibul, Z.; Jianxin, X.; Muhtar, P.; Qingdong, S.; Run, Z. Spatiotemporal changes of land use/cover from 1995 to 2015 in an oasis in the middle reaches of the Keriya River, southern Tarim Basin, Northwest China. Catena 2018, 171, 416–425. [Google Scholar] [CrossRef]
- Gao, P.; Kasimu, A.; Zhao, Y.; Lin, B.; Chai, J.; Ruzi, T.; Zhao, H. Evaluation of the Temporal and Spatial Changes of Ecological Quality in the Hami Oasis Based on RSEI. Sustainability 2020, 12, 7716. [Google Scholar] [CrossRef]
- Bai, X.; Jin, H.; Qian, Y. Analysis on oasis study literatures in China during recent 10 years. J. Arid. Land Resour. Environ. 2010, 24, 115–118. [Google Scholar]
- Song, W.; Zhang, Y. Expansion of agricultural oasis in the Heihe River Basin of China: Patterns, reasons and policy implications. Phys. Chem. Earth Parts A/B/C 2015, 89–90, 46–55. [Google Scholar] [CrossRef]
- Ait Lamqadem, A.; Pradhan, B.; Saber, H.; Rahimi, A. Desertification sensitivity analysis using MEDALUS Model and GIS: A case study of the oases of Middle Draa Valley, Morocco. Sensors 2018, 18, 2230. [Google Scholar] [CrossRef]
- Shrivastava, P.K.; Roy, S.K.; Srivastava, H.B.; Dharwadkar, A. Estimation of Paleo-ice Sheet Thickness and Evolution of Landforms in Schirmacher Oasis and Adjoining Area, cDML, East Antarctica. J. Geol. Soc. India 2019, 93, 638–644. [Google Scholar] [CrossRef]
- Tan, Z.; Guan, Q.; Lin, J.; Yang, L.; Luo, H.; Ma, Y.; Tian, J.; Wang, Q.; Wang, N. The response and simulation of ecosystem services value to land use/land cover in an oasis, Northwest China. Ecol. Indic. 2020, 118, 106711. [Google Scholar] [CrossRef]
- Zhang, Z.; Xu, E.; Zhang, H. Complex network and redundancy analysis of spatial–temporal dynamic changes and driving forces behind changes in oases within the Tarim Basin in northwestern China. Catena 2021, 201, 105216. [Google Scholar] [CrossRef]
- Guan, Q.; Yang, L.; Pan, N.; Lin, J.; Xu, C.; Wang, F.; Liu, Z. Greening and browning of the Hexi Corridor in Northwest China: Spatial patterns and responses to climatic variability and anthropogenic drivers. Remote Sens. 2018, 10, 1270. [Google Scholar] [CrossRef]
- Liu, C.; Zhang, F.; Carl Johnson, V.; Duan, P.; Kung, H. Spatio-temporal variation of oasis landscape pattern in arid area: Human or natural driving? Ecol. Indic. 2021, 125, 107495. [Google Scholar] [CrossRef]
- Li, S.; Zhang, Z.; Wang, T.; Yan, C.; Du, H. Oasis functional stability evaluation based on multiple Indicators, Northwest China. Acta Geol. Sin. Engl. Ed. 2020, 94, 624–636. [Google Scholar] [CrossRef]
- Xue, J.; Gui, D.; Zeng, F.; Yu, X.; Sun, H.; Zhang, J.; Liu, Y.; Xue, D. Assessing landscape fragmentation in a desert-oasis region of Northwest China: Patterns, driving forces, and policy implications for future land consolidation. Environ. Monit. Assess. 2022, 194, 394. [Google Scholar] [CrossRef] [PubMed]
- Zhang, Q.; Xu, H.; Li, Y.; Fan, Z.; Zhang, P.; Yu, P.; Ling, H. Oasis evolution and water resource utilization of a typical area in the inland river basin of an arid area: A case study of the Manas River valley. Environ. Earth Sci. 2012, 66, 683–692. [Google Scholar] [CrossRef]
- Jiang, Y.; Du, W.; Chen, J.; Wang, C.; Wang, J.; Sun, W.; Chai, X.; Ma, L.; Xu, Z. Climatic and Topographical Effects on the Spatiotemporal Variations of Vegetation in Hexi Corridor, Northwestern China. Diversity 2022, 14, 370. [Google Scholar] [CrossRef]
- Zhou, J.; Zhang, H.; Zhang, L.; Cao, J.; Wei, W. Spatiotemporal Evolution of Landscape Pattern in the Minqin Oasis before and after Implementing the Comprehensive Management. Arid Zone Res. 2017, 34, 79–87. [Google Scholar]
- Xie, Y.; Bie, Q.; Lu, H.; He, L. Spatio-temporal changes of oases in the Hexi Corridor over the past 30 years. Sustainability 2018, 10, 4489. [Google Scholar] [CrossRef]
- Feng, B.; Nie, Z.; Wang, J.; Lu, H.; Cheng, X.; Dong, S.; Wang, B.; Fan, F. Long-time series remote sensing dynamic monitoring of the oasis in Shiyang River Basin. Geospat. Inf. 2020, 18, 10–13, 23. [Google Scholar]
- Han, T.; Xie, Y.; Jiang, Y.; Liu, J.; Sun, H. The Land Use Change Characteristics and Its Driving Force Analysis of Shiyang River Basin in Northwest China; SPIE: Bellingham, WA, USA, 2015; p. 98150N. [Google Scholar]
- Tong, H.; Shi, P.; Zhu, G.; Pearson, A.; Li, Q.; Liu, Y.; Liu, H. The characteristics of oasis urban expansion and drive mechanism analysis: A case study on Ganzhou District in Hexi Corridor, China. Sci. Cold Arid. Reg. 2015, 7, 282–292. [Google Scholar]
- Liu, Y.; Abdushalam, J.; Alanuer, A.; Mahpirat, N. Spatiotemporal change of the oasis in Gaochang, Turpan and its driving factors during the period of 1989–2016. Arid Zone Res. 2018, 35, 945–953. [Google Scholar]
- Wei, W.; Li, Z.; Xie, B.; Zhou, J.; Li, C. Spatio-temporal change and driving force of oasis for desert reservoir from 1988 to 2016 in northwestern China. Pol. J. Environ. Stud. 2020, 29, 871–884. [Google Scholar] [CrossRef]
- Wang, Y.; Xia, T.; Shataer, R.; Zhang, S.; Li, Z. Analysis of characteristics and driving factors of land-use changes in the Tarim River Basin from 1990 to 2018. Sustainability 2021, 13, 10263. [Google Scholar] [CrossRef]
- Zhang, G.; Nie, Z.; Cui, H.; Wang, Q.; Yan, M.; Tian, Y.; Wang, J. Main causes and mechanism for the natural oasis de-generation in the lower reaches of northwest inland basins. Hydrogeol. Eng. Geol. 2022, 49, 1–11. [Google Scholar]
- He, K.; Wu, S.; Yang, Y.; Wang, D.; Zhang, S.; Yin, N. Dynamic changes of land use and oasis in Xinjiang in the last 40 years. Arid. Land Geogr. 2018, 41, 1333–1340. [Google Scholar]
- Huang, L.; Xu, L. Spatiotemporal evolution of the oasis and change of landscape pattern in the Manas River Basin. Arid Zone Res. 2019, 36, 1261–1269. [Google Scholar]
- Dong, J.; Xie, Y.; Duan, H.; Wang, X.; Li, R. Pattern and stability analysis of oasis change in Heihe River Basin. Arid Zone Res. 2020, 37, 1048–1056. [Google Scholar]
- Li, X.; Xiao, D. Dynamics of water resources and land use in oases in middle and lower reaches of Shiyang River watershed, Northwest China. Adv. Water Sci. 2005, 16, 643–648. [Google Scholar]
- Saha, S.; Paul, G.C.; Hembram, T.K. Classification of terrain based on geo-environmental parameters and their relationship with land use/land cover in Bansloi River basin, Eastern India: RS-GIS approach. Appl. Geomat. 2020, 12, 55–71. [Google Scholar] [CrossRef]
- Bie, Q.; Xie, Y. The constraints and driving forces of oasis development in arid region: A case study of the Hexi Corridor in northwest China. Sci Rep. 2020, 10, 17708. [Google Scholar] [CrossRef]
- Liu, X.; Yang, Z.; Ma, Z.; Feng, D.; Geoffrey, W. Land use and land cover pattern in Kanas Natural Reserve based on terrain factors. Arid. Land Geogr. 2011, 34, 851–857. [Google Scholar]
- Wei, W.; Xie, Y.; Shi, P.; Zhou, J.; Li, C. Spatial Temporal Analysis of Land Use Change in the Shiyang River Basin in Arid China, 1986–2015. Pol. J. Environ. Stud. 2017, 26, 1789–1796. [Google Scholar] [CrossRef]
- Lu, H.; Nie, Z.; Liu, M.; Feng, B.; Cheng, X.; Wang, J.; Wang, Q.; Cui, H.; Fan, F. Research on land cover change in Shiyang River Basin in recent 50 years based on RS and GIS. Geol. Resour. 2020, 26, 165–171. [Google Scholar]
- Hu, X.Q.; Jin, Y.Z.; Ji, L.H.; Zeng, J.J.; Cui, Y.Q.; Song, Z.F.; Sun, D.Y.; Cheng, Y.F. Land use/cover change and ITS eco-environment effect in Shiyang River Basin. IOP Conf. Ser. Earth Environ. Sci. 2018, 191, 12016. [Google Scholar] [CrossRef]
- Li, F.; Zhu, G.; Guo, C. Shiyang River ecosystem problems and countermeasures. Agric. Sci. 2013, 04, 72–78. [Google Scholar] [CrossRef]
- Xu, Y.; Yu, L.; Peng, D.; Zhao, J.; Cheng, Y.; Liu, X.; Li, W.; Meng, R.; Xu, X.; Gong, P. Annual 30-m land use/land cover maps of China for 1980–2015 from the integration of AVHRR, MODIS and Landsat data using the BFAST algorithm. Science China. Earth Sci. 2020, 63, 1390–1407. [Google Scholar] [CrossRef]
- Peng, S.; Ding, Y.; Liu, W.; Li, Z. 1 km monthly temperature and precipitation dataset for China from 1901 to 2017. Earth Syst. Sci. Data 2019, 11, 1931–1946. [Google Scholar] [CrossRef]
- Lu, H.; Xie, Y.; Zhang, W.; Wei, J. Spatiotemporal Change of the Oasis in Minqin County during the Period from 1986 to 2015. Arid Zone Res. 2017, 34, 1410–1417. [Google Scholar]
- Li, X.; Xiao, D.; He, X.; Chen, W.; Song, D. Factors associated with farmland area changes in arid regions: A case study of the Shiyang River basin, northwestern China. Front. Ecol. Environ. 2007, 5, 139–144. [Google Scholar] [CrossRef]
- Diao, W.; Zhao, Y.; Zhai, J.; He, F.; Sui, B.; Zhu, Y. Temporal spatial evolution and driving force analysis of Minqin oasis during 1987—2017. J. Irrig. Drain. 2019, 38, 106–113. [Google Scholar]
- Zhou, J.; Zhao, Y.; Huang, P.; Zhao, X.; Feng, W.; Li, Q.; Xue, D.; Dou, J.; Shi, W.; Wei, W.; et al. Impacts of ecological restoration projects on the ecosystem carbon storage of inland river basin in arid area, China. Ecol. Indic. 2020, 118, 106803. [Google Scholar] [CrossRef]
- Wang, Y.; Zhao, J.; Fu, J.; Wei, W. Effects of the Grain for Green Program on the water ecosystem services in an arid area of China—Using the Shiyang River Basin as an example. Ecol. Indic. 2019, 104, 659–668. [Google Scholar] [CrossRef]
- Li, Y.; Liu, W.; Feng, Q.; Zhu, M.; Yang, L.; Zhang, J.; Yin, X. The role of land use change in affecting ecosystem services and the ecological security pattern of the Hexi Regions, Northwest China. Sci. Total Environ. 2023, 855, 158940. [Google Scholar] [CrossRef] [PubMed]
- Ainiwaer, M.; Ding, J.; Wang, J.; Nasierding, N. Spatiotemporal dynamics of water table depth associated with changing agricultural land use in an arid zone oasis. Water 2019, 11, 673. [Google Scholar] [CrossRef]
- Cui, W.; Mu, G. Application of RS technology in the research of oasis dynamic change. Geo-Inf. Sci. 2004, 6, 105–107. [Google Scholar]
- Gao, G.; Zhang, X.; Yu, T.; Li, X. Land cover change and its driving factors in the Ejin Oasis during 1987–2008. J. Desert Res. 2015, 35, 821–829. [Google Scholar]
- Xue, X.; Liao, J.; Hsing, Y.; Huang, C.; Liu, F. Policies, Land Use, and Water Resource Management in an Arid Oasis Ecosystem. Environ Manag. 2015, 55, 1036–1051. [Google Scholar] [CrossRef] [PubMed]
- Ngabire, M.; Wang, T.; Xue, X.; Liao, J.; Sahbeni, G.; Huang, C.; Song, X.; Duan, H.; Nyiransengiyumva, C. Synergic effects of land-use management systems towards the reclamation of Aeolian Desertified Land in the Shiyang River Basin. Ecol. Indic. 2022, 139, 108882. [Google Scholar] [CrossRef]


Publisher’s Note: MDPI stays neutral with regard to jurisdictional claims in published maps and institutional affiliations. |
© 2022 by the authors. Licensee MDPI, Basel, Switzerland. This article is an open access article distributed under the terms and conditions of the Creative Commons Attribution (CC BY) license (https://creativecommons.org/licenses/by/4.0/).