Article

Spatial Lifestyle Clusters and Access to the City: Evidence from the Stockholm Region

Division of Urban and Regional Studies, KTH Royal Institute of Technology, 10044 Stockholm, Sweden
Sustainability 2022, 14(21), 14261; https://doi.org/10.3390/su142114261
Submission received: 23 September 2022 / Revised: 18 October 2022 / Accepted: 26 October 2022 / Published: 1 November 2022
(This article belongs to the Section Sustainable Urban and Rural Development)

Abstract

:
This paper analyses the distribution of social infrastructure (accessibility to services and job opportunities) in a perspective of spatial lifestyle stratification in the Stockholm region. The study is based on a questionnaire completed by 1160 respondents, capturing individual data on attitudes, lifestyles and demography, and urban morphological qualities developed from high resolution register data. The spatial social stratification is based on a spatial cluster analysis on six lifestyles: highly success-oriented; success-oriented with high work ethics; conscious young and elder; people with weak motivations; designers; and middle-class bourgeois. They are spatially distributed in eight overlapping spatial clusters, namely: highly success-oriented and socially mixed central inner city; designers’ inner suburbia; socially mixed inner suburbia; middle-class bourgeois suburbia; highly success-oriented suburbia; conscious young-elder suburbia; socially mixed exurbia; and socially mixed rurality. It turns out that people characterized by weak motivation lifestyle (low income, low education level, not success oriented, etc.) are the most negatively affected lifestyle cluster concerning accessibility to jobs and service. A total of 45% of the ‘weak motivation lifestyle’ respondents reside in ‘socially mixed exurbia’ and ‘socially mixed rurality’. They experience less than 20% of social infrastructure compared to, in this respect, the most privileged spatial lifestyle cluster, the ‘highly success-oriented and socially mixed central inner city’ cluster. Still, surprisingly, this ‘weak motivation’ lifestyle is also concentrated in the ‘socially mixed inner suburbia’ cluster. One reason for this dual spatial concentration might be the Swedish rental policy, linked to residential use-values and a queuing system, instead of exchange values. This policy allows for a complex spatial social stratification influenced by a range of factors (lifestyle and attitudes among others), and not merely income.

1. Introduction

Social sustainability in an urban perspective is an important goal on the global level [1], in Swedish national sustainability goals [2], and in the regional plan of Stockholm [3]. Social sustainability has many definitions but is often linked to the formation of social capital, equal opportunities, and life changes [4,5]. These aspects are also emphasized in the regional plan of Stockholm [3] (pp. 39–40, 169). Klinenberg [6] (p. 5) defines ‘social infrastructure’ as “the physical condition that determine whether social capital develops” and emphasizes the importance of providing social infrastructure in developing “better, more equitable, and sustainable solutions for the challenges facing our cities and suburbs […]” (p. 81), see also [7]. Teriman, Yigitcanlar, and Mayere [8] (p. 2) state that social infrastructure “supports the accumulation and enhancement of human capital”. Examples of such social infrastructure is the provision of “health, education [and] employment […]” (p. 2). The provision of social infrastructure is, according to Teriman et al. [8] (p. 5), also linked to the development of “sustainable communities” and “urban sustainability”. One of the goals in the regional plan of Stockholm is to provide equal opportunities to jobs, recreation, and various urban and rural milieus [3]. Consequently, accessibility to workplaces (representing access to job opportunities and services) is one crucial social infrastructure in the city [9]. This accessibility might be unevenly distributed among citizens, possibly reinforcing unequal opportunities and the lack of social capital. In this paper, the distribution of accessibility to workplaces—a social infrastructure—is analyzed in the perspective of spatial social stratification, a spatial life style approach. The need for urban transitions promoting a socially, ecologically, and economically sustainable society, has been comprehensively described by Frantzeskaki et al. [1].
By addressing spatial distribution in accessibility among social groups, this paper aims at contributing to the planning goals regarding urban inequalities in the Stockholm region. The spatial lifestyle clusters are computed by using statistical cluster techniques based on demography, urban morphology, and lifestyle variables. The lifestyle variables are received by factor analysis on variables from a questionnaire (2019) based on lifestyle theories [10], see also [11].
The research questions to be answered are:
  • Does a social stratification exist, and in that case, how does it look?
  • Does a spatial social stratification exist, and in that case, how does it look?
  • How is access to workplaces and service—a social infrastructure—linked to social stratification?
The paper has the following structure: the first section provides an introduction to infrastructure planning in a historical perspective; the linkage between social sustainability, social infrastructure, and spatial social stratification. The second section presents existing literature on social infrastructure in a spatial perspective. In the third section, the material and methods are presented. The results are presented in the fourth section. In the final section, implications for planning, critical assessment, and a suggestion for future studies are discussed.

2. Existing Literature

This section begins with a description of the concept of ‘infrastructure’ in a historical and urban morphological perspective, linked to sustainability, meeting points, and the formation of social capital. Specific findings on ‘social infrastructure’ are then described.
Neuman and Smith [12], and Vitiello [13], describe how intertwined infrastructure planning and urban planning have been in a historical perspective. Planners such as Haussmann (1809–1891), and Cerda (1815–1876), in their planning of Paris and Barcelona, respectively, and the American City Beautiful Movement, adopted a holistic perspective integrating (large scale) transport infrastructure and (local) urban environments. Thus, the development of social infrastructure through planning has historical roots. However, ever since the nineteenth century, these two dimensions of city planning have been increasingly separated. Frantzeskaki et al. [1] point out the need for urban transition in order to promote sustainability, and the important role of infrastructure in influencing behavior and urban development. Aditionally, Atkinsson et al. [14] (pp. 148–149) emphasizes the link between economy and sociology; housing economists, with great influence on urban development, should incorporate knowledge from sociology and thereby increase the understanding of the functioning of the housing market, in terms of “the [residents] views, beliefs and chances in life” (p. 149) elevated, by for instance, access to social infrastructure. Then, the possibility of promoting “a more equitable society” would increase as well [14] (p. 149). Further, recent studies on urban equity in three global cities, Barcelona, Beijing, and Milan, promotes a planning approach on “superblocks”, focusing on reducing traffic in the city, and “tactical urbanism”, focusing on “a neighbourhood-scaled approach” aiming at reducing “urban equalities” [15] (pp. 386–387, 400). In line with these initiatives, urban form localization of co-worker space in neighborhoods might also be an effective option to strengthen social capital on the local scale. According to Manika [16], such an initiative has been launched in situations characterized by shrinking cities and should also work in urban setting characterized by increasing distance work. These efforts should thus strengthen social infrastructure (local meeting places promoting the development of social capital) on the local scale, and thereby promote social sustainability. The provision of meeting points in the city might also be linked to an understanding of the city as a satisfier of social, ecological, and economic needs (for instance, the need for participation), promoting the quality of life [17]. In line with this focus on local urban morphology, brownfields, as Gastaldi and Camerin [18] (pp. 173–174) illustrate, could on the one hand serve as an unexploited resource for profit-driven urban development, which causes gentrification, loss of local identities, and the loss of “space for reproduction of the lower classes”. But on the other hand, it might also serve as an unexploited resource, and as a catalyst for creating new social infrastructure, improving living conditions on a local scale, strengthening local identities, and social capital. Still, the concept ‘social infrastructure’ is, according to Davern, Gunn, Whitzman, Higgs, Giles-Corti, Simons, Villanueva, Mavoa, Roberts, and Badland [19] (p. 195), “poorly defined”, and the existing literature focusing on social infrastructure research exposes, according to Latham and Layton [20] (p. 5), an “enormous variety”. This section aims at illuminating the concept ‘social infrastructure’ to provide an overview regarding contemporary spatial research on social infrastructure.
Davern et al. [19] link accessibility to social infrastructure (employment included, p. 196), “social equity” (p. 196), “subjective wellbeing (SWB)” (p. 200), and the aim of “allocate resources fairly” (p. 196). The study area is the state of Victoria, Australia. Davern et al. [19] (p. 196) point out the rather limited amount of research using spatial analysis (GIS) in studying social infrastructure. By regression analysis, using aggregated data in 79 local government areas comprising 24 900 people, SWB was related to a number of demographic variables and six social infrastructure themes. The provision of social infrastructure within four different distance buffers in the range from 800 to 1600 m from where the residential location was tested. The general result was that “access to a mix of social infrastructure was associated with SWB [...]” [19] (p. 202). Thus, Davern et al. [19] confirm the link between accessibility representing social infrastructure and SWB representing social sustainability. According to Davern et al. [19] (p. 205): “Future research should also examine the importance and applicability of social infrastructure service and facilities to different demographic groups […]”. Davern et al. [19] (p. 205) emphasize the need of investigating location effects, as “middle suburbs or inner city locations” on the provision of social infrastructure.
Higgs, Badland, Simons, Knibbs, and Giles-Cort, analyze the relation between social infrastructure, the urban liveability index (ULI), and travel mode in Melbourne, Australia [21]. One argument for the study was to “to capture the spatial distribution of within-city variation so that any inequities in urban liveability may be assessed quantitatively and visually” (p. 2). Another was to develop an ULI “to study the impact of the distribution of accessibility and availability of liveability domains” (p. 22), and a third was to support the UN Sustainable Development Goals [22] through the positive relation between ULI, social infrastructure, and “sustainable cities and communities [21] (p. 21). Higgs et al. [21] develop their method on the ULI index based on the guidelines from OECD [23] on constructing ULI indicators. The spatial ULI index is based on seven (spatial) sub-domains representing access to public transport, social infrastructure mix (accessibility to 15 types of destinations), and walkability, etc. These sub-domains in turn are constructed (and positioned in space) based on seven “liveability domains”: transport facilities, social infrastructure (also here), employment, etc. A high ULI indicates a high social infrastructure mix. Thus, for each geographical unit (a “Mesh block”) the ULI is computed. Even though, the main focus in Higgs et al.’s study is not the spatial relation between lifestyles and social infrastructure, they present interesting results regarding the distribution of social infrastructure among the respondents linked to geography [21]. According to Higgs et al. [21] (p. 10): “A non-linear relationship was observed between liveability [and thus social infrastructure mix] and income: those in the lowest and highest income brackets were similarly likely to live in a location of highest ULI”. Thus, the spatial relation between ULI (and the provision of social infrastructure) and income is not straight forward. Higgs et al. [21] (p. 21) recommend for future studies to develop the ULI by including “personal preferences” and “different ‘liveability profiles’”.
Nicoletti, Sirenko, and Verma [24] (p. 3) refer to Klinenberg [6] and link the provision of urban infrastructure and accessibility to the provision of social infrastructure as devices of attaining “resilient and less unequal societies”. In contrast to other kinds of spatial research on social infrastructure, Nicoletti et al. developed five urban profile types based on socio-economic attributes [24]. According to Nicoletti et al. [24] (pp. 2–3), many cities have (similar to the Stockholm region, [3], pp. 39–40) implemented policies on “reducing inequalities in accessibility among urban communities […], therefore, systematic understanding on the variability in spatial distribution of access and the associated demographic distribution is instrumental in designing targeted and equitable policies for addressing urban inequalities”. Nicoletti et al. [24] (p. 1) analyze the accessibilities in relation to “socioeconomically clustered urban profiles” based on demography and other determinants in 10 North American cities [24]. They link improvement in social infrastructure to a reduction in “inequalities in accessibility among urban communities” (p. 2), and emphasizes the importance of understanding “the nature and distribution of spatial accessibility among urban communities” (p. 1). [24] Nicoletti et al.’s (2022) definition of accessibility (to amenities and jobs, p. 3) is based on the walking distance and the importance of seven destination categories (p. 21). Thus, as we understand, Nicoletti et al. adopt an intra-urban perspective on accessibility [24]. Median accessibility measures are then related to five “urban profiles” (low income mixed, low income minority, medium income white, high income white, and medium income white suburban) based on socio-economic attributes (clustering techniques, p. 11) in spatial units of 250 × 250 m (p. 26). By this procedure, the authors conclude, in contrast to Higgs et al. [21] (p. 10), that low income and low educated communities also experience low accessibility and are “structurally under-served by urban infrastructure” (p. 14).
Sun X., Wang W., Sun T., and Wang Y. P. analyze associations between social infrastructure and urban attributes in the city of Tianjin, China [25]. In contrast to other kinds of spatial research on social infrastructure, they include the distance to the city center and other urban morphological aspects. The argument of the study is to inform planners on unequal opportunities for different social and economic groups. Access to social infrastructure is defined as the number of facilitates (25 types, aggregated into six categories) that could be reached within 1 km from each residential community. The accessibilities were computed for 2602 neighborhoods in the six central urban districts of Tianjin. Sun et al. analyze the distribution of social infrastructure in relation to: (1) neighborhood attributes; (2) administrative districts; and (3) concentric zones based on the distance to the city center using comparative histograms [25]. Sun et al. [25] (p. 9) conclude that: “The residents living in the neighbourhoods near the hot regions [(in the city centre)] would have more opportunities to visit the corresponding [social] infrastructures and enjoy better living conditions. On the contrary, the residents living in the neighbourhoods far away from the hot regions might suffer from poor services in their daily lives”.
These studies expose, in various ways, linkages between demography, social infrastructure, and accessibility. They provide evidence for a positive statistical association between, on the one hand, access to social infrastructure and, on the other, subjective well being [19], the urban liveability index [21], and sustainability issues in general. They also reveal an unequal distribution of social infrastructure between income segments [21], between spatially defined urban profiles based on demography ([24], between urban neighborhoods [25], and, due to urban morphological characteristics, as the distance to the city center [25].
The intention in this current study is to contribute to the existing literature by not only including urban attributes and demography, but also lifestyle attributes, in the analysis on the spatial distribution of social infrastructure (here represented by access to jobs and service). Whereas Sun et al. analyze the distribution of social infrastructure in concentric zones based on the distance from the city center 25], this current study intends to first analyze the spatial distribution of lifestyles, and second to link these lifestyles to demography and urban morphology (including the distance to the city center) in the form of spatial lifestyle clusters.

3. Theoretical Framework

The theoretical framework guides the researcher in designing research procedures. This section aims at theoretically illuminating the concepts of ‘sustainability’, ‘social capital’, ‘lifestyles’, ‘social infrastructure’, and ‘urban morphology’.

3.1. Social Sustainability

Social capital is, according to Serageldin [4] and Serageldin et al., [5], one of four dimensions in forming sustainability. Social capital has many definitions (see also [26] (p. 73)) but might generally be defined as “resources [for action] embedded in the social network” [27] (p. 418). Similar to O’ Donnell et al. [27] (p. 419), a further precise understanding of social capital based on Habermas is here presented (see also [28]). According to O’Donnell et al., social capital cannot be created “on one’s own, the communicative relation between people is […] the kernel of social capital creation” [27] (p. 415). Therefore, the meeting point is a core component in understanding the creation of social capital. This makes Habermas’ theory on communicative action an interesting resource in understanding the importance of social capital [28,29].
According to Habermas, at the meeting point, where people communicate, the formation of identity, solidarity, and societal responsibility take place [30] (see also [27] (pp. 420–421)):
Under the functional aspect of mutual understanding, communicative action serves to transmit and renew cultural knowledge; under the aspect of coordinating action, it serves social integration and the establishment of solidarity; finally, under the aspect of socialization, communicative action serves the formation of personal identities. The symbolic structures of the lifeworld are reproduced by way of the continuation of valid knowledge, stabilization of group solidarity; and socialization of responsible actors. […] The interaction woven into the fabric of everyday communicative practice constitute the medium through which culture, society, and person get reproduced.
Habermas [30] (pp. 137–138)
We here loosely define social capital to correspond to Habermas’ notions on identity formation, solidarity, and social responsibility [30]. According to Habermas [30] (p. 141), when the socialization process is disturbed it is “manifested in psychopathologies and corresponding phenomena of alienation” and societal responsibility is, as well, negatively affected (cf. [31], p. 395). Meeting points fostering social capital might develop in many places, like in the coordination among neighbors, in managing cleaning the common stairway, or among parents in organizing the transport of children between school and other activities, and so on. Or, as Habermas defines these kinds of meeting points: “the life world of a social group” [30] (pp. 117, 139), or the situation where “the speaker and hearer meet” [30] (p. 126). People meet, share knowledge, and develop understanding and trust.
The workplace is one important meeting point in the city where social capital is formed, see [27,28,29,32]. Thereby, the spatial distribution of workplaces influences the creation of social capital in a city (see also [33]). Still, the distribution of workplaces, and other aspects of social infrastructure, depends on the urban morphology ([34,35], see also [25]). Social infrastructure might thus expose an unequal distribution among various socio-economic groups [21,24] and lifestyles (see [11]), and thereby counteract the creation of social capital and sustainability. Therefore, it is of interest to study how social infrastructure is distributed among various socio-economic groups and lifestyles in space.

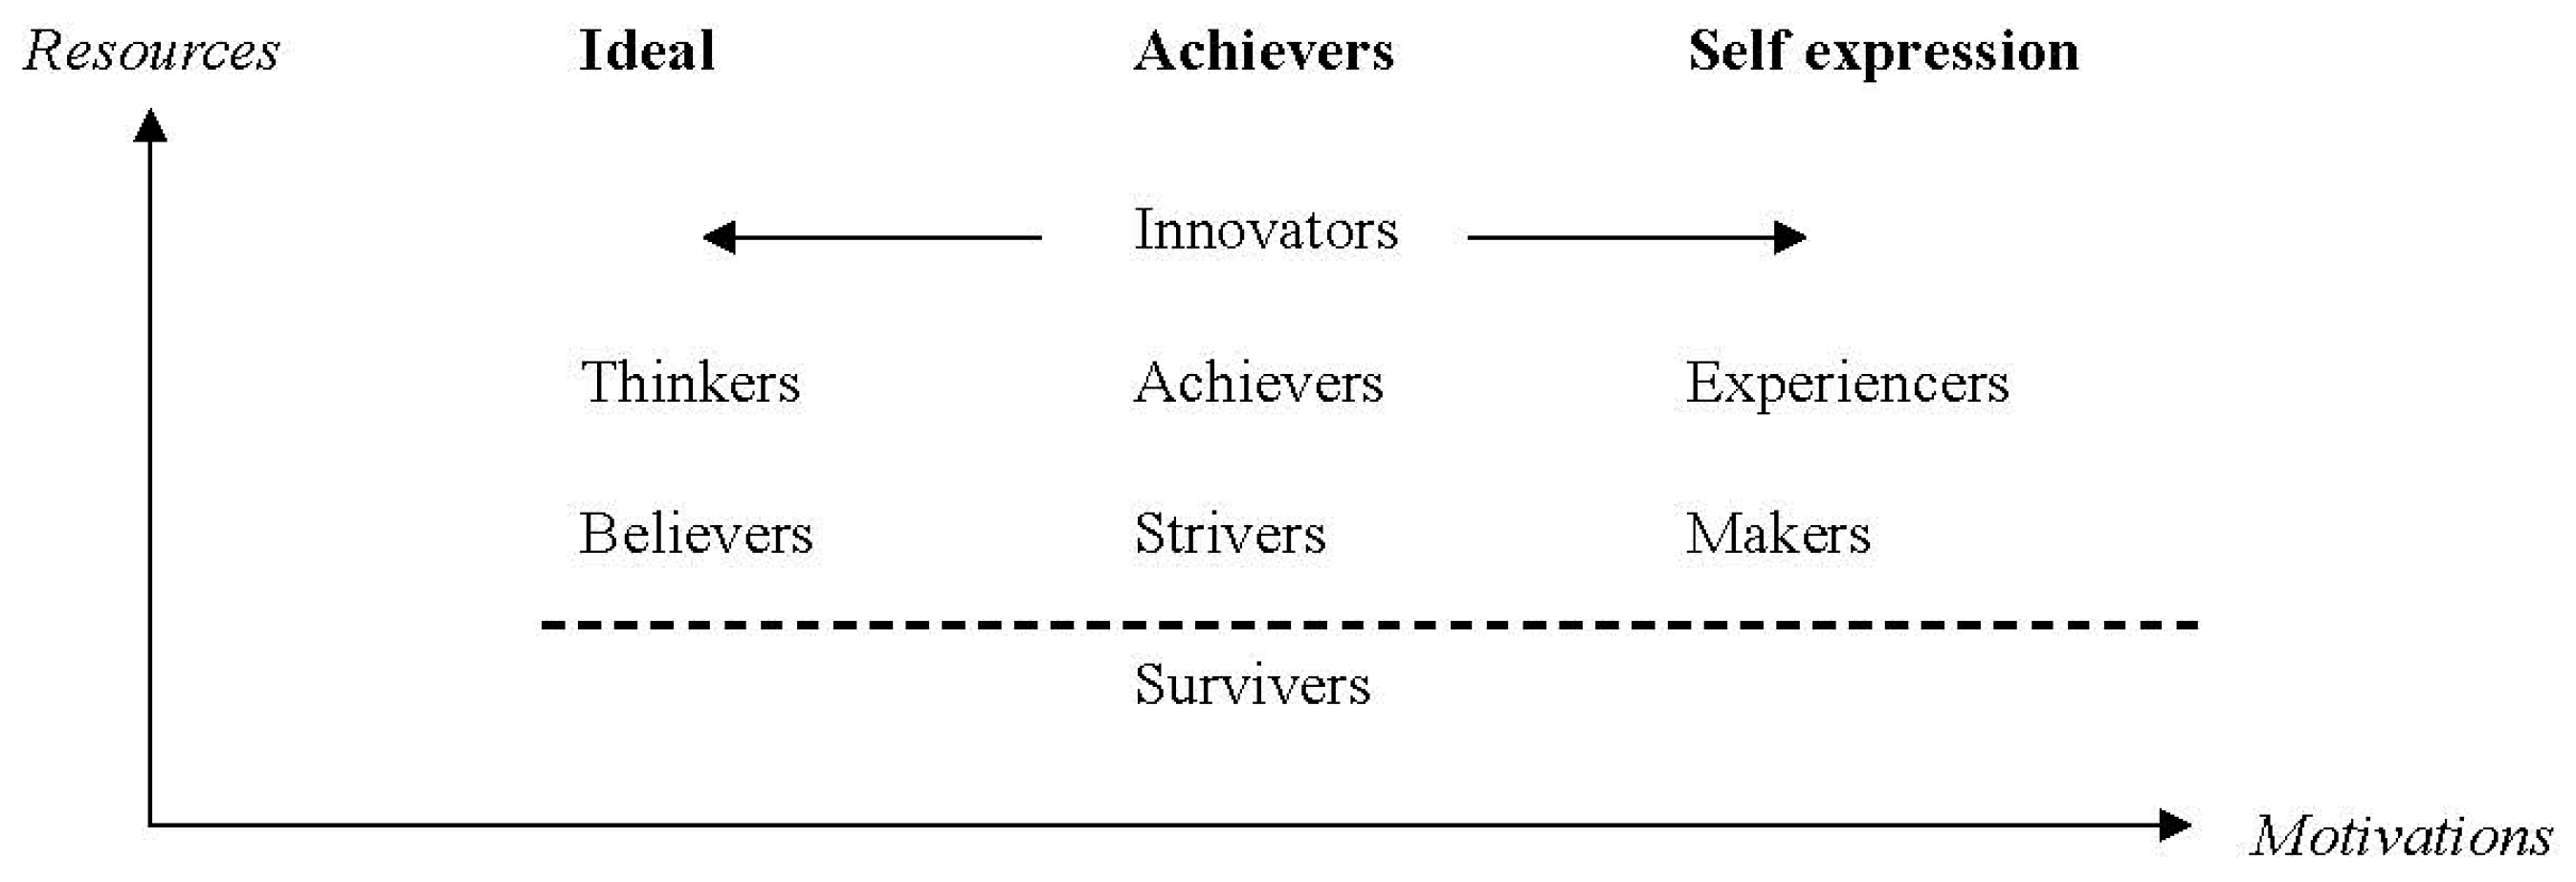
3.2. Lifestyle Theories

In terms of housing, people are not, as described above, spatially distributed in a city solely due to demographical attributes—attitudes, lifestyles, and desires for specific residential milieus and cultural consumption also matter (see [36,37,38,39]; as well as seminal theories from Burgess and Park [40], Hoyt [41], and Harris and Ullman [42]). As lifestyles have an influence on location patterns, this aspect also has an influence on the spatial distribution of social infrastructure. With the ambition to support the development of equal access to social infrastructure, and the creation of social capital through planning, it is therefore of interest to gain knowledge about the spatial distribution of lifestyles.
The concept ‘lifestyle’ has been defined in a number of ways, occasionally with overlapping definitions, and occasionally with contradictory definitions. Van Acker et al. [11] provide an overview of lifestyle theories and an informative lifestyle typology based on Pisman [43], Munters [44], and Kitamura [45], with references to seminal sociological works. For instance, ‘lifestyle’ might be related to material condition (Marx et al. and Marx, [46,47]), city size (Simmel [48]), demographics (Bourdieu [49], or a voluntary desired ‘style of life’ (Weber [50]).
More recently, Kitamura emphasizes the difference between lifestyle as “activity and time use patterns” and lifestyle as “value and behavioral orientation” [45] (p. 680). Additionally, Munters split the concept of ‘lifestyle’ in ‘lifestyle expressions’ and ‘lifestyle orientations’ [44] (see also van Acker et al. [11] (p. 27)). van Acker et al. [11] (pp. 27–28) refer to Pisman [43] and present a total of eight lifestyle approaches: (1) the “demographic approach” on socio-economic characteristics; (2) the “psychographic lifestyle approach” on “personality traits and related motives, norms and values”; (3) the “cultural lifestyle approach” on “common underlying norms and values”; (4) the “sociographic lifestyle approach” on “shared opinions and attitudes”; (5) the “psychographic marketing approach”—a combination of “personality traits but also norms and values as well as attitudes” with an intention of provide insight on consumption behavior; (6) the “mechanistic lifestyle approach” on “behavioral patterns”; (7) the “geodemographic lifestyle approach”, also including spatial qualities; and finally (8) the “post-structural lifestyle approach” on the “disconnection between lifestyles and social structure”.
Linked to the “psychographic lifestyle approach” is Mitchel’s [10] lifestyle theory, values and lifestyles (VALS) based on behavior, resources, and motivations [11] (pp. 27–28), [39]. van Acker et al. [11] (p. 28) describe the use of personal values in urban research in the following terms: “Data on personality traits are generally not systematically collected so that each study collects its specific data set and analyses remain exploratory without any generalization. One important classification is nevertheless the Values and Lifestyles (VALS) typology developed […] by the sociologist Arnold Mitchell (1983)”. The VALS theory comprises eight archetypical lifestyles, structured according to available economic resources and the three motivations (cf. Higgs [21] (p. 21) notion on “personal preferences”: ideals (based on knowledge and principles); achievement; and self-expression [10] (p. 5), [51]. Van Acker et al. [11] (pp. 27–28) link the VALS theory to the “psychographic lifestyle approach”. According to Mitchel [10] (p. 4), the VALS theory “systematize the values and lives [...] to discover why people believe and act as they do”. Pisman [39] (p. 2) emphasizes the importance of using lifestyle theories (including the VALS theory) in defining the typologies of residential environments.
Mitchel [10] (pp. 5–6) developed eight lifestyles in its current version named as Survivors, Believers, Thinkers, Strivers, Achievers, Makers, Experiencers and Innovators (see Figure 1) (see [51]). Survivors are people with a very limited amount of resource, who are thus unable to choose their lifestyle. Believers are in the lower income range and are characiterized by an aspiration to fit in. They buy proven products, do not use encyclopedias, and do not try to increase their knowledge. Thinkers are in the upper economic range. They buy items that provide a good trade-off between quality and price. They gather information before buying and often use encyclopedias. Strivers are in the lower income range and “tend to be streetwise” [10] (p. 5). Achievers are in the upper income range and like to buy products that are exclusive and have a good reputation. Strivers and achievers like to flaunt their achievements. Makers are in the lower income range and like to design and make items themselves. Experiencers also express their personal taste through various kinds of items and behaviors. They are in the upper income range and like to mix exclusive brands with second hand items, or products made and designed by themselves. They are first in and first out in fashion cycles. Thus, Mitchel’s lifestyle typology [10] has the potential to be used in a combined psychographic-geodemographic lifestyle approach (see [11] (pp. 27–28)), in order to analyze the distribution of social capital in residential environments (see also [39]).

3.3. Urban Morphology

Urban morphology has a central role in BE-TB research, in research on social infrastructure, and in the geodemographic lifestyle approach. Thus, theories on urban morphology provide useful knowledge on possible spatial characteristics. One of the most known urban theories on the linkage between lifestyles, demography, and space, is the Chicago school of sociology who developed the concentric [40], the wedge [41], and the multiple nuclei [42] urban models (see [53]). Burges and associates found that the social characteristics of certain areas in the city prevailed, although the citizens were exchanged [40,41].
More recently, Glaeser, Kolko, and Saiz, and Glaeser and Gottlieb, developed a theory on the changing urban morphology and the importance of accessibility [37,38]. Glaeser and Gottlieb linked the urban revival from the 1980s onwards to the emergence of the global economy, where highly educated people (usually with high incomes) are attracted to residential locations with access to high-end urban amenities [38]. People try to balance access to these various urban amenities (“quality of life”), including: (1) “service and consumer goods”; (2) “aesthetics and physical settings”; (3) “public service”; and (4) “speed” in terms of ideas and the available “range of service and jobs” [37] (pp. 28, 30–31).
It is also assumed that this development, supports better conditions for low-income groups. Sassen, on the other hand, warns of social and economic conflicts linked to social and spatial segregation [54]. According to Sassen, the global economy structures the urban social fabric into an urban low-wage proletariat and a cosmopolitan economic elite ([54] (see Gleeson [55] on urban poverty, social inequality, and urban density in the contemporary urbanology; see also [56] (pp. 24–25)).
Thus, lifestyles and demography should have an influence on the residential location patterns and thereby also regarding access to social infrastructure (see [21,22,24]). These findings support the argument of analyzing the spatial dimension of demography and lifestyles (a combined “demographic psychographic lifestyle orientation approach”, see [11] (pp. 27–28); [39] (p. 2)) in research on social infrastructure.

4. Materials and Methods

This research on the distribution of social infrastructure among lifestyle clusters in Stockholm was conducted by combining information from a questionnaire and spatial data from SLU [57]. Through factor and cluster analysis, the distribution of social infrastructure among spatial lifestyle clusters in Stockholm was analyzed. This section presents an overview of employed methods, data processing, and their methodical and theoretical foundations.
If lifestyles have influence on residential locations [36,37,38,39], then the understanding of the distribution of social infrastructure in the population should be influenced, not only by demography [21], or spatial demography clusters [24], or spatial attributes such as the distance to the city center [25], but also on the influence of lifestyles in space. The hypotheses to test here is to what extent access to social infrastructure is associated with spatial lifestyle clusters.

4.1. The Questionnaire

This analysis on social infrastructure in the Stockholm region, 2019, is based on a questionnaire [58] and on spatial data provided by SLU [57] (restricted accessibility). An invitation to the digital questionnaire was sent out by post to 4500 randomly selected respondents (18 years old and older) in the Stockholm region by the statistical consultancy bureau, Enkätfabriken [59]. The questionnaire was completed correctly by 1160 respondents in May 2019. The questionnaire comprised 141 questions concerned issues such as demography (ordinal scales), residential milieus (nominal scales), urban characteristics (nominal scales), attitudes regarding various kinds of behavior (Likert scales), lifestyles (Likert scales), ideologies (Likert scales), and specific travel behavior (nominal and continuous scales) (see [58]). The design of the questionnaire was foremost based on methodological foundations laid by research within the built environment—travel behavior (BE-TB) research field (see [60,61,62,63,64]. Additionally, research focusing on residential self selection [65], research using social-psychology [66,67,68], as well as lifestyle theories [11] (p. 28), [10,69,70]. Additionally, Marx et al. and Marx [46,47] on lifestyles and determinism, Bourdieu on lifestyles and demography [49], and Weber on lifestyles and free will [50], provided valuable inputs.

4.2. Spatial Data Processing

Through SLU spatial data on street networks, populations and employees were provided [57]. By spatial analysis in GIS (MapInfo, IDRISI), urban densities (day and night population per hectare), polycentricity (distance to urban nodes), urban diversity (number of functions in terms of business codes per hectare), and urban design (number of street per hectare) were computed [60,61,62]. More precisely, by using kernel techniques, based on micro zones of 250*250 m, the influence of the surrounding urban milieu on the location of the respondents’ residential site were taken into account (see the ‘modifiable area unit problem’, [71]; the “spatial lag of X model”, [72] (p. 30)), and the “field view” approach [73] (p. 5); see also [24,74]).
Except for the general input from BE-TB research presented above, the work by Kropf [35], Burgess et al. [40], Hoyt [41], and Harris and Ullman [42] (see also [53]), provided valuable inputs to the design of the research regarding urban morphology. Urban morphology in terms of accessibilities, densities, design, and the distance to the city center, are also taken into account in contemporary research on social infrastructure (see [19,21,22,24]). Spatial data regarding accessibilities in terms of the number of jobs that could be reached within 45 min travel time by car or public transport (although not claiming this kind of accessibility to represent all kinds of social infrastructures) in 250 × 250 m micro-zones, was provided by transport and system analysis, KTH [75].
The questionnaire, in combination with data on urban morphology [57], provided useful information to be used in analysis on the relation between, on the one hand, social infrastructure (accessibility to jobs and urban amenities), and on the other hand, demography, urban profiles, urban morphology (see [19,21,22,24]), and lifestyles.

4.3. Factor Analysis

Inspired by the VALS theory ([10]—the “psychographic lifestyle approach” ([11] (pp. 27–28)—11 questions regarding behavior and attitudes were posted in the questionnaire. The topics regarded self-expression, desire for success, and the ambition of making decisions based on knowledge and principles, see Table 1. The answers were selected on a predefined five-step Likert scale from ‘does not fit at all’ to ‘does fit very good’. By factor analysis (SPSS), a new set of variables were computed representing lifestyle variables in line with the VALS theory [10,51].

4.4. Cluster Analysis

In order to analyze if each respondent could be designated into a distinct lifestyle, two cluster analyses (SPSS) were conducted, see [24] (p. 11); [69] (pp. 257–258); [70] (p. 165); [76]. With the precondition of using the four lifestyle variables, a number of variables within urban morphology, demography, and other social characteristics were tested (see also [19,21,22,24]). Choices regarding the number of clusters and the characteristics of the clusters (grade of similarities within and in-between the clusters) are, however, according to Hair et al. [76] (p. 425), not self-evident, but depend on theory and the researcher’s evaluation.

5. Results

In this section, results regarding the social stratification provided by the factor and cluster analyses are presented.

5.1. Four Lifestyle Variables

Through factor analysis (SPSS), four general composite variables based on the 11 specific lifestyle variables (see Table 1) emerged. Each of the four general lifestyle variables then represents a number of correlated specific lifestyle variables. The four general lifestyle variables are here named success-oriented, designers, sensible and middle-class bourgeois (see Appendix A, Table A1). The success-oriented lifestyle variable is characterized by purchasing exclusive products with a good reputation and buying items that are proven and priceworthy; the price of an item is, however, secondary. The designer lifestyle variable indicates a desire for finding items that are unusual and express personality, by designing and making items (including clothing) by oneself, and by an interest in culture and art, not by acquiring knowledge regarding an item’s quality before making a purchase. The sensibility lifestyle variable indicates acquiring knowledge about an item’s quality before making a purchase, buying items that are proven and priceworthy, often using encyclopedias such as Wikipedia, and being somewhat interested in buying exclusive items with a good reputation. The middle-class bourgeoisie lifestyle variable indicates high work ethics, high ethical standards and orderliness in general, concerns about reputation, and some interest in culture and art. Each respondent then gets a combination of these four general lifestyle variables, where usually one is dominating. Thus, these four general lifestyle variables mirror the respondents’ lifestyle characteristics (based on the VALS theory) and might presumably be linked to demography and urban attributes.

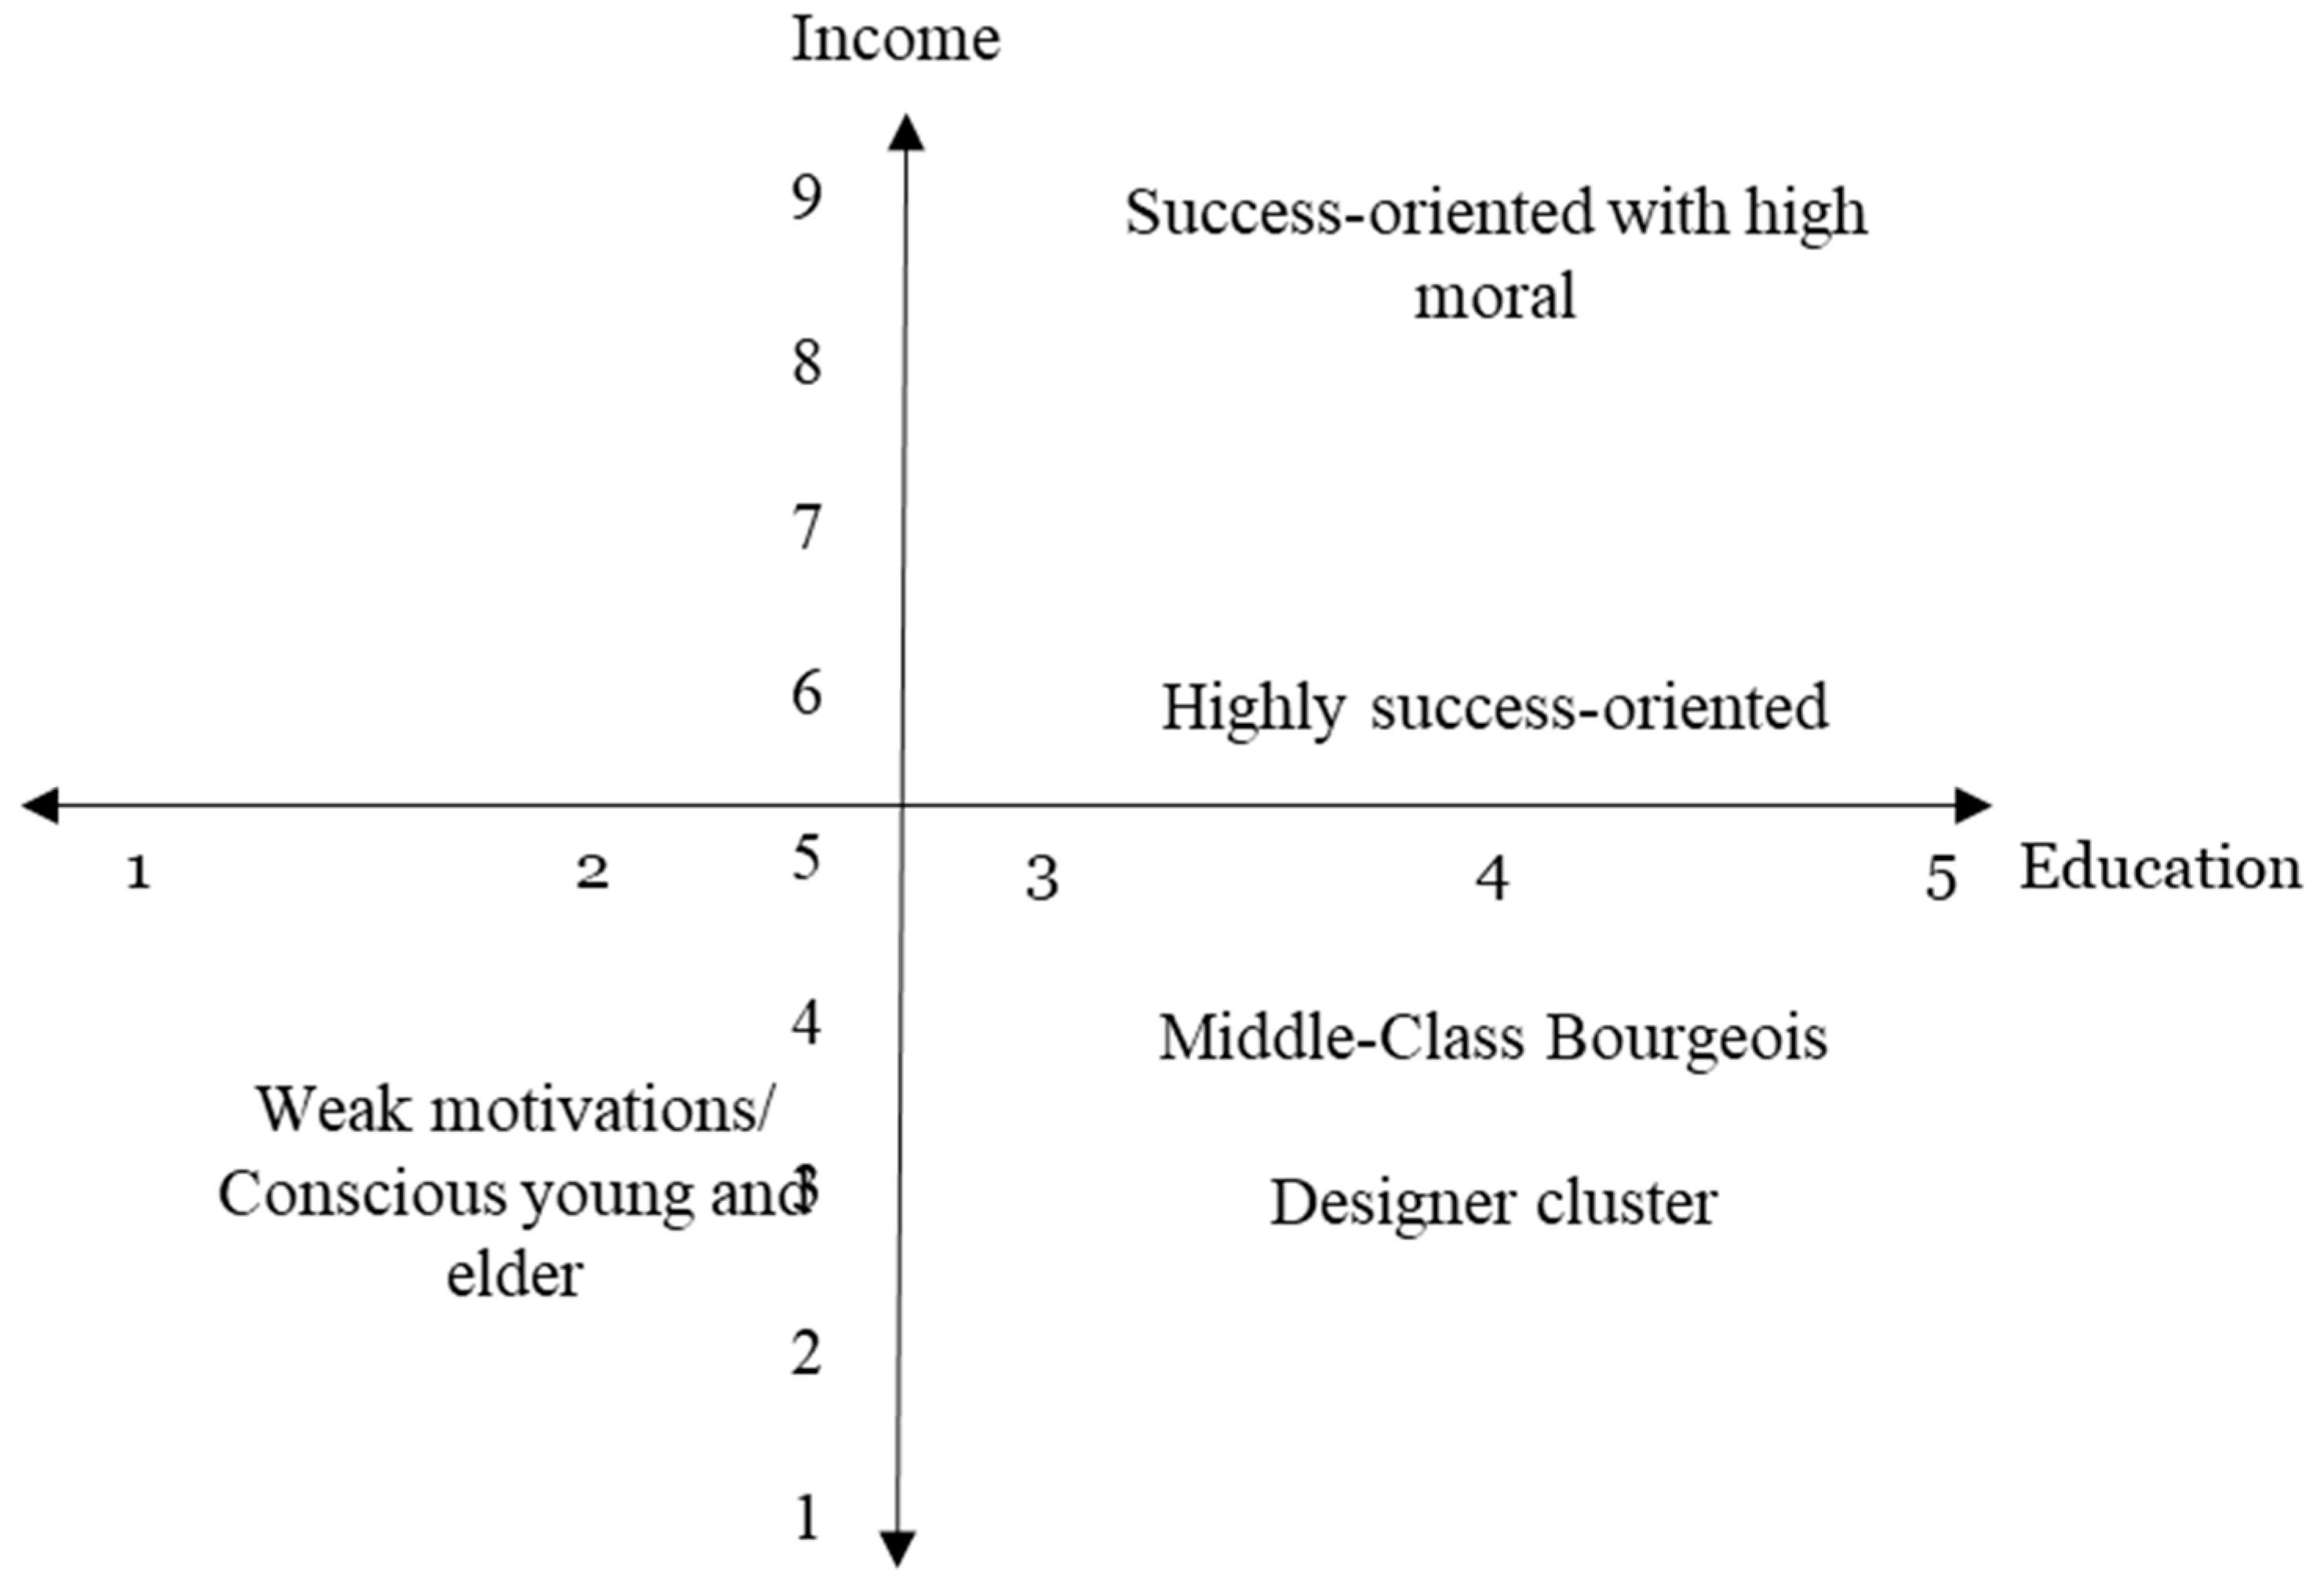
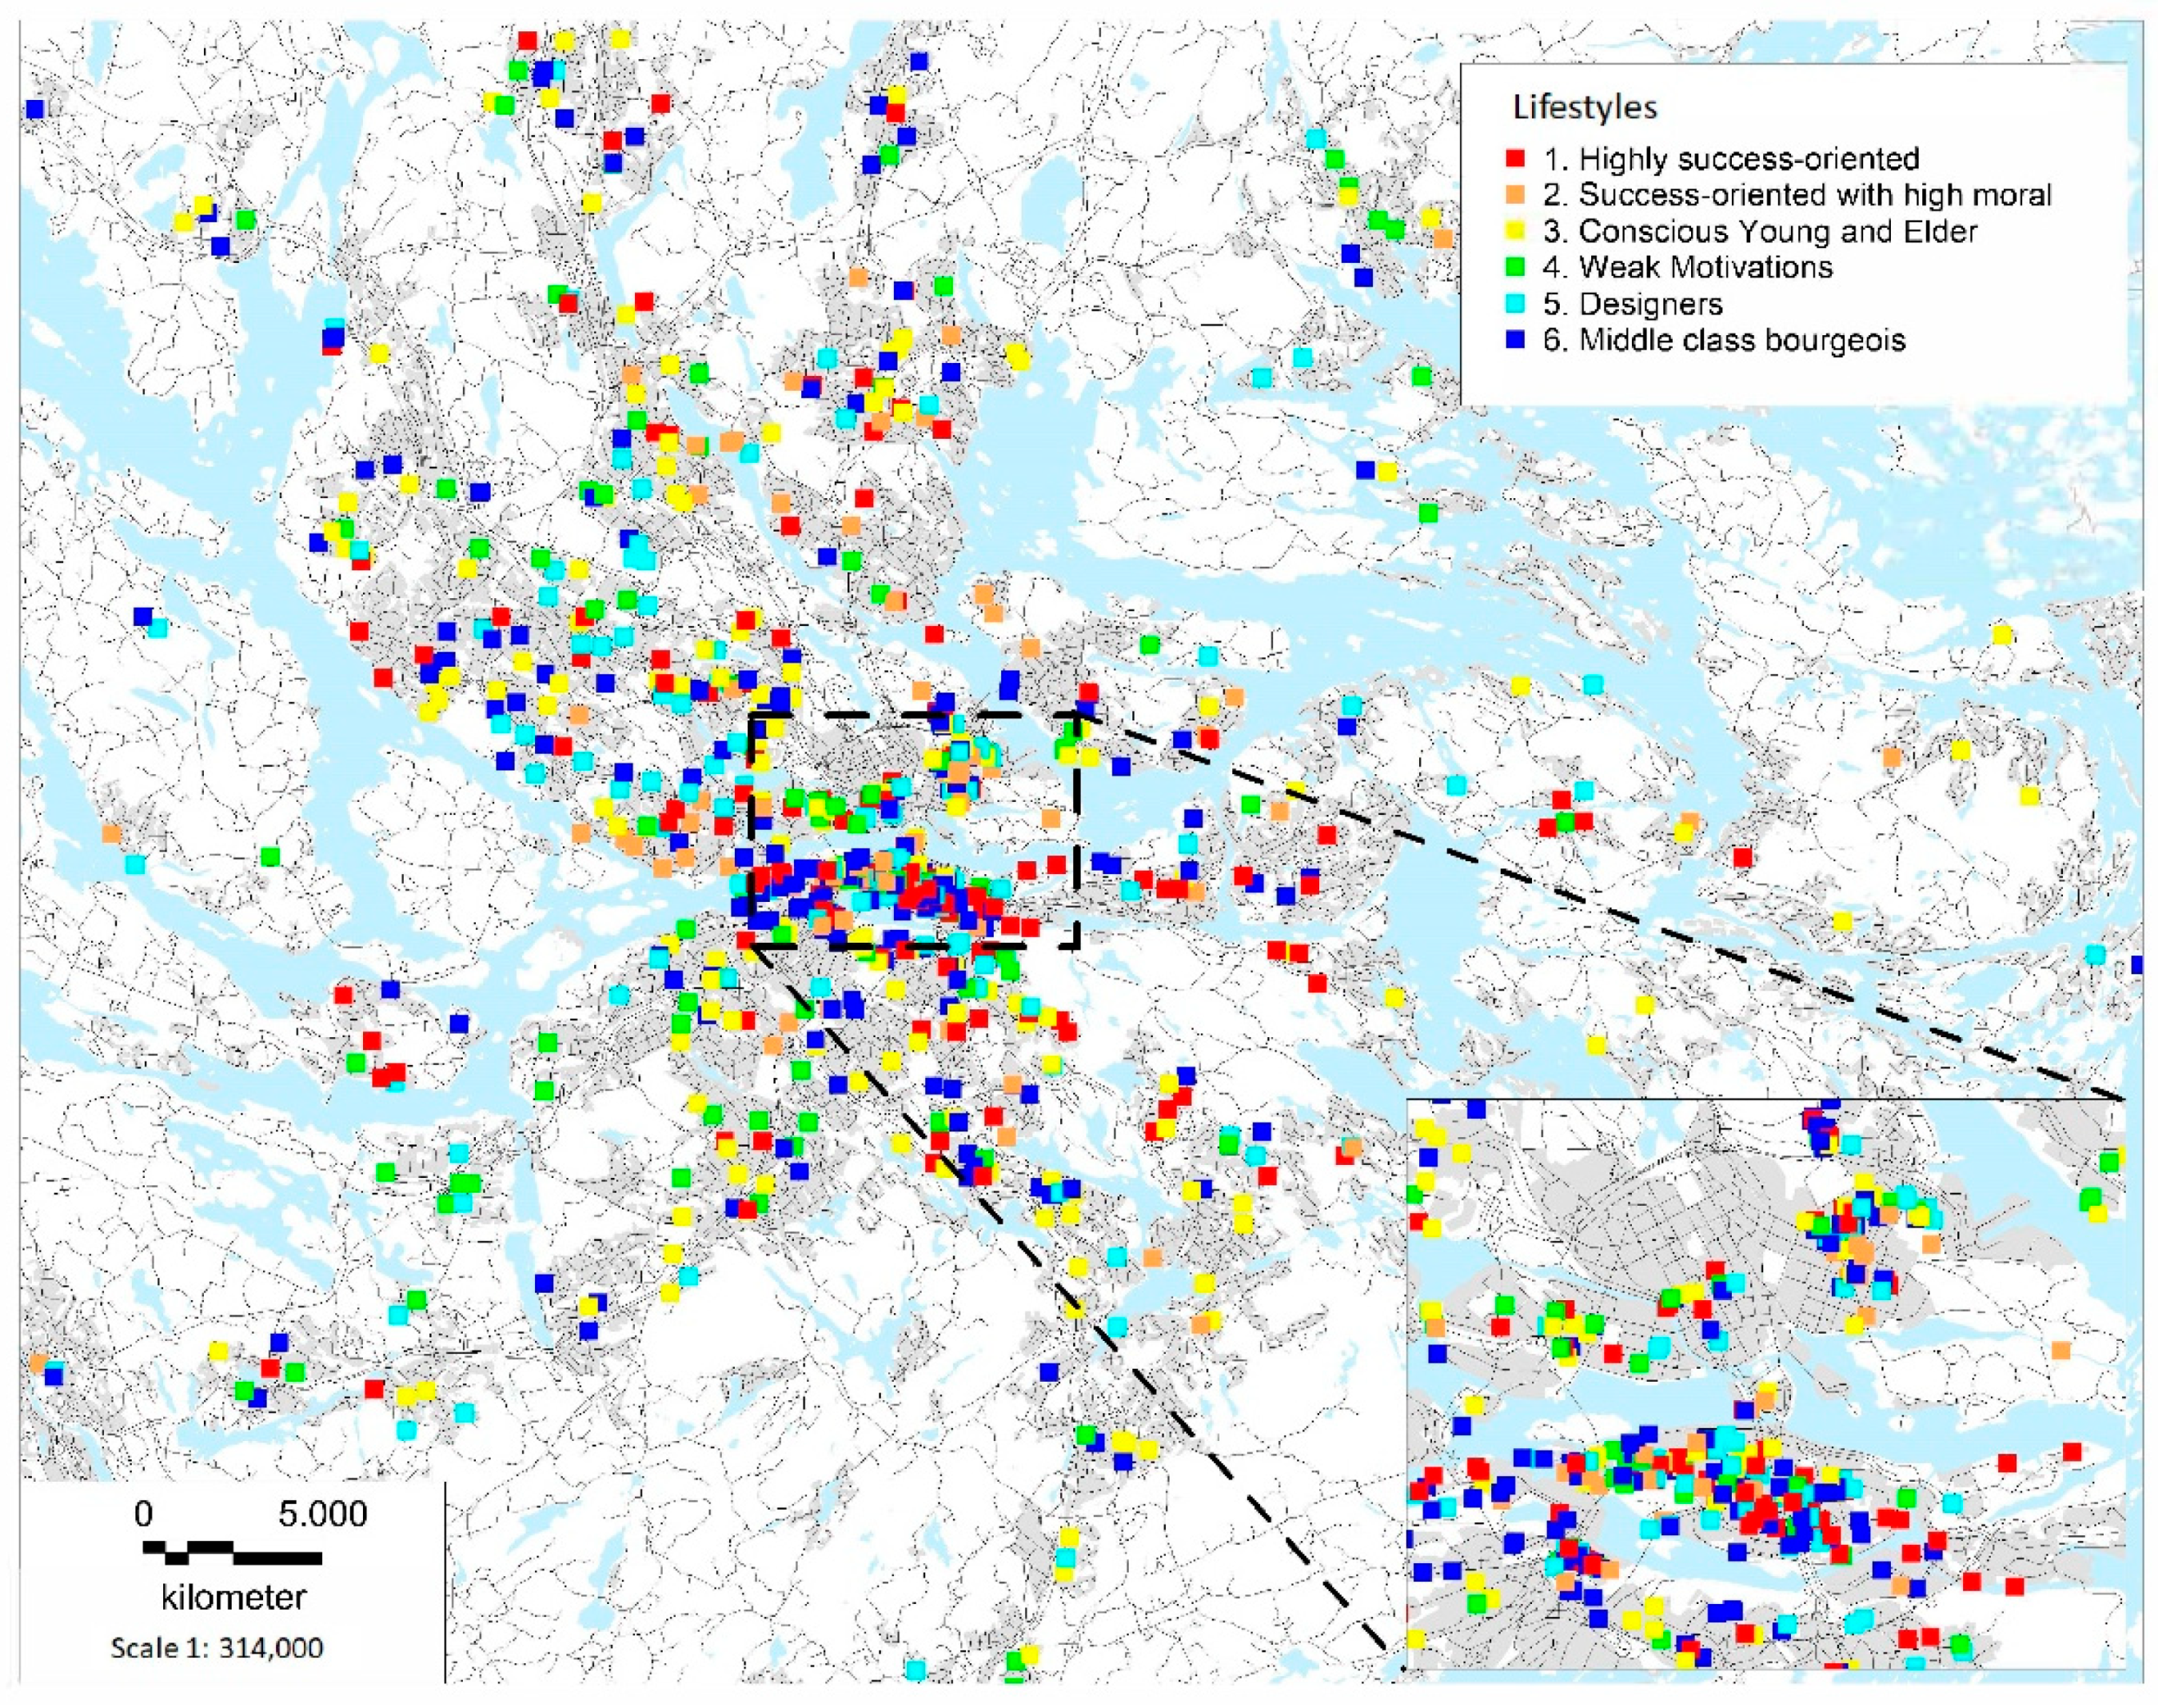
5.2. Six Lifestyle Clusters

From the cluster analysis, six general lifestyle clusters based on the four general lifestyle variables, and income and education, emerged, here named: highly success-oriented, success-oriented with high work ethics, conscious young and elder (this cluster is characterised by young and elder respondents who make well-founded decisions, however they have rather low education and income. The reason might be that they, according to their age, have had limited opportunity to educate themselves). People with weak motivations, designers, and middle-class bourgeois (see Appendix A, Table A2). The clusters are a combination of the four general lifestyle factors, income, and education—a combined “demographic psychographic lifestyle orientation approach” [11] (pp. 27–28). Each cluster comprises 8–25% of the respondents. In comparison with the VALS theory, a thinker lifestyle that is primarily based on knowledge, sensibility, reason, and ideology, could not be detected as a distinct cluster.
It is worth noting the statistical association between lifestyle factors, income, and education (cf. [49]), which, at least in part, rejects the “post-structural lifestyle approach” [11] van Acker et al. 2016, see Table A2. Thus, these lifestyle clusters are formed by the combination of, on the one hand, economic and cultural capital, and on the other hand, motives forming lifestyles. Inspired by [49] Bourdieu’s (1991/2007: 270) diagram, “The space of social positions and space of lifestyles”, the six developed lifestyles are, in Figure 2, related to cultural (education) and economic (income) capital.

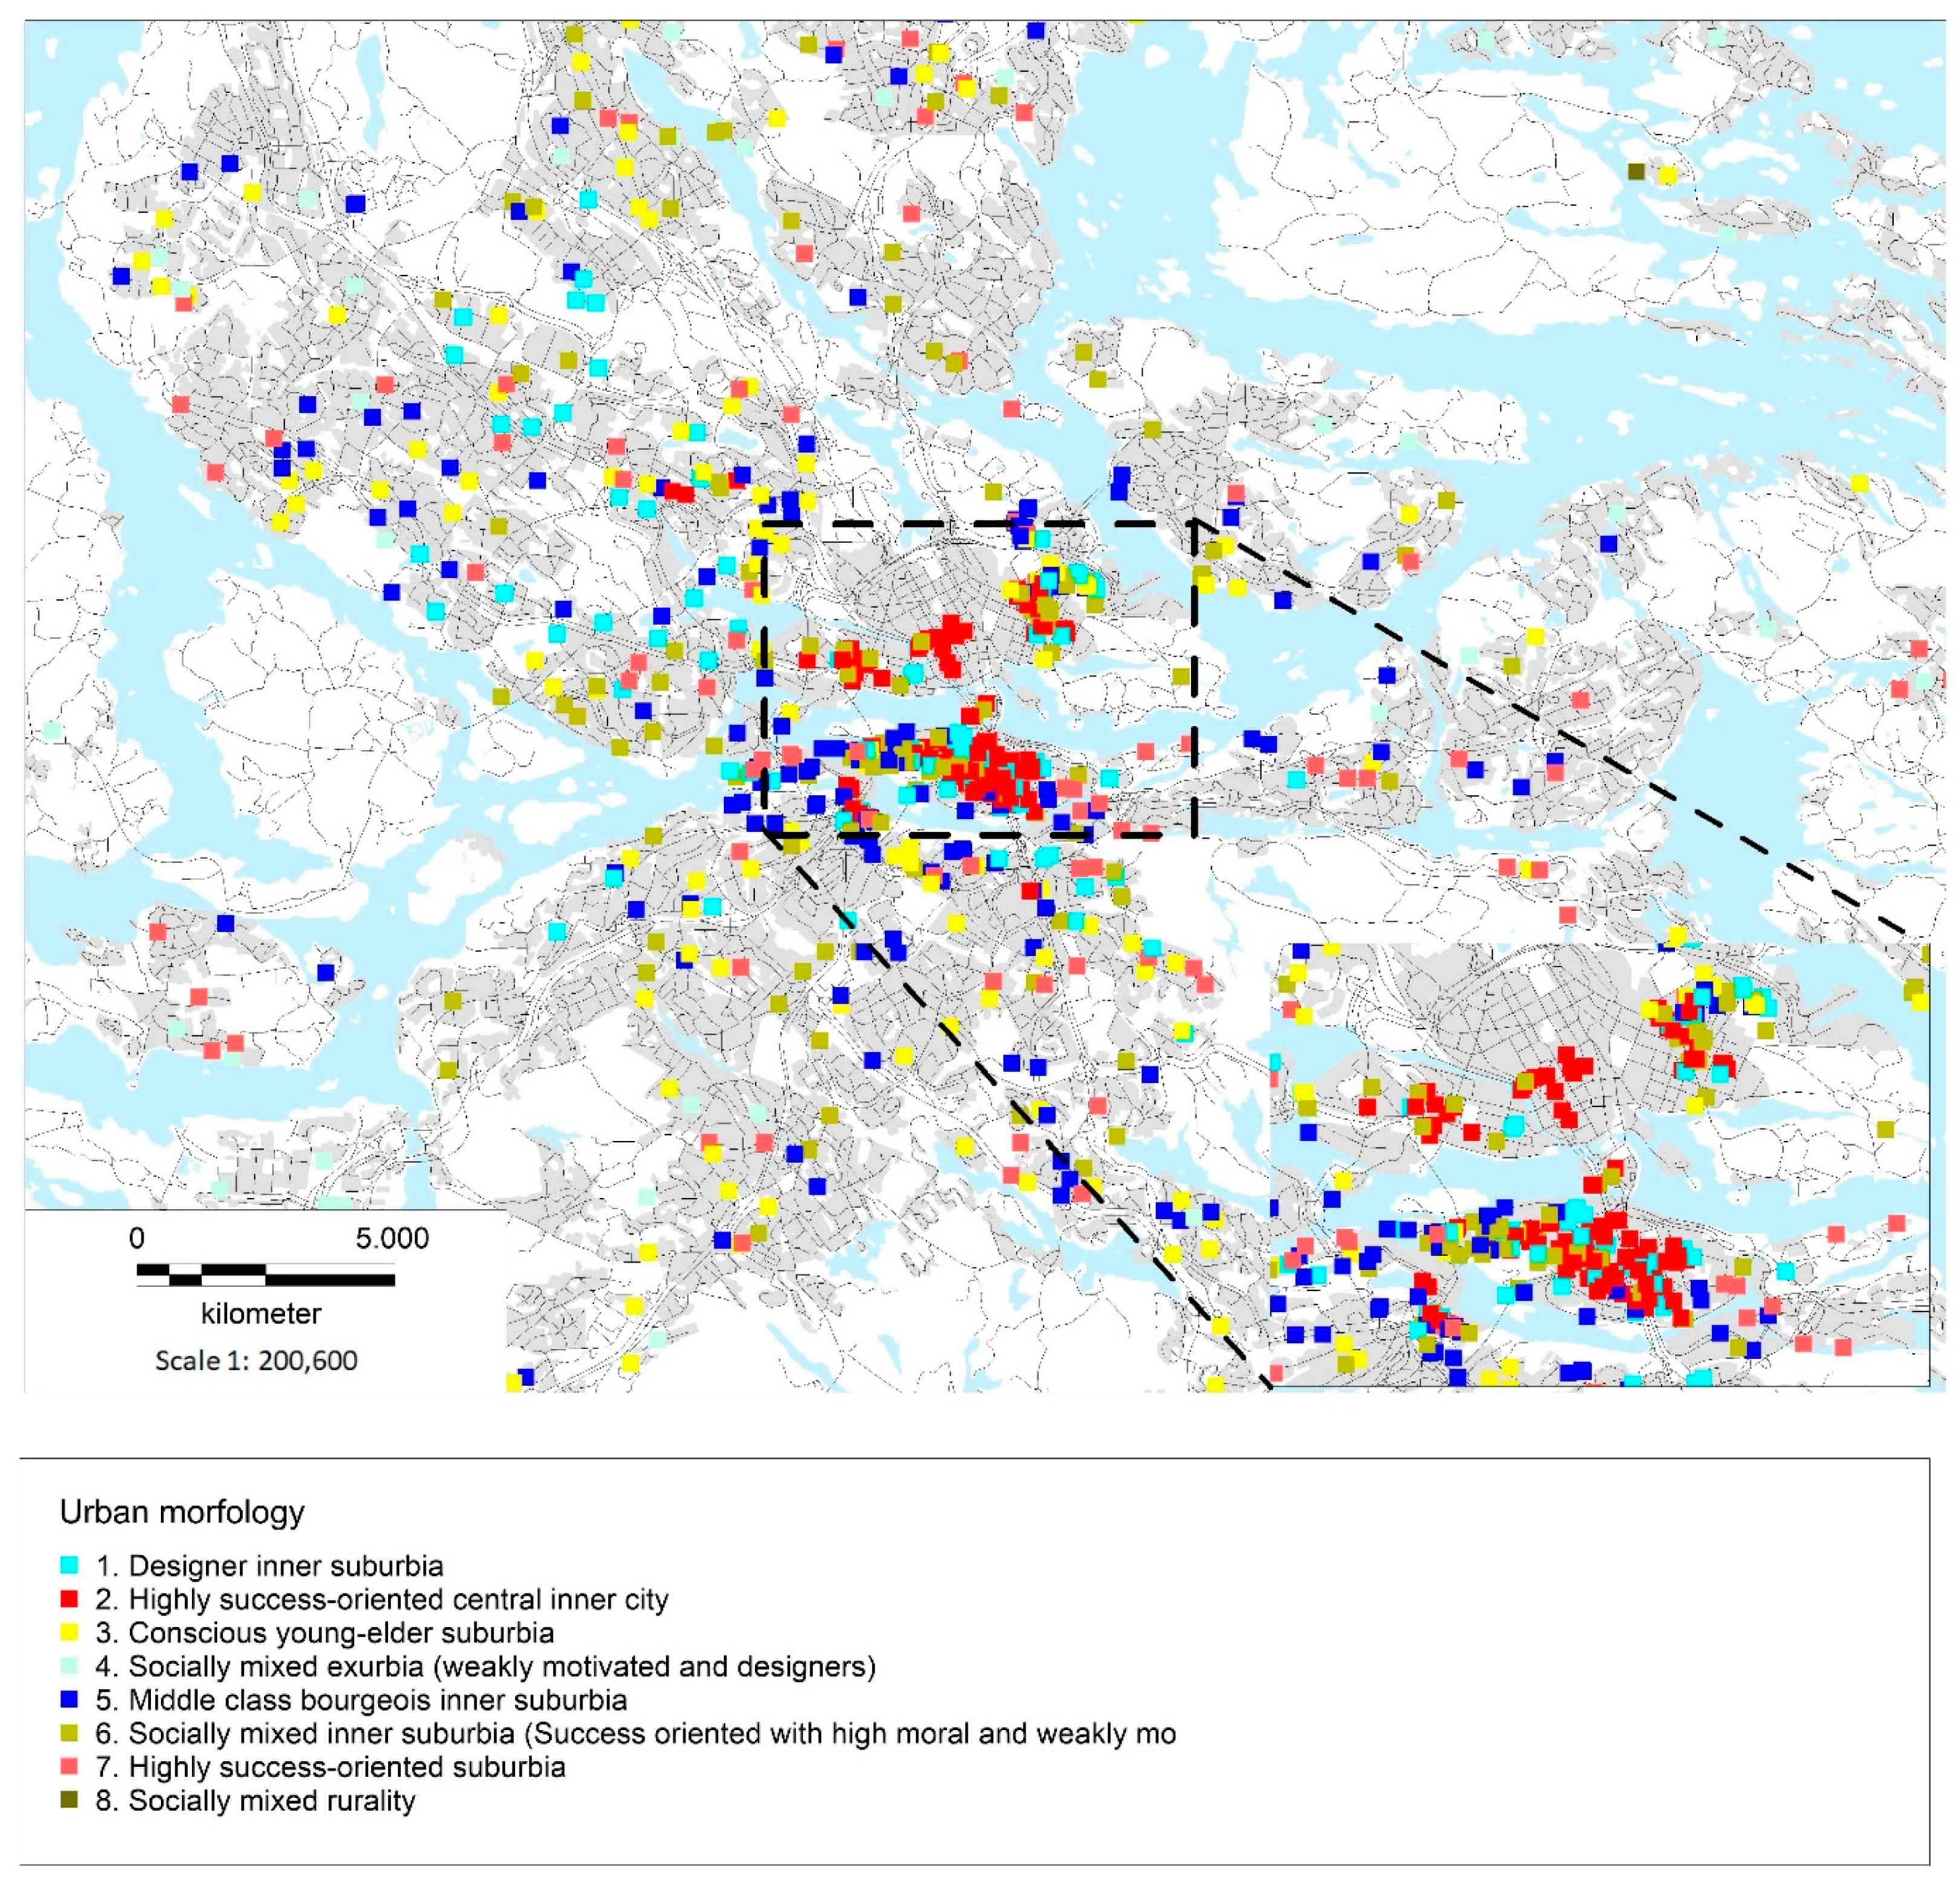
5.3. Eight Spatial Lifestyle Clusters

Previous research has related social infrastructure to demography [19,21], to spatial socio-economic clusters [24], and to urban morphology 25]. Following the traditions within urban sociology [40,54] (and others), and the “geographic lifestyle approach” ([11] (pp. 27–28) [39] (p. 2), the potential links between lifestyle clusters and the urban environment is analyzed. As residential space in the inner city of Stockholm is expensive and income is one influential feature delineating the six lifestyle clusters, it seems logical that low-income lifestyles (weak motives, conscious young and elder, and designers) are located on some distance to the Stockholm inner city (cf. [37,38,40,53,54]). Even though the success-oriented lifestyles decrease in numbers when the distance to Stockholm inner city increases, Figure 3 provides a picture where all lifestyles—surprisingly—are distributed throughout the region.
Still, Figure 3 does not say very much about the urban qualities that might be linked to certain lifestyles. In the second cluster analysis, the six lifestyle clusters were linked to a broad range of urban qualities, such as urban densities, urban diversity, urban design, the distance to Stockholm city, accessibility by public transport and car, and forming urban cluster types.
When applying cluster analysis, eight distinct spatial lifestyle cluster types emerged. The SPSS evaluation of the cluster quality is ‘fairly’. These urban morphological clusters thus depict statistically delineated combinations of urban qualities (although not delineated neighborhoods or districts). One influential aspect of defining these spatial lifestyle cluster types turned out to be the distance to Stockholm center (defined as the employment density peak near Sergels torg). Thus, these urban morphological qualities might be referred to as eight statistically determined concentric zones (see Table A3 in Appendix A, cf. [25]) around Stockholm center, where certain lifestyles are linked to certain urban qualities. These concentric zones are overlapping.
Still, to avoid simplification, these statistically determined overlapping concentric zones are not presented as specified areas. Instead, the spatial lifestyle complexity is presented by using the individuals’ lifestyle cluster belongings, see Figure A1 and Table A3. Table A3 presents the eight spatial lifestyle clusters.
As ‘highly success-oriented respondents’ is the dominating lifestyle in the inner city, this most central (order = 1) spatial lifestyle cluster type is therefore named the ‘highly success-oriented and socially mixed central inner city’ cluster type. This spatial lifestyle cluster type is characterized by an inner-city residential environment. The urban density is very high, with on average 372 people per hectare. The urban diversity is very high as well, with 14.9 functions per hectare. The urban design measure is very high, on average, with two roads per hectare. Accessibilities are also very high—1,100,000 employees (a measure representing opportunities for jobs as well as private and public services) could be reached within 45 min travel time by car in rush hour, and 850,000 employees could be reached within 45 min travel time by public transport in the rush hour.
In the next spatial lifestyle cluster type, the ‘designer inner suburbia cluster’ resides at 64% of the ‘designer’ oriented respondents. Thereafter, the ‘socially mixed inner suburbia cluster type, with an average distance of 6.3 km from Stockholm center, comprises two kinds of lifestyles: 90% of the ‘success oriented with high moral’, and 53% of the population with ‘weak motives’.
Sassen’s findings, where the educated elite with professional linkages to the global economy is proposed to have an exclusive residential location in the inner city could, perhaps, be verified in this analysis [54]. On the one hand, this study on lifestyles in the Stockholm region confirms the linkage between inner city location and a success-oriented lifestyle with high income and high education. On the other hand, the central spatial lifestyle cluster comprises almost all kinds of lifestyles. The cultural interest in Stockholm is not, as proposed by Glaeser et al. [37,38], linked to the success-oriented lifestyle, but foremost to the designer lifestyle concentrated in the ‘designer inner suburbia’. The reason for this spatial stratification, where income is a minor influence on the spatial distribution, might be due to a situation where residential rent is regulated by law. The property companies may not raise the rent above a certain value. The rent is linked to the standard and the size of the rental apartment, not the location (except for a minor share). Besides this system, Sweden operates a type of private ownership apartment system, where the price for the apartment is linked to market mechanisms. Access to rental apartments is usually distributed by a queuing model. Thereby, inner-city residential locations are distributed not solely through economic mechanisms [56] (p. 25). This situation allows for various economic groups (e.g., linked to lifestyles) to reside in the inner city.
Next, three suburban lifestyle clusters types are presented: the ‘middle class bourgeois suburbia’ cluster type—on average a distance of 8.7 km from Stockholm city center; the ‘highly success-oriented suburban’ cluster type—on average a distance of 9.8 km from Stockholm city center; and the ‘conscious young-elder suburban’ cluster—on average a distance of 11.2 km from Stockholm city center. These cluster types distinguish themselves from the three former foremost, due to lower diversity and lower urban densities of 70–80 people per hectare (indicating single family house areas and modernistic multi-family house areas).
At an average distance of 18 km from Stockholm center, the socially mixed exurbia is located. This cluster type is characterized by two kinds of lifestyles: 35% of the designer oriented respondents; and 29% of the respondents with weak motives. Then, finally, at an average distance of 43 km from Stockholm center, the ‘socially mixed rurality’ is located. This cluster is characterized by (3–12%) respondents representing all lifestyles.
It is apparent from Table A4 that there are substantial shares (29–35%) of designers and weakly motivated who experience rather low accessibility, compared to other lifestyle clusters—especially those with no access to a car. The ‘highly success-oriented suburban’ cluster, the ‘conscious young-elder suburban’ cluster, the socially mixed exurbia, and the ‘socially mixed rurality’ experience half (or less) accessibility by public transport, compared to the ‘highly success-oriented and socially mixed central inner city’ (in line with earlier research, see Higgs et al. [21] (p. 20)).
If one put attention to how access to social infrastructure is distributed among various spatial lifestyle clusters types, an uneven distribution of social infrastructure will emerge. As the spatial distribution of citizens characterized by various lifestyles and demographical attributes is associated with a rather complex pattern delineated by, not only the distance to city center, but also by urban densities, urban diversities, and urban design, future planning initiatives cannot focus solely on the distance to the city center, but should also consider these other aspects in order to provide a further equal access to social infrastructure.

6. Discussion and Summary

To answer the research questions posted in the introduction: yes, cluster analysis exposes a social stratification composed by six lifestyle clusters; highly success-oriented; success-oriented with high work ethics; conscious young and elder; people with weak motivations; designers; and middle-class bourgeois (see Appendix A, Table A2). This social stratification also has a spatial distribution in eight overlapping concentric spatial lifestyle clusters around Stockholm city center: ‘highly success-oriented and social mixed central inner city’; ‘designer inner suburbia’; ‘socially mixed inner suburbia’; ‘middle class bourgeois suburbia’; ‘highly success-oriented suburbia’; ‘conscious young-elder suburbia’; ‘socially mixed exurbia’; and ‘Socially mixed rurality’ (see Appendix A, Table A3 and Table A4). Access to jobs and services is not evenly distributed within the eight urban clusters. If one put attention to how access to social infrastructure is distributed among various spatial lifestyle clusters types, an uneven distribution of social infrastructure emerges. As the spatial distribution of citizens characterized by various lifestyles and demographical attributes is associated with a rather complex pattern delineated by, not only the distance to the city center, but also urban densities, urban diversities, and urban design, future planning initiatives cannot focus solely on the distance to the city center, but should also consider these other aspects in order to provide further equal access to social infrastructure.

6.1. A Mixed Urban Environment with Clustered Tendencies

There exist four spatial lifestyle cluster types, which are dominated by one lifestyle type linked to a certain unique combination of urban qualities: the designer inner suburbia; the middle class bourgeois suburbia; the highly success-oriented suburbia; and the conscious young-elder suburbia (see Table A3). The possibility of forming these clusters indicates a segregated environment. However, highly success-oriented respondents reside in two kinds of clusters: in a mixed inner city cluster; and in non-mixed (referring to lifestyles) low-density single-family house areas, with rather high accessibility to a car, and rather low accessibility to public transport.
The remaining four urban cluster types are, surprisingly, mixed, with regards to lifestyle. The tendency is that suburbia is segregated; the central part of the region, and the urban periphery, expose a mixture of lifestyles. The exception are designers who seem to be attracted to (possibly because of economic reasons) specific urban qualities provided in the dense inner suburbia overlapping with Stockholm inner city. Still, high standard deviations indicate a picture where there are considerable overlaps (see Table A3). Even though respondents with a designer lifestyle are attracted to certain urban qualities (cluster centroids) located a distance of 4.8 km from Stockholm center, respondents with a designer lifestyle reside in almost all areas (see Table A4, Figure 3 and Figure A1). These evidences (overlaps and four mixed clusters) indicate a generally diverse urban environment; there exists strong linkages between lifestyles and certain urban qualities, represented in certain neighborhoods, clusters could be formed. But several lifestyles are represented in all urban environments (either as a definition of the cluster types or by cluster overlaps). The combination of existing socially mixed (statistically defined) clusters types and overlaps indicates a complex social stratification although with structural properties.
In contrast with earlier research, the provision of social infrastructure is not solely linked to demographical aspects such as income [19,21], or urban morphological aspects such as the distance to the city center [25], but to lifestyles and a range of urban morphological aspects as well.
The general picture provided here does not support the picture of Stockholm as characterized by spatially segregated lifestyles [56]. Based on cluster analysis, the Stockholm region is mixed in the central part and in the peripheral parts, and, somewhat segregated in the suburban zones (see Table A3). Thereby, the conclusion here is that Stockholm is characterized by a spatial mix of lifestyles—although with some clustering tendencies in concentric zones between the socially mixed inner city and the socially mixed rurality. Still, as these results are based on a randomly selected although limited population, not all urban areas are included. As a result, any conclusion regarding an existing mixture of lifestyles in all neighborhoods could not be carried out. Neither is it here proposed that there is a numerical balance between lifestyles in the concentric lifestyle zones. Additionally, the term ‘segregation’ should be further clarified and debated.

6.2. Unbalanced Provision of Social Infrastructure

Even though (almost) all lifestyles are represented in all kinds of urban environments, the provision of some urban qualities—supporting the development of meeting points and the development of social capital—are unbalanced among lifestyles and expose “socio-spatial inequities” (cf. [19] (p. 194)). For instance, respondents belonging to the socially mixed exurbia (weakly motivated and designers), experience less than 53% of accessibility by public transport, compared with respondents belonging to the highly success-oriented and social mixed central inner city cluster. The consequence is twofold: (1) these individuals experience a lower degree of opportunities for personal development and self-sufficiency; and (2) society cannot utilize these human resources in an efficient way, which impedes urban and cultural development. As accessibility to urban amenities and jobs is part of a general social infrastructure to strengthen social capital, it is of utmost importance to provide equal opportunities in this respect.

6.3. Critical Assessment and Suggestions for Future Studies

In this paragraph, theoretical and empirical potentials for improvements are discussed.
A modified VALS approach (see [10,51]) has been applied in this study. Although useful and instructive, other kinds of lifestyle theories could be tested as well. For example, in defining lifestyle as a distinct ‘style of life’ linked to individuals conscious desires (see [11,50]).
This analysis does not investigate certain areas or neighborhoods. The focus is the urban morphology that characterize the respondents’ local residential environment. Even though this analysis indicates that Stockholm is a spatially mixed environment regarding lifestyles, it is still possible that certain districts, neighborhoods, or blocks, are dominated by one, or a few, lifestyles.
Future studies should test not only the distance to the city center, but also the possible occurrence of, for instance, urban wedges ([41]). The cluster analysis produced eight spatial lifestyle clusters based on lifestyle factors, education, income, and urban morphology. Thereby, this analysis, rejects the “post-structural lifestyle approach” on the “disconnection between lifestyles and social structure” (see [11] (p. 28)). Still further, theoretical development based on empirical studies should (if possible) in the future consolidate lifestyle theory into a further constructive asset for empirical studies.
This study presents eight spatial lifestyle clusters with various access to social infrastructure. They are linked to six spatially overlapping urban qualities—a statistically stated urban mosaic. In this current study, these eight spatial lifestyle clusters are presented in the text as concentric zones, although not within specified spatial boundaries, but around statistically defined distances (centroids) from Stockholm center. This is a kind of tabular—although not visual—presentation with pedagogic advantages which, in a way, does not acknowledge the spatial complexity. Still, future studies on social infrastructure should be considered to develop visualizations techniques in order to present complex urban qualities in a further pedagogic way.
Additionally, a rather general indicator for social infrastructure has been used (access to workplaces and service). In the future, it would be interesting to analyze access to infrastructure among spatial lifestyles clusters divided into transport modes (walking, cycling) and other types of meeting points, for instance, walking accessibility to restaurants, sport facilities (entertaining and activity), and religious meeting points such as churches, mosques, and synagogues, etc. Then, a general social structure could be divided into various kinds of social structures (see [7]).

6.4. Implications for Planning

This study, focusing on social infrastructure (linking physical infrastructure to the development of social capital), indicates the need for a further holistic approach (see [12]) that acknowledges this interdependence and a need for integrating infrastructure planning with urban planning (see Section 2, existing literature). As presented in this study, access to jobs, public and private services (consumptions opportunities), and various urban milieus, differ among the urban lifestyle cluster types analyzed here. As access to these kinds of urban amenities is regarded as an equity issue [3] (pp. 39–40), governmental organizations should support an extension of public transport services (still keeping in mind the long term solution in changing the local urban morphology, see Section 2, existing literature). This improves the opportunities for consumption, jobs, and access to various urban and natural areas; additionally, social infrastructure is strengthened, and possibly, social equality in the Stockholm region is promoted.

Funding

This research was funded by Trafikverket, grant number: TRV 2015/105481.

Informed Consent Statement

Informed consent was obtained from all subjects involved in the study.

Data Availability Statement

The data presented in this study are available on request from the corresponding author. The data are not publicly available due to contractual formalities.

Conflicts of Interest

The authors declare no conflict of interest.

Appendix A

Table A1. The four general lifestyle factors and their correlations with the 11 general life style variables (structure matrix). The lifestyles are inspired and developed from the Mitchel VALS theory [10] (adapted from [58]).
Success OrientedDesignersSensibleMiddle Class Bourgeoisie
How well does following statement agree with how you view your own consumption?
Above all, I try to find the cheaper alternatives.−0.767−0.0640.2390.077
The price is a secondary factor when I decide about buying an item.0.7250.110−0.0200.022
I like to buy slightly more expensive and exclusive branded products (e.g., clothes) with a good reputation.0.6680.0940.4070.172
I like to read about e.g., the quality of a more expensive item before I buy the item0.1360.2580.760−0.031
I try to buy goods that are proven and above all affordable−0.286−0.0370.6710.190
I often try to find some unusual alternatives (e.g., clothes) on the market that suit my personality.0.2030.7600.1880.010
How well does following statement fit you?
I like to make things (incl. clothes) myself.−0.1130.6960.151−0.128
I am interested in culture (e.g.,. art, literature, film and theatre)0.1720.6360.1690.209
I often and happily use Wikipedia (and other encyclopaedias)0.0500.2390.4870.197
Work ethics, ethics, orderliness is important.0.0170.0000.0870.832
My reputation and prestige is important.0.0330.0360.1930.812
Table A2. Final cluster centers. Mean values of factor scores (min −3.8, max 2.6, mean 0) and mean variable values in each cluster, adapted from [57].
Highly Success-OrientedSuccess-Oriented with High MoralConscious Young-ElderWeak MotivationsDesignersMiddle Class Bourgeois
Achievers0.700.50−0.17−0.750.05−0.16
Designers−0.03−0.090.13−1.010.680.015
Sensible0.090.090.26−1.030.190.08
Middle Class B−0.040.110.32−0.89−0.290.33
Education level442244
Income level693334
Table A3. Urban characteristics of urban cluster types.
Centroids
ClusterDistMainC_km *Access_
CarTr45min **
Access_
PubTr45m ***
Diversity_
Funk ****
Density_
BefEmp_Ha *****
Design_
AntalVag_ha ******
OrderIDUrban Cluster Types
(Concentric Zones)
MeanStd. DeviationMeanStd. DeviationMeanStd. DeviationMeanStd. DeviationMeanStd. DeviationMeanStd. Deviation
12Highly success-oriented and social mixed central inner city2.21.011.30.18.50.514.90.9375.2146.22.00.5
21Designer inner suburbia4.83.111.20.37.41.112.52.6173.3133.91.40.5
36Socially mixed inner suburbia (Success oriented with high moral and Weakly motivated)6.34.610.90.76.52.211.33.3128.2112.91.40.5
45Middle class bourgeois suburbia8.76.110.70.95.32.810.33.078.662.31.20.4
57Highly success-oriented suburbia9.85.710.41.04.52.79.12.951.541.21.20.4
63Conscious young-elder suburbia11.26.510.21.24.52.89.53.069.654.21.20.4
74Socially mixed exurbia (weakly motivated and designers)18.46.18.91.51.41.36.82.629.823.21.00.4
88Socially mixed rurality43.020.32.62.20.10.13.83.014.217.90.80.5
* Distance (km) to Stockholm city center defined as the micro zone (250 × 250 m) with the highest employee density (kernel technique) in the region. ** Number of jobs (in 100,000) that could be reached with car transport within 45 min travel time in rush hour. *** Number of jobs (in 100,000) that could be reached with public transport within 45 min travel time in rush hour. **** Urban Diversity: Number of urban functions including residential activity (kernel technique). ***** Urban density: day and night population per hectare (kernel technique). ****** Urban design: number of roads per hectare.
Table A4. Number of respondents in each combination of lifestyle cluster type and urban cluster type.
Cluster Number of Case
Highly Success-OrientedSuccess-Oriented with High MoralConscious
Young-Elder
Weak MotivationsDesignersMiddle Class Bourgeois
OrderIDUrban Cluster Types
(Concentric Zones)
PercentPercentPercentPercentPercentPercent
12Highly success-oriented and socially mixed central inner city31%0%13%2%1%15%
21Designer inner suburbia0%0%0%0%64%0%
36Socially mixed inner suburbia
(Success oriented with high moral and Weakly motivated)
0%90%0%53%0%0%
45Middle class bourgeois suburbia0%0%0%0%0%73%
57Highly success-oriented suburbia66%0%0%0%0%0%
63Conscious young-elder suburbia0%0%78%0%0%0%
74Socially mixed exurbia
(weakly motivated and designers)
0%0%0%35%29%0%
88Socially mixed rurality (all lifestyles)3%10%8%10%6%12%
Figure A1. The eight statistically defined overlapping concentric spatial lifestyle clusters around Stockholm city center.
Sustainability 14 14261 g0a1

References

  1. Frantzeskaki, N.; Broto, V.C.; Coenen, L.; Loorbach, D. (Eds.) The Dynamics and Opportunities of Sustainability Transitions in Cities. In Urban Sustainability Transitions; Routledge: London, UK, 2017; pp. 1–19. [Google Scholar]
  2. Swedish Environmental Protection Agency. De Svenska Miljömålen; Arkitektkopia AB: Bromma, Sweden, 2018. [Google Scholar]
  3. TRF, Tillväxt-Och Regionplaneförvaltningen. Regional Utvecklingsplan för Stockholmsregionen RUFS 2050; DanagårdsLitho: Stockholm, Sweden, 2018. [Google Scholar]
  4. Serageldin, I. Sustainability as opportunity and the problem of social capital. Brown J. World Aff. 1996, 3, 187–203. [Google Scholar]
  5. Serageldin, I.; Grootaert, C. Defining social capital: An integrating view. In Evaluation & Development the Institutional Dimension; Picciotto, R., Wiesner, E., Eds.; Routledge: New York, NY, USA, 2017; pp. 201–217. [Google Scholar]
  6. Klinenberg, E. Palaces for the People: How Social Infrastructure Can Help Fight Inequality, Polarization, and the Decline of Civic Life; Crown Publishing Group: New York, NY, USA, 2018. [Google Scholar]
  7. Latham, A.; Layton, J. Social infrastructure: Why it matters and how urban geographers might study it. Urban Geogr. 2022, 43, 659–668. [Google Scholar] [CrossRef]
  8. Teriman, S.; Yigitcanlar, T.; Mayere, S. Social infrastructure planning and sustainable community: Example from south east Queensland, Australia. In Proceedings of the Business and Social Science Research Conference, Auckland, New Zealand, 12–13 December 2011; Jahan, N., Ed.; World Business Institute Australia: Chippendale, Australia, 2011; pp. 1–12. [Google Scholar]
  9. Yhee, H.; Kim, S.; Kang, S. GIS-Based Evaluation Method for Accessibility of Social Infrastructure Facilities. Appl. Sci 2021, 11, 5581. [Google Scholar] [CrossRef]
  10. Mitchell, A. The Nine American Lifestyles: Who We Are and Where We’re Going; Warner Books: New York, NY, USA, 1984. [Google Scholar]
  11. Van Acker, V.; Goodwin, P.; Witlox, F. Key research themes on travel behavior, lifestyle, and sustainable urban mobility. Int. J. Sustain. Transp. 2016, 10, 25–32. [Google Scholar] [CrossRef]
  12. Neuman, M.; Smith, S. City Planning and Infrastructure: Once and Future Partners. J. Plan. Hist. 2019, 9, 21–42. [Google Scholar] [CrossRef]
  13. Vitiello, D. Planning for infrastructure: Lifelines, mobility, and urban development. In The Routledge Handbook of Planning History; Hein, C., Ed.; Routledge: New York, NY, USA, 2017; pp. 325–337. [Google Scholar]
  14. Atkinson, R.; Jacobs, K. Housing, Inequality and Sociology: A Comment on Pragmatic Socioeconomics. Hous. Theory Soc. 2022, 39, 147–150. [Google Scholar] [CrossRef]
  15. Fabris, L.M.F.; Camerin, F.; Semprebon, G.; Balzarotti, R.M. New Healthy Settlements Responding to Pandemic Outbreaks: Approaches from (and for) the Global City. Plan J. 2020, 5, 385–406. [Google Scholar] [CrossRef]
  16. Manika, S. Transforming Vacant Commercial Spaces: From Localized Hotspots of Urban Shrinkage to “Smart” Co-Working Places. Open J. Soc. Sci. 2020, 8, 86–97. [Google Scholar] [CrossRef]
  17. Cardoso, R.; Sobhani, A.; Meijers, E. The cities we need: Towards an urbanism guided by human needs satisfaction. Urban Stud. 2022, 59, 2638–2659. [Google Scholar] [CrossRef]
  18. Gastaldi, F.; Camerin, F. Brownfield infrastructures. In The Elgar Companion to Urban Infrastructure Governance; Finger, M., Yanar, N., Eds.; Edward Elgar Publishing Limited: Northampton, MA, USA, 2022; pp. 165–180. [Google Scholar]
  19. Davern, M.; Gunn, L.; Whitzman, C.; Higgs, C.; Giles-Corti, B.; Simons, K.; Villanueva, K.; Mavoa, S.; Roberts, R.; Badland, H. Using spatial measures to test a conceptual model of social infrastructure that supports health and wellbeing. Cities Health 2017, 1, 194–209. [Google Scholar] [CrossRef] [Green Version]
  20. Latham, A.; Layton, J. Social infrastructure and the public life of cities: Studying urban sociality and public spaces. Geogr. Compass 2019, 13, e12444. [Google Scholar] [CrossRef]
  21. Higgs, C.; Badland, H.; Simons, K.; Knibbs, L.D.; Giles-Cort, B. The Urban Liveability Index: Developing a policy-relevant urban liveability composite measure and evaluating associations with transport mode choice. Int. J. Health Geogr. 2019, 18, 14. [Google Scholar] [CrossRef] [Green Version]
  22. UN, United Nations. Sustainable Development Goals. Available online: https://www.un.org/sustainabledevelopment/sdg-moment/ (accessed on 1 January 2020).
  23. OECD. Handbook on Constructing Composite Indicators: Methodology and User Guide. 2008. Available online: http://www.oecd.org/sdd/42495745.pdf (accessed on 22 August 2022).
  24. Nicoletti, L.; Sirenko, M.; Verma, T. Disadvantaged Communities Have Lower Access to Urban Infrastructure. EPB Urban Anal. City Sci. 2022, 0, 1–19. [Google Scholar] [CrossRef]
  25. Sun, X.; Wang, W.; Sun, T.; Wang, Y.P. Understanding the Living Conditions of Chinese Urban Neighborhoods through Social Infrastructure Configurations: The Case Study of Tianjin. Sustainability 2018, 10, 3243. [Google Scholar] [CrossRef] [Green Version]
  26. Williams, P.; Pocock, B. Building ‘community’ for different stages of life: Physical and social infrastructure in master planned communities. Community Work. Fam. 2010, 13, 71–87. [Google Scholar] [CrossRef]
  27. O’Donnell, D.; Gubbins, C.; McGuire, D.; Mølbjerg Jørgensen, K.; Henriksen, L.B.; Garavan, T.N. Social capital and HRD: Provocative insights from critical management studies. Adv. Dev. Hum. Resour. 2007, 9, 413–435. [Google Scholar] [CrossRef]
  28. Glanville, J.; Paxton, P. How do we learn to trust? A confirmatory tetrad analysis of the Sources of generalized trust. Soc. Psychol. Q. 2007, 70, 230–242. [Google Scholar] [CrossRef]
  29. Adolphson, M. Främling i konsumtionsstaden. In Det Förflutna i Framtidens Stad; Olsson, K., Nilsson, D., Haas, T., Eds.; Nordic Academic Press: Lund, Sweden, 2014; pp. 19–36. [Google Scholar]
  30. Habermas, J. The Theory of Communicative Action. Vol. 2, Lifeworld and System: A Critique of the Functionalist Reason; Beacon Press: Boston, MA, USA, 1987. [Google Scholar]
  31. Habermas, J. Civil society and political public spheres. In Contemporary Sociological Theory; Calhoun, C., Gerties, J., Moody, J., Pfaff, S., Virk, I., Eds.; Blackwell Publishing: Malden, MA, USA, 2007; pp. 388–407. [Google Scholar]
  32. Alvesson, M. Knowledge Work and Knowledge Intensive Firms; Oxford University Press: Oxford, UK, 2004. [Google Scholar]
  33. Hildago, M.C.; Hernandez, C. Place attachments: Conceptual and empirical questions. J. Environ. Psychol. 2001, 21, 273–281. [Google Scholar]
  34. McCann, P. Urban and Regional Economics; Oxford University Press: Oxford, UK, 2013. [Google Scholar]
  35. Kropf, K. The Handbook of Urban Morphology; Wiley: West Sussex, UK, 2017. [Google Scholar]
  36. Florida, R. Cities and the Creative Class; Routledge: New York, NY, USA, 2005. [Google Scholar]
  37. Glaeser, E.L.; Kolko, J.; Saiz, A. Consumer city. J. Econ. Geogr. 2001, 1, 27–50. [Google Scholar] [CrossRef]
  38. Glaeser, E.L.; Gottlieb, J.D. Urban resurgence and the consumer city. Urban Stud. 2006, 43, 1275–1299. [Google Scholar] [CrossRef]
  39. Pisman, A. Lifestyles as Centrifugal and Centripetal Forces in the Polycentric Network City of Flanders. Available online: https://biblio.ugent.be/publication/379900/file/460473.pdf (accessed on 1 February 2022).
  40. Burgess, E.W.; Park, R.E. The City; University of Chicago Press: Chicago, IL, USA, 1925. [Google Scholar]
  41. Hoyt, H. The Structure and Growth of Residential Neighborhoods in American Cities; U.S. Government Publishing Office: Washington, DC, USA, 1939. [Google Scholar]
  42. Harris, C.; Ullman, E. The nature of cities. Ann. Am. Acad. Political Soc. Sci. 1945, 242, 7–17. [Google Scholar] [CrossRef]
  43. Pisman, A. De Verkenning Van Het Leefstijlconcept in Een Subjectgerichte Ruimtelijke Planningsstrategie [Exploration of the Lifestyle Concept in a Subject-Oriented Spatial Planning Strategy]. Ph.D. Thesis, Ghent University, Ghent, Belgium, 2012. [Google Scholar]
  44. Munters, Q.J. Bestaan leefstijlen (nog) wel? [Do lifestyles (still) exist?]. Sociol. Gids 1992, 39, 179–185. [Google Scholar]
  45. Kitamura, R. Life-style and travel demand. Transportation 2009, 36, 679–710. [Google Scholar] [CrossRef]
  46. Marx, K.; Engels, F. Manifesto of the communist party. In Classical Sociological Theory; Calhoun, C., Gerties, J., Moody, J., Pfaff, S., Virk, I., Eds.; Blackwell Publishing: Malden, MA, USA, 2007; pp. 96–111. [Google Scholar]
  47. Marx, K. Capital a Critique of Political Economy. Vol. I, Book One, the Process of Production of Capital; Electric Book: London, UK, 1867. [Google Scholar]
  48. Simmel, G. Group expansion and development of individuality. In Classical Sociological Theory; Calhoun, C., Gerties, J., Moody, J., Pfaff, S., Virk, I., Eds.; Blackwell Publishing: Malden, MA, USA, 2007; pp. 300–314. [Google Scholar]
  49. Bourdieu, P. Social space and symbolic space. In Contemporary Sociological Theory; Calhoun, C., Gerties, J., Moody, J., Pfaff, S., Virk, I., Eds.; Blackwell Publishing: Malden, MA, USA, 2007; pp. 267–276. [Google Scholar]
  50. Weber, M. The distribution of power within the political community: Class, status, party. In Classical Sociological Theory; Calhoun, C., Gerties, J., Moody, J., Pfaff, S., Virk, I., Eds.; Blackwell Publishing: Malden, MA, USA, 2007; pp. 247–255. [Google Scholar]
  51. SBI, Strategic Business Insights. 2020. US Framework and VALS™ Types. Available online: http://www.strategicbusinessinsights.com/vals/ustypes.shtml (accessed on 1 January 2020).
  52. Guns, B. Copyright by Strategic Business Insights, 2020. US Framework and VALS™ Types. Used with Permission. 2022. Available online: http://www.strategicbusinessinsights.com/vals/ustypes.shtml (accessed on 1 May 2020).
  53. Antoniou, C.; Shach-Pinsly, D.; Sprumont, F. A typology of urban analysis models. In Digital Social Networks and Travel Behaviour in Urban Environments; Plaut, P.O., Shach-Pinsly, D., Eds.; Routledge: New York, NY, USA, 2019; pp. 135–155. [Google Scholar]
  54. Sassen, S. The State and the Global City: Notes towards a Conception of Place-Centered’ Governance. Compet. Chang. 1995, 1, 31–50. [Google Scholar] [CrossRef]
  55. Gleeson, B. Critical Commentary. The Urban Age: Paradox and Prospect. Urban Stud. 2012, 49, 931–943. [Google Scholar] [CrossRef]
  56. RTK, Regionplane-Och Trafikkontoret. Livsstilar Och Konsumtionsmönster i Stockholmsregionen: Ett Regionalt Utvecklingsperspektiv; Stockholms Läns Landsting: Stockholm, Sweden, 2008. [Google Scholar]
  57. SLU. Access to Zeus.Slu.Se. Available online: https://maps.slu.se. (accessed on 1 May 2020).
  58. Adolphson, M. Urbanmorfologi, Livsstilar Och Resebeteende; KTH: Stockholm, Sweden, 2021; ISBN 978-91-7873-993-6. [Google Scholar]
  59. Enkätfabriken. Sankt Eriksgatan 19, 112 39 Stockholm. 2019. Available online: https://www.enkatfabriken.se/ (accessed on 1 June 2022).
  60. Ewing, R.; Cervero, R. Travel and the built environment. Transp. Res. Rec. 2001, 1780, 87–114. [Google Scholar] [CrossRef] [Green Version]
  61. Ewing, R.; Cervero, R. Travel and the built environment. A meta analysis. J. Am. Plan. Assoc. 2010, 76, 265–294. [Google Scholar] [CrossRef]
  62. Ewing, R.; Cervero, R. “Does Compact Development Make People Drive Less?” The Answer Is Yes. J. Am. Plan. Assoc. 2017, 83, 19–25. [Google Scholar] [CrossRef]
  63. Handy, S. Thoughts on the meaning of Mark Steven’s meta-analysis. J. Am. Plan. Assoc. 2017, 83, 26–28. [Google Scholar] [CrossRef]
  64. Stevens, M. Does compact development make people drive less? J. Am. Plan. Assoc. 2017, 83, 7–18. [Google Scholar] [CrossRef]
  65. Mokhtarian, P.L.; Cao, X.J. Examining the Impacts of Residential Self-Selection on travel behaviour: A Focus on methodologies. Transp. Res. Part B Methodol. 2008, 42, 204–228. [Google Scholar] [CrossRef] [Green Version]
  66. Bamberg, S.; Schmidt, P. Incentives, morality, or habit? Predicting students’ car use for university routes with the models of Ajzen, Schwartz, and Triandis. Environ. Behav. 2003, 35, 264–285. [Google Scholar] [CrossRef]
  67. Bamberg, S.; Rollin, P.; Schulte, M. Local mobility culture as injunctive normative beliefs—A theoretical approach and a related measurement instrument. J. Environ. Psychol. 2020, 71, 1–15. [Google Scholar] [CrossRef]
  68. Triandis, H.C. Values, attitudes, and interpersonal behavior. In Nebraska Sympostium on Motivation; Howe, H.E., Ed.; University of Nebraska Press: London, UK, 1980; pp. 195–259. [Google Scholar]
  69. Klinger, T.; Lanzendorf, M. Moving between mobility cultures: What effects the travel behavior of new residents? Transportation 2016, 43, 243–271. [Google Scholar] [CrossRef]
  70. Lanzendorf, M. Mobility styles and travel behavior: Application of a lifestyle approach to leisure travel. Transp. Res. Rec. 2002, 1807, 163–173. [Google Scholar] [CrossRef]
  71. Openshaw, S. The Modifiable Areal Unit Problem (Concepts and Techniques in Modern Geography); No. 38; Geo Books: Northwich, UK, 1983. [Google Scholar]
  72. LeSage, J.; Pace, R.K. Introduction to Spatial Econometrics; Chapman and Hall/CRC: Boca Raton, FL, USA, 2009. [Google Scholar]
  73. O’Sullivan, D.; Unwin, D. Geographic Information Analysis; J. Wiley Cop: New York, NY, USA, 2003. [Google Scholar]
  74. Adolphson, M. Kernel densities and mixed functionality in a multicentred urban region. Environ. Plan. B Plan. Des. 2010, 37, 550–566. [Google Scholar] [CrossRef]
  75. Transport and System Analysis, KTH (2020). Available online: https://www.kth.se/en/som/avdelningar/sek (accessed on 1 February 2020).
  76. Hair, J.F.; Black, W.C.; Babin, B.J.; Anderson, R.E. Multivariate Data Analysis; Prentice Hall: Englewood Cliffs, NJ, USA, 2014. [Google Scholar]
Figure 1. Lifestyles developed from Mitchel [10] and SBI [51] (adapted with permission from [52]).
Sustainability 14 14261 g001
Figure 2. The position of the six lifestyle clusters in relation to income and education (see [49] Bourdieu 1991/2007: 270; developed from [58] Adolphson 2021).
Sustainability 14 14261 g002
Figure 3. The spatial distribution of respondents and their lifestyle cluster belonging in Stockholm city.
Sustainability 14 14261 g003
Table 1. Questions on lifestyle issues (inspired by VALS, [10,51], adapted from [58]).
How well does following statement fit you?
I like to make things (inclusive clothes) myself.
I am interested in culture (e.g., art, literature, film and theatre)
I often and happily use Wikipedia (and other encyclopedias)
Work ethics, ethics, orderliness are important.
My reputation and prestige are important.
How well does following statement agree with how you view your own consumption?
Above all, I try to find the cheaper alternatives.
The price is a secondary factor when I decide about buying an item.
I like to buy slightly more expensive and exclusive branded products (e.g., clothes) with a good reputation.
I like to read about e.g., the quality of a more expensive item before I buy the item.
I try to buy goods that are proven and above all affordable.
I often try to find some unusual alternatives (e.g., clothes) on the market that suit my personality.
Publisher’s Note: MDPI stays neutral with regard to jurisdictional claims in published maps and institutional affiliations.

