Abstract
Electronic word-of-mouth data on social media influences stock trading and the confidence of stock markets. Thus, sentiment analysis of comments related to stock markets becomes crucial in forecasting stock markets. However, current sentiment analysis is mainly in English. Therefore, this study performs multilingual sentiment analysis by translating non-native English-speaking countries’ texts into English. This study used unstructured data from social media and structured data, including trading data and technical indicators, to forecast stock markets. Deep learning techniques and machine learning models have emerged as powerful ways of coping with forecasting problems, and parameter determination greatly influences forecasting models’ performance. This study used Long Short-Term Memory (LSTM) models employing the genetic algorithm (GA) to select parameters for predicting stock market indices and prices of company stocks by hybrid data in non-native English-speaking regions. Numerical results revealed that the developed LSTMGA model with hybrid multilingual sentiment data generates more accurate forecasting than the other machine learning models with various data types. Thus, the proposed LSTMGA model with hybrid multilingual sentiment analysis is a feasible and promising way of forecasting the stock market.
1. Introduction
Many studies have pointed out that when investigating social issues, data on social media behaviors are more reflective of people’s real thinking than questionnaire data. In addition, the time to collect data from social media is very close to real-time [1]. Numerous studies showed that considering fundamental analysis data, such as financial web news or posts on social media platforms, could effectively improve the performance of the forecasting stock price. Furthermore, roughly one-third to two-thirds of investors used social media in their investment decisions for collecting and learning information about concerned companies. Therefore, social media comments have a certain degree of impact on stock prices [2]. Wu et al. [3] used historical stock data, technical indicators, and non-traditional data, such as stock posts and financial news, to predict the stock price with long short-term memory. The non-traditional data was employed in the convolutional neural network to calculate investors’ sentiment index. The experimental results showed that the proposed method could provide more accurate values than the single data source. Ko and Chang [4] applied the natural language processing tool to recognize the sentiment of the text of news and PTT bulletin board system (BBS) forum discussion. The long short-term memory approach was used to forecast the stock prices. Numerical results illustrated that using news and PPT attributes did improve forecasting accuracy. Ren et al. [5] employed support vector machines with financial market data and sentiment indexes extracted from news to forecast stock market movements. The day-of-week effect was considered in this study. Thus, the exponential time function was used to increase the influence of recent news. Empirical results showed that the proposed method could raise forecasting accuracy after considering the sentiment features. Gupta et al. [6] integrated the Indian Stock Market historical data and sentiment data from Twitter to predict stock prices by long short-term memory. Textblob, a Python library for processing textual data, measured the sentiment data. This study reported that movements in stock prices and news publications had a strong correlation. Jing et al. [7] developed a hybrid model integrating deep learning techniques and sentiment analysis to predict stock prices. The convolutional neural network model was first employed to classify investors’ sentiments. Then, long short-term memory networks were used to conduct forecasts by technical indicators and sentiment features. Numerical results indicated that the presented method could generate more accurate results than the models without data. Wang et al. [8] used the stock comments from Easy Money to develop a sentiment classifier for analyzing stock markets by the long short-term memory model. Numerical results revealed that t the online sentiments of investors had significant impacts on both trading volumes and stock returns. To collect sentiment features, Shi et al. [9] designed a sentiment analysis system with three classification models, including convolutional neural networks, recurrent neural networks, and logistic regression. Then, support vector machines were used to forecast the movements of stock markets. The empirical results indicated that the hybrid data of stock trading and sentiment information could generate satisfactory forecasting results.
In addition, technical indicators play an essential role in analyzing stock markets. Chung and Shin [10] employed five technical indicators, including a simple 10-day moving average, weighted 10-day moving average, relative strength index, stochastic K%, and stochastic D%, and five historical values, including high price, low price, opening price, closing price, and trading volume, as input variables to perform forecasting tasks in stock markets. The forecasting method used is a deep learning approach with the genetic algorithm. Numerical results showed that the designed model could obtain smaller error measurement values than previous studies. Fischer and Krauss [11] utilized long short-term memory network stocks to predict the movement directions of S&P 500 stock markets. This study indicated that the proposed model outperformed the other three memory-free classification methods. Kamara et al. [12] designed a boosted hybrid model of deep learning and technical analysis for forecasting stock prices. Two networks were employed to do the feature extraction task: the attention-based convolutional neural network and the contextual bidirectional long short-term memory. A multilayer perceptron neural network then used extracted features to forecast stock prices. This study claimed that the proposed hybrid model was superior to the other seven approaches regarding forecasting accuracy. Lu et al. [13] developed a deep-learning forecasting method with eight features to predict one-day-ahead closing prices. The convolutional neural network was employed to extract features of the previous 10 days. Then, the collected feature data and stock trading data were used to train the long short-term memory model. This study revealed that the designed deep learning model was superior to the other five neural network models in forecasting accuracy. Jin et al. [14] proposed a revised long short-term memory model with an attention mechanism that enables the model to focus on the more critical information to predict closing prices. The input variables considered trading data and sentiment tendency. This study concluded that the emotional tendency of investors is a critical factor in improving forecasting performance.
Moreover, the selection of multilingual sentiment analysis tools is crucial for evaluating non-native English-speaking investors’ attitudes. Some transformer-based methods for multilingual tasks have been commonly used, such as XLM (cross-lingual language models) [15], XLM-R (XLM-RoBERTa) [16], mBART (multilingual BART) [17]. Palomino and Ochoa-Luna [18] proposed a transformer-based method for multilingual sentiment analysis. BERT and ULMFiT were combined to forecast the polarity of multilingual tweets. Pei et al. [19] developed an Uyghur sentiment analysis tool by integrating the BiLSTM layer in the language-agnostic BERT Sentence Embedding (LaBSE). LaBSE was employed to encode the input data, and then BiLSTM can learn more information from the input context. The empirical results pointed out that the developed model can yield wonderful performance. Araújo et al. [20] investigated the performance of the language-specific sentiment analysis compared to the existing sentiment analysis methods for English content. This study pointed out that translating the text expressed in different languages into English. Then, using existing English sentiment analysis tools can generate better results than employing the language-specific technique directly in evaluating the sentiment of multilingual text.
Deep learning techniques demonstrated promising capabilities in capturing non-linear characteristics and thus can result in accurate predictions for stock market forecasting. Luo et al. [21] presented a long short-term memory model to forecast stock market profits. The adaptive shuffled frog-leaping algorithm was developed to search for appropriate hyper-parameters. This study illustrated the superiority of the proposed model by performing comparisons with artificial neural networks, support vector machines, gray models, and basic long short-term memory. Kanwal et al. [22] designed a hybrid deep learning model, namely BiCuDNNLSTM-1dCNN, integrating a Bidirectional Cuda Deep Neural Network Long Short-Term Memory and a one-dimensional Convolutional Neural Network to conduct stock price predictions. Two datasets were employed to examine forecasting performances, including individual stock items and the stock market’s performance indices. This investigation pointed out that the presented models can generate accurate forecasting results helpful in decision-making in stock market investments. Wang et al. [23] utilized the Transformer model to forecast the stock market indices of the CSI 300, S&P 500, Hang Seng Index, and Nikkei 225. More underlying rules can be described by encoder-decoder architecture and multi-head attention mechanism. This study indicated that the Transformer outperformed other classic techniques and was useful to investors. Gao et al. [24] employed the evidential rule and the genetic algorithm on recurrent neural networks to predict daily movement directions of the S&P 500 index, Dow Jones Industrial Average index, and NASDAQ 100 index. The numerical results indicated that the designed model effectively improved classification performances. Kumar et al. [25] presented a long short-term memory network and adaptive particle swarm optimization (PSO)-based hybrid deep learning model to forecast the stock prices in Sensex, S&P 500, and Nifty 50. PSO was used to provide initial weights of the long short-term memory and the fully connected layer. This investigation revealed that the proposed model could generate accurate forecasting results. Aldhyani and Alzahrani [26] developed a hybrid convolutional neural network with long short-term memory (CNN-LSTM) to predict the closing prices of stock markets. Stock close prices of two corporations, namely Tesla, Inc. and Apple, Inc., were utilized to measure the forecasting performances of the proposed model. This study indicated that the CNN-LSTM model is superior to the basic LSTM model in forecasting accuracy. Ratchagit and Xu [27] presented a two-delay way for three deep learning techniques, including MLP, CNN, and LSTM. Stock data of three companies, namely Microsoft Corporation, Johnson & Johnson, and Pfizer Inc., were used to investigate forecasting performances. Numerical results illustrated that the proposed two-delay model outperformed other linear combination forecasting techniques.
Table 1 lists the recent related literature in 2022 regarding data types, problem types, and stock markets. Most previous studies employed unique structured data or unstructured data individually in analyzing stock markets. Therefore, this study attempted to exploit the unique strength of the structured and unstructured data in enhancing the capabilities of LSTMGA models for predicting corporations’ stock prices and stock market indices in a regression way. Additionally, in this study, multilingual social media posts were translated into English by Google Translation, and then the SentiStrength was used to evaluate the sentiment of the posts in English. Google Translation was used to translate multilingual social media posts. The other four forecasting methods, backpropagation neural networks (BPNN), least square support vector regression (LSSVR), random forest (RF), and extreme gradient boosting (XGBoost), were employed to conduct forecasting tasks with the same data; and the genetic algorithm was used to determine parameters of models. The forecasting performances were measured by the mean absolute percentage error (MAPE), and the root mean square error (RMSE).

Table 1.
The summary of recent literature in 2022 and the proposed LSTMGA model in data types, problem types, and stock markets.
The rest of this study is organized as follows. Section 2 introduces the long short-term memory networks. Section 3 illustrates the architecture of this study for forecasting stock prices with sentiment analysis. Section 4 depicts the experimental results of the proposed models. Conclusions are provided in Section 5.
2. Long Short-Term Memory Networks
Long short-term memory networks (LSTM), proposed by Hochreiter and Schmidhuber [28], recently had been successfully applied in various forecasting fields, such as stock price movements [11], pandemic [29], rainfall [30], sea levels [31], energy consumptions [32], and sales [33]. LSTM coped with the problem of gradient vanishing and hard-to-capture long-term dependencies in recurrent neural networks when processing long sequences. The cell states are added into the long short-term memory to store the long-term memory. Hence, the essential information can be stored for a long time, and the earlier information can be connected with current tasks. Figure 1 illustrates the memory cell of long short-term memory networks [34,35,36].
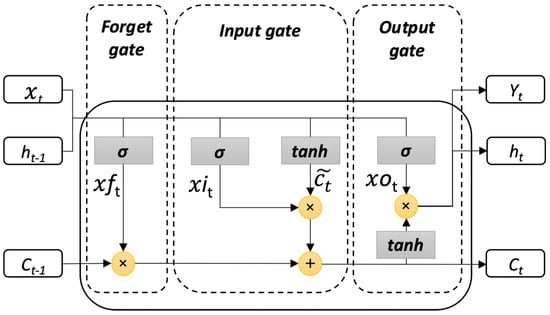
Figure 1.
The architecture of a long short-term memory network.
The long short-term memory network is composed of the forget gate (), the input gate (including and ), the output gate (), and the cell state (). The forget gate controls what information will be discarded and how much information will be added to the next cell’s memory. The input gate determines whether the new information enters the memory. Instead, the output gate defines whether the updated information should be transferred to the next layer of networks. The long short-term memory network calculation is expressed in a way from the input sequence to the output sequence , represented by Equations (1) and (2), respectively:
In the first step, the long short-term memory regulates whether the information should be discarded or stored from the previous cell state . Thus, the forget gate () is constructed by Equation (3), calculated based on the current input and the hidden state at time t − 1:
where represents the activation function and maps the variable to values between 1 and 0; is the input vector to the LSTM unit, W is the weight matrix of the input process, is the weight matrix of the state transitions, and b is the bias vector. Then, the input gate, which includes and , controls information added to the network, represented by Equations (4) and (5), respectively.
where the represents the activation function and maps the variable to values between 1 to −1; and are employed to produce the new state of the memory cell , which can be expressed by Equation (6):
the cell state vector is utilized to calculate the output gate , which is demonstrated in Equation (7).
Finally, the output vector of long short-term memory networks is expressed by Equation (8).
The cell state and activation vector are used to generate the output in the output gate, and the weights and bias terms are adjusted to minimize the loss of objective function in the training phase. The vanishing gradient problems have been successfully solved by the long short-term memory network architecture [11,28,37].
3. The Proposed Architecture for Predicting Stock Markets
Influences of social media on stock market prices have been investigated in English contexts, but studies in non-native English-speaking countries were not explored widely. This study intended to forecast closing values of stock market indices and stock prices in five non-native English-speaking countries. It has been pointed out that fundamental analysis, including sentiment in social media and technical analysis containing technical indices, is essential in forecasting stock prices [38,39]. Figure 2 depicts the architecture of this study. The fundamental analysis has influences on stock prices. Thus, tweets and posts related to the stock market information collected from social media platforms, including Twitter and PTT, were employed as the fundamental data in this study. In addition, technical indicators and trading data served as the technical analysis impacting stock prices. In the data collection phase, fundamental data and technical data were gathered. Thus, two parts comprise the architecture: data collection and preprocessing; models training and testing. In the data collection and preprocessing phase, the multilingual posts collected from Twitter and PTT were transformed into sentiment scores, the stock trading data from Yahoo Finance were gathered, and technical indicators were generated. In this study, three datasets, dataset A, dataset B, and dataset C, were used for forecasting stock markets individually, and forecasting performances generated by three datasets were compared. Dataset A was structured data, dataset B was unstructured data, and dataset C was a hybrid dataset consisting of dataset A and dataset B. Finally, each dataset was divided into a training dataset and a testing dataset individually with percentages of 80% and 20% roughly.
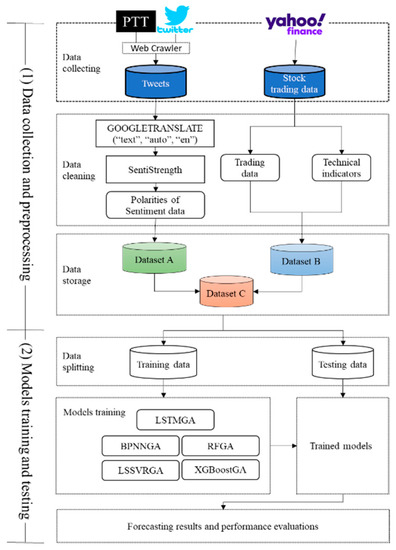
Figure 2.
The flowchart of this study.
3.1. Data Collection and Preprocessing
In this study, both unstructured data and structured data were collected for stock market forecasting. The unstructured data included posts on Twitter and PTT. Selenium and BeautifulSoup were utilized to crowd the users’ posts from 1 January 2019 to 31 December 2019 in five non-native English-speaking countries with one stock market and one cooperation for each country. One keyword was used for collecting social media data for each stock market or company. Thus, ten keywords in total were utilized to gather multilingual posts, the number of original posts and the number of posts after data processing are illustrated in Table 2. Table 3 illustrates the example of the four main steps of data cleaning. The data of the posting contains the posting UTC time (Coordinated Universal Time) and the content of the post. Firstly, adjusting the time of each post to be interrelated with the stock trading data for each country. Secondly, remove the posts with the same content, the day without any tweet, and the paragraph notations for each tweet. Thirdly, Araújo et al. [20] revealed that translating the input text into English and then performing the existing sentiment analysis tool can yield more encouraging results. Thus, the GOOGLETRANSLATE function [40,41,42] for multilingual text translation in Google Sheets was used to translate all posts into English. Finally, the refined posts were calculated by SentiStrength [43,44,45] to generate sentiment scores. Studies pointed out that SentiStrength is a promising tool for sentiment analysis [43,46,47]. In addition, SentiStrength is a lexicon-based technique and outperforms conventional machine learning techniques in sentiment analysis [48]. Thus, in this study, SentiStrength was employed to evaluate the sentiment of posts. The SentiStrength divides posts into positive and negative sentiment polarities with five levels. The positive polarity is from 1 to 5, and the negative polarity is from −1 to −5. The level of 0 does not exist. Each post has one positive level and one negative level. In this study, daily scores were the accumulations of each post’s levels on that day. Table 2 lists countries, languages, codes, keywords, number of posts, and names of stock markets and corporations for five countries collected from Yahoo Finance from 1 January 2019 to 31 December 2019. Trading data and technical indicators served as the other 12 independent variables lustrated in Table 4. Trading data consisted of open, high, low, close, adjusted close, and volume. Technical indicators included K%, D%, William R%, RSI, MACD, PSY, MA, and BIAS; and were computed by the historical stock market data gathered from Yahoo Finance. Trading data and the technical indicators were integrated into dataset B. The trading data and technical indicators were denoted from to and from to , respectively. Finally, two datasets were combined into dataset C. Table 4 and Table 5 show all independent variables and three datasets, respectively.
Table 2.
The codes, keywords, and names of stock markets and corporations.
Table 3.
The example steps of data cleaning.
Table 4.
Independent variables used in this study.
Table 5.
Three datasets used in this study.
3.2. The Training and Testing of Models
Three datasets were divided into training data and testing data. In addition, the portions of the training and testing data were approximately 80% and 20%. Table 6 lists training and testing data periods for stock markets and corporation stocks. The training data were used to train forecasting models, and the testing data were employed to evaluate the performances of forecasting models.
Table 6.
Periods of training data and testing data for stock market indices and corporation stock prices.
Trial and error methods [49,50] and meta-heuristics [51,52,53] are two major ways of determining the parameters of machine learning models. The trial and error methods rely heavily on users’ experiences. As the number of parameters increases, the difficulty of parameter determination arises. Thus, the metaheuristic has been an effective and useful way of determining parameters with a relatively mitigated computational burden. In this study, the genetic algorithm was used to select the parameters of forecasting models. Developed by John H. Holland [54,55], the genetic algorithm was used to cope with optimization problems in a directed search way to find a near-optimal or optimal solution. The details of the genetic algorithm are presented in Figure 3. The first step is to generate the initial population randomly. The population includes chromosomes, and each chromosome consists of genes. Then, the fitness is calculated to measure the quality of the chromosome. The chromosomes with higher values of fitness are selected and left. Sequentially, operations of crossover and mutation are conducted to reproduce the next generation with updated generated chromosomes. For the long short-term memory model, the genetic algorithm tuned three hyper-parameters, including the dropout rate, the learning rate, and the batch size. The genetic algorithm was used with a population size of 20 while the maximum generation was set at 100, and the crossover and mutation ratios used were 0.8 and 0.2.
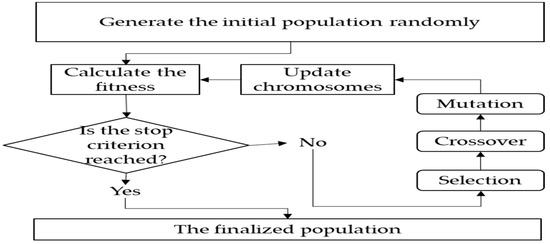
Figure 3.
The flowchart of the genetic algorithm.
Thus, multilingual fundamental data collected from social media platforms and technical data, including historical trading data and technical indicators, were employed to train the five forecasting models with the genetic algorithm to predict stock indices and corporations’ stock prices.
4. Numerical Results
This study used the LSTMGA model to forecast stock indices and corporations’ stock closing prices in the stock market. Forecasting results were compared with four other methods, including BPNNGA, LSSVRGA, RFGA, and XGBoostGA. The long short-term memory network model used in this study concluded 50 neurons. The time stamp, epoch, and optimizer were set as 1, 100, and Nadam, respectively. Table 7 and Table 8 list the parameters of the forecasting models for dataset A, dataset B, and dataset C of five stock market indices and corporations’ stock prices. Two measurements, MAPE and RMSE, were used to demonstrate the performances of forecasting models and illustrated in Equations (9) and (10).
where N is the number of the forecasting periods. and are the actual value at time t and the forecasting value at time t, respectively. The MAPE value is independent of the data scale and is used to compare the performances of forecasting models with various data scales. The RMSE is one of the commonly used measurements to evaluate forecasting accuracy. However, the RMSE values are influenced by data scales theoretically [56]. Figure 4 and Figure 5 illustrate the MAPE and RMSE of three datasets in forecasting models for stock indices. Figure 6 and Figure 7 present the MAPE and RMSE of three datasets according to forecasting models for corporations’ stock prices. LSTMGA models with hybrid dataset C can generate the smallest values of MAPE and RMSE in all individual cases and average values. For dataset A and dataset B, LSTMGA models were more accurate than the other forecasting models according to the average values of MAP. They were superior to the other forecasting models in most individual cases. Table 9 illustrates MAPE and RMSE values of forecasting models with three datasets, and the best results for each dataset in individual cases and on average were in bold. Numerical results indicated that LSTMGA models were superior to the other four machine learning models in forecasting accuracy using hybrid data. MAPE is expressed in a percentage way, and not difficult to compare forecasting performance between datasets while scales vary. RMSE values are easily influenced by data scales. Furthermore, according to Lewis’s MAPE forecasting accuracy levels [57], LSTMGA models provided excellent prediction results with MAPE values less than 5% by using dataset C for all forecasting cases in this study.
Table 7.
Parameters of forecasting models for datasets A, B, and C of stock market indices.
Table 8.
Parameters of forecasting models for datasets A, B, and C of corporations’ stock prices.
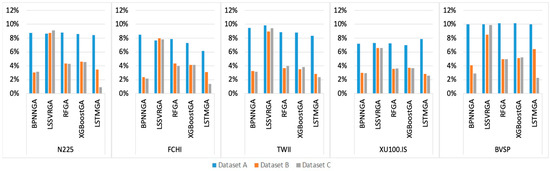
Figure 4.
MAPE values of forecasting models for stock market indices with different datasets.
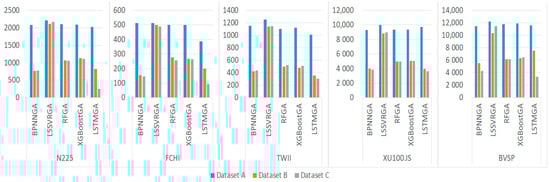
Figure 5.
RMSE values of forecasting models for stock market indices with different datasets.
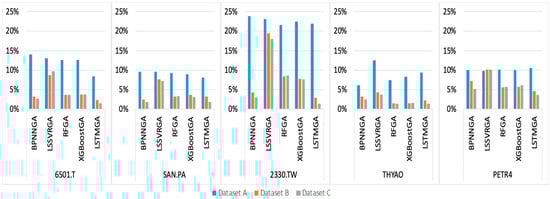
Figure 6.
MAPE values of forecasting models for corporations’ stock prices with different datasets.
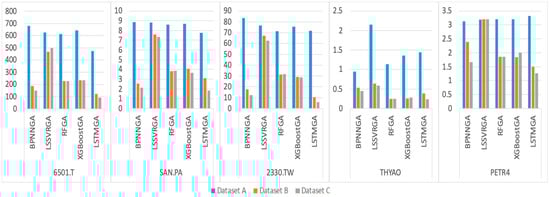
Figure 7.
RMSE values of forecasting models for corporations’ stock prices with different datasets.
Table 9.
MAPE and RMSE values for forecasting models with three datasets.
The nonparametric statistical Wilcoxon signed–rank test [58] was used to measure the performances of LSTMGA models with three different datasets. Based on the null hypothesis that the median of differences between dataset C and dataset A or dataset B equals 0, Table 10 illustrates the Wilcoxon signed–rank test results in dataset C to dataset A and dataset C to dataset B. The Wilcoxon signed–rank test of LSTMGA models is used to verify the statistical significance between the hybrid data, dataset C, and each single-type dataset, dataset A and dataset B. Testing results show that z values are greater than critical values and p values indicate significance levels of 0.025. This shows that employing dataset C by LSTMGA models can generate more statistically and significantly accurate results than using dataset A or dataset B.
Table 10.
The Wilcoxon signed–rank test of LSTMGA models in terms of dataset C to dataset A and dataset C to dataset B.
Boxplots can reveal unusual data, data distributions, and likelihoods of data dispersions [59,60,61]. Figure 8 and Figure 9 show boxplots of absolute errors for forecasting models of stock market indices and corporations’ stock prices correspondingly. It can be observed that LSTMGA models resulted in smaller and more dense absolute errors for various datasets. Figure 10 and Figure 11 plot point-to-point graphs and make comparisons of actual values and predicted values of various forecasting models with three datasets. The plots indicated that the hybrid data could capture trends of stock markets and corporations’ stock prices more than individual data in most forecasting models. In addition, the LSTMGA model with hybrid dataset C performed the best in all cases.
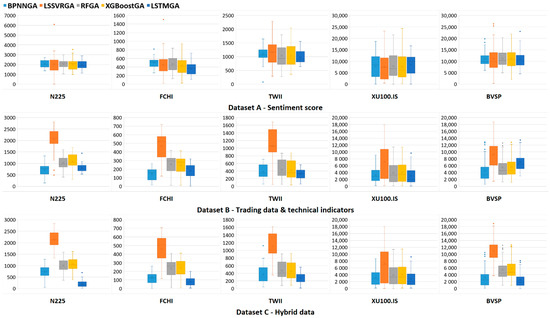
Figure 8.
Boxplots in terms of absolute errors for forecasting models with three datasets of stock market indices.
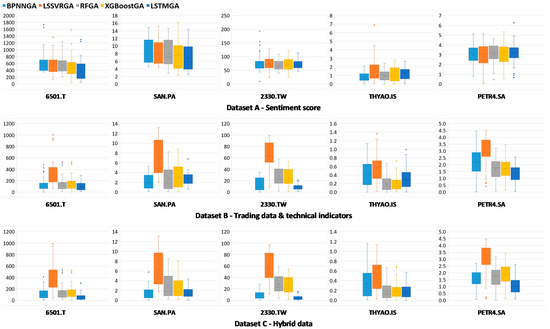
Figure 9.
Boxplots in terms of absolute errors for forecasting models with three datasets of corporations’ stocks.
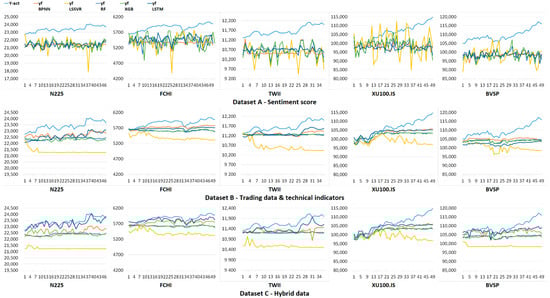
Figure 10.
Point-to-point plots of actual values and predicted values of stock market indices.
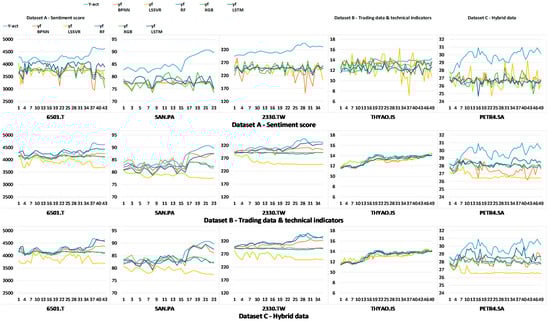
Figure 11.
Point-to-point plots of actual values and predicted values of corporations’ stock prices.
5. Conclusions
Sentiment data and analysis have been applied to many fields and obtained promising results when integrated with classical structured data. For stock market analysis and prediction, numerous studies indicated that investors’ sentiments significantly influence stock markets. This study used three types of data, namely social media data, trading data, and hybrid data, to forecast stock market indices and corporations’ stock prices. The posts of investors in non-native English-speaking countries were translated into English, and then sentiment analysis was performed. Five forecasting models were employed to forecast stock market indices and corporations’ stock prices in a one-step-ahead policy. The genetic algorithm was utilized to determine the appropriate parameters of all forecasting models. The findings of this study can be illustrated as follows. First, more accurate results can be obtained by using hybrid data rather than single social media data or single trading data individually. In addition, the LSTMGA models outperformed the other four forecasting models in terms of forecasting accuracy with hybrid data. The numerical results also indicated that all 10 cases could generate outstanding forecasting results with MAPE values less than 5%, illustrated in Table 9, using the proposed LSTMGA model. Thus, the proposed LSTMGA model can provide feasible, effective, and promising results in forecasting stock market indices and corporations’ stock prices with multilingual sentiment analysis.
For future works, data collected from other countries or regions can be included to examine the robustness and feasibility of the developed LSTMGA model. Secondly, the other transformer-based machine learning natural language processing tools, such as bidirectional encoder representations from transformers (BERT), can be implemented to compare the forecasting accuracy. In addition, more deep learning techniques and simple neural network methods can be used to perform forecasting tasks and compare performances. Thirdly, real-time forecasting can be performed by embedding well-trained models into a system. The system can collect real-time data for forecasting stock markets. Therefore, high-frequency data can be used to reexamine the performance of the proposed models in intraday trading. Finally, using sentiment analysis tools directly to forecast stock markets in English contexts and comparing results with non-native English data is a possible direction for future study.
Author Contributions
Conceptualization, P.-F.P.; data curation; Y.-L.L.; formal analysis, Y.-L.L. and P.-F.P.; funding acquisition, P.-F.P.; methodology, Y.-L.L. and P.-F.P.; software, Y.-L.L.; visualization, Y.-L.L. and C.-J.L.; writing—original draft, Y.-L.L., C.-J.L. and P.-F.P., review and editing, P.-F.P. All authors have read and agreed to the published version of the manuscript.
Funding
This research was funded by the Ministry of Science and Technology, Taiwan, under the Contract Number MOST 109-2410-H-260-023.
Conflicts of Interest
The authors declare no conflict of interest.
References
- Oliveira, N.; Cortez, P.; Areal, N. The impact of microblogging data for stock market prediction: Using twitter to predict returns, volatility, trading volume and survey sentiment indices. Expert Syst. Appl. 2017, 73, 125–144. [Google Scholar] [CrossRef]
- Broadstock, D.C.; Zhang, D. Social-media and intraday stock returns: The pricing power of sentiment. Financ. Res. Lett. 2019, 30, 116–123. [Google Scholar] [CrossRef]
- Wu, S.; Liu, Y.; Zou, Z.; Weng, T.-H. Silstm: Stock price prediction based on multiple data sources and sentiment analysis. Connect. Sci. 2022, 34, 44–62. [Google Scholar] [CrossRef]
- Ko, C.-R.; Chang, H.-T. Lstm-based sentiment analysis for stock price forecast. PeerJ Comput. Sci. 2021, 7, e408. [Google Scholar] [CrossRef] [PubMed]
- Ren, R.; Wu, D.D.; Liu, T. Forecasting stock market movement direction using sentiment analysis and support vector machine. IEEE Syst. J. 2018, 13, 760–770. [Google Scholar] [CrossRef]
- Gupta, I.; Madan, T.K.; Singh, S.; Singh, A.K. Hisa-smfm: Historical and sentiment analysis based stock market forecasting model. arXiv 2022, arXiv:2203.08143. [Google Scholar]
- Jing, N.; Wu, Z.; Wang, H. A hybrid model integrating deep learning with investor sentiment analysis for stock price prediction. Expert Syst. Appl. 2021, 178, 115019. [Google Scholar] [CrossRef]
- Wang, G.; Yu, G.; Shen, X. The effect of online investor sentiment on stock movements: An lstm approach. Complexity 2020, 2020, 4754025. [Google Scholar] [CrossRef]
- Shi, Y.; Zheng, Y.; Guo, K.; Ren, X. Stock movement prediction with sentiment analysis based on deep learning networks. Concurr. Comput. Pract. Exp. 2021, 33, e6076. [Google Scholar] [CrossRef]
- Chung, H.; Shin, K.-S. Genetic algorithm-optimized long short-term memory network for stock market prediction. Sustainability 2018, 10, 3765. [Google Scholar] [CrossRef]
- Fischer, T.; Krauss, C. Deep learning with long short-term memory networks for financial market predictions. Eur. J. Oper. Res. 2018, 270, 654–669. [Google Scholar] [CrossRef]
- Kamara, A.F.; Chen, E.; Pan, Z. An ensemble of a boosted hybrid of deep learning models and technical analysis for forecasting stock prices. Inf. Sci. 2022, 594, 1–19. [Google Scholar] [CrossRef]
- Lu, W.; Li, J.; Li, Y.; Sun, A.; Wang, J. A cnn-lstm-based model to forecast stock prices. Complexity 2020, 2020, 6622927. [Google Scholar] [CrossRef]
- Jin, Z.; Yang, Y.; Liu, Y. Stock closing price prediction based on sentiment analysis and lstm. Neural Comput. Appl. 2020, 32, 9713–9729. [Google Scholar] [CrossRef]
- Conneau, A.; Lample, G. Cross-lingual language model pretraining. Adv. Neural Inf. Process. Syst. 2019, 32, 7059–7069. [Google Scholar]
- Conneau, A.; Khandelwal, K.; Goyal, N.; Chaudhary, V.; Wenzek, G.; Guzmán, F.; Grave, É.; Ott, M.; Zettlemoyer, L.; Stoyanov, V. Unsupervised cross-lingual representation learning at scale. In Proceedings of the 58th Annual Meeting of the Association for Computational Linguistics, Online, 5–10 July 2020; pp. 8440–8451. [Google Scholar]
- Liu, Y.; Gu, J.; Goyal, N.; Li, X.; Edunov, S.; Ghazvininejad, M.; Lewis, M.; Zettlemoyer, L. Multilingual denoising pre-training for neural machine translation. Trans. Assoc. Comput. Linguist. 2020, 8, 726–742. [Google Scholar] [CrossRef]
- Palomino, D.; Ochoa-Luna, J. Palomino-ochoa at semeval-2020 task 9: Robust system based on transformer for code-mixed sentiment classification. In Proceedings of the Fourteenth Workshop on Semantic Evaluation, Barcelona (Online), Spain, 12–13 December 2020; pp. 963–967. [Google Scholar]
- Pei, Y.; Chen, S.; Ke, Z.; Silamu, W.; Guo, Q. Ab-labse: Uyghur sentiment analysis via the pre-training model with bilstm. Appl. Sci. 2022, 12, 1182. [Google Scholar] [CrossRef]
- Araújo, M.; Pereira, A.; Benevenuto, F. A comparative study of machine translation for multilingual sentence-level sentiment analysis. Inf. Sci. 2020, 512, 1078–1102. [Google Scholar] [CrossRef]
- Luo, J.; Zhu, G.; Xiang, H. Artificial intelligent based day-ahead stock market profit forecasting. Comput. Electr. Eng. 2022, 99, 107837. [Google Scholar] [CrossRef]
- Kanwal, A.; Lau, M.F.; Ng, S.P.; Sim, K.Y.; Chandrasekaran, S. Bicudnnlstm-1dcnn—a hybrid deep learning-based predictive model for stock price prediction. Expert Syst. Appl. 2022, 202, 117123. [Google Scholar] [CrossRef]
- Wang, C.; Chen, Y.; Zhang, S.; Zhang, Q. Stock market index prediction using deep transformer model. Expert Syst. Appl. 2022, 208, 118128. [Google Scholar] [CrossRef]
- Gao, R.; Cui, S.; Xiao, H.; Fan, W.; Zhang, H.; Wang, Y. Integrating the sentiments of multiple news providers for stock market index movement prediction: A deep learning approach based on evidential reasoning rule. Inf. Sci. 2022, 615, 529–556. [Google Scholar] [CrossRef]
- Kumar, G.; Singh, U.P.; Jain, S. An adaptive particle swarm optimization-based hybrid long short-term memory model for stock price time series forecasting. Soft Comput. 2022, 26, 12115–12135. [Google Scholar] [CrossRef] [PubMed]
- Aldhyani, T.H.; Alzahrani, A. Framework for predicting and modeling stock market prices based on deep learning algorithms. Electronics 2022, 11, 3149. [Google Scholar] [CrossRef]
- Ratchagit, M.; Xu, H. A two-delay combination model for stock price prediction. Mathematics 2022, 10, 3447. [Google Scholar] [CrossRef]
- Hochreiter, S.; Schmidhuber, J. Long short-term memory. Neural Comput. 1997, 9, 1735–1780. [Google Scholar] [CrossRef]
- Shahid, F.; Zameer, A.; Muneeb, M. Predictions for covid-19 with deep learning models of lstm, gru and bi-lstm. Chaos Solitons Fractals 2020, 140, 110212. [Google Scholar] [CrossRef]
- Li, W.; Kiaghadi, A.; Dawson, C. High temporal resolution rainfall–runoff modeling using long-short-term-memory (lstm) networks. Neural Comput. Appl. 2021, 33, 1261–1278. [Google Scholar] [CrossRef]
- Accarino, G.; Chiarelli, M.; Fiore, S.; Federico, I.; Causio, S.; Coppini, G.; Aloisio, G. A multi-model architecture based on long short-term memory neural networks for multi-step sea level forecasting. Future Gener. Comput. Syst. 2021, 124, 1–9. [Google Scholar] [CrossRef]
- Jin, N.; Yang, F.; Mo, Y.; Zeng, Y.; Zhou, X.; Yan, K.; Ma, X. Highly accurate energy consumption forecasting model based on parallel lstm neural networks. Adv. Eng. Inform. 2022, 51, 101442. [Google Scholar] [CrossRef]
- He, Q.-Q.; Wu, C.; Si, Y.-W. Lstm with particle swam optimization for sales forecasting. Electron. Commer. Res. Appl. 2022, 51, 101118. [Google Scholar] [CrossRef]
- Chen, H.; Li, X.; Wu, Y.; Zuo, L.; Lu, M.; Zhou, Y. Compressive strength prediction of high-strength concrete using long short-term memory and machine learning algorithms. Buildings 2022, 12, 302. [Google Scholar] [CrossRef]
- Lipton, Z.C.; Berkowitz, J.; Elkan, C. A critical review of recurrent neural networks for sequence learning. arXiv 2015, arXiv:1506.00019. [Google Scholar]
- Almalaq, A.; Edwards, G. A review of deep learning methods applied on load forecasting. In Proceedings of the 2017 16th IEEE International Conference on Machine Learning and Applications (ICMLA), Cancun, Mexico, 18–21 December 2017; pp. 511–516. [Google Scholar]
- Li, Z.; Luo, X.; Liu, M.; Cao, X.; Du, S.; Sun, H. Short-term prediction of the power of a new wind turbine based on iao-lstm. Energy Rep. 2022, 8, 9025–9037. [Google Scholar] [CrossRef]
- Puneeth, K.; Rudagi, S.; Namratha, M.; Patil, R.; Wadi, R. Comparative study: Stock prediction using fundamental and technical analysis. In Proceedings of the 2021 IEEE International Conference on Mobile Networks and Wireless Communications (ICMNWC), Tumkur, Karnataka, India, 3–4 December 2021; pp. 1–4. [Google Scholar]
- Nti, I.K.; Adekoya, A.F.; Weyori, B.A. A systematic review of fundamental and technical analysis of stock market predictions. Artif. Intell. Rev. 2020, 53, 3007–3057. [Google Scholar] [CrossRef]
- Ma, J.; Li, L. Data augmentation for chinese text classification using back-translation. J. Phys. Conf. Ser. 2020, 1651, 012039. [Google Scholar]
- Schnaider, K.; Schiavetto, S.; Meier, F.; Wasson, B.; Allsopp, B.B.; Spikol, D. Governmental response to the covid-19 pandemic-a quantitative ethnographic comparison of public health authorities’ communication in denmark, norway, and Sweden. In International Conference on Quantitative Ethnography; Springer: Berlin, Germany, 2021; pp. 406–421. [Google Scholar]
- Fuentes-Moraleda, L.; Diaz-Perez, P.; Orea-Giner, A.; Munoz-Mazon, A.; Villace-Molinero, T. Interaction between hotel service robots and humans: A hotel-specific service robot acceptance model (sram). Tour. Manag. Perspect. 2020, 36, 100751. [Google Scholar] [CrossRef]
- Leppert, K.; Saliterer, I.; Korać, S. The role of emotions for citizen engagement via social media—A study of police departments using twitter. Gov. Inf. Q. 2022, 39, 101686. [Google Scholar] [CrossRef]
- Thelwall, M.; Buckley, K.; Paltoglou, G. Sentiment strength detection for the social web. J. Am. Soc. Inf. Sci. Technol. 2012, 63, 163–173. [Google Scholar] [CrossRef]
- Thelwall, M.; Buckley, K.; Paltoglou, G.; Cai, D.; Kappas, A. Sentiment strength detection in short informal text. J. Am. Soc. Inf. Sci. Technol. 2010, 61, 2544–2558. [Google Scholar] [CrossRef]
- Li, X.; Xu, M.; Zeng, W.; Tse, Y.K.; Chan, H.K. Exploring customer concerns on service quality under the covid-19 crisis: A social media analytics study from the retail industry. J. Retail. Consum. Serv. 2022, 70, 103157. [Google Scholar] [CrossRef]
- Singh, S.P.; Adhikari, A.; Majumdar, A.; Bisi, A. Does service quality influence operational and financial performance of third party logistics service providers? A mixed multi criteria decision making-text mining-based investigation. Transp. Res. Part E Logist. Transp. Rev. 2022, 157, 102558. [Google Scholar] [CrossRef]
- Stieglitz, S.; Dang-Xuan, L. Emotions and information diffusion in social media—sentiment of microblogs and sharing behavior. J. Manag. Inf. Syst. 2013, 29, 217–248. [Google Scholar] [CrossRef]
- Liu, H.; Chen, C. Spatial air quality index prediction model based on decomposition, adaptive boosting, and three-stage feature selection: A case study in china. J. Clean. Prod. 2020, 265, 121777. [Google Scholar] [CrossRef]
- Samal, K.K.R.; Babu, K.S.; Das, S.K. Multi-output spatio-temporal air pollution forecasting using neural network approach. Appl. Soft Comput. 2022, 126, 109316. [Google Scholar] [CrossRef]
- Yang, L.; Shami, A. On hyperparameter optimization of machine learning algorithms: Theory and practice. Neurocomputing 2020, 415, 295–316. [Google Scholar] [CrossRef]
- Manna, A.K.; Rahman, M.S.; Shaikh, A.A.; Bhunia, A.K.; Konstantaras, I. Modeling of a carbon emitted production inventory system with interval uncertainty via meta-heuristic algorithms. Appl. Math. Model. 2022, 106, 343–368. [Google Scholar] [CrossRef]
- Tondut, J.; Ollier, C.; Di Cesare, N.; Roux, J.; Ronel, S. An automatic kriging machine learning method to calibrate meta-heuristic algorithms for solving optimization problems. Eng. Appl. Artif. Intell. 2022, 113, 104940. [Google Scholar] [CrossRef]
- Holland, J.H. Adaptation in Natural and Artificial Systems; The University of Michigan Press: Ann Arbor, MI, USA, 1975. [Google Scholar]
- Holland, J.H. Genetic algorithms. Sci. Am. 1992, 267, 66–73. [Google Scholar] [CrossRef]
- Hyndman, R.J.; Koehler, A.B. Another look at measures of forecast accuracy. Int. J. Forecast. 2006, 22, 679–688. [Google Scholar] [CrossRef]
- Lewis, C.D. Industrial and Business Forecasting Methods: A Practical Guide to Exponential Smoothing and Curve Fitting; Butterworth-Heinemann: Oxford, UK, 1982. [Google Scholar]
- Wilcoxon, F. Individual comparisons by ranking methods. In Breakthroughs in Statistics; Springer: Berlin, Germany, 1992; pp. 196–202. [Google Scholar]
- Tukey, J.W. Exploratory Data Analysis; Sage: Reading, MA, USA, 1977; Volume 2. [Google Scholar]
- Nuzzo, R.L. The box plots alternative for visualizing quantitative data. PM&R 2016, 8, 268–272. [Google Scholar]
- Moeini, B.; Haack, H.; Fairley, N.; Fernandez, V.; Gengenbach, T.R.; Easton, C.D.; Linford, M.R. Box plots: A simple graphical tool for visualizing overfitting in peak fitting as demonstrated with x-ray photoelectron spectroscopy data. J. Electron Spectrosc. Relat. Phenom. 2021, 250, 147094. [Google Scholar] [CrossRef]
Publisher’s Note: MDPI stays neutral with regard to jurisdictional claims in published maps and institutional affiliations. |
© 2022 by the authors. Licensee MDPI, Basel, Switzerland. This article is an open access article distributed under the terms and conditions of the Creative Commons Attribution (CC BY) license (https://creativecommons.org/licenses/by/4.0/).