Article

Plasma-Assisted Synthesis of Surfactant-Free and D-Fructose-Coated Gold Nanoparticles for Multiple Applications

1
Plasma Physics Laboratory, Department of Physics, COMSATS University, Islamabad 45550, Pakistan
2
Materials Laboratory, Department of Physics, COMSATS University, Islamabad 45550, Pakistan
3
Department of Physics, University of Gujrat, Gujrat 50700, Pakistan
4
Mechanical and Industrial Engineering Department, Abu Dhabi University, Abu Dhabi 111188, United Arab Emirates
5
Electrical Engineering Department, Faculty of Engineering & Technology, Future University in Egypt, New Cairo 11835, Egypt
*
Author to whom correspondence should be addressed.
Materials 2022, 15(21), 7579; https://doi.org/10.3390/ma15217579
Submission received: 18 July 2022 / Revised: 14 October 2022 / Accepted: 25 October 2022 / Published: 28 October 2022

Abstract

:
The excellent optical properties of gold nanoparticles (AuNPs) make them promising for numerous applications. Herein, we present a facile synthesis of both surfactant-free ( S F A u N P s ) and non-toxic D-fructose (DF)-coated gold nanoparticles ( D F A u N P s ) via the plasma–liquid interactions (PLIs) method. Moreover, we demonstrate that both S F A u N P s and D F A u N P s are potential candidates for trace detection via surface-enhanced Raman scattering ( S E R S ) and catalytic degradation of toxic dyes. However, S F A u N P s have superior S E R S and catalytic performance compared to the D F A u N P s due to their surfactant-free nature. Moreover, S F A u N P s have also been shown to quench the fluorescence of analyte molecules, making their S E R S -based trace detection more efficient. In particular, S E R S enhancement of rhodamine 6G ( R 6 G ) and catalytic reduction of a toxic dye methylene blue ( M B ) have been explored.

1. Introduction

Gold nanoparticles ( A u N P s ) have attracted great interest owing to their unique properties such as stability, non-toxicity, and surface plasmon resonance (SPR), which give rise to interesting optical properties in the visible and near-infrared ( I R ) regions [1,2,3,4]. These properties make them attractive for applications in catalysis [5,6], sensing [7,8], photodynamic therapy [9,10], drug delivery [11,12], corrosion resistance in electrical connectors [13,14], visible and infrared shielding [15], photothermal therapy [16,17] and so forth. However, the majority of applications require pure, stable and well-defined A u N P s [18]. Therefore, the synthesis of pure, stable, reproducible, and monodispersed A u N P s has attracted great research attention. The synthesis methods employed for this purpose include top-down methods such as laser ablation of solid targets, electrolysis, ball milling, aerosol techniques, and bottom-up techniques such as chemical reduction methods, biological methods, and P L I techniques [19,20,21]. However, most of the top-down methods work either at higher temperatures or at high speeds, which affect the purity and quality of metallic nanoparticles [22,23]. Similarly, some of the bottom-up techniques such as chemical or biological methods require reducing agents for the reduction of gold precursors in a solution. These chemicals may be toxic, but even when they are non-toxic, they affect the purity as well as the application of A u N P s towards sensing and catalysis [24,25].
The plasma–liquid interaction ( P L I ) technique employs the atmospheric pressure microplasma generated above the liquid surface. It is suitable for the synthesis of pure and surfactant-free metallic nanoparticles, as it avoids the usage of reducing agents, and plasma species such as ions, UV - radiation   and electrons are utilized for reduction purposes [26]. However, due to the surfactant-free surface, the synthesized NPs are not very stable and have a shorter shelf-life. During wet chemical synthesis, different conventional capping agents such as cetyl-trimethylammonium bromide ( C T A B ) , sodium citrate, etc., have usually been employed as a stabilizer to improve the stability of nanoparticles and control their growth kinetics [27,28]. However, the majority of these conventional capping agents are either toxic or have a bigger size that affects the application of AuNPs as well as other properties such as sensing and catalysis [29,30,31,32]. For example, for excellent S E R S detection capability, the analyte should have a close approach to the surface of   A u N P s . This is because, in the S E R S technique, the Raman peaks of the target molecules (analytes) are mainly enhanced by the high near field of A u N P s , the metal nanoparticles originating from S P R . Larger molecular stabilizers act as a spacer and keep the analyte away from the surface of the A u N P s , which reduces their S E R S capability. Therefore, the larger the size of the stabilizer, the smaller will be the S E R S capability of   A u N P s . If the size of the capping agent is greater than a couple of nanometers, it can also enhance the featureless fluorescence signal of the analyte [33]. As the Raman cross-section is usually 8 to 10 orders of magnitude lower than the fluorescence cross-section, Raman peaks under such conditions are overshadowed by the fluorescence background [34,35]. Similarly, for excellent catalytic activities of   A u N P s , the reactants should be able to adsorb on the surface of the AuNPs, which is compromised when the surface of the AuNPs is covered with the surfactant molecules.
The sensing, SERS, catalytic, and biomedical applications of functionalized and unfunctionalized AuNPs synthesized by plasma have been explored by a number of researchers. Wang et al. carried out the synthesis of AuNPs using atmospheric pressure microplasma [36]. They showed that the stirring mode, stabilizer concentration, and discharge power all affect the final size and size distribution of the synthesized AuNPs. By tuning the reaction parameters, the size of the AuNPs was tuned from about 11 nm to 53 nm. The synthesized AuNPs showed excellent capability for the detection of cardiac troponin I [36]. Li et al. employed microplasma-synthesized AuNPs with the size ranging from 4 to 12 nm for SERS-based trace detection of methylene blue [37]. They obtained enhancement factors of the order of 108. For the catalytic degradation of organic dyes, usually the composites of AuNPs with other materials are employed. For instance, Yang et al. used plasma to fabricate composites containing 10 nm AuNPs uniformly distributed within the reduced graphene–oxide matrix and employed them for the catalytic reduction of 4-nitrophenol to 4-aminophenol [38]. Liu et al. fabricated the hybrid structures of carbon nanotubes with AuNPs of varying size ranging from 12 to 40 nm and used them for green oxidation of silanes [39]. With regard to biological applications, Nguyen et al. demonstrated that polydopamine-functionalized AuNPs synthesized by plasma, having an average size of 54 nm, were excellent for anti-cancer applications due to their polydopamine functionalization [40]. However, despite the previous work, a comparative study of the applications of functionalized and unfunctionalized AuNPs, synthesized by PLI, is still missing. It would be interesting to explore if the surfactant-free nature of AuNPs has any impact on their applications. In the present study, a P L I technique was employed for the synthesis of surfactant-free gold nanoparticles ( S F A u N P s ) and D-fructose (DF)-coated AuNPs ( D F A u N P s ). Both NPs were used for S E R S -based molecular trace detection and catalytic degradations of toxic dyes. The S F A u N P s clearly showed superior SERS-based trace detection and catalytic reduction capabilities compared to D F A u N P s , as there was no barrier for the analyte to reach close to the particle’s surface.

2. Experimental Section

2.1. Materials and Solution Preparations

For the synthesis, chloroauric acid ( H A u C l 4 > 99.99 % ) , DF ( C 6   H 12   O 6 ) , rhodamine 6 G   ( R 6 G ) , and methylene blue ( M B ) were used. H A u C l 4 , R 6 G , and M B were purchased from Sigma-Aldrich while D-fructose ( D F ) was purchased from Avonchem. The utilized chemicals were used as received, and no further purification was performed. Deionized ( D I ) water was used to prepare all solutions.

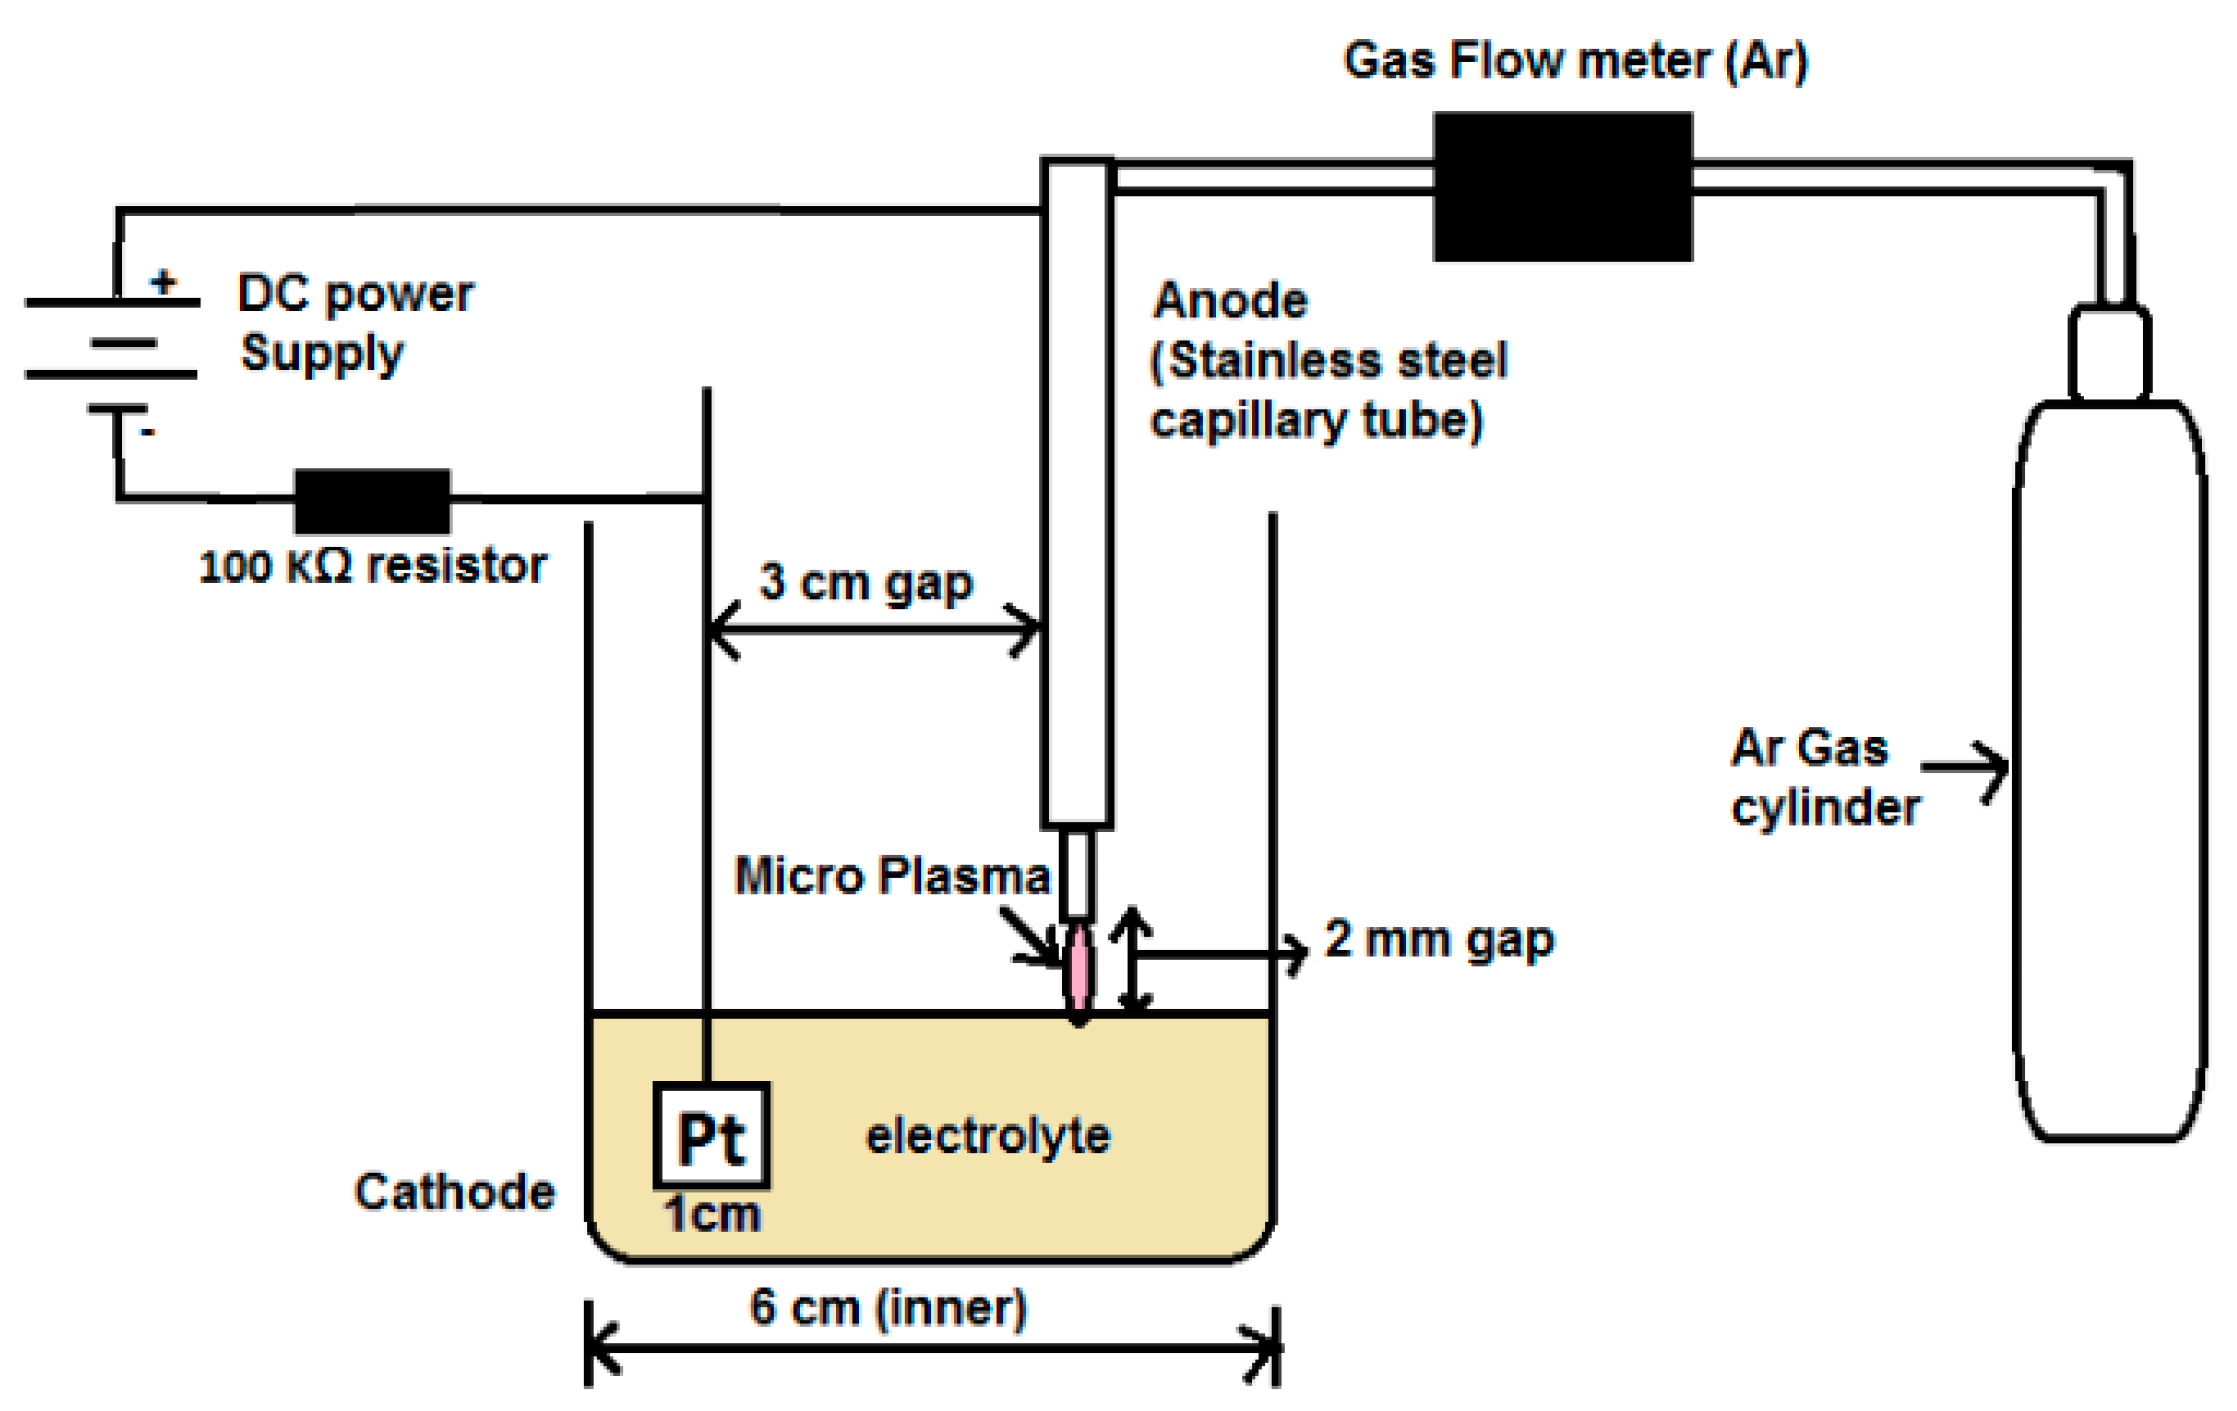
2.2. Experimental Setup

In this study, a P L I setup with the liquid cathode (Figure 1) was employed to synthesize A u N P s . This P L I setup consisted of a reaction cell, high voltage DC-power supply (Gamma, model No. R R 15 12 r / 220 / M 678 ), Hastings gas flowmeter for argon (model   E A L L 500 P with a range from   0   to     1200   gm / min ), and a gas cylinder (argon). The reaction cell was a glass beaker containing electrolyte solution and two electrodes. The first electrode was a platinum wire wound over a quartz slide ( 5   mm × 5   mm ) acting as a cathode and immersed in the solution while the second electrode was a stainless-steel capillary tube (outer diameter (OD = 1 mm) and internal diameter (ID = 0.2 mm)), placed 2 mm above the liquid surface acting as an anode. To avoid arcing in gas phase operation at high D C voltage, the separation between the platinum electrode and the capillary tube was set up to 3 cm.

2.3. Synthesis and Characterization

As the main reduction of metallic precursors in the P L I technique occurs at the plasma–liquid interface, suitable polarities of the electrodes were selected to push metallic precursors to this main reaction zone. For example, the liquid cathode was more suitable for cationic precursors while the liquid anode was appropriate for anionic ones. However, for the synthesis of gold nanoparticles from   H A u C l 4 , a liquid cathode case was more efficient even though one can use a liquid anode too [42]. This is because H A u C l 4 forms A u C l 4 in DI water, which is slightly less stable and separates into gold cations and chlorine anions according to the cyclic chemical reaction   A u C l 4   A u + 3 + 4 C l [43]. In the case of the liquid cathode, the   A u C l 4 ions are pushed to the plasma–liquid interface where first gold cations ( A u + 3 ) are separated from A u C l 4 by the positive ions such as H + showered from the plasma and then reduced into the neutral gold atom ( A u 0 ) by other reducing agents such as a secondary electron. For the generation of atmospheric pressure plasma, argon gas flow rate of 50 SCCM was used. This plasma was then sustained at the operating current of 5 mA.
Before starting each experiment, the platinum electrode and glass beaker were cleaned using aqua-regia (HNO3 + 3HCl) and then rinsed 5 times with DI water to confirm the removal of all possible impurities from their surfaces.
For the synthesis of   S F A u N P s , 20 mL electrolytic solution of gold precursor with 0.5 mM concentration was prepared in a glass beaker and then treated with atmospheric pressure microplasma for up to 25 min. Similarly, for the synthesis of D F A u N P s , 20 mL solution consisting of 0.5 mM concentrations of gold precursors and 50 mM concentrations of   D F was also treated with the same atmospheric pressure plasma for 25 min. These plasma-treated solutions were monitored with the help of U V V i s absorption spectrometer to confirm the formation of gold nanoparticles and the completion of the synthesis processes. The as prepared S F A u N P s and D F A u N P s were subsequently stored in airtight glass vials for further characterizations and applications.
To study the shape, size, morphology, and size distribution of S F A u N P s and   D F A u N P s , scanning electron microscope ( S E M ) TESCAN MIRA3 was used. U V V i s S F A u N P s
Before SEM analysis, D F A u N P colloidal solutions of SF-AuNPs and DF-AuNPs were centrifuged for 10 min at 12,000 rpm. After removing the clear solution, the remaining precipitates were redispersed in the same amount of D I water and centrifuged again for 10 min at 12,000 rpm to confirm the removal of the remaining D F and gold precursors from   A u N P s . For SEM imaging, the centrifuged S F A u N P s   and   D F A u N P s were redispersed in deionized water having 10 times smaller volume and then sonicated at room temperature for 30 min. Afterwards, 20 µL of the sonicated solutions of S F A u N P s and D F A u N P s were dried on two separate silicon slices at room temperature. In order to determine the elemental composition of S F A u N P s   and   D F A u N P s , energy dispersive X-ray ( E D X ) spectroscopy was used. In order to determine the crystalline structure of the as prepared S F A u N P s and   D F A u N P s , X-ray Diffractometery () was carried out. For XRD analysis, Panalytical Xpert-Pro diffractometer was used. Fourier transform infrared ( F T I R ) spectroscopy was carried out using Shimadzu spectrometer (IRTracer-100) to ensure the successful coating of DF on the surfaces of A u N P s . For X R D and F T I R analysis, the centrifuged S F A u N P s and D F A u N P s were redispersed in deionized water of 20 times smaller volume to obtain a concentrated solution of S F A u N P s and   D F A u N P s . For X R D analysis, 200 µL of this concentrated solution of both S F A u N P s and D F A u N P s was dried on glass substrates. Similarly, for F T I R analysis, 150 µL of the same concentrated solutions of D F A u N P s was dried on a glass substrate. For FTIR spectroscopic reference analysis, 150 µL of DF solution was also dried on a glass substrate.

2.4. SERS Analysis

Raman spectroscopy was employed to study the SERS base trace molecular detection capability of S F A u N P s and D F A u N P s by using RAMBOSS Raman spectrometer by Dong Woo Optron, South Korea. For S E R S analysis, the centrifuged solutions of both S F A u N P s and   D F A u N P s were redispersed in D I water having 6 times smaller volume to make their concentrated solution. Firstly, the concentrated NP solutions of 20 µL were dried at room temperature onto a glass substrate after which 20 µL solutions (10−6 M) of R6G were dried on top of the dried layers of both S F A u N P s and   D F A u N P s . For SERS reference analysis, 20 µL solution of R 6 G (1 µM) was dried on a glass substrate. Similarly, 20 µL solutions of S F A u N P s and D F A u N P s were dried on glass substrates for studying of their Raman spectra. To investigate the coverage of the exposed regions with S F A u N P s and   D F A u N P s , optical microscope, integrated within the Raman system, was used.

2.5. Catalysis Experiments

For catalytic activity, the centrifuged solutions of both S F A u N P s and   D F A u N P s were re-dispersed in D I water having the same volume. A 300 µL solution of NaBH4 (0.1 M) and 2.7 mL solution of MB (0.05 mM) were mixed in a cuvette. Subsequently, 50 µL solution of S F A u N P s was added to the same cuvette containing the mixture of NaBH4 and MB. Afterwards, the degradation process of M B was monitored via U V V i s absorption spectroscopy on regular bases of time intervals of 1 min. Similarly, to study the catalytic activity of   D F A u N P s , 2.7 mL M B (0.05 mM), 300 µL N a B H 4 (0.1 mM), and 50 µL D F A u N P s solutions were mixed in a cuvette and then monitored for degradation processes with the help of U V V i s absorption spectroscopy.

3. Results and Discussion
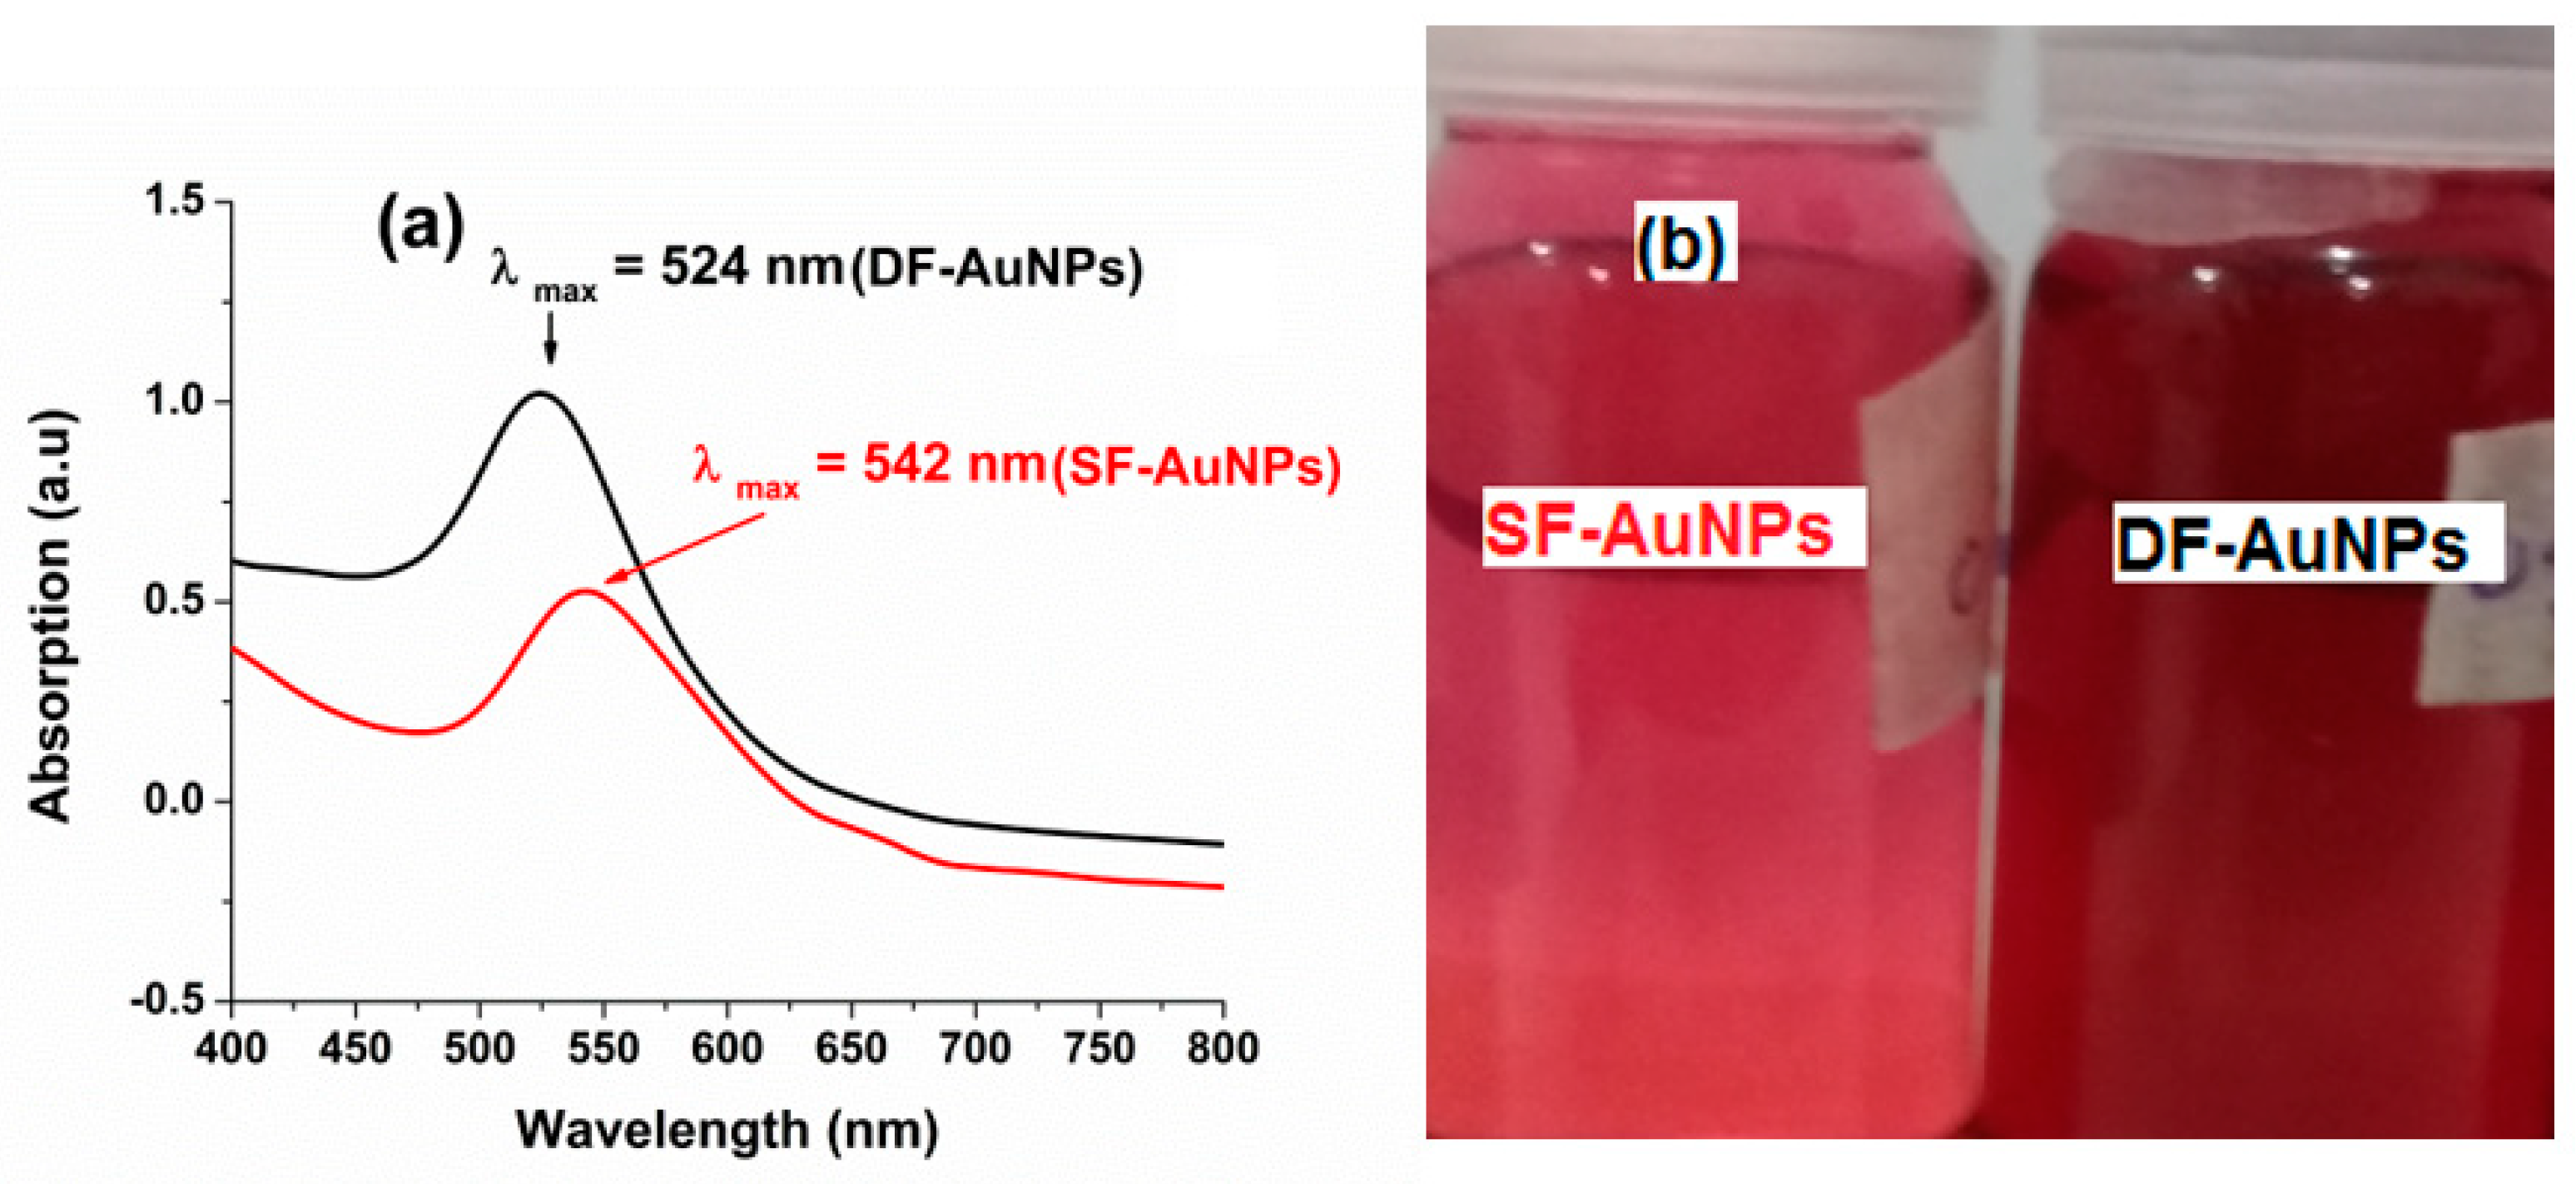
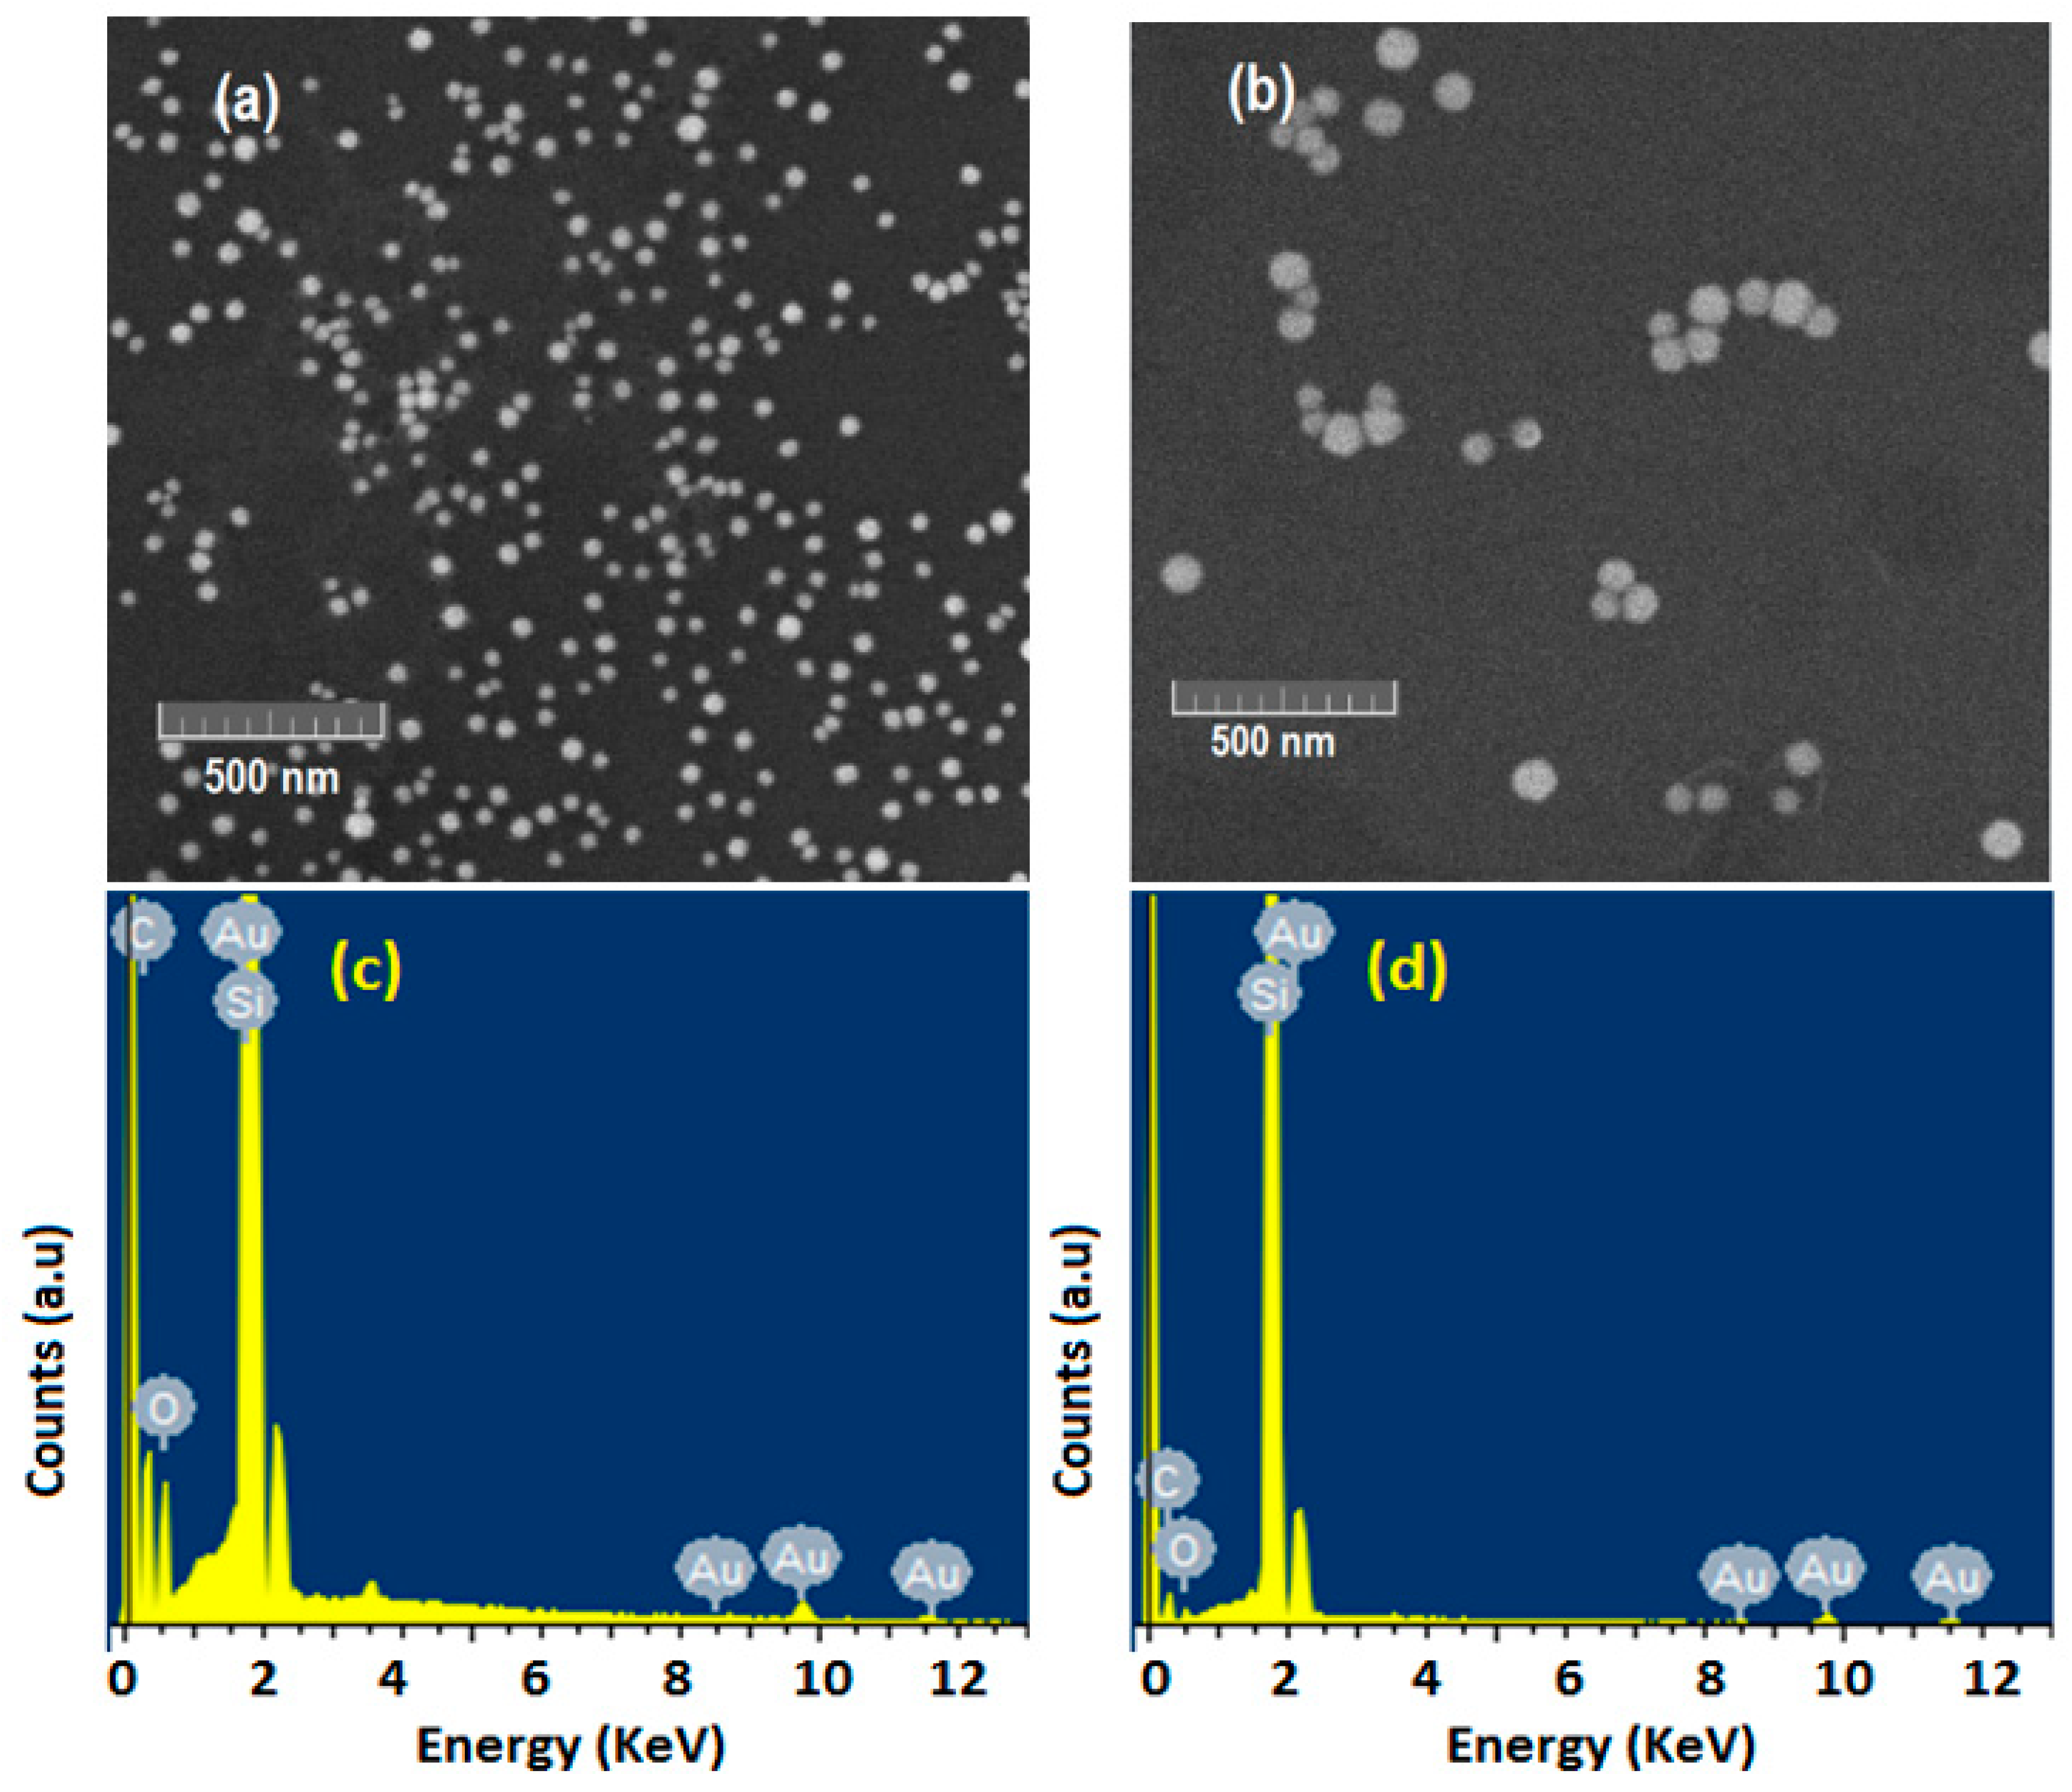
3.1. Synthesis and Characterization of S F A u N P s and D F A u N P s

In the P L I setup with a liquid cathode, the positive ions such as argon ions ( A r + ), air ions   ( N 2 + ,   O 2 + ) , and water vapor ions ( ( H 2 O + ) g ) generated in the plasma region are showered on the liquid surface and they ionize or dissociate the water molecules into highly reactive species such as H ± , O H ± ,     ( H 2 O + ) a q   and   e a q [33,44]. These radicals are crucial for the reduction of the gold ions in the solution and convert them into neutral gold atoms. Another strong reducing agent, hydrogen peroxide ( H 2 O 2 ) , is also generated in the liquid due to the combinations of O H radicals that have a longer life as compared to other radicals. These radicals can also reduce gold precursors at the plasma–liquid interface as well as in the bulk liquid. The expected reduction reactions of the gold precursors in the solution by e ,   H ,   O H , and H 2 O 2 are given bellow [34,45]:
A u + 3 + 3 e A u 0
A u + 3 + 3 H A u 0 + 3 H
A u + 3 + 3 O H A u 0 + 3 O H
2 A u + 3 + 3 H 2 O 2 2 A u 0 + 6 H + + 3 O 2
The supersaturation of the A u atoms causes nucleation and subsequently the growth of A u N P s . In the case of   D F A u N P s , DF controls the growth kinetics of A u N P s and enhances their stability as well.
U V V i s absorption spectroscopy is a proven technique to monitor both growth and formation of the nanoparticles of the desired materials, in terms of size and shape. As A u N P s have size- and shape-dependent signature S P R peaks, their formation and identification can be confirmed with the help of U V V i s absorption spectroscopy. The U V V i s absorption spectra of SFAuNPs and   D F A u N P s ( D F : A u = 100 : 1 ) are given in Figure 2a, according to which the absorption peak of the   D F A u N P s appears narrower and blue-shifted as compared with that   of   the       S F A u N P s , indicating the synthesis of smaller and relatively more uniform spherical AuNPs in the presence of the surfactant ( D F ). It is important to note that the change in the plasmon position of about 18 nm in this case cannot be simply due to the surface coating of D F A u N P s . Although the presence of the surfactant changes the plasmon peak position due to the change in the local dielectric environment, the change is not that pronounced, i.e., 1 to 2 nm. On the other hand, the change in the size of the nanoparticles can cause a comparatively larger shift in the plasmon due to the phase retardation effects [46]. The change in the peak absorbance is also evident by the change in color of the two nanoparticle solutions shown in Figure 2b.
Figure 3a,b shows the S E M images of the D F A u N P s   and   S F A u N P s ,   respectively. In the presence of the surfactant (DF), the synthesized A u N P s are smaller, and relatively uniform spheres with an estimated average size of 20 nm (Figure 3a). However, in the absence of DF, l the synthesized A u N P s are relatively bigger with 40 nm as their estimated average size (Figure 3b). These S E M results and U V V i s absorption spectra (Figure 2) are consistent [26].
The composition of elements in the as-synthesized D F A u N P s and S F A u N P s determined using EDX are given in Figure 3c and Figure 3d, respectively. As per elemental identification carried out via E D X spectrum, the sample comprises A u (due to AuNPs), carbon (likely due to DF, or due to burning during scanning), silicon (due to S i O 2 substrate on which D F A u N P s   and   S F A u N P s were deposited), and oxygen (due to DF).
Figure 4a depicts the X R D patterns of   S F A u N P s and D F A u N P s . In the figure, the Bragg’s peaks at 38.2°, 44.5°, 64.9°, and 77.9° correspond to the (111), (200), (220), and (311) planes of the face-centered cubic ( F C C ) crystalline structure of pure gold. The peaks match well with the reference card for gold J C P D S   F i l e   n u m b e r   04 0784 (black plot in Figure 4a). These X R D patterns confirm the crystalline nature of S F A u N P s   and   D F A u N P s . These X R D spectra also point to the formation of pure gold nanoparticles in the samples.
In order to verify the functionalization of AuNPs with DF, FTIR spectroscopy of D F A u N P s was carried out. The   F T I R spectra of DF and   D F A u N P s are shown in Figure 4b. Vibrational bands of DF are classified as O H vibrational stretching bands lying at 3876–3005 cm−1, C H vibrational stretching bands at 3000–2061 cm−1, and C = O stretching bands at 1849–1634 cm−1. Furthermore, the characteristic bands related to DF including C O and C C   stretching (900–1153 cm−1) lie at 1500–600 cm−1 [47,48]. In the F T I R spectra of DF (black line in Figure 4b), bands related to O H stretching at 3771, 3707, and 3227 cm−1 and C H vibrational stretching bands at 2927, 2870, 2374 cm−1 and 2334 cm−1 are seen. Moreover C = O , CO, and C C bands are observed at 1719 cm−1, 1051 cm−1, and 962 cm−1, respectively [33]. In the F T I R spectra of D F A u N P s (red plot in Figure 4b), O H bands at 3771 and 3707 cm−1 of DF are merged into a single strong, broadened and shifted band at 3634 cm−1 (lower wavenumber) () while the O-H band at 3227 cm−1  O H becomes narrower and shifts to 3005 cm−1 (lower wavenumber) (), indicating the physisorption of DF via its OH functional groups with A u N P s . All C H vibrational stretching bands are shifted to lower frequencies, i.e., 2927 to 2904 cm−1, 2870 to 2582 cm−1, and 2374 to 2349 cm−1. The C H band at 2870 shifts to 2582 cm−1 and becomes stronger and broadened, indicating the binding of the hydroxyl group with   A u N P s . All other remaining vibrational bands of DF are weakened and shifted upon A u N P s coordination. The observed broadening and shifting of the vibrational bands are expected due to the metal-ligand secondary bonding of the fructose’s hydroxyl groups with   A u N P s , which affects the corresponding stretching vibrations. With the   F T I R analysis of DFAuNPs, it is confirmed that A u N P s are successfully coated with DF molecules.

3.2. SERSSF–AuNPsDF–AuNPs
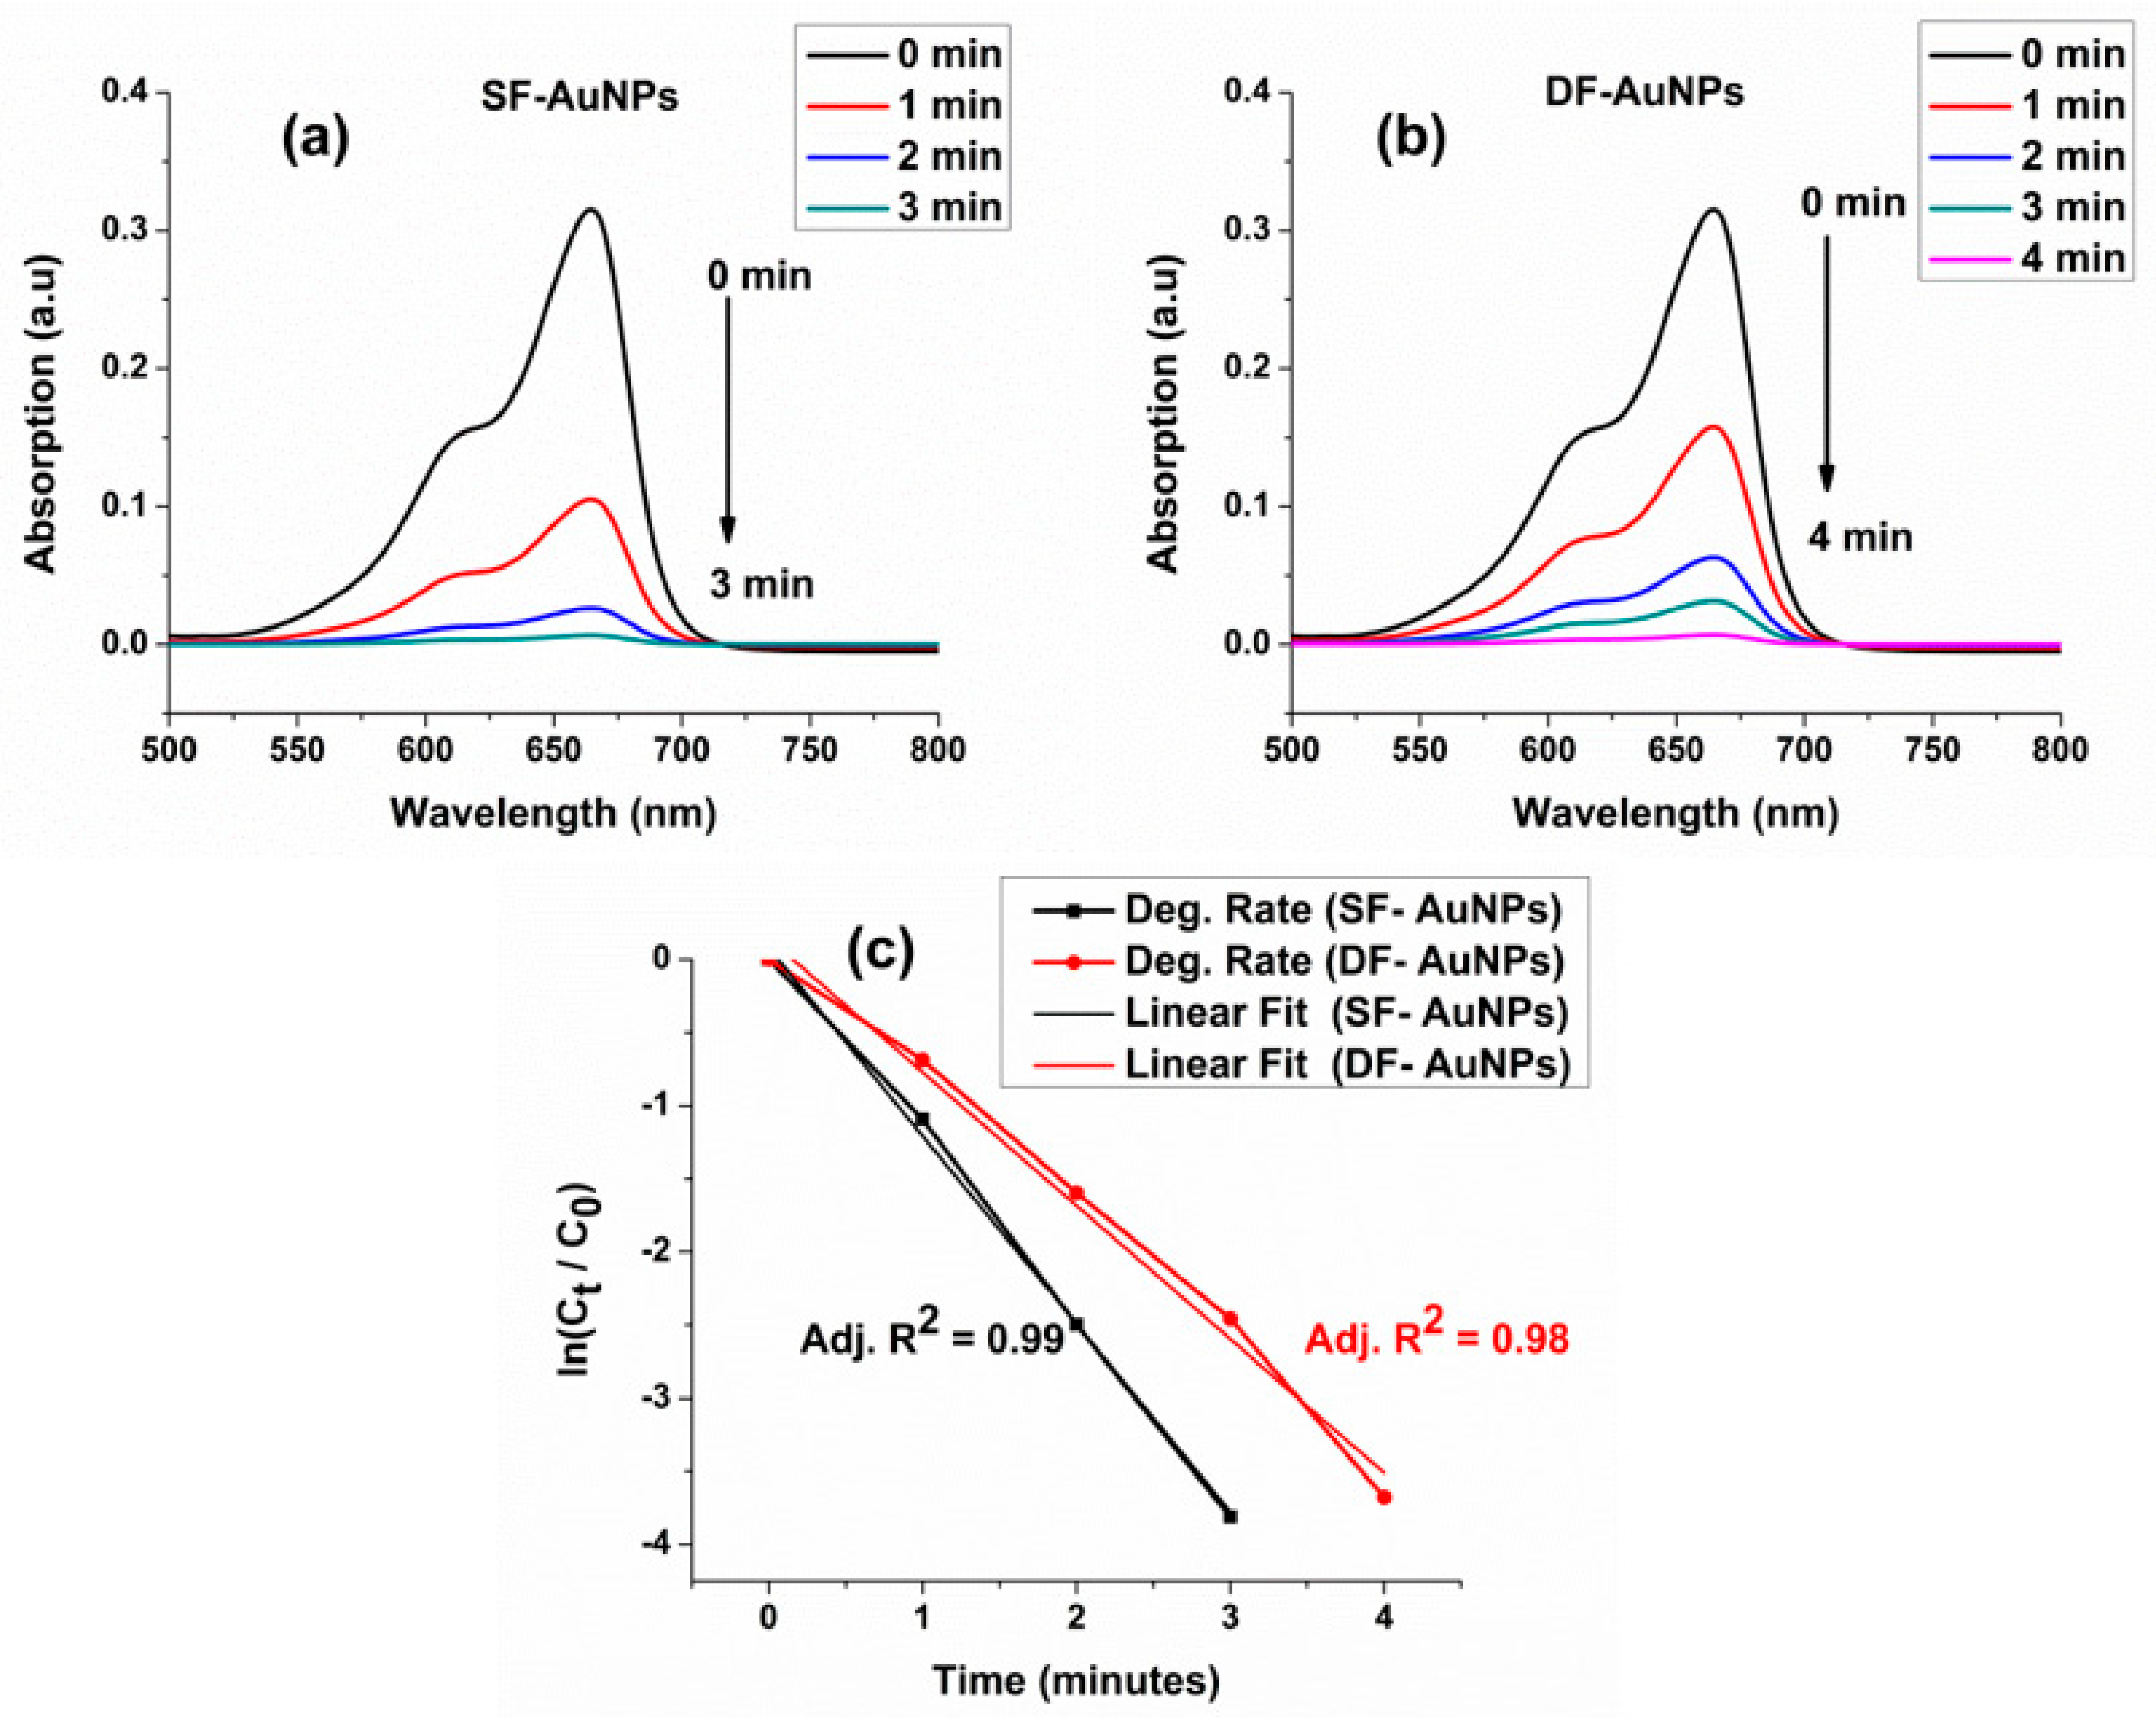
The S E R S spectra of R 6 G (µM), R 6 G deposited on S F A u N P s and   D F A u N P s , and S F A u N P s and DFAuNPs without R 6 G are shown in Figure 5. The Raman spectra of both S F A u N P s and D F A u N P s in the absence of R 6 G are nearly horizontal lines with little humps between 1450 and 1720 cm−1, indicating no contributions to Raman scattering. The little humps in the Raman spectra of both S F A u N P s and D F A u N P s may be expected due to the glass substrates. When only R 6 G is deposited on the substrate, in the absence of S F A u N P s and   D F A u N P s , a featureless broad hump appears as a result of the fluorescence of   R 6 G . The laser with excitation wavelength of 514 nm is used which excites the fluorescence of R 6 G as well. As mentioned before, significantly higher fluorescence cross-section, as compared to the Raman cross-section, makes it difficult to observe Raman peaks under electronic excitation conditions [33]. However, when R 6 G is placed on the S F A u N P or D F A u N P substrate, several intense Raman peaks of R 6 G   appear. In the S E R S spectra of both   S F A u N P s and D F A u N P s , the IP (in plane) ring band of C C C , OP (out of plane) and IP bands of C H stretching at 661, 778 and 1137cm−1 are seen, respectively. The C C aromatic stretching of R 6 G is seen at 1198, 1324, 1528, 1597, 1620, and 1670 cm−1, while that of C N stretching is seen at 1379 cm−1. The peak positions agree well with the reported Raman spectra of R 6 G [41]. In the case of the S F A u N P s substrate, the fluorescence of R 6 G is quenched, which is possible only if R 6 G   molecules have a closer approach to the surface of SF-AuNPs. This fluorescence quenching also confirms the surfactant-free synthesis of A u N P s via our P L I setup. In fluorescence quenching, the energy from R 6 G is transferred to S F A u N P s through a non-radiative decay process. The absence of fluorescence background makes Raman peaks more prominent. However, when the fluorophore is kept at a few nm from the surface of the nanoparticle, due to the surfactant (DF) that acts as a spacer, the fluorescence is not expected to quench [33].
This is exactly what we see in the S E R S spectra of R 6 G on D F A u N P s (blue curve, Figure 5). In this case, there is a clear presence of the fluorescence hump, but the Raman peaks of R 6 G are also visible on top of the fluorescent background. However, the intensity of the Raman peaks is relatively lower than that of S F A u N P s . This is possible only due to the fact that in the presence of the surfactant (DF), R 6 G molecules must settle slightly away from the surface of the A u N P s , and, therefore, experience lowered field enhancement. Nonetheless, the Raman peaks are clearly visible on the top of the fluorescent background in this case as well, which verifies the excellent S E R S enhancement capability of D F A u N P s , even with the excitation source that excited the fluorescence of R 6 G .

3.3. Catalytic Properties of S F A u N P s and D F A u N P s

Finally, the catalytic capability of both S F A u N P s and D F A u N P s is evaluated upon degradation of a toxic dye M B (blue color) into non-toxic and colorless leucomethylene blue ( L M B ) .  Figure 6 shows the reduction reaction (Figure 6a) of M B to L M B by N a B H 4 in the presence of catalysts (   S F A u N P s and D F A u N P s ) and a schematic of the catalytic process at the surfaces of D F A u N P (Figure 6b) and S F A u N P (Figure 6c). Fermi levels of both S F A u N P s and D F A u N P s are lowered, i.e., negatively shifted when donor   B H 4 ( B H 4 ions) and acceptor ( M B ) are adsorbed on their surfaces. This increases the potential difference between M N P s and   M B , which makes the reduction process of M B by B H 4 ions on the surfaces of both S F A u N P s and D F A u N P s easier and faster. In the case of S F A u N P s , the adsorption of donor and acceptor on the surface of the particle is easier and closer due to the absence of any surfactant on their surfaces. Consequently, the catalytic capability of S F A u N P s will be enhanced. To monitor the catalytic activity of   S F A u N P s , we put their suspension (50 µL) in a cuvette containing a solution of M B (2.7 µL) and N a B H 4 (300 µL) and monitor this reduction processes via UVVis absorption spectroscopy. The peak intensity of MB gradually decreases with the reaction time and completely decays within 3 min. Similarly, to study the degradation capability of D F A u N P s , we again add a 50 µL solution of D F A u N P s to a cuvette containing a solution of M B (2.7 mL) and N a B H 4 (300 µL) and monitor this degradation process with the help of U V V i s   absorption spectroscopy. In this case, the degradation is completed in 4 min, as depicted in Figure 7b. The degradation rate is calculated using ln(Ct/Co) where Co and Ct represent the absorbances at t = 0 and t = t, respectively. A good linear fit to the graph (Figure 7c) indicates that the reaction follows pseudo first-order kinetics. S F A u N P s and D F A u N P s play the role of the mediator in the transferring of electrons from donor   B H 4   to M B for the reduction process. In the cases of S F A u N P s and of D F A u N P s , the rate constants of catalytic degradation are 1.284 min−1 and 0.912 min−1, respectively. This is lower than the other reported degradation rates for surfactant-free and surfactant-coated nanoparticles [49]. The higher degradation rate constant of S F A u N P s compared to   D F A u N P s confirms the fact that the surfactant affects the catalytic properties of M N P s . The metallic surface reduces the bond dissociation energy ( B D E ) slightly more when both dye ( M B ) and B H 4 ions are adsorbed on its surface, which makes the transfer of electrons from donor to acceptor more efficient. Therefore, the catalysis by S F A u N P s is more efficient as compared with D F A u N P s . This is despite the fact that S F A u N P s have a bigger size compared with D F A u N P s , and it is well known that the catalytic activity of Au nanoparticles decreases with increasing particle size. Fenger et al. carried out a study of the comparative catalytic properties of CTAB-capped Au NPs of different sizes grown through the seeded method [50]. They reported that the apparent rate of reaction was 3 and 60 times larger when 13 nm NPs were compared with 28 nm and 56 nm Au NPs, respectively. This verifies that the faster catalytic activity of S F A u N P s compared to D F A u N P s is due to the absence of surfactant coating.
On the other hand, a higher degradation rate for D F A u N P s compared to other reported results of degradation of surfactant-coated A u N P s could be due to the relatively smaller size of the D F molecule. For example, the size of the bilayer of C T A B , which is commonly used as a stabilizer in the wet-chemical synthesis of gold nanoparticles, is about 4 nm [51], which is almost twice the size of the DF molecule [47].

4. Conclusions

Fast, efficient, cost-effective, pure, and eco-friendly synthesis of S F A u N P s   and   D F A u N P s was carried out using the plasma liquid interaction ( P L I ) technique. Different diagnostic techniques were utilized to monitor the morphology, structural, sensing, and catalytic abilities of the as synthesized gold nanoparticles. X-ray Diffractometery and E D X   analysis confirmed the purity of both SF- and DF-AuNPs. The   S E R S and catalytic capabilities of both SF- and DF-AuNPs were demonstrated. In particular, the S E R S -based trace detection of the rhodamine-6G ( R 6 G ) molecule and catalytic degradations of methylene blue ( M B ) were tested. This analysis confirms that both S F A u N P s are superior to D F A u N P s , both for catalysis and S E R S -based trace detection. A promising enhancement in the Raman signal of R 6 G was observed for both types of particles but Raman peaks were much more prominent due to the quenching of the fluorescence background signal of R 6 G for S F A u N P s . Moreover, S F A u N P s showed superior catalytic degradation capability, as compared to the D F A u N P s , due to their uncapped surfaces, which made the absorption of dye and reducing agent easier on their surface. Nonetheless, due to the non-toxicity, high stability, and smaller size of DF molecules, D F A u N P s   are excellent candidates for replacing A u N P s stabilized either with toxic or larger molecular surfactant, especially for sensing, catalytic, and biological applications.

Author Contributions

Conceptualization, N.U.R.; Data curation, H.M.Y.; Formal analysis, H.M.Y.; Funding acquisition, N.U.R.; Investigation, H.M.Y. and A.M.; Methodology, N.U.R.; Project administration, N.U.R.; Resources, N.U.R., A.M., M.A. and E.M.T.E.D.; Supervision, N.U.R.; Visualization, M.A. and E.M.T.E.D.; Validation, M.A. and E.M.T.E.D. Writing—review & editing, W.A. All authors have read and agreed to the published version of the manuscript.

Funding

This research was funded by Higher Education Commission Pakistan, grant number TDF-137.

Data Availability Statement

The data that support the findings of this study are available from the corresponding author upon reasonable request.

Acknowledgments

We acknowledge the Higher Education Commission of Pakistan for supporting this work via TDF project # 137 (Najeeb-ur-Rehman) and indigenous PhD fellowship for 5000 scholars (H. M. Yasin) and Potential Analytical System, office # 14, 1st floor National Business Centre Shams Abad Murree Road Rawalpindi-Pakistan.

Conflicts of Interest

The authors declare no conflict of interest.

References

  1. Bailly, A.-L.; Correard, F.; Popov, A.; Tselikov, G.; Chaspoul, F.; Appay, R.; Al-Kattan, A.; Kabashin, A.V.; Braguer, D.; Esteve, M.-A. In vivo evaluation of safety, biodistribution and pharmacokinetics of laser-synthesized gold nanoparticles. Sci. Rep. 2019, 9, 12890. [Google Scholar] [CrossRef] [Green Version]
  2. Wang, A.; Ng, H.P.; Xu, Y.; Li, Y.; Zheng, Y.; Yu, J.; Han, F.; Peng, F.; Fu, L. Gold nanoparticles: Synthesis, stability test, and application for the rice growth. J. Nanomater. 2014, 2014, 3. [Google Scholar] [CrossRef] [Green Version]
  3. Khan, H.I.; Khalid, M.U.; Abdullah, A.; Ali, A.; Bhatti, A.S. Facile synthesis of gold nanostars over a wide size range and their excellent surface enhanced Raman scattering and fluorescence quenching properties. J. Vac. Sci. Technol. B Nanotechnol. Microelectron. Mater. Process. Meas. Phenom. 2018, 36, 03E101. [Google Scholar] [CrossRef]
  4. Baba, T.; Lee, Y.; Ueno, A.; Kometani, R.; Maeda, E. Triple-walled gold surfaces with small-gaps for nonresonance surface enhanced Raman scattering of rhodamine 6G molecules. J. Vac. Sci. Technol. B Nanotechnol. Microelectron. Mater. Process. Meas. Phenom. 2016, 34, 011802. [Google Scholar] [CrossRef]
  5. León, E.R.; Rodríguez, E.L.; Beas, C.R.; Plascencia-Villa, G.; Palomares, R.A.I. Study of methylene blue degradation by gold nanoparticles synthesized within natural zeolites. J. Nanomater. 2016, 2016, 9541683. [Google Scholar] [CrossRef] [Green Version]
  6. Suvith, V.; Philip, D. Catalytic degradation of methylene blue using biosynthesized gold and silver nanoparticles. Spectrochim. Acta Part A Mol. Biomol. Spectrosc. 2014, 118, 526–532. [Google Scholar] [CrossRef]
  7. Tan, E.; Yin, P.; Lang, X.; Wang, X.; You, T.; Guo, L. Functionalized gold nanoparticles as nanosensor for sensitive and selective detection of silver ions and silver nanoparticles by surface-enhanced Raman scattering. Analyst 2012, 137, 3925–3928. [Google Scholar] [CrossRef]
  8. Hwang, J.S.; Yang, M. Sensitive and reproducible gold SERS sensor based on interference lithography and electrophoretic deposition. Sensors 2018, 18, 4076. [Google Scholar] [CrossRef] [Green Version]
  9. Park, H.; Lim, D.-J.; Vines, J.B.; Yoon, J.-H.; Ryu, N.-E. Gold nanoparticles for photothermal cancer therapy. Front. Chem. 2019, 7, 167. [Google Scholar]
  10. Calavia, P.G.; Bruce, G.; Pérez-García, L.; Russell, D.A. Photosensitiser-gold nanoparticle conjugates for photodynamic therapy of cancer. Photochem. Photobiol. Sci. 2018, 17, 1534–1552. [Google Scholar] [CrossRef] [Green Version]
  11. Kong, F.-Y.; Zhang, J.-W.; Li, R.-F.; Wang, Z.-X.; Wang, W.-J.; Wang, W. Unique roles of gold nanoparticles in drug delivery, targeting and imaging applications. Molecules 2017, 22, 1445. [Google Scholar] [CrossRef]
  12. Farooq, M.U.; Novosad, V.; Rozhkova, E.A.; Wali, H.; Ali, A.; Fateh, A.A.; Neogi, P.B.; Neogi, A.; Wang, Z. Gold nanoparticles-enabled efficient dual delivery of anticancer therapeutics to HeLa cells. Sci. Rep. 2018, 8, 2907. [Google Scholar] [CrossRef] [PubMed] [Green Version]
  13. Song, J.; Wang, L.; Zibart, A.; Koch, C. Corrosion protection of electrically conductive surfaces. Metals 2012, 2, 450–477. [Google Scholar] [CrossRef] [Green Version]
  14. Yamaguchi, M.; Miyagi, N.; Mita, M.; Yamasaki, K.; Maekawa, K. On-demand gold laser-plating onto stainless steel for electrical contacts. In Proceedings of the 2016 International Conference on Electronics Packaging (ICEP), Hokkaido, Japan, 20–22 April 2016; pp. 323–328. [Google Scholar]
  15. Kim, M.; Lee, J.H.; Nam, J.M. Plasmonic Photothermal Nanoparticles for Biomedical Applications. Adv. Sci. 2019, 6, 1900471. [Google Scholar] [CrossRef] [PubMed] [Green Version]
  16. Hainfeld, J.F.; O’Connor, M.J.; Lin, P.; Qian, L.; Slatkin, D.N.; Smilowitz, H.M. Infrared-transparent gold nanoparticles converted by tumors to infrared absorbers cure tumors in mice by photothermal therapy. PLoS ONE 2014, 9, e88414. [Google Scholar] [CrossRef] [Green Version]
  17. Norman, T.J.; Grant, C.D.; Magana, D.; Zhang, J.Z.; Liu, J.; Cao, D.; Bridges, F.; Van Buuren, A. Near infrared optical absorption of gold nanoparticle aggregates. J. Phys. Chem. B 2002, 106, 7005–7012. [Google Scholar] [CrossRef]
  18. Elbert, K.C.; Lee, J.D.; Wu, Y.; Murray, C.B. Improved chemical and colloidal stability of gold nanoparticles through dendron capping. Langmuir 2018, 34, 13333–13338. [Google Scholar] [CrossRef]
  19. Shah, M.; Badwaik, V.; Kherde, Y.; Waghwani, H.K.; Modi, T.; Aguilar, Z.P.; Rodgers, H.; Hamilton, W.; Marutharaj, T.; Webb, C. Gold nanoparticles: Various methods of synthesis and antibacterial applications. Front. Biosci. 2014, 19, 1320–1344. [Google Scholar] [CrossRef] [Green Version]
  20. Song, J.Y.; Kim, B.S. Rapid biological synthesis of silver nanoparticles using plant leaf extracts. Bioprocess Biosyst. Eng. 2009, 32, 79. [Google Scholar] [CrossRef]
  21. Verma, H.N.; Singh, P.; Chavan, R. Gold nanoparticle: Synthesis and characterization. Vet. World 2014, 7, 72. [Google Scholar] [CrossRef] [Green Version]
  22. Jeevanandam, J.; Chan, Y.S.; Danquah, M.K. Biosynthesis of metal and metal oxide nanoparticles. ChemBioEng Rev. 2016, 3, 55–67. [Google Scholar] [CrossRef]
  23. Jamkhande, P.G.; Ghule, N.W.; Bamer, A.H.; Kalaskar, M.G. Metal nanoparticles synthesis: An overview on methods of preparation, advantages and disadvantages, and applications. J. Drug Deliv. Sci. Technol. 2019, 53, 101174. [Google Scholar] [CrossRef]
  24. Parveen, K.; Banse, V.; Ledwani, L. Green synthesis of nanoparticles: Their advantages and disadvantages. AIP Conf. Proc. 2016, 1724, 020048. [Google Scholar]
  25. Vigderman, L.; Zubarev, E.R. High-yield synthesis of gold nanorods with longitudinal SPR peak greater than 1200 nm using hydroquinone as a reducing agent. Chem. Mater. 2013, 25, 1450–1457. [Google Scholar] [CrossRef]
  26. Patel, J.; Němcová, L.; Maguire, P.; Graham, W.; Mariotti, D. Synthesis of surfactant-free electrostatically stabilized gold nanoparticles by plasma-induced liquid chemistry. Nanotechnology 2013, 24, 245604. [Google Scholar] [CrossRef] [Green Version]
  27. Selvaraj, T.; Thirunavukkarasu, A.; Rathnavelu, S.M.; Kasivelu, G. In Vivo Non-toxicity of Gold Nanoparticles on Wistar Rats. J. Clust. Sci. 2019, 30, 513–519. [Google Scholar] [CrossRef]
  28. Pastoriza-Santos, I.; Pérez-Juste, J.; Liz-Marzán, L.M. Silica-coating and hydrophobation of CTAB-stabilized gold nanorods. Chem. Mater. 2006, 18, 2465–2467. [Google Scholar] [CrossRef]
  29. Morais, T.; Soares, M.E.; Duarte, J.A.; Soares, L.; Maia, S.; Gomes, P.; Pereira, E.; Fraga, S.; Carmo, H.; de Lourdes Bastos, M. Effect of surface coating on the biodistribution profile of gold nanoparticles in the rat. Eur. J. Pharm. Biopharm. 2012, 80, 185–193. [Google Scholar] [CrossRef] [Green Version]
  30. Khatoon, N.; Yasin, H.; Younus, M.; Ahmed, W.; Rehman, N.; Zakaullah, M.; Iqbal, M.Z. Synthesis and spectroscopic characterization of gold nanoparticles via plasma-liquid interaction technique. AIP Adv. 2018, 8, 015130. [Google Scholar] [CrossRef]
  31. Seoudi, R.; Said, D.A. Studies on the effect of the capping materials on the spherical gold nanoparticles catalytic activity. World J. Nano Sci. Eng. 2011, 1, 51. [Google Scholar] [CrossRef] [Green Version]
  32. Soliman, M.G.; Pelaz, B.; Parak, W.J.; Del Pino, P. Phase transfer and polymer coating methods toward improving the stability of metallic nanoparticles for biological applications. Chem. Mater. 2015, 27, 990–997. [Google Scholar] [CrossRef] [Green Version]
  33. Qi, G.; Jia, K.; Fu, C.; Xu, S.; Xu, W. A highly sensitive SERS sensor for quantitative analysis of glucose based on the chemical etching of silver nanoparticles. J. Opt. 2015, 17, 114020. [Google Scholar] [CrossRef]
  34. Bruggeman, P.; Ribežl, E.; Maslani, A.; Degroote, J.; Malesevic, A.; Rego, R.; Vierendeels, J.; Leys, C. Characteristics of atmospheric pressure air discharges with a liquid cathode and a metal anode. Plasma Sources Sci. Technol. 2008, 17, 025012. [Google Scholar] [CrossRef]
  35. Scholl, J.A.; Koh, A.L.; Dionne, J.A. Quantum plasmon resonances of individual metallic nanoparticles. Nature 2012, 483, 421. [Google Scholar] [CrossRef] [PubMed]
  36. Wang, R.; Zuo, S.; Wu, D.; Zhang, J.; Zhu, W.; Becker, K.H.; Fang, J. Microplasma-assisted synthesis of colloidal gold nanoparticles and their use in the detection of cardiac troponin I (cTn-I). Plasma Process. Polym. 2015, 12, 380–391. [Google Scholar] [CrossRef]
  37. Li, X.; Lin, L.; Chiang, W.-H.; Chang, K.; Xu, H. Microplasma synthesized gold nanoparticles for surface enhanced Raman spectroscopic detection of methylene blue. React. Chem. Eng. 2022, 7, 346–353. [Google Scholar] [CrossRef]
  38. Yang, C.; Yu, Y.; Xie, Y.; Zhang, D.; Zeng, P.; Dong, Y.; Yang, B.; Liang, R.; Ou, Q.; Zhang, S. One-step synthesis of size-tunable gold nanoparticles/reduced graphene oxide nanocomposites using argon plasma and their applications in sensing and catalysis. Appl. Surf. Sci. 2019, 473, 83–90. [Google Scholar] [CrossRef]
  39. Liu, T.; Yang, F.; Li, Y.; Ren, L.; Zhang, L.; Xu, K.; Wang, X.; Xu, C.; Gao, J. Plasma synthesis of carbon nanotube-gold nanohybrids: Efficient catalysts for green oxidation of silanes in water. J. Mater. Chem. A 2014, 2, 245–250. [Google Scholar] [CrossRef]
  40. Nguyen, L.N.; Kaushik, N.; Lamichhane, P.; Mumtaz, S.; Paneru, R.; Bhartiya, P.; Kwon, J.S.; Mishra, Y.K.; Nguyen, L.Q.; Kaushik, N.K. In situ plasma-assisted synthesis of polydopamine-functionalized gold nanoparticles for biomedical applications. Green Chem. 2020, 22, 6588–6599. [Google Scholar] [CrossRef]
  41. Yasin, H.; Ahmed, W.; Ali, A.; Bhatti, A.; Rehman, N. Micro-plasma assisted synthesis of multifunctional D-fructose coated silver nanoparticles. Mater. Res. Express 2019, 6, 1050a2. [Google Scholar] [CrossRef]
  42. Hieda, J.; Saito, N.; Takai, O. Exotic shapes of gold nanoparticles synthesized using plasma in aqueous solution. J. Vac. Sci. Technol. A Vac. Surf. Film. 2008, 26, 854–856. [Google Scholar] [CrossRef] [Green Version]
  43. Mironov, I.; Makotchenko, E. The Hydrolysis of AuCl 4− and the Stability of Aquachlorohydroxocomplexes of Gold (III) in Aqueous Solution. J. Solut. Chem. 2009, 38, 725–737. [Google Scholar] [CrossRef]
  44. Akolkar, R.; Sankaran, R.M. Charge transfer processes at the interface between plasmas and liquids. J. Vac. Sci. Technol. A Vac. Surf. Film. 2013, 31, 050811. [Google Scholar] [CrossRef]
  45. Chen, Q.; Li, J.; Li, Y. A review of plasma–liquid interactions for nanomaterial synthesis. J. Phys. D Appl. Phys. 2015, 48, 424005. [Google Scholar] [CrossRef] [Green Version]
  46. Kooij, E.S.; Ahmed, W.; Zandvliet, H.J.; Poelsema, B. Localized plasmons in noble metal nanospheroids. J. Phys. Chem. C 2011, 115, 10321–10332. [Google Scholar] [CrossRef]
  47. Kelly, K.L.; Coronado, E.; Zhao, L.L.; Schatz, G.C. The optical properties of metal nanoparticles: The influence of size, shape, and dielectric environment. J. Phys. Chem. B 2003, 107, 668–677. [Google Scholar] [CrossRef]
  48. Pastoriza-Santos, I.; Liz-Marzán, L.M. Colloidal silver nanoplates. State of the art and future challenges. J. Mater. Chem. 2008, 18, 1724–1737. [Google Scholar] [CrossRef]
  49. McFarland, A.D.; Van Duyne, R.P. Single silver nanoparticles as real-time optical sensors with zeptomole sensitivity. Nano Lett. 2003, 3, 1057–1062. [Google Scholar] [CrossRef] [Green Version]
  50. Fenger, R.; Fertitta, E.; Kirmse, H.; Thünemann, A.F.; Rademann, K. Size dependent catalysis with CTAB-stabilized gold nanoparticles. Phys. Chem. Chem. Phys. 2012, 14, 9343–9349. [Google Scholar] [CrossRef]
  51. Silva, J.A.d.; Dias, R.P.; da Hora, G.C.; Soares, T.A.; Meneghetti, M.R. Molecular dynamics simulations of cetyltrimethylammonium bromide (CTAB) micelles and their interactions with a gold surface in aqueous solution. J. Braz. Chem. Soc. 2018, 29, 191–199. [Google Scholar] [CrossRef]
Figure 1. Schematic diagram of plasma–liquid interactions system employed to synthesize SF-AuNPs and DF-AuNPs [41].
Materials 15 07579 g001
Figure 2. (a) UV-Vis absorption spectra of S F A u N P s and   D F A u N P s ; (b) Photos of S F A u N P s and   D F A u N P s .
Materials 15 07579 g002
Figure 3. SEM images of (a) DF-AuNPs, (b) SF-AuNPs and EDX, (c) DF-AuNPs, (d) SF-AuNPs.
Materials 15 07579 g003
Figure 4. (a) XRD spectra of Au-file number 04-0784, SF-AuNPs, DF-AuNPs, (b) FTIR absorption spectra of DF and DF-AuNPs.
Materials 15 07579 g004
Figure 5. SRES spectra: black (R6G only), blue (R6G on DF-AuNPs), red (R6G on SF-AuNPs), pink (DF-AuNPs), and green line (SF-AuNPs).
Materials 15 07579 g005
Figure 6. (a) reduction reaction of MB by SF-AuNPs/DF-AuNPs, and Schematic of catalytic process on (b) DF-AuNP, (c) SF-AuNP. E(electrophile, MB), N(nucleophile, B H 4 ions).
Materials 15 07579 g006
Figure 7. Catalytic degradation of MB by (a) SF-AuNPs, (b) DF-AuNPs, and (c) degradation rates.
Materials 15 07579 g007
Publisher’s Note: MDPI stays neutral with regard to jurisdictional claims in published maps and institutional affiliations.

