1. Introduction
Digital financial services have transformed how individuals conduct payments, manage savings, and participate in investment activities by expanding access to real-time and digitally mediated financial services (
Akhisar et al., 2015;
Arner et al., 2015). Previous research has associated digital financial adoption with financial and digital literacy, access to formal financial services, and emerging AI-related capabilities (
U. Gupta et al., 2025;
Hermawan et al., 2022;
Kadim et al., 2024). These studies support the expectation that individuals possessing stronger financial knowledge, digital competencies, and access to appropriate services may be more inclined to adopt digital financial technologies. Nevertheless, the applicability of this capability-based expectation under conditions of severe institutional and economic instability remains less established.
Financial and technological capabilities may not translate consistently into adoption when individuals face institutional distrust, economic uncertainty, or concerns regarding financial-system stability. Previous studies have identified technology acceptance, trust in the banking system, and confidence in individual capabilities as relevant considerations in digital financial participation (
Deák & Horváth, 2026;
Oli & Lowar, 2026;
Rohaeni et al., 2026). Although recent research has examined fintech and cryptocurrency adoption during Lebanon’s financial crisis (
Aoun et al., 2026a,
2026b;
El-Chaarani et al., 2025), less attention has been devoted to whether capability-based relationships remain observable when confidence in the financial system has been severely disrupted. This question is particularly relevant in Lebanon, where the post-2019 banking and financial crisis has affected access to and confidence in formal financial services (
Mawad & Freiha, 2024;
Mawad & Makki, 2023).
The present study addresses a more fundamental question than simply identifying the determinants of digital financial adoption. Existing research generally assumes that financial and technological capabilities translate into adoption intentions through improved financial behaviour. However, this assumption has rarely been examined in contexts where trust in the financial system has been severely disrupted. Lebanon’s post-crisis environment offers a unique opportunity to test whether capability-based explanations remain valid when individuals operate within a fragile and uncertain financial system. Accordingly, this study investigates whether Perceived Digital Financial Literacy (DFL), Perceived AI Literacy (AIL), and Financial Inclusion (FI) are associated with Digital Financial Adoption Orientation (DFAO), while examining the role of Financial Behaviour (FB) as the proposed conversion mechanism between capability and adoption.
Lebanon provides a particularly interesting setting for this research. Since 2019, the country has experienced a severe banking, financial, and economic crisis that has significantly affected trust in financial institutions and access to financial services. Despite the expansion of digital financial services and fintech solutions, individuals continue to face uncertainty regarding banking stability and financial decision-making (
Mawad & Makki, 2023). This unique environment offers an opportunity to understand how financial capabilities and behaviours influence digital financial adoption under conditions of economic instability and mistrust (
Aoun et al., 2026a,
2026b;
El-Chaarani et al., 2025). Consequently, Lebanon provides a natural setting for examining whether the traditional capability → behaviour → adoption pathway remains observable in a fragile post-crisis financial environment.
The contribution of this study extends beyond identifying drivers of digital financial adoption. Rather, it examines the conditions under which capability-based explanations may fail. While prior studies have generally reported positive relationships between financial literacy, digital competencies, financial behaviour, and technology adoption, less attention has been devoted to situations where these capabilities do not translate into adoption intentions. By focusing on a fragile post-crisis economy, this study contributes to the emerging literature on digital finance under institutional instability and examines whether capability-based explanations of digital financial adoption remain observable under conditions of institutional fragility.
Although previous research has extensively examined financial literacy, fintech adoption, and financial inclusion, most studies implicitly assume that increasing individual capabilities will eventually lead to greater adoption of digital financial services. Limited evidence exists regarding whether this assumption remains valid in environments characterized by financial collapse, institutional uncertainty, and low trust. Consequently, the present study focuses not only on identifying significant predictors of adoption but also on evaluating the validity of capability-based adoption models within a fragile economy.
Accordingly, this study aims to shed light on the following questions:
To what extent do capability-based factors (DFL, AIL, and FI) explain DFAO in a fragile post-crisis economy?
Does FB act as the mechanism through which financial and digital capabilities translate into adoption intentions in a fragile post-crisis economy?
Do fresh USD account ownership and bank stability concerns moderate the relationships of FI and FB with DFAO?
To answer these questions, the study adopted a quantitative research design using a structured questionnaire distributed through digital platforms. A total of 164 valid responses were collected from Lebanese participants. The proposed conceptual model was tested using Partial Least Squares Structural Equation Modelling (PLS-SEM) using Smart PLS 4, with the measurement and structural models assessed according to established reliability, validity, explanatory power, predictive relevance, and significance criteria.
The results offer preliminary practical considerations rather than policy prescriptions. The positive relationship between FI and FB suggests that access to financial services warrants further investigation alongside financial and digital capability initiatives.
The findings indicate that FI and AIL were associated with Financial Behaviour in the present sample, while their direct relationships with DFAO were not statistically supported. These findings provide directions for further research rather than evidence supporting specific policy interventions.
Rather than testing whether a capability–adoption gap exists as a general phenomenon, the study examines whether capability-based relationships commonly observed in prior research remain observable in a fragile post-crisis context.
The remainder of this paper is organized as follows. The next section presents the literature review and theoretical framework, followed by the research methodology and conceptual model. The empirical results are then presented and discussed. Finally, the paper concludes with the main findings, implications, limitations, and recommendations for future research.
2. Literature Review
This research examines the drivers of digital financial adoption in a fragile economy through a capability–behaviour–intention framework. Perceived Digital Financial Literacy (DFL) and Perceived AI Literacy (AIL) represent individual knowledge- and skill-related capabilities, while Financial Inclusion (FI) represents access to and participation in formal financial services. Financial Behaviour (FB) is examined as a potential mediating mechanism linking these capability-related factors to Digital Financial Adoption Orientation (DFAO). The framework is informed by capability-based reasoning and behavioural theory while incorporating Fresh USD account ownership and Bank Stability Concerns as contextual characteristics of Lebanon’s post-crisis financial environment.
2.1. Theoretical Framework
The theoretical framework draws on three complementary perspectives with distinct roles: capability-based reasoning as an organizing perspective for individual capabilities and enabling resources, the Theory of Planned Behaviour (TPB) as a supporting behavioural perspective on intention, and mistrust in the financial system as a contextual lens for understanding financial decision-making under institutional fragility. The study does not constitute a direct empirical test of CBV, TPB, or institutional trust as complete theoretical models.
The Capability-Based View originated primarily at the organisational level, emphasizing how firms develop, deploy, and leverage resources and capabilities to adapt to changing environments (
Münter, 2025). Its original level of analysis is therefore different from the individual-level focus of the present study. Rather than transferring organisational CBV directly to individuals, this study draws on its broader capability logic together with individual financial-capability research.
The individual-level literature provides a more direct basis for defining the capability-related constructs examined here.
Kumar et al. (
2023b) connect skills, digital financial literacy, capability, and autonomy with financial decision-making and well-being, demonstrating that financial outcomes depend on more than access to resources alone.
Parvathy and Kumar (
2022) further identify decision-making ability as a mechanism connecting financial capability with financial well-being.
Kumar et al. (
2023a), meanwhile, show that financial decision-making is shaped jointly by behavioural, psychological, and demographic determinants. Collectively, this literature supports distinguishing individual knowledge and skills from the behavioural processes through which they may affect financial outcomes. In the present framework, DFL and AIL represent perceived knowledge- and skill-related capabilities, FI represents access to and participation in formal financial services, and FB represents the proposed behavioural mechanism connecting these capability-related factors with DFAO. However, these studies focus mainly on financial decision-making and well-being rather than on whether such capabilities translate into digital financial adoption under institutional fragility.
The Theory of Planned Behaviour (TPB) explains behavioural intention through attitude, subjective norms, and perceived behavioural control (
Ajzen, 1991). Its relevance to financial decisions is illustrated by
She et al. (
2024), who apply TPB to financial behaviour among working adults, and
Raina et al. (
2026), who examine how financial literacy and subjective norms shape investment behaviour. These studies demonstrate the relevance of behavioural and normative mechanisms to financial decisions. Nevertheless, the present study does not measure attitude, subjective norms, or perceived behavioural control and therefore does not test TPB directly. TPB is used only as a supporting perspective for distinguishing existing financial behaviour from orientation towards future digital financial participation.
The lack of trust in institutions and the financial system literature provides a different and more contextual explanation.
Maduku (
2016) demonstrates the relevance of institutional trust to internet-banking acceptance, directly connecting confidence in institutions with the adoption of a digital financial service.
Putera (
2020) similarly conceptualizes trust as a foundational element of banking activity. These studies suggest that individual capabilities may operate within an institutional environment that can either support or constrain financial participation. This perspective is particularly relevant to Lebanon’s post-2019 banking and financial crisis (
Freiha et al., 2026;
Mawad & Freiha, 2024). However, mistrust is not measured as a latent construct in the present study. Bank Stability Concerns (C10) capture a specific concern regarding banking stability, while Fresh USD account ownership (C11) indicates formal banking participation. Neither variable should be interpreted as a comprehensive measure of institutional trust. Accordingly, the measure is used as a contextual lens rather than as an empirically tested construct.
Taken together, these perspectives perform distinct but complementary roles in the present framework. CBV identifies the individual capabilities and resources that may enable digital financial participation, represented here by DFL, AIL, and FI. The behavioural perspective provides the link between such capabilities, individuals’ financial practices, and their intentions to engage with digital financial services.
Institutional trust provides a contextual lens through which the capability-to-adoption process may be interpreted s. In a stable financial environment, greater capabilities and more disciplined financial behaviour would typically be expected to facilitate adoption intentions. The present study examines whether these expected relationships remain observable in a fragile post-crisis financial environment. The framework therefore tests not only whether capabilities predict adoption intentions, but also whether their expected conversion through financial behaviour remains observable under conditions of institutional instability.
This separation between empirically measured relationships and broader contextual interpretation follows the cautious institutional approach illustrated by
Benhayoun (
2026), in which institutional theory informs the interpretation of the research setting without extending empirical conclusions beyond the variables directly examined.
2.2. Digital Financial Adoption Determinant
The adoption of digital financial services such as online payments, or using digital services for investments is influenced by a combination of technological, social, and economic factors. This research assumes perceived digital financial literacy (DFL), Perceived AI Literacy (AIL) & financial inclusion (FI) to be the main factors influencing Digital Financial Adoption Orientation (DFAO).
The digital financial system and e-finance is said to provide consumers with unparalleled access to financial resources, improved transactional efficiency, lower operational costs, and personalized financial experiences by delivering real-time, secure, and accessible financial operations across geographic and temporal borders (
Akhisar et al., 2015). Real-time transaction processing, universal accessibility, data-driven customization, improved security standards, and the convergence of various financial services through linked digital platforms are the most notable characteristics of e-finance (
S. Gupta & Yadav, 2017), and it is becoming highly widespread among households, lenders, and investors (
Balyuk et al., 2026).
Nevertheless, despite substantial expansion and investment in digital financial services, approximately 1.4 billion adults worldwide remain excluded from the formal financial system. A disproportionate share of these individuals belongs to vulnerable groups, including women, people living in poverty, and those with lower levels of education (
Demirgüç-Kunt et al., 2022). Digital financial services have contributed to the inclusion of marginalised populations in the formal financial sector, particularly during the COVID-19 pandemic and, in Lebanon, following the banking and financial crisis (
Nassreddine, 2025). However, willingness to adopt fintech services may remain constrained by limited technology acceptance (
Oli & Lowar, 2026), distrust in the banking system (
Deák & Horváth, 2026), and limited confidence in individuals’ own capabilities (
Rohaeni et al., 2026).
In a country with a failed banking system such as Lebanon (
Mawad & Freiha, 2024), research is scarce regarding the use and adoption of financial technology whether in savings borrowing, or investment. Research was conducted on the adoption of cryptocurrency during the financial collapse (
Aoun et al., 2026a,
2026b;
El-Chaarani et al., 2025).
Aoun et al. (
2026a) and
El-Chaarani et al. (
2025) show that financial conduct and fintech adoption, is more heavily impacted by psychological assessments and attitudinal mechanisms in situations characterized by instability, currency devaluation, and weaker banking institutions than in stable nations.
The outcome construct in this study is conceptualized as Digital Financial Adoption Orientation (DFAO), representing respondents’ overall disposition toward engaging with consumer digital financial services across two salient applications: online payments and online investment. The construct is intentionally broader than a narrowly defined behavioural-intention measure. Its five indicators capture perceived usefulness of online payments, perceived safety, intention to increase online payments, intention to engage in online investment, and conditional willingness to use digital financial platforms. The items were informed by the broader digital-finance perspectives discussed by
Arner et al. (
2015);
Demirguc-Kunt et al. (
2018). Accordingly, DFAO should be interpreted as a general orientation toward digital financial adoption rather than as a behaviour-specific measure of either payment intention or investment intention alone.
Online payments and online investments are acknowledged as distinct financial behaviours. They are combined in the present study because the research question concerns respondents’ broader orientation toward digitally mediated financial participation rather than the prediction of either behaviour independently. This specification does not imply that payment and investment decisions are interchangeable. Rather, they represent different manifestations of engagement with digital financial services. Empirically, the five indicators exhibited substantial loadings on the common construct (0.721–0.861), with satisfactory internal consistency and convergent validity (Cronbach’s α = 0.840, rho_A = 0.843, composite reliability = 0.888, AVE = 0.614). Nevertheless, the aggregated specification does not permit separate conclusions regarding the determinants of the orientation toward digital financial adoption.
2.2.1. Perceived Digital Financial Literacy: A Single-Construct Measure
Foundational research identifies financial literacy as a form of human capital associated with financial decision-making and behaviour (
Lusardi & Mitchell, 2014,
2023). More recent literature extends this relationship to digital financial settings.
Ban et al. (
2024) examine the relationship between DFL and digital financial behaviour in an emerging economy, while
Jose and Ghosh (
2024) systematically review the evidence linking DFL with financial behaviour and identify relevant behavioural and socioeconomic mechanisms. Evidence from Indonesia further associates DFL with saving and spending behaviour in an emerging-market context (
Kusumawardhani et al., 2025). Accordingly, the relationship between DFL and financial behaviour is not treated as an under-researched topic. The present study instead examines whether perceived DFL is associated with FB and DFAO within Lebanon’s specific post-crisis financial context.
Digital financial literacy was found to be a key determinant of digital financial adoption (
Kadim et al., 2024), in contrast to previous studies (
Andreou & Anyfantaki, 2021;
T. Q. Long et al., 2023;
Mawad et al., 2022,
2025;
Yang et al., 2023) that mainly looked at financial literacy or digital literacy separately, this study incorporates both dimensions into one and its impact on digital financial adoption, similar to the work of
S. Khan et al. (
2025a). Previous results indicate that mobile money considerably decreased the intention to use unofficial savings channels while increasing the chance of savings and money transfers (
Apiors & Suzuki, 2018;
Ouma et al., 2017). Moreover, higher levels of digital financial literacy are linked to better financial decision-making and more peer to peer lending involvement, according to
S. Khan et al. (
2025a).
According to
Liew et al. (
2020)’s assessment of digital financial literacy in rural communities, there are notable deficiencies in areas like risk mitigation and consumer rights knowledge, and there is a modest level of proficiency in comprehending digital products. This suggests that underprivileged groups have not yet reaped the full benefits of fintech innovations.
In the present study, Digital Financial Literacy (DFL) is operationalized as perceived digital financial literacy, referring to respondents’ self-assessed knowledge and ability to perform tasks related to digital financial services. The items, informed by
Mishra et al. (
2024), ask respondents to evaluate their own ability to open and verify digital accounts, compare fees and limits, recognize scams, complete online identification procedures, secure financial applications, and resolve problems through digital channels. Because these indicators rely on self-assessment rather than objective knowledge tests, DFL in this study should be interpreted as perceived digital financial competence rather than objectively demonstrated digital financial literacy. The complete set of items is provided in the
Appendix A. Accordingly, the following hypothesis is proposed:
H1. DFL positively influences DFAO.
2.2.2. Perceived Artificial Intelligence Literacy as an Individual Capability
Despite the fact that many conceptual frameworks for AI literacy have surfaced in recent years, they all share a common understanding of the notion (
Laupichler et al., 2022): the understanding of its complexity, which incorporates not just technical expertise but also ethical considerations and practical skills, is a recurring theme. Digital financial literacy was found to be a key determinant.
In the present study, AI Literacy (AIL) is operationalized as perceived AI literacy, referring to respondents’ self-assessment of their understanding, confidence, judgment, and ability to use artificial intelligence technologies in financial contexts. Building on the conceptualizations of
D. Long and Magerko (
2020);
T. Q. Long et al. (
2023), the construct captures perceived preparedness to understand and interact with AI-powered financial tools. Because the indicators are self-reported, AIL represents perceived AI-related competence rather than objectively demonstrated AI knowledge or proficiency.
In developing economies, machine learning makes financial risk assessment easier (
Faisal et al., 2025), increasing the use of digital tools in financial decision-making. To wit, learning how to use AI tools, and machine learning, would ameliorate financial behaviour (
U. Gupta et al., 2025) and thus contribute to more adoption of digital financial services.
In the context of personal finance, AI literacy encompasses understanding how AI-generated recommendations are produced, confidence in using AI-enabled financial applications, the ability to assess whether AI suggestions are appropriate for one’s financial situation, awareness of data and privacy implications, the capacity to identify potential errors or biases in AI outputs, and the adoption of safe practices when sharing personal financial information. Accordingly, AI literacy in this study reflects individuals’ perceived preparedness to engage responsibly and effectively with AI-supported financial technologies (
Goel et al., 2023), rather than objectively tested AI proficiency.
The AIL indicators used in this study were conceptually informed by the AI-literacy frameworks proposed by
D. Long and Magerko (
2020);
Ng (
2012), and were adapted to the personal-finance context addressed in this research. The items were designed to capture respondents’ self-reported understanding, confidence, judgment, and safe use of AI-enabled financial tools. Prior to data collection, the questionnaire was reviewed by the research team to assess clarity, wording consistency, and contextual suitability for personal-finance applications. Accordingly, AIL is treated throughout this study as a perceived literacy construct rather than a direct measure of objectively demonstrated AI competence. The complete set of indicators is provided in the
Appendix A. Accordingly, the following hypothesis is proposed:
H2. AIL positively influences DFAO.
2.2.3. Financial Inclusion
Financial inclusion guarantees that individuals and businesses have sustainable and responsible access to affordable financial services and products, such as banking, credit, insurance, and payment systems (
World Bank, 2026). Financial inclusion lowers obstacles to accessing and using financial services and helps narrowing the economic gap (
Yanti, 2019).
Financial inclusion, including loans, insurance, and savings accounts, can enable households to make riskier but more strategic investments in their farms, companies, education, and even health (
Kass-Hanna et al., 2022).
Hermawan et al. (
2022) have found that the intention to adopt digital finance is significantly influenced by financial inclusion. To wit, the lack of financial inclusion, described by excessive transaction costs (
Kadim et al., 2024), and low income without government assistance (
Z. Khan et al., 2025b) leads to lower adoption rates of financial services.
Drawing on
Demirguc-Kunt et al. (
2018), financial inclusion in our context refers to the extent to which individuals can access, afford, use, and trust formal financial services that meet their financial needs. Financial inclusion, in this case, reflects an individual’s degree of participation in the formal financial system and their ability to confidently access and use financial services that support their economic and financial well-being. The questions set used can be reviewed in the
Appendix A. Accordingly, the following hypothesis is proposed:
H3. FI positively influences DFAO.
2.3. Financial Behaviour as a Mediator
To achieve financial security, stability, and long-term financial objectives, people should comprehend and control their financial behaviour. To effectively manage resources and achieve desired financial outcomes, it comprises developing techniques for making informed financial decisions and forming sustainable financial habits.
Healthy financial behaviour can be influenced by financial literacy, financial self-control (
Mawad et al., 2022), among other determinants. Financial behaviour as a construct evaluates whether a person creates a monthly personal budget, reviews it at the end of the month, plan it to achieve their financial goals, pay their bills and loan installments on time, save money each month, have an emergency fund, have a pension fund, and get credit when needed at the end of the month.
All aspects of digital financial literacy, digital knowledge, digital experience, digital skills, and digital awareness, have a favorable impact on financial behaviour, according to
Aryan et al. (
2024)’s research on millennials in Jordan.
Lyons and Kass-Hanna (
2021) claimed that digital budgeting tools help consumers understand their spending patterns, promote disciplined financial behaviour, and enable them to invest for the future and achieve their financial goals.
In addition, machine learning increases the use of digital tools in financial decision-making by simplifying financial risk assessment in developing economies (
Faisal et al., 2025). In other words, mastering machine learning and AI tools would improve financial behaviour (
U. Gupta et al., 2025).
Furthermore, financial inclusion promotes saving and investing, which helps to reduce poverty and empower people economically (
Ansar et al., 2025). Better money management and risk reduction are made possible by having access to savings accounts and credit facilities. When paired with financial literacy, financial inclusion improves people’s capacity to make prudent financial decisions by lowering hazards like excessive debt (
Jamali et al., 2026).
On the other hand, adoption of digital financial services is more likely when one practices sound financial practices like budgeting and saving. Additionally, those who have sound financial habits are more likely to look for resources that help them manage their money more effectively. This proactive strategy frequently results in the adoption of digital financial services that provide real-time transaction tracking, investing possibilities, and budgeting tools.
In this paper, financial behaviour refers to the actions and habits individuals adopt in managing their financial resources on a day-to-day basis. Financial behaviour represents the extent to which individuals engage in disciplined and proactive financial management practices that contribute to greater financial stability and informed financial decision-making. The financial behaviour construct is adapted from
Asaad (
2015);
Mawad (
2022).
Accordingly, the following hypotheses are proposed:
H4. DFL positively influences FB.
H5. AIL positively influences FB.
H6. FI positively influences FB.
H7. FB positively influences DFAO.
Which leads to the proposition of the mediation effect of FB between DFL, AIL, FI and DFAO
H8. FB mediates the relationship between DFL and DFAO.
H9. FB mediates the relationship between AIL and DFAO.
H10. FB mediates the relationship between FI and DFAO.
2.4. Contextual Variables as Moderators
Lebanon’s post-crisis financial environment provides the contextual basis for examining whether banking instability conditions digital financial adoption (
Cherqaoui, 2024;
Wehbe, 2026). Within this setting, Fresh USD account ownership (C11) is conceptualized as an indicator of renewed formal banking participation following the 2019 financial crisis. Holding such an account indicates that an individual has reopened or maintained a transactional relationship with a bank following the impairment of legacy USD accounts. Nevertheless, account ownership does not necessarily demonstrate restored institutional trust or comprehensive engagement with financial services. Individuals may maintain these accounts because of employment requirements or transactional necessity rather than voluntary confidence in Lebanese financial institutions. This structural re-engagement may condition how financial inclusion translates into digital financial adoption orientation. Individuals who have reopened a banking relationship may face fewer procedural or transactional barriers when engaging in digital payments or investments, compared to those entirely outside the formal system. Furthermore, fresh USD accounts ownership may influence how financial behaviour interacts with digital adoption. individuals who are financially disciplined but remain outside the banking system may lack the institutional channel necessary to act on their intentions. Conversely, those who have re-entered the system possess at least a minimal operational gateway for digital transactions, even if their engagement is constrained.
Second, Bank Stability Concerns (C10) represent perceived concerns regarding the stability of the banking system rather than a direct measure of institutional trust. Such concerns may weaken the relationships of FI and FB with DFAO in a fragile financial environment (
Sawaya et al., 2025). Even financially capable and disciplined individuals may hesitate to increase digital payments or online investments when confidence in banking institutions is weak. Accordingly, Bank Stability Concerns are hypothesised to negatively moderate the proposed relationships.
These contextual variables therefore serve to test whether the capability-to-adoption process varies according to respondents’ fresh USD account ownership and concerns about bank stability in Lebanon. The theoretical expectation is not that individual capability becomes irrelevant during a financial crisis, but that its translation into adoption intentions may depend on whether individuals retain an operational connection to the financial system and perceive that system as sufficiently stable. This distinction separates the individual capability layer of the model from the institutional conditions under which those capabilities are expected to produce behavioural and intentional outcomes.
Accordingly, the following hypotheses are proposed:
H11. Fresh USD (C11) moderates the relationship between FB and DFAO.
H12. Fresh USD (C11) moderates the relationship between FI and DFAO.
H13. Bank Stability Concerns (C10) moderate the relationship between FI and DFAO.
H14. Bank Stability Concerns (C10) moderate the relationship between FB and DFAO.
3. Methodology
3.1. Data Collection
Primary data were collected using a structured online questionnaire prepared in English. Data collection took place from mid-November 2025 to the end of January 2026. The study adhered strictly to the Declaration of Helsinki guidelines. Ethical clearance was granted by the USEK Human and Clinical Research Ethics Committee (HRPP/202610/FT/049). The questionnaire link was distributed through Facebook, LinkedIn, WhatsApp, email, and the university and professional mailing lists available through the three co-authors’ universities. A non-probability convenience and snowball sampling procedure was used. The researchers initially circulated the questionnaire through their academic, professional, and personal networks, and recipients were invited to forward the link to other eligible participants. No paid advertising was used. Eligible participants were required to be Lebanese, at least 18 years old, residing in Lebanon during the data-collection period, sufficiently proficient in English to complete the questionnaire, and willing to provide informed consent. Previous use of digital financial services was not required because the study sought to capture the views of both users and potential users of such services. Responses were excluded when participants were younger than 18 years, were not residing in Lebanon, did not provide informed consent, or submitted an incomplete questionnaire.
Because recruitment relied exclusively on digital communication channels, respondents were necessarily reachable through online platforms. However, access to these platforms should not be equated with high levels of digital financial literacy or AI literacy. The recruitment strategy may nevertheless have favored individuals who were more digitally connected and therefore may limit the representativeness of the sample.
The final dataset comprised 164 valid responses from the 192 responses initially received, after 28 incomplete or ineligible responses were excluded. Because the principal moderation hypotheses concern the incremental contribution of individual interaction terms, an interaction-focused sensitivity analysis was conducted using a fixed-model linear multiple-regression framework with R
2 increase. With N = 164, 10 predictors in the most complex DFAO equation, one tested interaction term, α = 0.05, and power of 0.80, the analysis indicated a minimum detectable effect of approximately f
2 = 0.049 (
Cohen, 2013;
Kock & Hadaya, 2018). This calculation represents an approximate sensitivity assessment and does not establish adequate power for smaller interaction or indirect effects. The moderation and mediation findings are therefore interpreted cautiously and require replication in a larger sample (
Faul et al., 2009).
The measurement items of each of the variables were derived and adapted from recent scholarly work in the field, the full list of indicators is provided in the
Appendix A.
For constructs measured through self-reported perceptions, including Perceived AI Literacy (AIL) and Perceived Digital Financial Literacy (DFL), item wording was adapted to reflect personal-finance applications relevant to the study context. The questionnaire was reviewed prior to administration to assess item clarity, consistency, and contextual appropriateness.
3.2. Conceptual Model
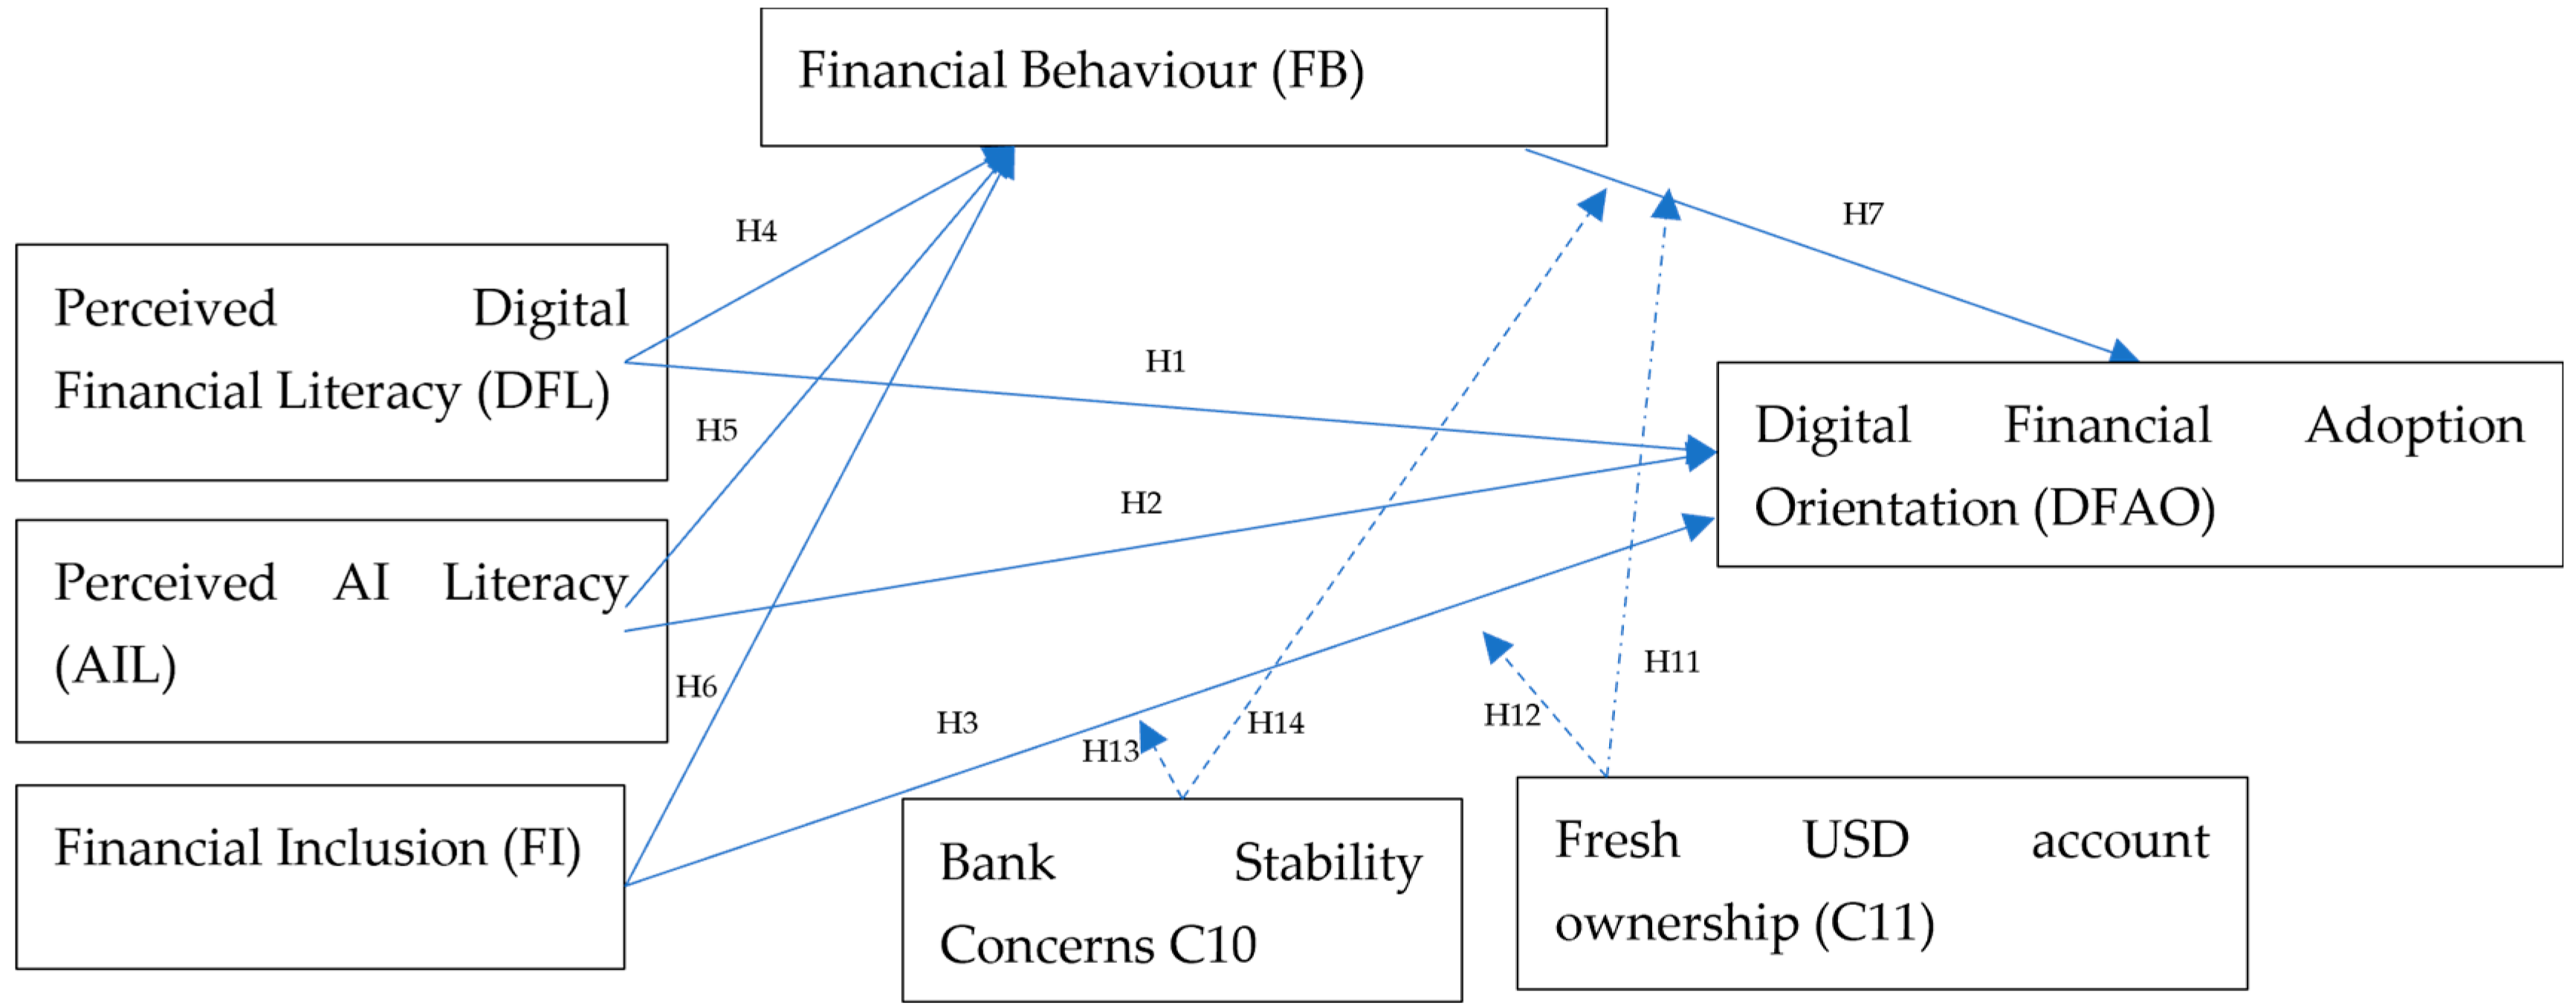
This study proposes a capability–behaviour–adoption framework to examine DFAO in a post-banking-crisis context. As illustrated in
Figure 1, the conceptual model positions DFL, AIL, and FI as primary capability-based antecedents of DFAO. These constructs reflect individuals’ self-perceived knowledge, skills, and abilities in navigating digital finance and AI-supported financial tools, whereas FI reflects access to and usability of financial services. DFL and AIL should therefore not be interpreted as objective assessments of respondents’ financial or AI knowledge.
However, capability-related factors may not necessarily translate directly into stronger digital financial adoption orientation. Accordingly, FB is conceptualized as a potential mediating variable linking DFL, AIL, and FI to DFAO. Individuals exhibiting stronger financial capabilities and access may also engage in more structured financial behaviours, such as budgeting, saving, comparing options, and planning, which may in turn be associated with a more favorable orientation toward digitally mediated financial services.
The model further incorporates contextual moderation mechanisms specific to Lebanon’s post-crisis banking landscape. Fresh USD account ownership (C11) as an indicator of renewed formal banking participation and Bank Stability Concerns (C10) representing the perceived systemic risk by individuals toward the Lebanese banking system.
C10 and C11 were modelled as observed contextual variables rather than reflective latent constructs. C10 is a single-item ordinal measure of respondents’ bank-stability concern, whereas C11 is a binary factual indicator of Fresh USD account ownership coded 0 = no and 1 = yes. Because C11 records an observable account-ownership status rather than an underlying psychological construct, a multi-item measurement scale is neither required nor conceptually appropriate. Its interaction terms test whether the FI–DFAO and FB–DFAO slopes differ between participants with and without a Fresh USD account.
The overall framework therefore consists of:
Direct effects of DFL, AIL, and FI on DFAO
Mediating effects through FB
Moderation effects of Fresh USD accounts ownership and Bank Stability Concerns
3.3. Research Design and Methodology
The PLS-SEM model was estimated in SmartPLS 4 using the default path weighting scheme (10
−7 stop criterion, 3000-iteration limit) after removing incomplete records in Excel to clean the initial 192 responses. Hypotheses were evaluated using a bootstrapping procedure with 10,000 subsamples and a two-tailed 5% significance level, following widely used PLS-SEM reporting conventions. The measurement model was evaluated first by examining indicator performance and construct validity, then discriminant validity was assessed using three complementary criteria: the Fornell–Larcker criterion, cross-loadings, and the HTMT ratio, interpreted against common thresholds following the work of
Fornell and Larcker (
1981);
Hair et al. (
2019);
Henseler et al. (
2015). Multicollinearity among indicators was also examined using VIF statistics recommended by
Hair et al. (
2019);
Kock and Hadaya (
2018).
Statistical inference for the structural model was based on bootstrapping with 10,000 bootstrap samples. Structural relationships were evaluated using path coefficients, t-statistics, p-values, and 95% bootstrap confidence intervals. Specific indirect effects were additionally assessed using bias-corrected 95% bootstrap confidence intervals. Non-significant estimates were interpreted as insufficient evidence to support the corresponding hypothesised relationships rather than as evidence of the absence of population effects. Bootstrapping was used to quantify sampling uncertainty and was not treated as compensating for limited statistical power or increasing the effective sample size.
For the structural model, endogenous construct explanatory power was reported using R
2, and predictor-specific impact was assessed using Cohen’s f
2 effect sizes following the recommendations from
Cohen (
2013);
Hair et al. (
2019). Predictive relevance was evaluated via a Q
2-style out-of-sample prediction assessment using cross-validated prediction error, a PLSpredict procedure was executed in SmartPLS 4 using a 10-fold cross-validation technique with 10 repetitions (
Hair et al., 2019).
4. Empirical Results
4.1. Descriptive Statistics
The final sample included 164 respondents. As presented in
Table 1, women represented 51.8% of the sample and men 48.2%. The largest age group was 35–44 years (32.3%), followed by 25–34 years (23.2%) and 45–54 years (20.7%). The sample was highly educated, with 73.8% reporting postgraduate education and 22.0% holding a bachelor’s degree. Most respondents were employed (70.1%), while 17.1% were self-employed, 10.4% were students, and 2.4% were unemployed. In addition, 73.8% reported holding a Fresh USD account.
The descriptive statistics in
Table 2 show that DFL (M = 3.282, SD = 1.069) and AIL (M = 3.023, SD = 1.023) were centered around the scale midpoint, with noticeable variation among respondents. FI (M = 3.443, SD = 0.902), FB (M = 3.502, SD = 1.008), and DFAO (M = 3.512, SD = 0.901) were moderately above the scale midpoint and also showed variation across the sample. These statistics describe each construct separately and do not imply statistically significant differences between constructs.
4.2. Measurement Model Assessment
The reliability and convergent validity results in
Table 3 demonstrate that all constructs satisfy the recommended measurement quality criteria. Cronbach’s alpha values ranged from 0.840 to 0.916, while composite reliability values ranged from 0.888 to 0.934, exceeding the recommended threshold of 0.70 (
Hair et al., 2019). These results indicate a high level of internal consistency among the indicators used to measure DFL, AIL, FI, FB, and DFAO.
Average Variance Extracted (AVE) values ranged from 0.614 to 0.704, exceeding the recommended threshold of 0.50 (
Fornell & Larcker, 1981;
Hair et al., 2019). This confirms that each construct explains more than half of the variance of its indicators. Outer loadings ranged between 0.718 and 0.874, indicating that all indicators contributed meaningfully to their respective constructs.
Taken together, the reliability and convergent-validity results support the measurement properties of the three capability-related constructs (DFL, AIL, and FI), the behavioural construct (FB), and Digital Financial Adoption Orientation (DFAO). However, satisfactory reliability and convergent validity should not be interpreted as establishing complete construct validity, particularly for perceived capability constructs such as DFL and AIL. For DFAO specifically, the five indicators produced loadings between 0.721 and 0.861, with Cronbach’s α = 0.840, rho_A = 0.843, composite reliability = 0.888, and AVE = 0.614. These results support empirical convergence of the indicators, although they do not imply that online payment and online investment constitute identical behaviours. The strong reliability and convergent validity results suggest that the proposed framework successfully captures different dimensions of financial capability and digital financial engagement.
Discriminant validity was assessed using cross-loadings and HTMT ratios, presented in
Table 4 and HTMT confidence intervals bias corrected in the
Appendix A Table A3. All indicators loaded highest on their intended constructs, and HTMT values ranged from 0.213 to 0.689, remaining well below recommended thresholds (
Henseler et al., 2009), the results demonstrate that the highest upper-bound value obtained among all latent construct pairs was 0.801, which remains strictly below the 0.85 criterion. Consequently, discriminant validity between all latent variables in the model is successfully established.
Collectively, these results indicate that DFL, AIL, FI, FB, and DFAO represent empirically distinct concepts. This distinction is particularly important for the conceptual model because it confirms that access to financial services, financial knowledge, AI-related competencies, and actual financial behaviours are separate yet related dimensions of digital financial adoption.
Fornell–Larcker results are presented in
Table A1 in the
Appendix A. The square root of AVE for each multi-item construct exceeded its correlations with all other constructs, satisfying the Fornell–Larcker criterion and supporting discriminant validity.
Table A2 in the
Appendix A presented the discriminant validity cross loadings, all indicators loaded most strongly on their assigned constructs (
Hair et al., 2019). Outer loadings ranged from 0.700 to 0.872, while the cross-loadings on alternative constructs were lower than the corresponding intended-construct loadings. These results support indicator reliability and discriminant validity at the indicator level.
Collinearity was examined using Variance Inflation Factor (VIF) values presented in
Table A3 and
Table A4 in the
Appendix A. Indicator-level VIF values ranged from 1.565 to 3.187, remaining below critical thresholds (
Hair et al., 2019). Therefore, multicollinearity does not appear to be a concern in the model. This finding suggests that the capability variables (DFL, AIL, and FI) contribute unique explanatory information rather than measuring overlapping phenomena. Outer-model VIF values did not indicate problematic indicator collinearity. However, structural VIF values reported in
Table A4 exceeded 5 for FB, FI, and C11 × FB in the DFAO equation. Potential structural collinearity therefore remains a limitation, and the corresponding coefficients should be interpreted cautiously.
4.3. Structural Model Assessment
The model explained 20.0% of the variance in FB (R
2 = 0.200; Adjusted R
2 = 0.185) and 25.1% of the variance in DFAO (R
2 = 0.251; Adjusted R
2 = 0.212), as shown in
Table 5. The R
2 values indicate modest explanatory power for the endogenous constructs. The results should therefore be interpreted as indicating modest explanatory and predictive relevance rather than strong predictive capability. Effect size analysis revealed that FI exerted the strongest influence within the model. For FB, FI produced the largest effect (f
2 = 0.073), followed by AIL (f
2 = 0.041) and DFL (f
2 = 0.006). Similarly, for DFAO, FI exhibited a contribution (f
2 = 0.073) however, its structural coefficient was not statistically significant.
Additional model-fit diagnostics generated in SmartPLS 4 are reported in
Table A7 in the
Appendix A. Additionally, the latent-variable prediction summary is reported in
Table A8, while the PLS-SEM prediction-error metrics are presented in
Table A9.
4.4. Model Results
Bootstrapping results were used to evaluate the proposed relationships, presented in
Table 6. First, the estimated direct relationships of DFL, AIL, and FI with DFAO were not statistically significant, and their bias-corrected 95% bootstrap confidence intervals included zero. Accordingly, the results provide insufficient evidence to support H1 to H3.
AIL was positively associated with FB (β = 0.245, p = 0.044, 95% BC CI [0.017, 0.490]), and FI was positively associated with FB (β = 0.332, p = 0.002, 95% BC CI [0.093, 0.524]), supporting H5 and H6. In contrast, H4 was not supported, as the estimated relationships between DFL and FB (β = −0.091, p = 0.424, 95% BC CI [−0.331, 0.125]) is insignificant.
The estimated relationship between FB and DFAO was not statistically significant (β = 0.396, p = 0.111, 95% BC CI [−0.160, 0.801]), providing insufficient evidence for H7.
Importantly, these non-significant estimates indicate insufficient evidence to support the corresponding hypotheses and should not be interpreted as demonstrating the absence of population effects. Given the sample size and sensitivity analysis results, smaller direct, indirect, and interaction effects may have remained undetected.
Similarly, as seen in
Table 7, the specific indirect effects of DFL through FB, (β = −0.036,
p = 0.523, 95% BC CI [−0.218, 0.029]), AIL through FB (β = 0.097,
p = 0.252, 95% BC CI [−0.014, 0.329]), and FI through FB (β = 0.132,
p = 0.160, 95% BC CI [−0.025, 0.339]) were not statistically significant. All three bias-corrected confidence intervals included zero. Accordingly, H8, H9, and H10 were not supported.
The model further proposed that fresh USD account ownership and bank stability concerns would condition the effects of FI and FB on DFAO. Fresh USD account ownership was associated with a statistically significant change in the FI and DFAO (β = 0.494, p = 0.034, 95% BC CI [0.071, 0.980]), supporting H12, however, given the sample size and exploratory interaction analysis, this estimate should be considered preliminary and requires independent replication. In contrast, the interaction between fresh USD account ownership and FB was not statistically significant (β = −0.461, p = 0.081, 95% BC CI [−0.920, 0.109]), providing insufficient evidence for H11. Similarly, bank stability concerns did not significantly moderate the FI–DFAO relationship (β = −0.157, p = 0.099, 95% BC CI [−0.375, 0.007]) or the FB–DFAO relationship (β = −0.019, p = 0.851, 95% BC CI [−0.226, 0.163]), providing insufficient evidence for H13 and H14.
5. Discussion
The descriptive statistics findings suggest that respondents generally reported moderate levels of financial capability and relatively favorable orientation toward digital financial adoption. The comparatively high level of financial inclusion indicates that many participants maintained some degree of engagement with formal financial services despite the challenging economic environment. Conversely, the lower perceived AI literacy score indicates comparatively lower self-perceived AI-related competence among respondents and should not be interpreted as evidence of objectively lower AI proficiency.
On the other hand, the results indicate persistent concerns regarding the stability of the banking sector. This finding is consistent with the Lebanese post-crisis financial context and supports the inclusion of bank stability concerns as a contextual variable.
The fresh USD account ownership distribution, suggests that most participants had re-established at least a minimal operational relationship with the formal banking system following the 2019 financial crisis. However, as argued in the conceptual framework, such ownership does not necessarily imply restored confidence in banks but may instead reflect transactional necessity.
The structural model provided mixed support for the hypothesised relationships. AIL was positively associated with FB, and FI was positively associated with FB. By contrast, the estimated direct relationships of DFL, AIL, and FI with DFAO were not statistically significant, and the relationship between DFL and FB was also unsupported. This pattern may indicate that capability-based explanations of digital financial adoption do not operate uniformly across contexts; however, the evidence remains inconclusive. Accordingly, the possibility of a capability–adoption gap is presented only as a tentative interpretation of the findings requiring direct examination and replication in future research.
Bank stability concerns did not significantly moderate either the FI–DFAO or the FB–DFAO relationship. The results therefore provide insufficient evidence to support H13 and H14. Moreover, the present analysis cannot determine why these interaction effects were not statistically significant.
Several alternative explanations should therefore be considered. First, the sensitivity analysis indicates that the sample was sensitive to interaction effects of approximately f2 = 0.049 under the specified regression assumptions; however, smaller direct, indirect, and interaction effects may not have been detectable in the present sample. Second, the online convenience and snowball sampling procedure may have introduced digital-selection and self-selection bias, particularly given the high educational profile of the sample. This potential bias relates primarily to digital access and engagement rather than to digital financial literacy or AI literacy themselves. Third, DFL and AIL were measured as self-perceived capabilities rather than through objective knowledge assessments, making the estimates potentially susceptible to self-report and measurement error. Fourth, DFAO combines payment- and investment-related orientations within a broad construct, which may have obscured relationships that differ across these behaviours. Finally, the estimated model-fit diagnostics and elevated structural VIF values for some predictors indicate that possible model misspecification and multicollinearity cannot be excluded. These limitations warrant cautious interpretation of the structural estimates but do not prevent examination of the predictive and explanatory relationships specified in the model. Consequently, the non-significant relationships may reflect limited power, sampling characteristics, measurement limitations, or construct and model specification rather than the absence of substantive relationships.
Taken together, the findings provide mixed support for the proposed capability–behaviour–adoption framework. AIL and FI were positively associated with FB, none of the capability constructs demonstrated a statistically significant unconditional direct relationship with DFAO. The hypothesised indirect effects through FB were also not statistically supported. At the contextual level, fresh USD account ownership significantly moderated the FI–DFAO relationship, whereas the remaining moderation effects were not statistically significant. The overall pattern suggests that capability-based explanations of digital financial adoption may be context-dependent and that their applicability may vary across institutional settings. The contextual features of the Lebanese post-crisis environment provide a relevant setting for interpreting the findings. Moreover, the non-significant relationships do not demonstrate an absence of capability effects. Accordingly, the capability–adoption gap is proposed as a cautious interpretation that should be explicitly tested and replicated across larger samples and different institutional and economic settings.
This cautious interpretation is consistent with
Benhayoun et al. (
2025), who treated unsupported PLS-SEM relationships as context-dependent evidence requiring further examination rather than as proof that the underlying theoretical relationships were absent.
Furthermore, H8, H9, and H10 were not supported, providing insufficient evidence for the proposed mediating role of FB in the present sample. Nevertheless, these results cannot establish that mediation effects are absent from the wider population. The findings therefore offer limited empirical support for the hypothesised capability → behaviour → adoption pathway in the present sample. Although the estimated relationship between FB and DFAO was positive, it was not statistically significant, and its confidence interval included zero. The analysis consequently cannot determine whether disciplined financial practices translate into stronger digital financial adoption intentions within fragile financial environments.
In a fragile post-crisis economy, the present findings suggest that financial knowledge, AI-related competence, and access to services may be more closely associated with financial management behaviour than with digital financial adoption orientation. However, the observed pattern should not be interpreted as evidence that these relationships are absent in the wider population. Financial behaviour alone may likewise be insufficient to bridge this divide, although the present findings do not identify the mechanisms that may condition this relationship. In addition, the reintegration in the financial system, by owning a fresh USD account may not also affect the impact of behaviour on the digital financial adoption orientation, but on financial inclusion and its impact on the digital financial adoption orientation.
6. Limitations
This study has several limitations. First, the research was conducted in a single country and within a unique post-crisis environment, which may limit the generalizability of the findings to other contexts. The sample size also limits the precision of the structural estimates, particularly for the indirect and interaction effects. The interaction-focused sensitivity analysis does not establish adequate power for effects smaller than the minimum detectable effect, and the imbalanced distribution of fresh USD account ownership may further reduce the precision of the associated interaction estimates. Consequently, the moderation and mediation findings should be regarded as exploratory and sample-specific. Second, the study relied on self-reported survey responses, which may be affected by respondent perceptions and reporting bias. Third, the non-probability convenience and snowball sampling procedure and fully online recruitment may have introduced self-selection and digital-selection biases. Individuals with internet access, sufficient English proficiency, higher educational attainment, and greater engagement with online communication channels may have been more likely to participate. However, participation through digital channels should not be interpreted as evidence of high digital financial literacy or AI literacy, as respondents may possess varying levels of these capabilities despite having access to platforms such as WhatsApp, Facebook, email, or LinkedIn. The high proportion of respondents with postgraduate education illustrates an additional representativeness limitation. Consequently, the sample should not be considered representative of the Lebanese adult population, and the findings should be generalized cautiously. Fourth, the study was also based on a single cross-sectional self-report dataset and did not triangulate the results using behavioural records, interviews, longitudinal observations, or other independent data sources. Consequently, the sensitivity analysis strengthens the internal assessment of the findings but cannot substitute for data triangulation. Future studies should also employ mixed-method and multi-source research designs that combine survey responses with qualitative interviews, actual digital-service usage records, or longitudinal data. Such triangulation would help determine whether the non-significant relationships reflect the substantive context or limitations associated with power, sampling, measurement, or model specification. In addition, mistrust in the financial system was used as a contextual theoretical lens but was not directly measured as a latent construct; future research should operationalize mistrust explicitly using validated multi-item measures to examine its role in the capability–adoption relationship. On the other hand, the outcome construct captures a broad orientation toward digital financial adoption by combining indicators relating to online payments and online investment. Although the indicators demonstrated satisfactory convergent measurement properties, the study does not estimate payment and investment intentions as separate constructs. Future research should employ multiple behaviour-specific indicators for each domain to examine whether the determinants of online-payment and online-investment intentions differ. DFL and AIL were measured using respondents’ self-reported assessments of their knowledge and abilities rather than objective performance-based tests. Consequently, these constructs capture perceived literacy and should not be interpreted as objectively demonstrated financial or AI competence. Future research should complement perceived-literacy measures with objective knowledge or performance-based indicators. Although the DFL and AIL measures demonstrated satisfactory reliability and convergent validity, these results alone do not establish complete construct validity. Additional validation efforts, including comparisons with objective literacy assessments and alternative operationalizations of AI-related competence, would further strengthen confidence in the measurement approach. Finally, the model explained only a modest proportion of the variance in FB and DFAO, indicating that additional factors not included in the model may influence digital financial adoption. In addition, the estimated-model fit diagnostics reported in
Table A7 did not indicate strong global model fit. Although PLS-SEM is primarily oriented toward explanation and prediction, these results suggest possible model misspecification and represent an additional limitation of the study. Accordingly, the structural findings should be interpreted as preliminary evidence requiring further examination and replication.
Future research could broaden the scope of this framework by applying it to a wider range of emerging and vulnerable economies, thereby assessing whether comparable findings are observed under varying institutional conditions. Researchers could also examine other factors that may shape the uptake of digital financial services, such as users’ confidence in fintech providers, their willingness and ability to embrace new technologies, perceptions of potential risks, and demographic characteristics. Employing longitudinal approaches could further enhance understanding of the ways in which financial competencies, financial practices, and engagement with digital financial services change over time. In addition, further investigation into the application of artificial intelligence to personal financial management would be valuable, especially as AI-driven financial solutions become more deeply embedded in routine financial decision-making.
7. Conclusions
This study examined the applicability of capability-based explanations of digital financial adoption within a fragile post-crisis economy. The study forms part of an ongoing research stream examining relationships among financial capability, digital financial literacy, financial behaviour, and digital financial adoption (
Hermawan et al., 2022;
Kadim et al., 2024;
Kumar et al., 2023b), while contributing to emerging research conducted in Lebanon’s post-crisis financial context (
Aoun et al., 2026b;
Mawad & Freiha, 2024).
Drawing on a capability–behaviour–intention framework, the study investigated whether Perceived Digital Financial Literacy (DFL), Perceived AI Literacy (AIL), and Financial Inclusion (FI) translate into Digital Financial Adoption Orientation (DFAO), while considering the mediating role of Financial Behaviour (FB) and the moderating influence of banking reintegration and bank stability concerns. Using survey data collected from 164 respondents in Lebanon and analyzed through PLS-SEM, the study provides mixed and non-conclusive evidence regarding the proposed capability-based relationships.
The findings provide limited and inconclusive support for the hypothesised capability–behaviour–adoption relationships in the present sample. AIL and FI were positively associated with Financial Behaviour, whereas the direct relationships between DFL, AIL, FI, and DFAO were not statistically supported. Financial Behaviour was not significantly associated with DFAO, and the proposed indirect effects through FB were not statistically significant. This pattern does not demonstrate the absence of capability effects; rather, it indicates that the hypothesised direct relationships with DFAO were not statistically supported in the present sample. Smaller direct, indirect, and interaction effects may also have remained undetected. The potential capability–adoption gap should therefore be treated as a tentative interpretation rather than a confirmed finding. The results suggest possible limits to applying the capability–behaviour–adoption pathway universally, but larger and more diverse samples are required before such a conclusion can be established.
The findings offer preliminary practical considerations rather than policy prescriptions. The positive association between FI and FB suggests that practical access to financial services may warrant further examination alongside financial and digital capability initiatives. However, the cross-sectional design, non-probability sample, potential digital-selection bias associated with online recruitment, measurement limitations, and non-significant relationships prevent the study from establishing which interventions would increase digital financial adoption. Institutional trust was also not measured directly. Accordingly, the results should not be used independently to guide policy decisions but may help identify questions for further research and evaluation.
For future studies, researchers may extend this framework to other developing and fragile economies to examine whether similar patterns emerge across different institutional settings. Future research may also investigate additional determinants of digital financial adoption, including trust in fintech providers, technology acceptance factors, perceived risk, and demographic influences. Longitudinal studies could provide deeper insights into how financial capabilities, financial behaviour, and digital adoption evolve over time. Finally, future studies may further explore the role of artificial intelligence in personal finance, particularly as AI-powered financial services become increasingly integrated into everyday financial decision-making.
From a theoretical perspective, the study raises the possibility of a boundary condition affecting capability-based explanations of digital financial adoption. The contribution lies in examining the capability–behaviour–adoption logic within a fragile institutional context and assessing whether relationships commonly reported in prior research remain observable under such conditions behaviour. However, the present results do not establish the existence of a capability–adoption gap or demonstrate that institutional and economic instability caused the non-significant relationships. The study instead suggests that the capability–behaviour–adoption pathway may not apply uniformly across all settings. Future comparative research should test this possibility using larger samples from both stable and fragile institutional environments and direct multi-item measures of institutional trust.