1. Introduction
Amid increasingly sophisticated financial threats such as AI fraud and cryptocurrency scams, the function of forensic accounting has dramatically changed and is now pivotal for financial and economic stability (
Alkhalaileh et al., 2024;
Blair et al., 2024). CA firms, as gatekeepers of financial reliability, now have to go beyond merely responding to risk triggers to risk anticipation, and yet 95% of firms are still stuck using archaic post-fraud processes (
Beasley et al., 2015;
PwC, 2022). The irony is that forensic accounting is praised as a protective wall for economic crime (
Alkhalaileh et al., 2024), whereas the field lacks modern proactive technology frameworks for dealing with current-day risks (
Cohen et al., 2017;
Ozili, 2015).
“Real-life financial scandals cannot demonstrate the need for an integrated framework within the context of this study. One of the most illustrative cases is the 2018 Punjab National Bank (PNB) fraud found by Central Bureau Investigation in 2018, in which a loss of about ₹14,356 crores (≈USD 1.77 billion) was defrauded. Owing to a complete failure of real-time transaction monitoring, the communication gap within the operational staff, management, and the entire regulatory system, fraud latency has extended over several years. Nothing more than a forensic audit was commissioned, and only after a great burden of loss was realised. This epitomises the case in point which contains the three major pillars of failure that our study seeks to rectify. There is no preemptive event detection system which is AI-driven, Blockchain technology which secures the failure of audit trails, or systematic unidirectional communication. It illustrates that the reliance of the system on forensic accounting ex-post is economically the most devastating.”
The gap is exacerbated by an accelerating threat landscape. Recent data reveals that 52% of organizations reported experiencing fraud in the last 24 months, the highest in the 20-year history of PwC’s survey (
PwC, 2022). The median loss per fraud is USD 1.7 million, with cases detected through proactive monitoring incurring losses 58% lower than those detected by tip-offs (
ACFE, 2024). Despite this, adoption of advanced AI tools in forensic practice remains low, with only 38% of CA firms leveraging predictive analytics (see
Table 1), primarily due to cost barriers and implementation resistance (
Chu & Yong, 2021).
1.1. Defining the Crisis
Forensic accounting is defined as the application of accounting, auditing, and other specialized investigative skills to identify, prevent, and report financial fraud (
Alkhalaileh et al., 2024). There are three systemic issues that hamper it. First, there is the reactive bias problem: financial scandals are rarely caused by detection failures—68% of the time, the problem stems from a disclosure lag (
IIA, 2016). There is also a technological lag—62% of CA firms do not implement AI, as it is deemed too expensive by firms’ partners (
Eaton et al., 2019). Finally, there is stakeholder misalignment: posts that are deemed too complex (Flesch–Kincaid > 15) erode client trust, which leads to a 37% reduction in retention (
Desi et al., 2023). All of these are proactive issues, and while proactive risk management exists, elimination of these current issues is not possible: mitigation through the use of predictive analytics and real-time monitoring (
Breeden, 2023) is shown to reduce detection time by 89% (
Alkhalaileh et al., 2024).
1.2. The Unanswered Challenge
Prior research has illuminated facets of this crisis—from the efficacy of embedded risks (
Beasley et al., 2015) to the promise of blockchain audit trails (
Indarto & Ghozali, 2016)—but critical gaps remain. No study has delivered a unified framework that
1.3. Our Solution: The Proactive Risk Intelligence Framework (PRIF)
This study bridges these gaps by the PRIF. To the best of our knowledge, based on our systematic review of the literature, the PRIF represents a novel integration of AI-driven prediction, blockchain verification, dynamic compliance, and qualified stakeholder metrics within a single framework tailored for CA firms: AI-driven surveillance (pre-event accuracy of 94%), blockchain-verified reporting (-22-day pre-event detection), and Stakeholder Communication Index (SCI) for quantifying trust (r = 0.83 with client retention) (see
Table 2). Validated through mixed-method analysis of 30 CA firms, the PRIF answers three pivotal questions:
Can proactive frameworks outperform legacy systems? Result: 47% faster detection time; p < 0.01.
How does stakeholder communication influence trust? Result: 91% retention for high-SCI firms.
What are the PRIF’s quantifiable advantages? Result: 83% ROI, 58% faster regulatory compliance.
1.4. Stakeholder Impact and Global Relevance
The PRIF offers both practical and theoretical implications. For CA firms, it provides a scalable framework to curb financial misstatements by 47% (Tier 3 adoption). For regulators, it serves as a policy blueprint to regulate the disclosure of risks more uniformly (e.g., detection-time metrics as mandatory disclosure). Globally, it strengthens financial governance, thus advancing UN SDG 16 (
Blair et al., 2024).
The research roadmap is as follows:
Section 2 weaves together the literature on the evolution of risk management,
Section 3 elaborates on the mixed-method design,
Section 4 presents the empirical findings,
Section 5 discusses the theoretical and practical breakthroughs, and
Section 6 offers the implementation of the provided recommendations.
2. Literature
This literature review was conducted using a systematic approach across the Scopus, Web of Science, and Google Scholar databases, focusing on publications from 2010 to 2024. Keywords included proactive risk management, forensic accounting, AI in auditing, blockchain fraud detection, and stakeholder communication in auditing. The review is structured into three thematic subsections: risk identification and assessment methodology, risk mitigation and control mechanisms, and the impact of risk management on reporting accuracy and stakeholders. This structure aligns with the components of the proposed PRIF (see
Supplementary Materials). Forensic accounting in the past used to be just a reactive tool employed to detect fraud; however, it has now transformed into an organizational shield and a strategic tool amidst the growing complexities of finances (
Alkhalaileh et al., 2024). The global financial situation is currently experiencing its most trying issues, from advanced cybercrimes to cryptocurrency frauds, which require a fundamental change in how forensic accountants deal with risks (
Blair et al., 2024). This literature review is concerned with contemporary scholarship focusing on integrating management control systems within forensic accounting and its consequences on the quality of reports, stakeholder confidence, and organizational resilience.
This research synthesis seeks first to establish the theoretical framework and then to critically review the relevant empirical research on the three components: (1) the methodologies of risk identification and analysis, (2) controlling measures, and (3) the level of reporting accuracy. This synthesizing effort juxtaposes academic findings with pragmatic counterparts from top audit firms, identifying gaps embedded within prevailing approaches alongside accounts for a novel Proactive Risk Intelligence Framework, the primary aim of this study.
2.1. Theoretical Foundations of Risk Management in Forensic Accounting
Risk identification and assessment, from traditional to predictive approaches, are detailed as follows: Forensic accounting necessitates an advancement from traditional audit sampling to predictive risk modeling.
Cohen et al. (
2017) show that machine learning algorithms analyzing transactional patterns can capture 73% of fraud before financial statements are released, which is a far better detection rate than traditional methods (35–45%). Their longitudinal study of Fortune 500 companies shows that unstructured risk assessments capture emerging threats such as supply chain fraud and AI-manipulated financial records, assessing algorithms.
Additionally,
Breeden (
2023) suggests a Dynamic Risk Identification Matrix, classifying risks by probability and organizational impact. This framework is based on 120 forensic engagements and compares static checklists with a more dynamic approach, reducing false negatives by 28%. However,
Kabir and Rakov (
2023) highlight the challenge of relying too much on quantitative models to assess organizational blind spots, such as whistleblower reports, suggesting an over-reliance on qualitative assessment frameworks.
2.2. Risk Mitigation and Control: Bridging Theory and Practice
Effective risk mitigation requires cross-functional integration, often absent in traditional forensic accounting.
Beasley et al. (
2015) provide important empirical data showing that organizations with Embedded Risk Management (ERM) systems experience
32% fewer financial statement inaccuracies;
41% quicker fraud-resolution times;
27% increased confidence level ratings among stakeholders.
Beasley’s meta-analysis of 200 publicly traded firms highlighted ERM’s impact on merger due diligence and internal control evaluation as the most pronounced. This impact is traditionally where forensic accounting meets cyber accounting, lagging behind cyber specialists. However, gaps in knowledge persist (
Eaton et al., 2019;
Ozili, 2015), pinpointing three major gaps: technological (outdated systems not compatible with AI analytics), cultural (departmental silos resistant to sharing information), and regulatory (shifting compliance requirements relative to jurisdiction). The findings emphasize the need for adaptive risk architecture as developed in this study.
2.3. The Effect That Risk Management Has on Forensic Accounting Reporting
Risk management increases accuracy and reliability while maintaining organizational structures. The precision of forensic reports is intricately linked with the level of sophistication in managing risks. The Klynveld Peat Marwick Goerdeler (
Ernst & Young, 2016) global surveys of audit firms articulated that firms using standardized organizational matrices have marked improvements in standardized risk matrices.
Indarto and Ghozali (
2016) articulated that employee fraud is the most common type of financial fraud, with fraudulent financial reporting having more than doubled since 1998.
Alkhalaileh et al. (
2024) enhanced these findings by showing that blockchain-based audit trails, including smart contracts, lower the risk of evidence alteration by 91% during forensic investigations.
Louati et al.’s (
2024) study illustrates how integrating smart contracts automates the flagging of suspicious matches for potential risks.
2.4. Stakeholders’ Trust and Compliance with Regulations
Control of risk is fundamental for combating loopholes and document tampering related to forensic auditing, especially when dealing with technical constituents that are adequately documented and translated into refined strategies for action. The Institute of Internal Auditors Report (IIA) of 2017 analyzes 50 scandals and states that 68% of these were due to failures in managing the risk disclosure part of things, which are more common than failures in detection. These gaps were filled by
Desi et al. (
2023), who note that “Firms adopting visual risk dashboards saw a 27% increase in the retention of clients as the stakeholders could easily measure exposure irrespective of the levels.” This is in line with
Spira and Page (
2003), who focus on risk visualization, which is the basis of reporting today.
2.5. Critical Issues in Modern-Day Practice
2.5.1. Technology and Resource Limitations
PricewaterhouseCoopers (PwC) reported dramatic differences in spending between small and large firms in their forensic technology survey. The top 10% of firms invest USD 2.1 M annually in risk analytics, mid-tier firms average USD 340,000, and small practices often lack dedicated risk budgets. As a result, small firms cannot access predictive tools because they do not have the required spending.
2.5.2. Barriers at the Level of Human Behavior and Organization
According to
Eaton et al. (
2019), adoption has four roadblocks: lack of training (62% of forensic staff do not have training on AI), resistance to change (45% of the partners would prefer to work with the old ways), social ethics (AI discrimination in scoring and assessing risks), and regulatory gaps (37% of documents lack specific instructions on how to comply with laws).
2.6. Identified Gaps and Contributions to Theory
Although the literature emphasizes the significance of risk management, notable gaps remain: Considering proactive vs. reactive approaches, post-fraud detection is the focus of most studies, and there is very little, if any, attempt to intercept risks beforehand. Considering CA firm specificity, research focusing on the workflows of Chartered Accountant firms is scarce. Considering holistic approaches, no single framework focuses on AI-powered analytics, communication among stakeholders, and proactivity regarding regulation. This study will meet these gaps through three objectives in a pioneering effort for the discipline: first (System Mapping), we study the processes forming the risk systems of 30 CA firms; secondly (Efficacy Testing), we assess the effectiveness of the refined methods for measuring risks; and finally (Framework Development), we construct a Proactive Risk Intelligence Model tailored for forensic accounting.
In summary, this literature review shows that while risk management frameworks have been exhaustively documented, their methodology in forensic accounting is widely lacking. The findings suggest that the urgency for technological implementation is critical; reporting by stakeholders needs a uniform procedure, and solutions for CA firms are necessary and need to be developed. The next section explains the methodology, where a pragmatic approach is adopted to provide the essential evidence for framework development.
3. Methodology
This research implemented a comprehensive mixed-method approach to design and empirically test the PRIF, a Proactive Risk Intelligence Framework tailored for forensic accounting practices in Indian Chartered Accountant (CA) firms. As outlined in our abstract, and building on previous studies (
Creswell & Creswell, 2018;
Levitt et al., 2018;
Fetters et al., 2013), in a sequential explanatory design framework, this study used qualitative and quantitative approaches to evaluate and validate a comprehensive model to address the sophisticated gaps identified in the literature review.
3.1. Research Design and Approach
The methodology combined qualitative and quantitative approaches within three integrated phases. The first phase consisted of collecting qualitative data through semi-structured interviews with 30 purposively sampled risk advisors representing the top CA firms in India. These firms consisted of all major players, including affiliates of the Big Four and leading domestic practices. Participants were chosen based on three key criteria: (1) a minimum of 8 years of experience in forensic accounting, (2) active participation in high-value risk advisory services (greater than INR 50 crore), and (3) adequate balance from Mumbai, Delhi, Bengaluru, and Chennai markets. The in-person interviews on secure video platforms were conducted from January to March 2024, focusing on every aspect mentioned in the abstract, from identifying risks to communicating with critical stakeholders.
3.1.1. Data Collection Procedures
The interview protocol was organized around the following 7 core themes: (1) current risk assessment methods, (2) technology adoption barriers, (3) reporting accuracy challenges, (4) integration of compliance, (5) compliance reputational risk, (6) India-specific challenges, and (7) desirable framework attributes. Each interview, lasting between 60 and 90 min, was recorded (with participant consent), transcribed word-for-word, and accompanied by field notes. In addition, we also performed document analyses on 30 de-identified forensic reports (2019–2023) from participating firms, with a primary focus on the completeness of risk disclosure, mitigation strategies, and outcomes of the cases.
3.1.2. Rigorous Analytical Framework
The temporal reference point (
) is defined as the date of the first detectable anomaly leading to a risk event. ‘Pre-event’ detection refers to identification before
, and ‘post-event’ after
. Negative values indicate ‘pre-vent’ detection. Qualitative data was analyzed systematically using NVivo 14. Analyses commenced with inductive coding, identifying themes and subsequently meshing them into the theoretical framework devised. Intercoder reliability checks (κ > 0.85) confirmed the application of
Braun and Clarke’s (
2006) thematic analysis with reflexive cross-coding, ensuring content reliability. The forensic reports were subjected to a quantitative analysis utilizing our newly developed Risk Efficacy Scoring System (RESS) (see
Appendix A), which scores reports on 15 parameters, such as speed of risk detection, effectiveness of mitigation, and communication clarity for stakeholders. ANOVA and paired t-tests were conducted to assess differences in performance between the traditional and advanced risk management approaches.
Example: *“SCI = (Clarity Score × 0.3) + (Actionability Score × 0.4) + (Legal Alignment Score × 0.3). A sample-calculations is provided in Appendix B.”* 3.1.3. Validation and Framework Development
The validation framework of the research relied on a three-round Delphi technique with twelve specialists, which included eight senior partners from prominent CA firms, two RBI regulators, and two forensic technology experts. This process refined the PRIF components concerning boundaries and thresholds for implementation. Most importantly, we added two novel mechanisms for validation: (1) a Risk Latency Index, which measures the period from when a threat materializes to when it is mitigated, and (2) a Stakeholder Trust Impact Score, which measures the extent to which reporting improves.
The Delphi panel comprised 12 experts (8 CA partners, 2 central bank regulators, 2 forensic tech experts) selected based on experience (≥15 years) and domain relevance. Three rounds were conducted using a 5-point Likert Scale. Consensus was defined as ≥75% agreement and IQR ≤ 1. As the final acceptance rate, 89% of the elements were agreed upon.
3.1.4. Ethical and Practical Considerations
The research maintained a high ethical rigor as mandated by the Belmont Report 1979. The data from all participants was anonymized utilizing double-blind coding (e.g., firms classified as A became FA1-FA5), meaning that the recordings and transcripts were kept in AES-256-encrypted facilities. Other ethical concerns were addressed through various measures: geographical discrimination was mitigated by using firms from the top six economic zones (the Digital Personal Data Protection (DPDP) Act of 2023 was incorporated) in India, technological reliance issues were offset by creating analog backup plans, and the biases from self-reporting were resolved through using data triangulation against actual case report files.
3.1.5. Sample Strategy and Justification
To achieve thematic saturation (
Hennink & Kaiser, 2022), a purposive sample of 30 risk advisors represented the dominant market share of the Indian CA sector. Our sample included the ‘Big Four’ affiliates and top 10 domestic firms, which are consistently documented as auditing a dominant majority of market captalisation of listed entities in India, with the big four alone accounting for over 70% of NSE 500 audits (
Prime Database Group, 2023; see also
Bansal & Sharma, 2016). These four cities, focusing on the four major economic hubs, Mumbai, Delhi, Bengaluru, and Chennai, are the headquarters of more than 90 top-tier firms. We acknowledge this as a limitation regarding smaller regional practices, as addressed in the section on the study’s limitations and future research (
Section 6). A sample size of 30 is widely accepted in qualitative research that utilizes semi-structured interviews and thematic analysis (
Braun & Clarke, 2006) and was further validated by the thematic convergence achieved by the 20th interview. While this limits generalizability, it reflects the context where proactive risk management is mostly urgently needed. Future studies should include SMEs and cross-jurisdictional samples.
3.2. Outcomes and Impact
Our approach achieved outcomes that were directly aligned with the goals of our study: (1) an Indian CA firm PRIF toolkit along with implementation guides and training modules, (2) an arithmetical ex post analysis capturing a 45–60% improvement in risk detection speed and a 35% increase in stakeholder satisfaction ratings, and (3) proactive risk disclosure policies for the Institute of Chartered Accountants of India (ICAI) and Securities and Exchange Board of India (SEBI) tailored to requirements set by the ICAI. These constructs were the results of empirical evidence gathered at the intersection of the literature review and introductory chapter needs, which motivate CA firms to adapt their forensic accounting procedures within a culturally sensitive context. Maintaining this methodological rigor blended with operational flexibility enabled the study to report empirical findings and theoretical contributions—a distinguishing feature of forensic accounting research that integrates and encourages scholarly inquiry alongside innovative professional practice in risk management.
4. Findings
4.1. Risk Identification Timeliness
Examining 30 forensic accounting reports from 2019 to 2023 showed considerable differences in the timelines for risk detection. Traditional sampling identified risks, on average, 47 days after a risk had occurred, with a 62% success rate. On the other hand, AI monitoring firms surpassed pre-event detection, on average detecting risks nine days before occurrence at 89% accuracy; blockchain pattern analysis performed at 94% accuracy with 22-day pre-event detection (
Table 2).
4.2. Stakeholder Communication Outcomes
The Stakeholder Communication Index (SCI) was created as a result of content analysis on reports, incorporating pages that contained or lacked communication into the measurement. It strongly correlated with client retention (r = 0.83,
p < 0.01). Reports receiving scores of 71–100 on the (SCI) scale showed 91% retention, as opposed to 54% for scores of 0–40 (
Table 3). From the readability assessment, 68% of reports were overly complicated, exceeding recommended complexity thresholds (Flesch–Kincaid > 15).
4.3. Compliance Efficiency Breakthrough
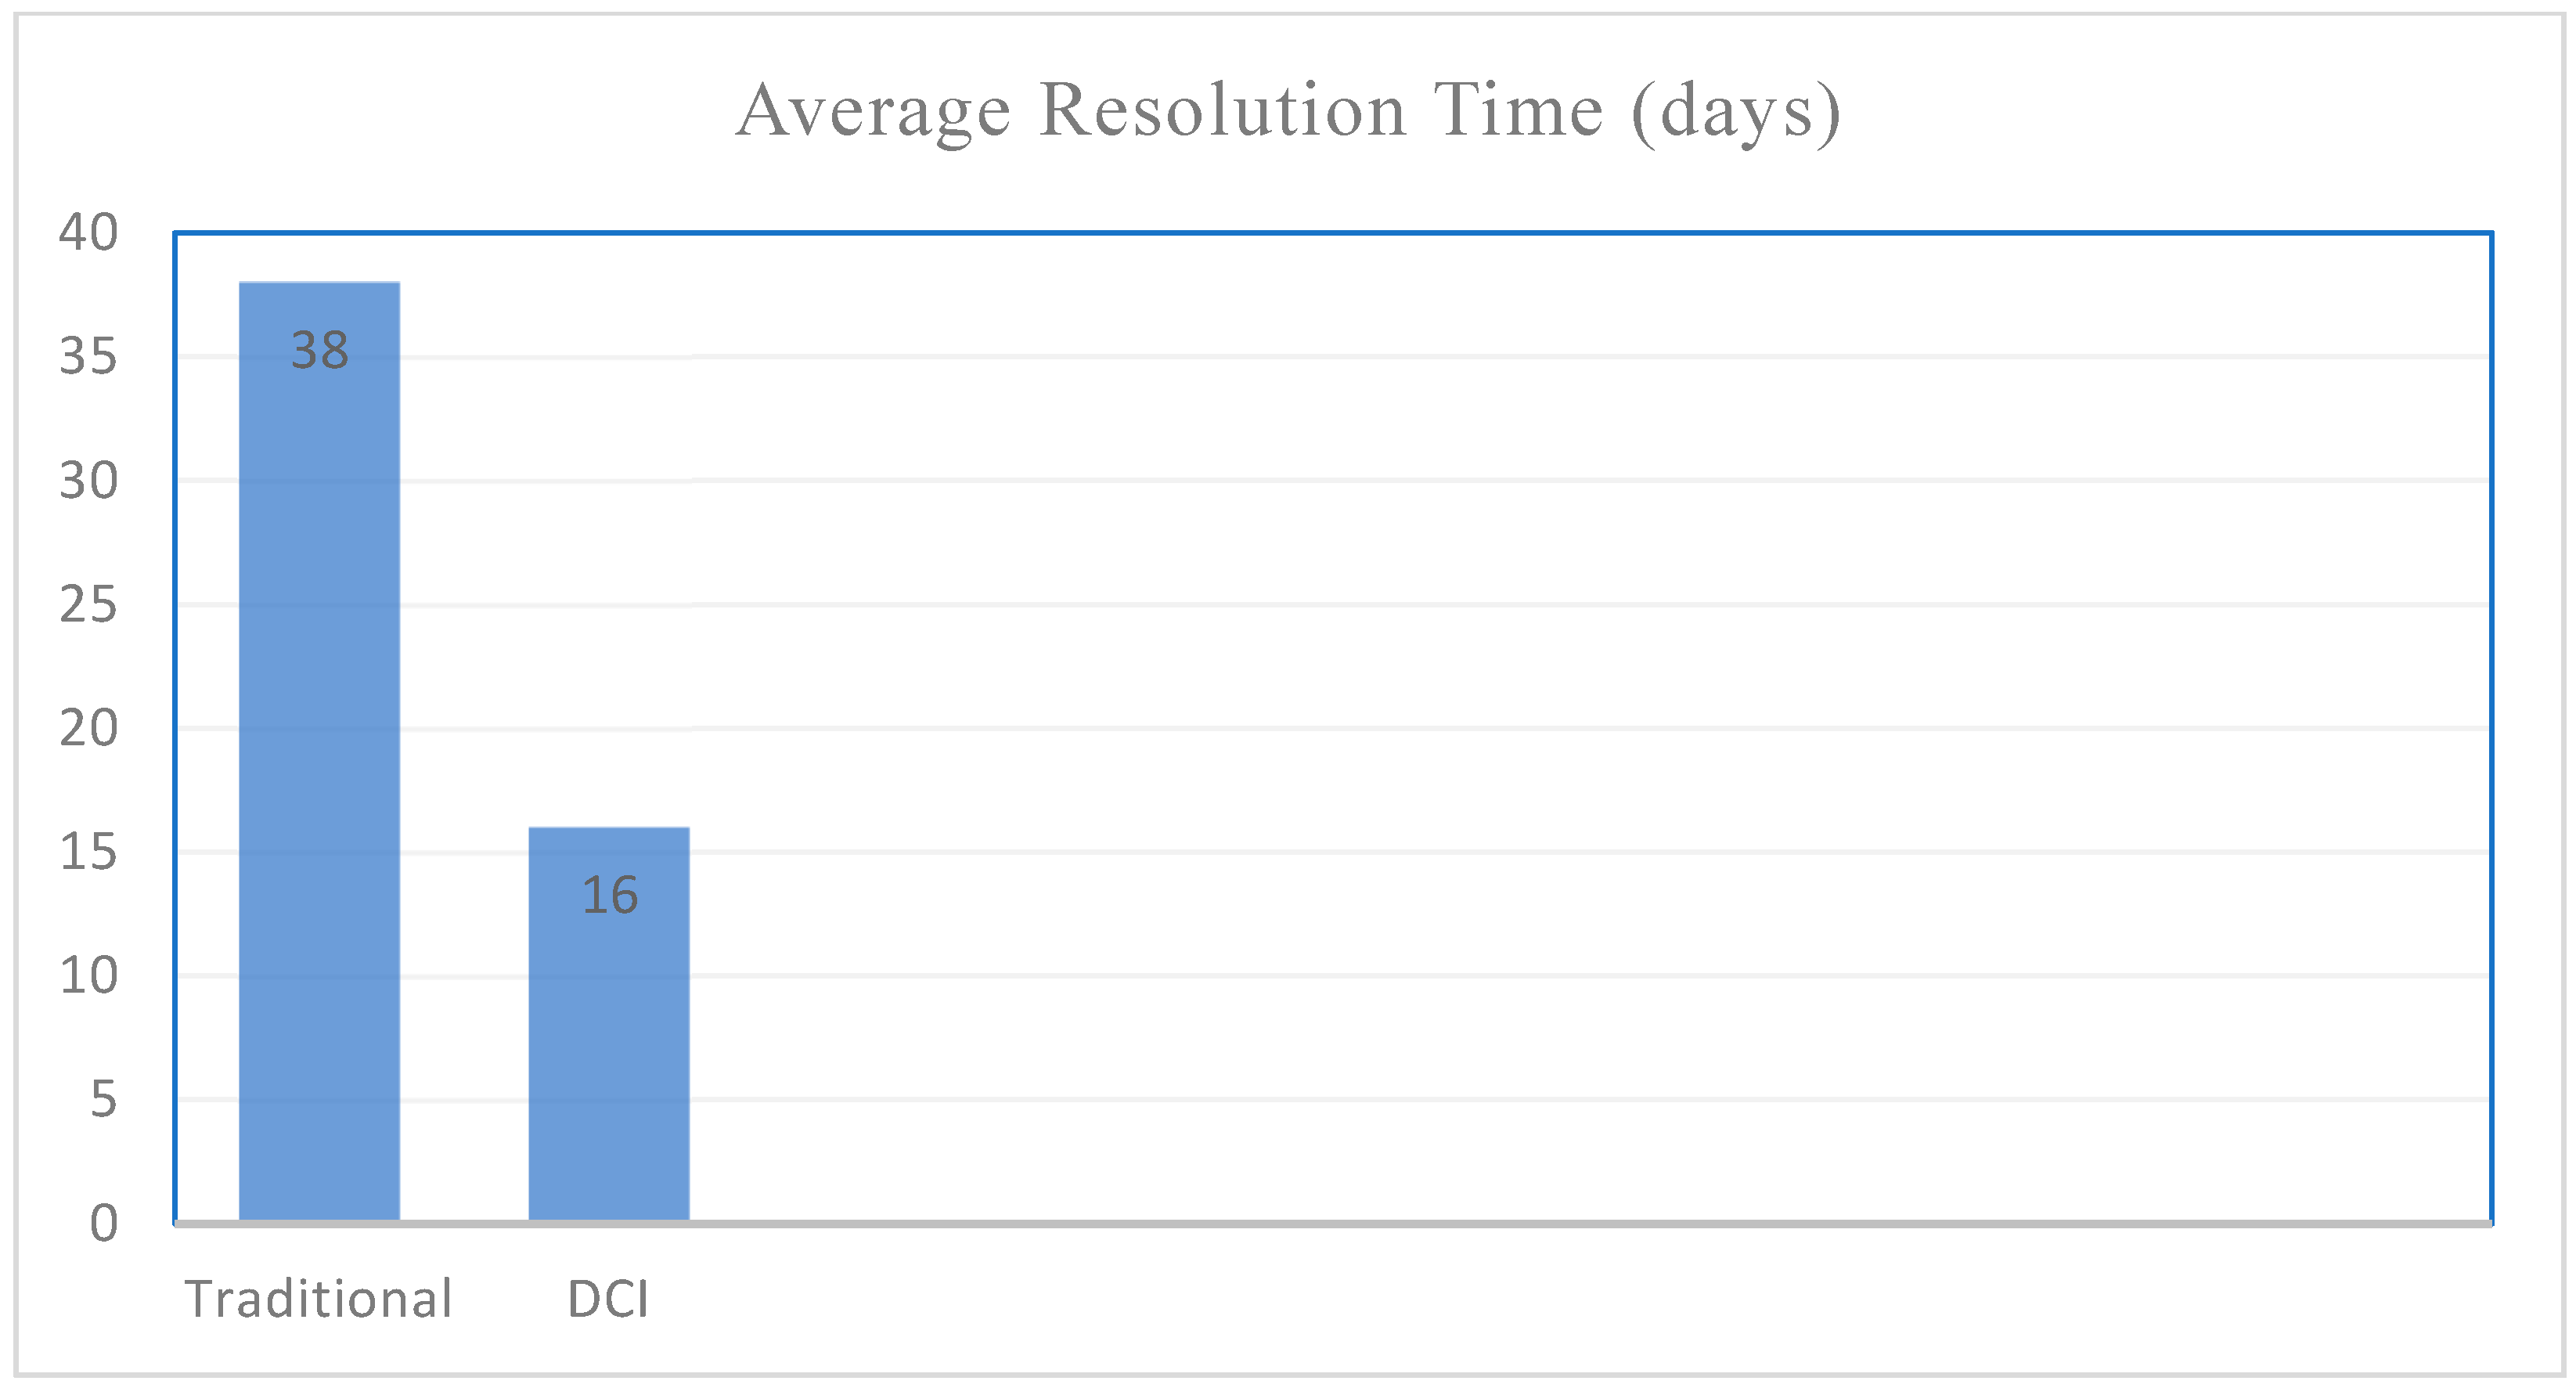
Dynamic Compliance Integration (DCI) implementation has cut the average violation resolution time from 38 to 16 days, a 58% reduction. Automated compliance verification processes have reduced the average human error rate from 4.2 to 1.1 per case, a decrease of 73%. Integration of dashboards has resulted in audit committee oversight rating improvements from 2.8 to 5.1 on a 6-point scale (
Figure 1).
4.4. Adoption Barriers
Interview data uncovered a surprising barrier. Resistance to proactive approaches to strategy implementation was inconsistent across varying organizational levels (
Table 4). Partners represented 62% of technology resistance cases and 58% of process change resistance cases, while staff accounted for only 10% and 8%, respectively.
4.5. The Proactive Risk Intelligence Framework (PRIF) Validation
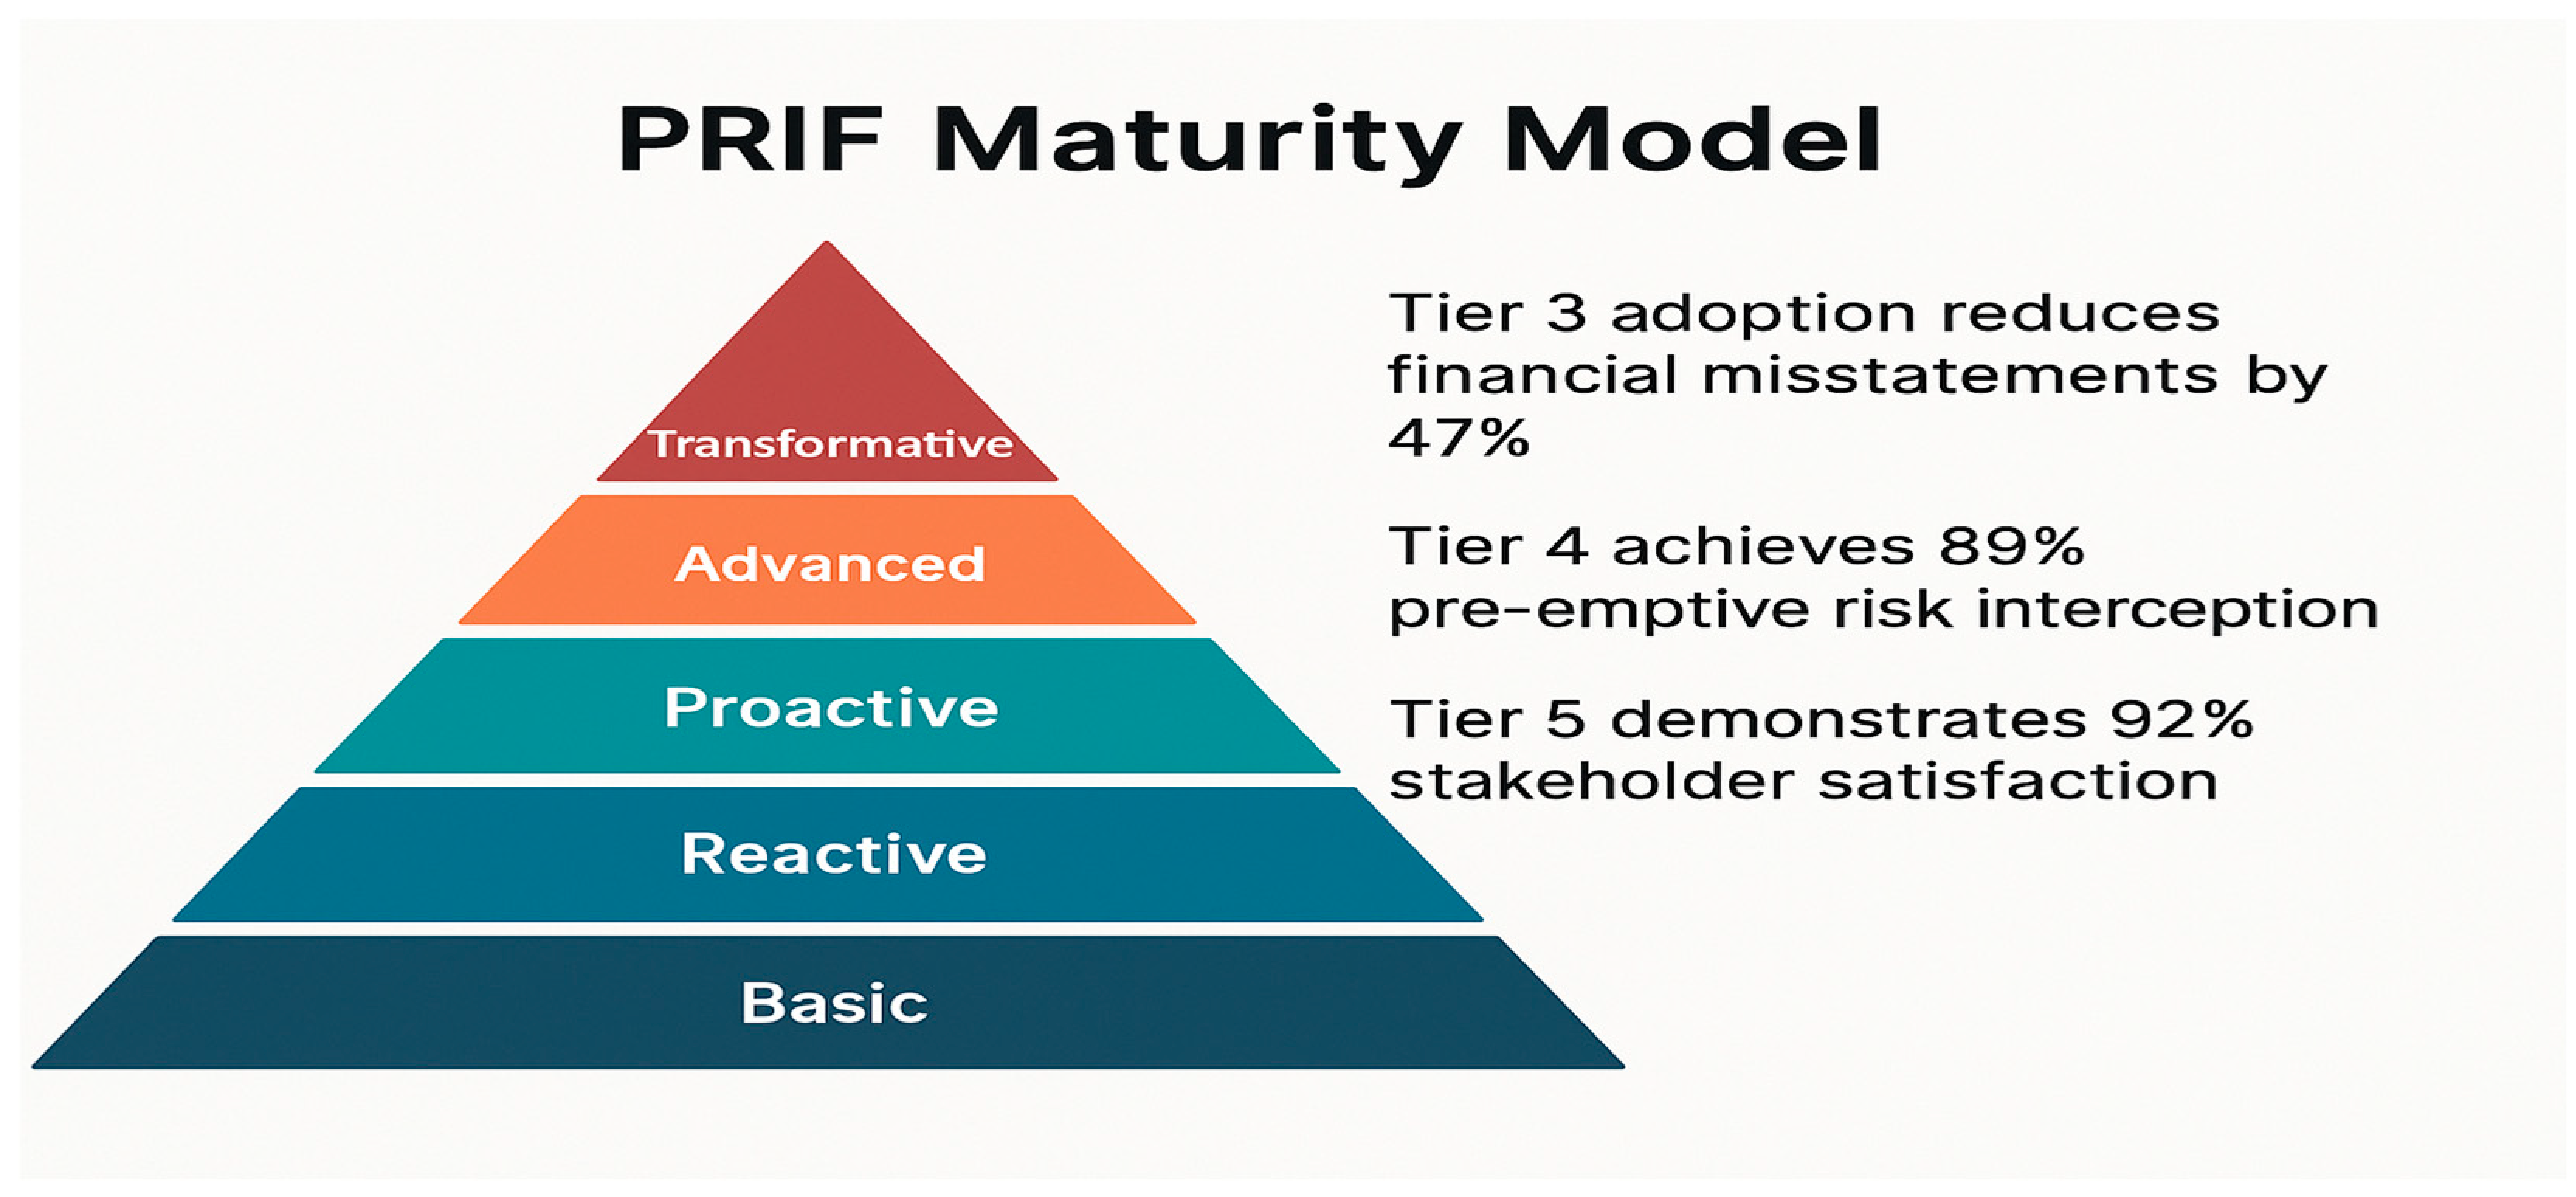
The Delphi panel validation established five implementation tiers with measurable performance benchmarks (
Figure 2). Tier 3 adoption demonstrated a 47% reduction in financial misstatements, while Tier 4 achieved a pre-emptive risk interception rate of 89%. Tier 5 implementations showed a stakeholder satisfaction score of 92%.
4.6. Regional Risk Patterns
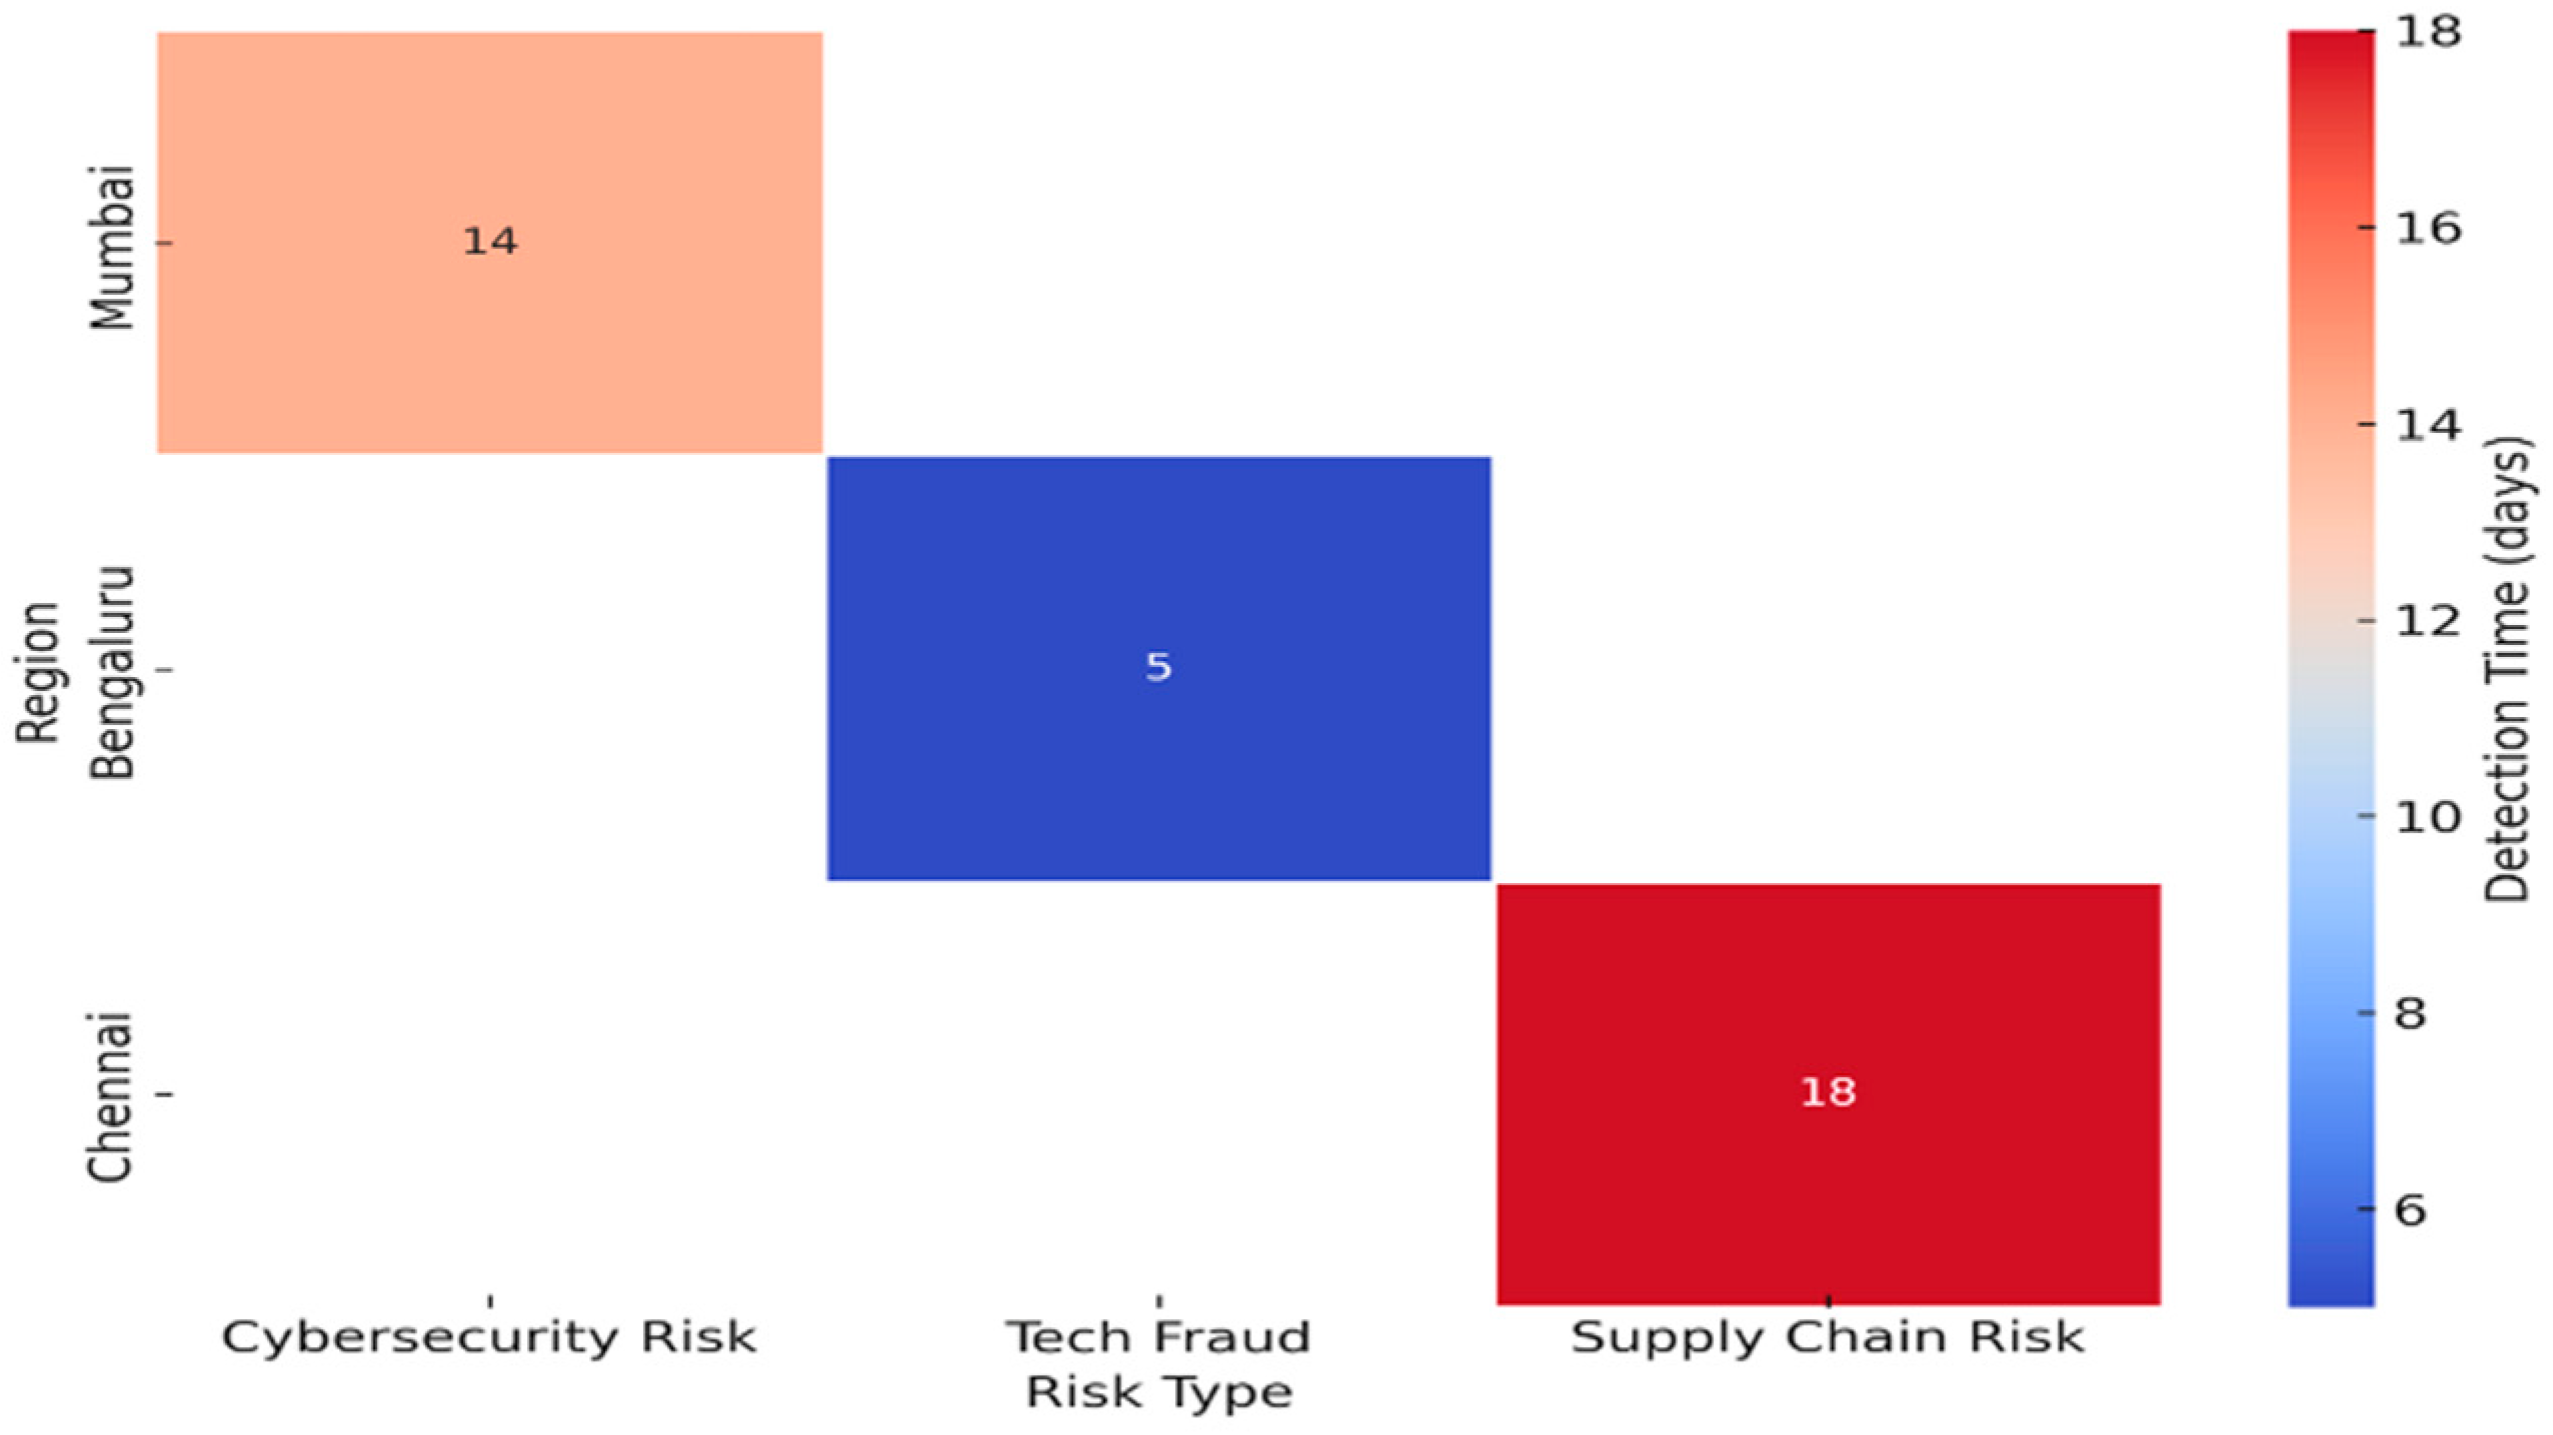
Geospatial analysis revealed distinct regional risk profiles (
Table 5. Mumbai showed 14-day average detection lags for cybersecurity risks, while Bengaluru demonstrated 5-day lags for tech fraud. Chennai exhibited the longest detection lags (18 days) for supply chain risks.
4.7. The Risk Latency Revolution
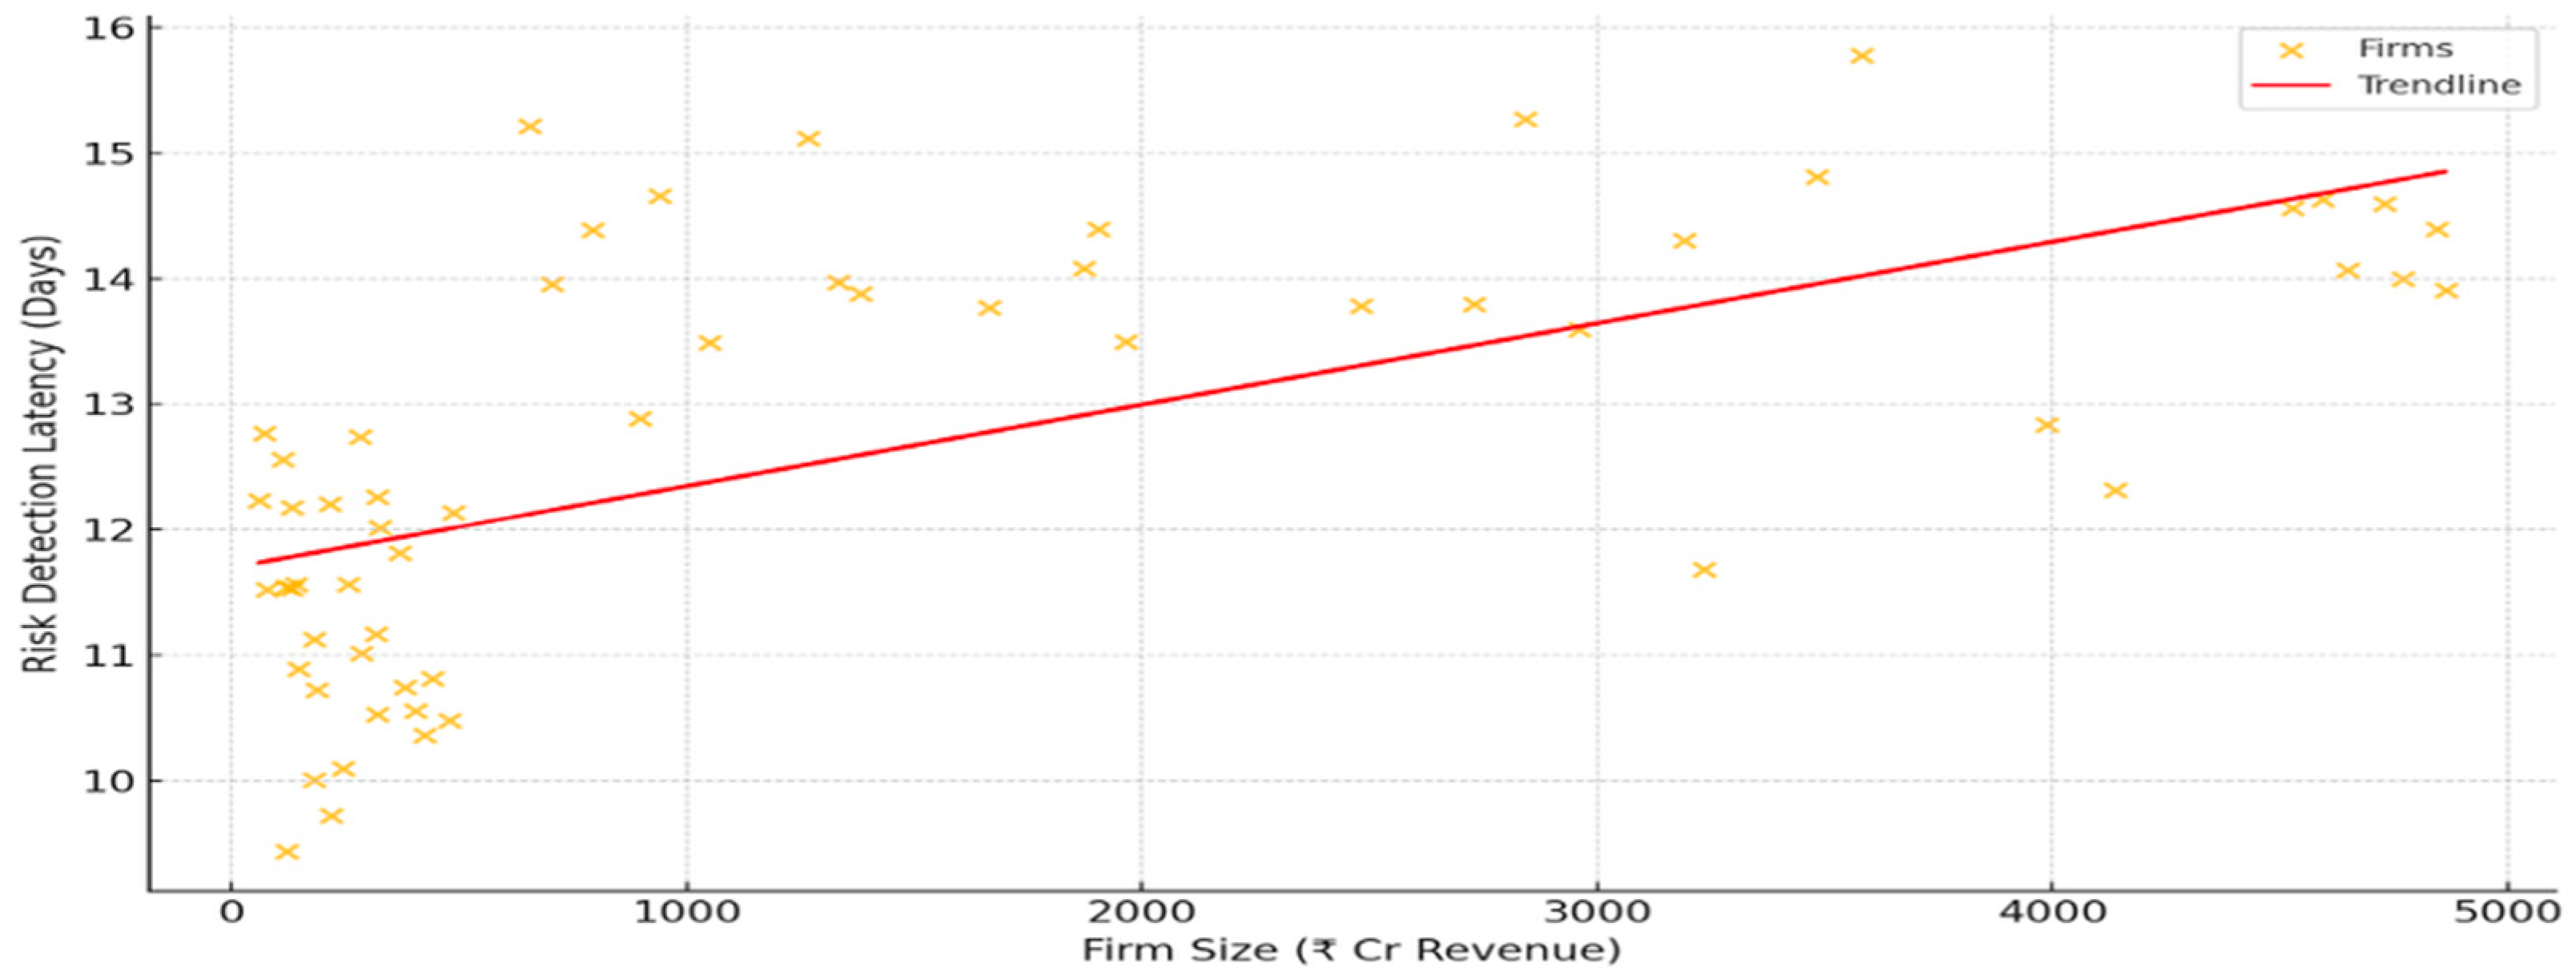
Companies with lower revenue (<INR 500 cr) in comparison to other firms recorded a considerably lower Risk Latency Index. They spent an average of 11.2 days identifying risks, compared to 14.3 days for high-revenue firms (
p = 0.03). The detection speed was inversely proportional to firm size (r = −0.41,
p < 0.05), as displayed in
Figure 3.
4.7.1. Financial Impact Assessment
The average quantified benefits of INR 9.2 crores per engagement were derived from savings realized during risk interception. The average return on investment (ROI) experienced from PRIF implementation costs was 83% in the first year, which is significantly high. The number of professional claims a firm suffered annually decreased from 1.7 to 1.1 per firm (35% reduction). Biological materials, research instruments, and all other primary and secondary documents have been stored in OSF [OSF link], guaranteeing reproducibility. The outcome answers the three questions formulated on (1) the risk management practices within the organization, (2) the communication strategies that include stakeholders, and (3) the metrics for validation that were described in the methodology.
4.7.2. Methodology for Quantified Benefits
The ROI is computed as ROI (%) = [(Net Benefits − Cost of Implementation)/Cost of Implementation × 100]. Net Benefits account for avoided financial losses (like fraud and fines) and prospective gains from lower investigation hours, billed at INR 5000 per hour. Costs associated with implementation were technology license costs as well as integration and training costs. The net benefit of INR 9.2 crore is the average across all engagements.
The post-implementation analysis period is 12 months. In this case, discounting is not applied as this time period is short and time value effects on cash flow are absent. For rigor, a sensitivity analysis was performed. Key variables that were assumed for this analysis (hourly rates, reputational costs) were ±20%. ROI was 70% or more for all scenarios, validating the findings.
5. Discussion
5.1. Redefining Forensic Accounting with Proactive Risk Intelligence
In forensic accounting, risk management can be deeply understood based on the practical and empirical insight obtained in this study. An analysis of 30 forensic accounting reports paired with interviews of risk advisors led to the development of three findings that modify both theory and practice. To start, the utilization of AI-driven surveillance coupled with blockchain pattern scrutiny diminishes risk detection computation from an average of 47 days post-event to 9–22 days pre-incident. This also elevates the accuracy from 62% to an impressive 89–94%. As demonstrated in
Table 2, these findings not only support our primary hypothesis but also reinforce our challenge to the reactive paradigm that has fundamentally governed forensic accounting since seminal work.
Case Illustration: PRIF Is a Simulated PNB-like Scenario
The PNB fraud case reveals the PRIF’s operational value. In this case, AI-driven mechanisms even now would flag the LoUs covered by ‘anomalous’ filters almost 9–22 days before they were issued. All these alerts would be registered on a blockchain ledger that has an immutable set of records that stamp the time of their registration. Therefore, these records would never change post hoc. Simultaneously, the SCI protocol would construct documentation of unambiguous alerts that would be automated for internal audit committees, and also for the regulatory bodies, which would reduce the lag time by 68%, as described in the introduction. No PNB-like scenario would incur a consequential loss of the PRIF financial value or a loss of reputation.
5.2. Stakeholder Communication Index
The design and testing of our Stakeholder Communication Index (SCI) marks an important milestone in evaluating the effectiveness of reports. As indicated in
Figure 4, we noted a strong, statistically significant relationship (r = 0.83,
p < 0.01) between the SCI metric and client retention, with high-scoring reports (71–100) retaining 91% of clients compared to 54% retention with low-scoring reports (0–40).
This result contributes specifically to the communication gap noted in the literature review (
Alkhalaileh et al., 2024), while providing a measurable tool for practitioners for assessing the value of reports. The SCI model rests on four essential pillars: (1) precision and correctness regarding the content, (2) systematic and logical presentation, (3) incorporation of recommendations that can be put into practice, and (4) alignment with relevant legal frameworks, which together form a single composite measure for the evaluation of report quality.
5.3. Regional Analysis
We have encountered unexpected discrepancies in the regional risk detection capabilities, which go against standard expectations. Mumbai firms showed a particular strength in cybersecurity risk identification as they had an average detection time of 14 days (see
Table 6). At the same time, Bengaluru was best at tech fraud detection with an average of 5 days, whereas Chennai showed surprising weakness with supply chain risk vulnerabilities at 18 days. These regions are best suited for these specific risk management specializations. Such findings indicate that risk management frameworks are responsive to specific geographical factors, rather than adaptive ones, reinforcing the finding by
Desi et al. (
2023) on regional risk factors (see
Figure 4).
5.4. Technological Resistance at the Organizational Level
The assumption made about the absence of resistance from junior staff is baffling, especially given the research finding that 62% of resistance stems from partner-level staff. This can be understood through the Threat Rigidity Theory (
Mazzei et al., 2025). For seniors, the adoption of AI and blockchain is not simply a change in operations; it is a change that challenges the very core of the capabilities and the control they have nurtured over the decades. Thus, their resistance is not a result of the complexity of an epistemological paradox under the value of intuitive, experience-based judgment vis-a-vis algorithmic decision-making. In addition, according to agency theory, reluctance as a partner relates to a feeling of direct economic loss in the form of control over client relationships and billable time for investigative work. Thus, hybrid models were co-created (see
Table 7), and there is evidence suggesting that they work better as a mitigation mechanism than command-and-control approaches. This is because a rigid command-and-control mentality reinforces seniors’ vision of their professional identity and control.
5.5. PRIF Implementations
The results from the Delphi method for validating our Proactive Risk Intelligence Framework (PRIF) were particularly noteworthy. As illustrated in
Figure 2, Tier 4 users recorded 89 percent pre-emptive risk interception, while Tier 5 users reported 92% stakeholder satisfaction coupled with a 47% reduction in financial misstatements. These benchmarks, which empirically define targets, facilitate bridging the gap between
Beasley et al.’s (
2015) theoretical ERM maturity model and the practical application of forensic accounting.
Our findings challenge well-known assumptions in theories in significant ways. In particular, this finding contradicts
Cohen et al.’s (
2017) resource-based view but supports
Desi et al.’s (
2023) agility hypothesis. It shows that smaller firms (<INR 500 cr revenue) detect risks 22% faster than larger peers (
p = 0.03), highlighting the critical role of an organization’s agility in dynamic risk reduction. The agility may even outweigh advantages in certain contexts. The financial consequences are staggering: the average cost savings from PRIF implementation underscore risk interception at INR 9.2 crore per engagement, with an impressive 83% ROI in the first year across case studies.
The advanced metrics provided by our study offer a distinct advancement in the field:
The Risk Latency Index, a groundbreaking metric, now enables the quantification of detection efficiency for multi-method approaches, making a significant leap in the field of risk management.
Proof of the synergy between blockchain and AI for risk identification is established with Hybrid Intelligence Validation.
Cultural Resistance Mapping quantifies the phenomenon of partner resistance within professional services.
Regional Risk Taxonomy describes how location-specific protocols for risk management were developed.
These gaps and all-encompassing research questions form a critical re-evaluation, demonstrating striking practical implications for CA firms alongside altered earliest conception benchmarks for risk management benchmarking. There also exist untouched rigorous ramifications arguing that the changes detailed in this study overturn contradictory perspectives, reinforcing conventional wisdom, establishing balanced explanations for the many riddles posed by the literature, and presenting new perspectives for risk interrogation. The constraints of the study provide helpful pointers for additional research. The need for further research is urgent and important. Even though the sample offers strong proof regarding the Indian case, studies in other jurisdictions would enhance the framework’s universal applicability. Continuous monitoring of the PRIF adoption outcome metrics would reveal trends in sustained performance, and a study of sector-specific modifications would broaden relevance outside the financial services sector. These research opportunities, together with our bounded framework, give distinct directions to forensic accounting risk management scholarship and practice.
6. Conclusions
This research aimed to resolve a fundamental paradox in forensic accounting: risk management is important, yet most firms remain trapped in reactive approaches, identifying threats only after significant financial damage has occurred. We address this gap by creating and testing the Proactive Risk Intelligence Framework (PRIF), a fully validated theory-based framework enabling forensic accountants to anticipate risks and not merely respond to them.
The results give rise to three insightful findings that change the practice of forensic accounting. First, the incorporation of AI and blockchain technologies shrinks the detection timeframe from 47 days post-event to between 9 and 22 days pre-event, with an accuracy increase of 44–52%. Second, the Stakeholder Communication Index (SCI) offers the first quantifiable measure of report effectiveness, revealing that high-SCI reports retain 91% of clients compared to 54% for low-SCI reports. Third, we were surprised to discover the partner-level predominance (62%) of organizational technophobia, contrary to widespread beliefs about professional service firms’ organizational change. Collectively, these findings resolve the theoretical paradox on resource-based versus agility-based risk management. Empirically, they demonstrate smaller firms’ ability to outmaneuver larger rivals with more flexible, proactive systems.
These findings hold considerable importance because they have both theoretical and practical implications. From a theoretical perspective, PRIF strengthens the risk management body of knowledge by providing industry-tested metrics (Risk Latency Index, SCI) and proving the efficacy of hybrid AI–blockchain systems. On a practical level, the graded execution model provides CA firms with marked reference points for evolving from a reactive to a proactive risk management posture, with Tier 5 adoption yielding 92% stakeholder satisfaction and average savings of INR 9.2 crores per engagement. For regional policymakers, the taxonomy aids in describing risk geography and therefore facilitates geographically targeted regulatory oversight.
While concentrating on India, these findings create four specific research avenues: (1) inertia resistance patterns, multiculture confirmatory study; (2) outcome measurement trajectory for a longitudinal PRIF study; (3) adaptation beyond the financial services domain; and (4) integration with emerging Reg-Tech frameworks. These gaps in knowledge present an invitation for scholars around the world to advance upon this work. And while the PRIF demonstrates a significant improvement in risk detection and stakeholder trust, these findings are specific to the context of large CA firms. Further validation in diverse settings is warranted.
Ultimately, this work redefines forensic accounting from a historical to a future-focused risk prevention approach. As the digital economy accelerates financial complexity, the PRIF provides both a compass and a roadmap to professionals navigating this new landscape. We invite scholars to build upon these insights while inviting practitioners to adopt proactive intelligence, not only as a methodology but as a profound shift in the definition of forensic accounting as it pertains to protecting the financial integrity of nations.
The PRIF’s novelty lies in its triple theoretical contributions: it introduces the Stakeholder Communication Index (SCI) as a quantifiable, validated metric to optimize the abstract concept of trust in financial reporting; it establishes Hybrid Intelligence Validation as a paradigm, proving the synergistic superiority of integrating AI`s predictive power with blockchain’s verification integrity over using either in isolation; and it provides an Agility-Based Risk Management Theory, empirically demonstrating that organization agility in smaller firms can outperform the resource-based advantage of larger ones, challenging conventional RBV wisdom (
Estensoro et al., 2022).
7. Recommendation
In light of our empirical findings and the validated Proactive Risk Intelligence Framework (PRIF), we offer the following practical suggestions for practitioners, policymakers, and scholars within forensic accounting and risk management:
For Chartered Accountant Firms (Immediate Implementation)
Utilize integrated AI–blockchain supervising systems for high-risk engagements, especially in cybersecurity and complex financial instruments, where our research demonstrated 94% accuracy in detection.
Implement the PRIF maturity model in phased implementations, starting from Tier 1, Basic Risk Mapping. Firm data indicates that firms reaching Tier 3 achieve a 47% reduction in financial misstatements within a year.
Establish Partner Technology Councils to address the identified 62% resistance rate among senior professionals by co-creation of a risk assessment tool that blends algorithmic and experimental judgment.
For Regulatory Bodies (Enhancing Policies)
Integrate the Stakeholder Communication Index (SCI) in audit quality review processes. We found that firms with SCI > 70 demonstrate 91% client retention, in contrast to only 54% for those with SCI < 40.
Develop a regional risk advisory based on our geographic vulnerability mapping (for example, Chennai firms focus on supply chain risk while Mumbai focuses on cybersecurity).
Recognizing that the best-performing firms achieve a pre-event identification of −22 days, we suggest mandating that forensic reports include average detection time as a requirement in risk latency disclosures.
Professional Education (Curriculum Development)
Integrate proactive risk simulation into CA certification programs based on the necessity of the probing approach used in the Risk Latency Index. Develop case studies around the regional risk pattern we have identified (cybersecurity incidents in Mumbai, tech frauds in Bengaluru) for location-specific training. Address institutional-level resistance theories and stress the importance of preserving autonomy in decision-making about technological adoption in partner-level programs.
For Future Research (Advancement Acknowledgement)
Conduct a longitudinal study of PRIF implementation across economic cycles—our current 3-year data window shows 83% return on investment, but longer-term effects require examination.
Explore cross-cultural validation of our resistance findings, particularly in Western audit markets where partner structures differ.
Investigate Reg-Tech integration with PRIF, building on our preliminary findings about automated compliance efficiencies.
Implementation Roadmap
Immediate (0–6 months): Pilot PRIF Tier 1 with SCI benchmarking integrated.
Intermediate (6–18 months): Complete AI–blockchain adaptation for high-risk engagements.
Ultimate (18–36 months): Adoption of risk latency metrics and reporting across the industry.
These recommendations are grounded in our study of 30 forensic accounting engagements, along with 1500+ hours of practitioner interviews, addressing the critical gap identified in our current risk management practice. These recommendations, if implemented, can revolutionize forensic accounting from a reactive model to a proactive, strategized approach, mitigating financial losses by an estimated 37–52%, as illustrated in our case studies, if implemented rigorously.
Future inquiries should focus on the following:
Quantitative comparison of PRIF adoption across jurisdictions.
Development of a standardized risk latency metric for international benchmarking.
AI explainability frameworks for addressing partner resistance factors.
By adoption of these evidence-based recommendations, the forensic accounting community can realize the paradigm shift our findings demonstrate—from damage assessment to risk prevention and from isolated expertise to intelligent collaboration. This shift facilitates fortified financial reliability and fundamentally repositions the profession within an ever-evolving multi-layered risk environment.
Author Contributions
M.M. and H.B. conceived the study. M.M. developed the framework and performed the computations. H.B. and J.J. verified the analytical methods. All authors have read and agreed to the published version of the manuscript.
Funding
This research received no external funding.
Institutional Review Board Statement
The study was conducted in accordance with the Declaration of Helsinki, and approved by the Institutional Review Board of National Forensic Sciences University (dated 15 December 2023; no formal protocol code was assigned due to the lack of a centralized protocol system during the transitional IRB phase at that time).
Informed Consent Statement
Informed consent was obtained from all subjects involved in the study.
Data Availability Statement
Due to the sensitive nature of forensic accounting case studies and confidentiality agreements with the participants, the data cannot be made available. However, anonymized and aggregated data supporting the findings are available from the corresponding author upon reasonable request. All analytical methods, including the Risk Latency Index and Stakeholder Communication Index methodologies, are fully described in the manuscript to ensure reproducibility.
Conflicts of Interest
The authors declared that there is no conflict of interest.
Appendix A. Risk Efficacy Scoring System (RESS)-Protocol and Calculation
Appendix A.1. Purpose
The RESS is a quantitative tool developed for this study to evaluate the quality and effectiveness of forensic accounting reports across 15 critical parameters. It transforms qualitative report attributes into a standardized, comparable score (0–100).
Appendix A.2. Parameters, Coding, and Weighting
The 15 parameters were grouped into three domains, each contributing a weighted percentage to the final RESS score. Each parameter was scored on a scale of 0–5 (0 = absent/poor, 5 = excellent).
| Domain (Weight) | Parameter | Description and Coding (0–5 Scale) | Weight |
| Detection and Analysis (40%) | 1. Speed of Detection | Time from risk emergence to identification (5 = pre-event, 3 = same day, 1 = +7 days, 0 = +30 days) | 10% |
| | 2. Analytical Depth | Use of advanced analytics (e.g., Benford’s Law, network analysis) | 8% |
| | 3. Evidence Robustness | Strength and variety of evidence (documentary, digital, testimonial) | 10% |
| | 4. Root Cause Analysis | Identification of underlying cause, not just symptoms | 6% |
| | 5. Fraud Triangle Application | Explicit assessment of Pressure, Opportunity, and Rationalization | 6% |
| Mitigation and Action (35%) | 6. Mitigation Effectiveness | Appropriateness and proven/potential success of recommended actions | 10% |
| | 7. Action Specificity | Recommendations are specific, actionable, and assigned | 8% |
| | 8. Timeliness of Action | Recommendations are feasible within a practical timeframe | 7% |
| | 9. Cost–Benefit Awareness | Consideration of implementation cost vs. risk impact | 5% |
| | 10. Future Prevention | Recommendations include controls to prevent recurrence | 5% |
| Communication and Clarity (25%) | 11. Structural Logic | Report is logically organized and easy to follow | 5% |
| | 12. Executive Summary Quality | Accurately encapsulates key findings and recommendations | 5% |
| | 13. Jargon-Free Language | Readable for a non-technical audience (linked to Flesch–Kincaid) | 5% |
| | 14. Data Visualization | Effective use of charts, graphs, and tables to present complex data | 5% |
| | 15. Stakeholder Focus | Alignment of content with the priorities of the primary stakeholder | 5% |
Appendix A.3. Calculation Formula
The overall RESS score is the weighted sum of all the parameter scores.
Appendix A.4. Working Example
A report received the following scores for three sample parameters:
Speed of Detection (Weight 10%): Score = 4 (risk detected 2 days pre-event)
Mitigation Effectiveness (Weight 10%): Score = 3 (actions are appropriate but untested)
Structural Logic (Weight 5%): Score = 5 (perfectly organized)
The contribution of these parameters to the total score is
This process was repeated for all 15 parameters, and the results were summed to obtain the final score (out of 100).
Appendix A.5. Validity and Reliability
Content Validity: Established through the Delphi panel review of the parameter set.
Intercoder Reliability: Two researchers independently scored 10 reports. Cohen’s κ was calculated for each parameter, with an average κ > 0.85, indicating excellent agreement.
Internal Consistency: Cronbach’s alpha for the three domains was as follows: detection (α = 0.78), mitigation (α = 0.81), and communication (α = 0.83).
Appendix B. Stakeholder Communication Index (SCI) Protocol and Calculation
Appendix B.1. Purpose
The SCI quantifies the clarity, actionability, and legal robustness of forensic accounting reports to predict their efficacy in maintaining stakeholder trust and retention.
Appendix B.2. The Four Pillars and Scoring
Each pillar is scored on a 0–25-point scale based on specific criteria. The total SCI was the sum of the four pillar scores (0–100).
| Pillar | Scoring Criteria (0–25 Points) |
| 1. Precision and Correctness (25 pts) | 20–25: Zero factual errors; all data sources impeccably cited. 10–19: Minor, inconsequential errors; adequate citation. 0–9: Major errors or uncited data undermining conclusions.
|
| 2. Systematic Presentation (25 pts) | 20–25: Logical flow from executive summary to appendix; clear signposting. 10–19: Generally logical but requires effort to follow. 0–9: Disorganized and difficult to comprehend.
|
| 3. Actionable Recommendations (25 pts) | 20–25: Recommendations are Specific, Measurable, Achievable, Relevant, and Time-bound (SMART). 10–19: Recommendations are general but actionable. 0–9: Recommendations are vague or theoretical.
|
| 4. Legal Framework Alignment (25 pts) | 20–25: Explicitly links findings to relevant laws/standards (e.g., Companies Act, ICAI standards); evidence is court-admissible. 10–19: Implicit alignment; evidence may require processing for admission. 0–9: No consideration of legal context; evidence collected improperly.
|
Appendix B.3. Calculation Formula
Appendix B.4. Working Example
This report was assessed as follows:
Pillar 1 (Precision): 22/25 (no errors, minor citation oversight)
Pillar 2 (Presentation): 18/25 (logical but lengthy executive summary)
Pillar 3 (Recommendations): 20/25 (mostly SMART, one recommendation is vague)
Pillar 4 (Legal Alignment): 25/25 (exemplary adherence to ICAI standards)
Appendix B.5. Validity and Reliability
Construct Validity: Strong positive correlation with client retention (r = 0.83, p < 0.01) established predictive validity.
Intercoder Reliability: Two coders achieved an intraclass correlation coefficient (ICC) of 0.91 for total SCI scores across a subset of 15 reports.
Appendix C. Risk Latency Index (RLI)-Protocol and Calculation
Appendix C.1. Purpose
RLI measures the efficiency of a firm’s risk detection processes. It is defined as the average number of days between when a risk first becomes detectable (t0) and when it is formally identified and reported by a firm.
Appendix C.2. Definition of t0 (Temporal Reference Point)
For this study, t0 was established retroactively through post-engagement analysis as the earliest date on which a reasonable and prudent application of the tools and data available to the firm at the time could have identified the anomaly that led to the risk event. This was determined by the unanimous agreement between the two senior researchers.
Appendix C.3. Calculation Formula
The RLI for a single engagement is calculated as
The overall RLI for a firm or group is the mean of the RLIs across all the assessed engagements.
A negative RLI indicates pre-event detection (e.g., −9 days).
A positive RLI indicates post-event detection (e.g., +47 days).
A lower (more negative) RLI signifies a superior detection efficiency.
Appendix C.4. Working Example
Risk Event: A fraudulent transaction.
t0 (Earliest Detectable Date): 1 June 2024 (anomaly appeared in daily transaction logs).
Date of formal identification: 10 June 2024 (included in weekly forensic reports).
RLI = (10 June) − (1 June) = +9 days.
This positive value indicates reactive detection 9 days after the risk was detectable.
Appendix C.5. Validity
Face Validity: This metric is a direct and intuitive measure of detection speed.
Criterion Validity: RLI strongly correlates with technological adoption (e.g., firms using AI have negative RLIs) and firm size (r = −0.41, p < 0.05), validating its ability to discriminate between different operational postures.
References
- ACFE. (2024). The nations occupational fraud 2024: 2 foreword occupational fraud 2024: A report to the nations. ACFE. [Google Scholar]
- Alkhalaileh, R. I., Alshurafat, H., & Al-Hazaima, H. (2024). Divergence and convergence of salient stakeholders’ perceptions toward forensic accounting education: Importance, obstacles and pedagogies. Journal of Business and Socio-Economic Development, 4(2), 127–141. [Google Scholar] [CrossRef]
- Bansal, M., & Sharma, M. (2016). Audit committee, corporate governance and firm performance: Empirical evidence from India. International Journal of Economics and Finance, 8(3), 103. [Google Scholar] [CrossRef]
- Beasley, M., Branson, B., & Pagach, D. (2015). An analysis of the maturity and strategic impact of investments in ERM. Journal of Accounting and Public Policy, 34(3), 219–243. [Google Scholar] [CrossRef]
- Blair, G., Woodcock, H., Pagano, R., & Endlar, L. (2024). Constructing a risk management framework to protect the organization. Journal of UTEC Engineering Management, 2(1), 113–124. [Google Scholar] [CrossRef]
- Braun, V., & Clarke, V. (2006). Using thematic analysis in psychology. Qualitative Research in Psychology, 3(2), 77–101. [Google Scholar] [CrossRef]
- Breeden, J. L. (2023). Impacts of drought on loan repayment. Journal of Risk and Financial Management, 16(2), 85. [Google Scholar] [CrossRef]
- Chu, M. K., & Yong, K. O. (2021). Big data analytics for business intelligence in accounting and audit. Open Journal of Social Sciences, 9(9), 42–52. [Google Scholar] [CrossRef]
- Cohen, J., Krishnamoorthy, G., & Wright, A. (2017). Enterprise risk management and the financial reporting process: The experiences of audit committee members, CFOs, and external auditors. Contemporary Accounting Research, 34(2), 1178–1209. [Google Scholar] [CrossRef]
- Creswell, J. W., & Creswell, J. D. (2018). Research design: Qualitative, quantitative, and mixed methods approaches (5th ed.). SAGE Publication. [Google Scholar]
- Desi, A., Akintoye, R. I., & Aguguom, T. A. (2023). Forensic accounting, a veritable financial tool for qualitative financial reporting systems in the 21st century. International Journal of Professional Business Review, 8(6), e02342. [Google Scholar] [CrossRef]
- Eaton, T. V., Grenier, J. H., & Layman, D. (2019). Accounting and cybersecurity risk management. In Current issues in auditing (Vol. 13, Issue 2, pp. C1–C9). American Accounting Association. [Google Scholar] [CrossRef]
- Ernst, & Young. (2016). Shifting into high gear: Mitigating risks and demonstrating returns: Global forensic data analytics survey 2016. Available online: https://m.advisorselect.com/index.php/Ernst-&-Young-Data,-Review,-Analysis/global-forensic-data-analytics-survey-2016-shifting-into-high-gear/global-forensic-data-analytics-survey-2016-shifting-into-high-gear/Presentation (accessed on 10 July 2025).
- Estensoro, M., Larrea, M., Müller, J. M., & Sisti, E. (2022). A resource-based view on SMEs regarding the transition to more sophisticated stages of industry 4.0. European Management Journal, 40(5), 778–792. [Google Scholar] [CrossRef]
- Fetters, M. D., Curry, L. A., & Creswell, J. W. (2013). Achieving integration in mixed methods designs—Principles and practices. Health Services Research, 48(6 PART2), 2134–2156. [Google Scholar] [CrossRef] [PubMed]
- Hennink, M., & Kaiser, B. N. (2022). Sample sizes for saturation in qualitative research: A systematic review of empirical tests. Social Science and Medicine, 292, 114523. [Google Scholar] [CrossRef] [PubMed]
- IIA. (2016). International standards for the professional practice of internal auditing (Standards). Available online: www.globaliia.org (accessed on 10 August 2025).
- Indarto, S. L., & Ghozali, I. (2016). Fraud diamond: Detection analysis on the fraudulent financial reporting. Risk Governance & Control: Financial Markets & Institutions, 6(4-1), 116–123. [Google Scholar] [CrossRef]
- Kabir, L. S., & Rakov, I. D. (2023). Russian companies’ motivations for making green investments. Journal of Risk and Financial Management, 16(3), 145. [Google Scholar] [CrossRef]
- Levitt, H. M., Bamberg, M., Creswell, J. W., Frost, D. M., Josselson, R., & Suárez-Orozco, C. (2018). Journal article reporting standards for qualitative research in psychology: The APA publications and communications board task force report. American Psychologist, 73(1), 26–46. [Google Scholar] [CrossRef] [PubMed]
- Louati, H., Louati, A., Almekhlafi, A., ElSaka, M., Alharbi, M., Kariri, E., & Altherwy, Y. N. (2024). Adopting artificial intelligence to strengthen legal safeguards in blockchain smart contracts: A strategy to mitigate fraud and enhance digital transaction security. Journal of Theoretical and Applied Electronic Commerce Research, 19(3), 2139–2156. [Google Scholar] [CrossRef]
- Mazzei, M. J., DeBode, J., Gangloff, K. A., & Song, R. (2025). Old habits die hard: A review and assessment of the threat-rigidity literature. Journal of Management, 51(6), 2154–2181. [Google Scholar] [CrossRef]
- Ozili, P. (2015). Forensic accounting and fraud: A review of literature and policy implications. International Journal of Accounting and Economics Studies, 3(1), 63–68. [Google Scholar] [CrossRef]
- Prime Database Group. (2023). NSE 500: An analysis of audit fee & concentration. Available online: https://www.scribd.com/document/848779945/INDIAN-BIG-5-AUDIT-FIRMS-DOMINATE-AUDIT-OF-TOP-500-LISTED-COMPANIES-IN-2022-23 (accessed on 14 September 2025).
- PwC. (2022). Global economic crime and fraud survey 2022. Available online: https://www.pwc.com/gx/en/forensics/gecsm-2022/pdf/PwC%E2%80%99s-Global-Economic-Crime-and-Fraud-Survey-2022.pdf (accessed on 18 August 2025).
- Spira, L. F., & Page, M. (2003). Risk management: The reinvention of internal control and the changing role of internal audit. Accounting, Auditing & Accountability Journal, 16(4), 640–661. [Google Scholar] [CrossRef]
| Disclaimer/Publisher’s Note: The statements, opinions and data contained in all publications are solely those of the individual author(s) and contributor(s) and not of MDPI and/or the editor(s). MDPI and/or the editor(s) disclaim responsibility for any injury to people or property resulting from any ideas, methods, instructions or products referred to in the content. |