Investor Sentiment and Market Volatility Across Quantiles: Evidence from Vietnam


Abstract
1. Introduction
2. Literature Review
3. Methodology
3.1. Quantile Causality Test
3.2. Quantile Regression Specification
3.3. Quantile VAR (QVAR) Model
3.4. Statistical Inference
4. Data
5. Empirical Results
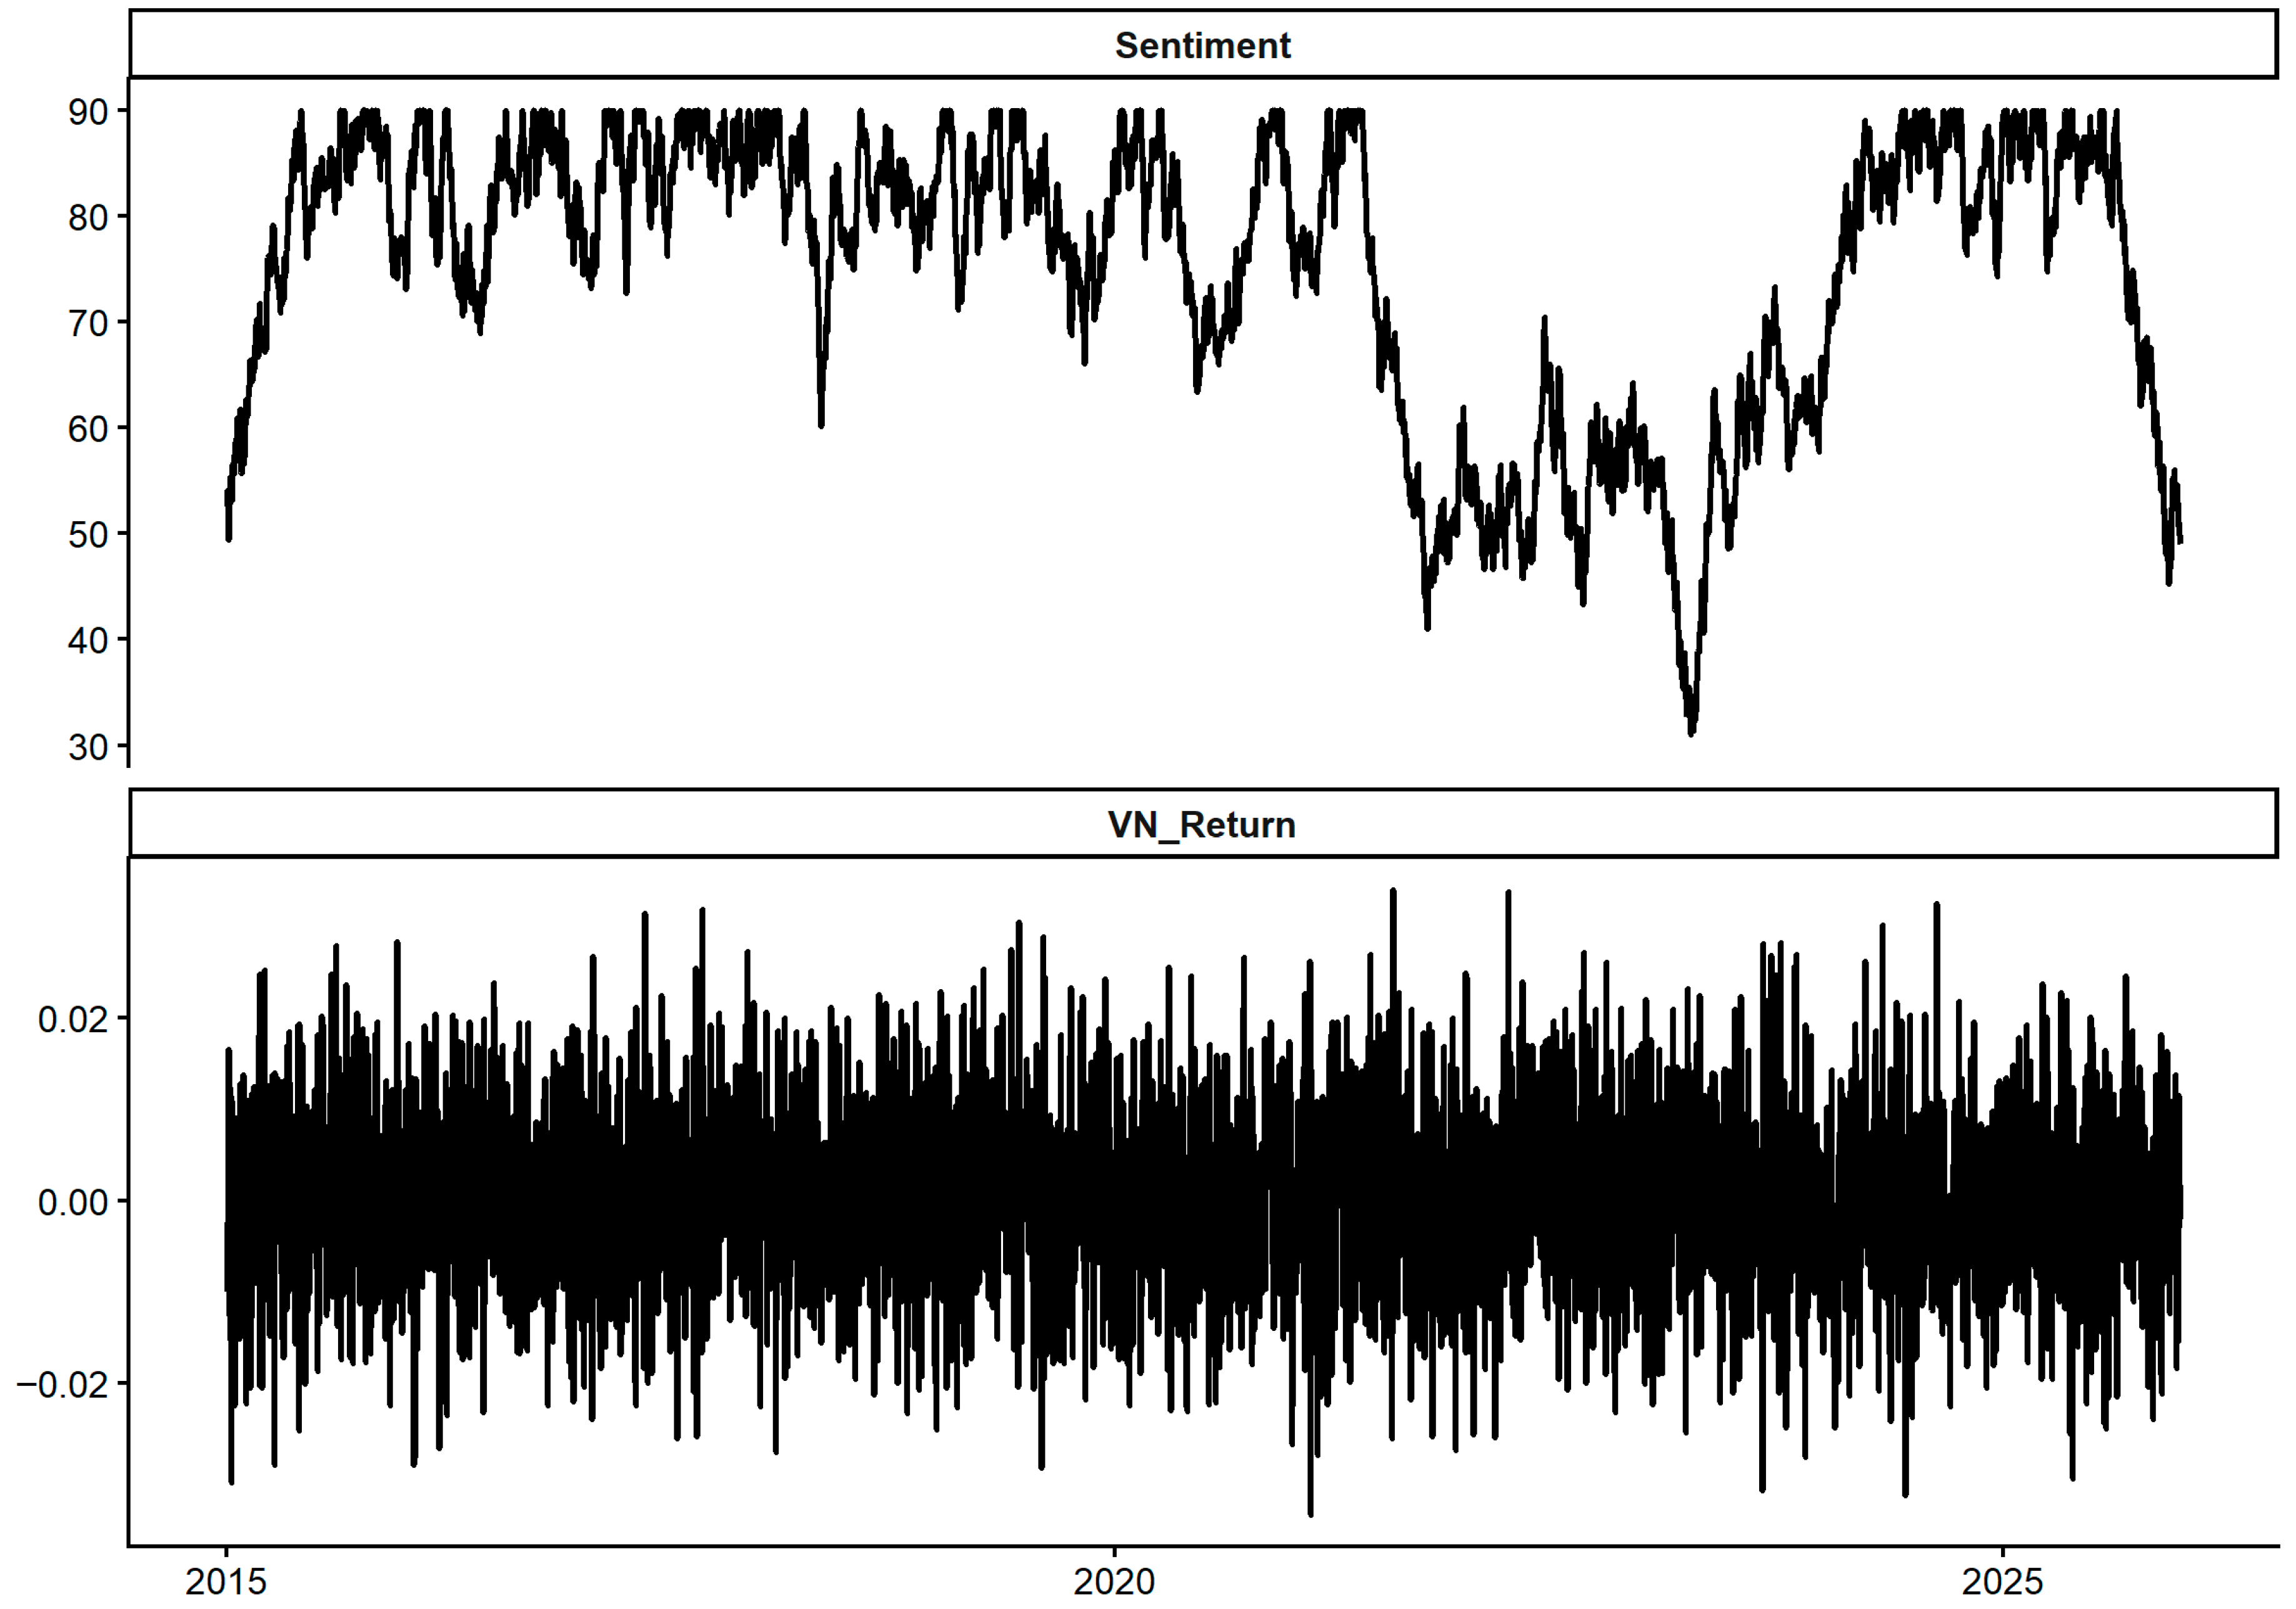
5.1. Descriptive Statistics and Preliminary Tests
5.2. Quantile Causality from Investor Sentiment to Stock Returns
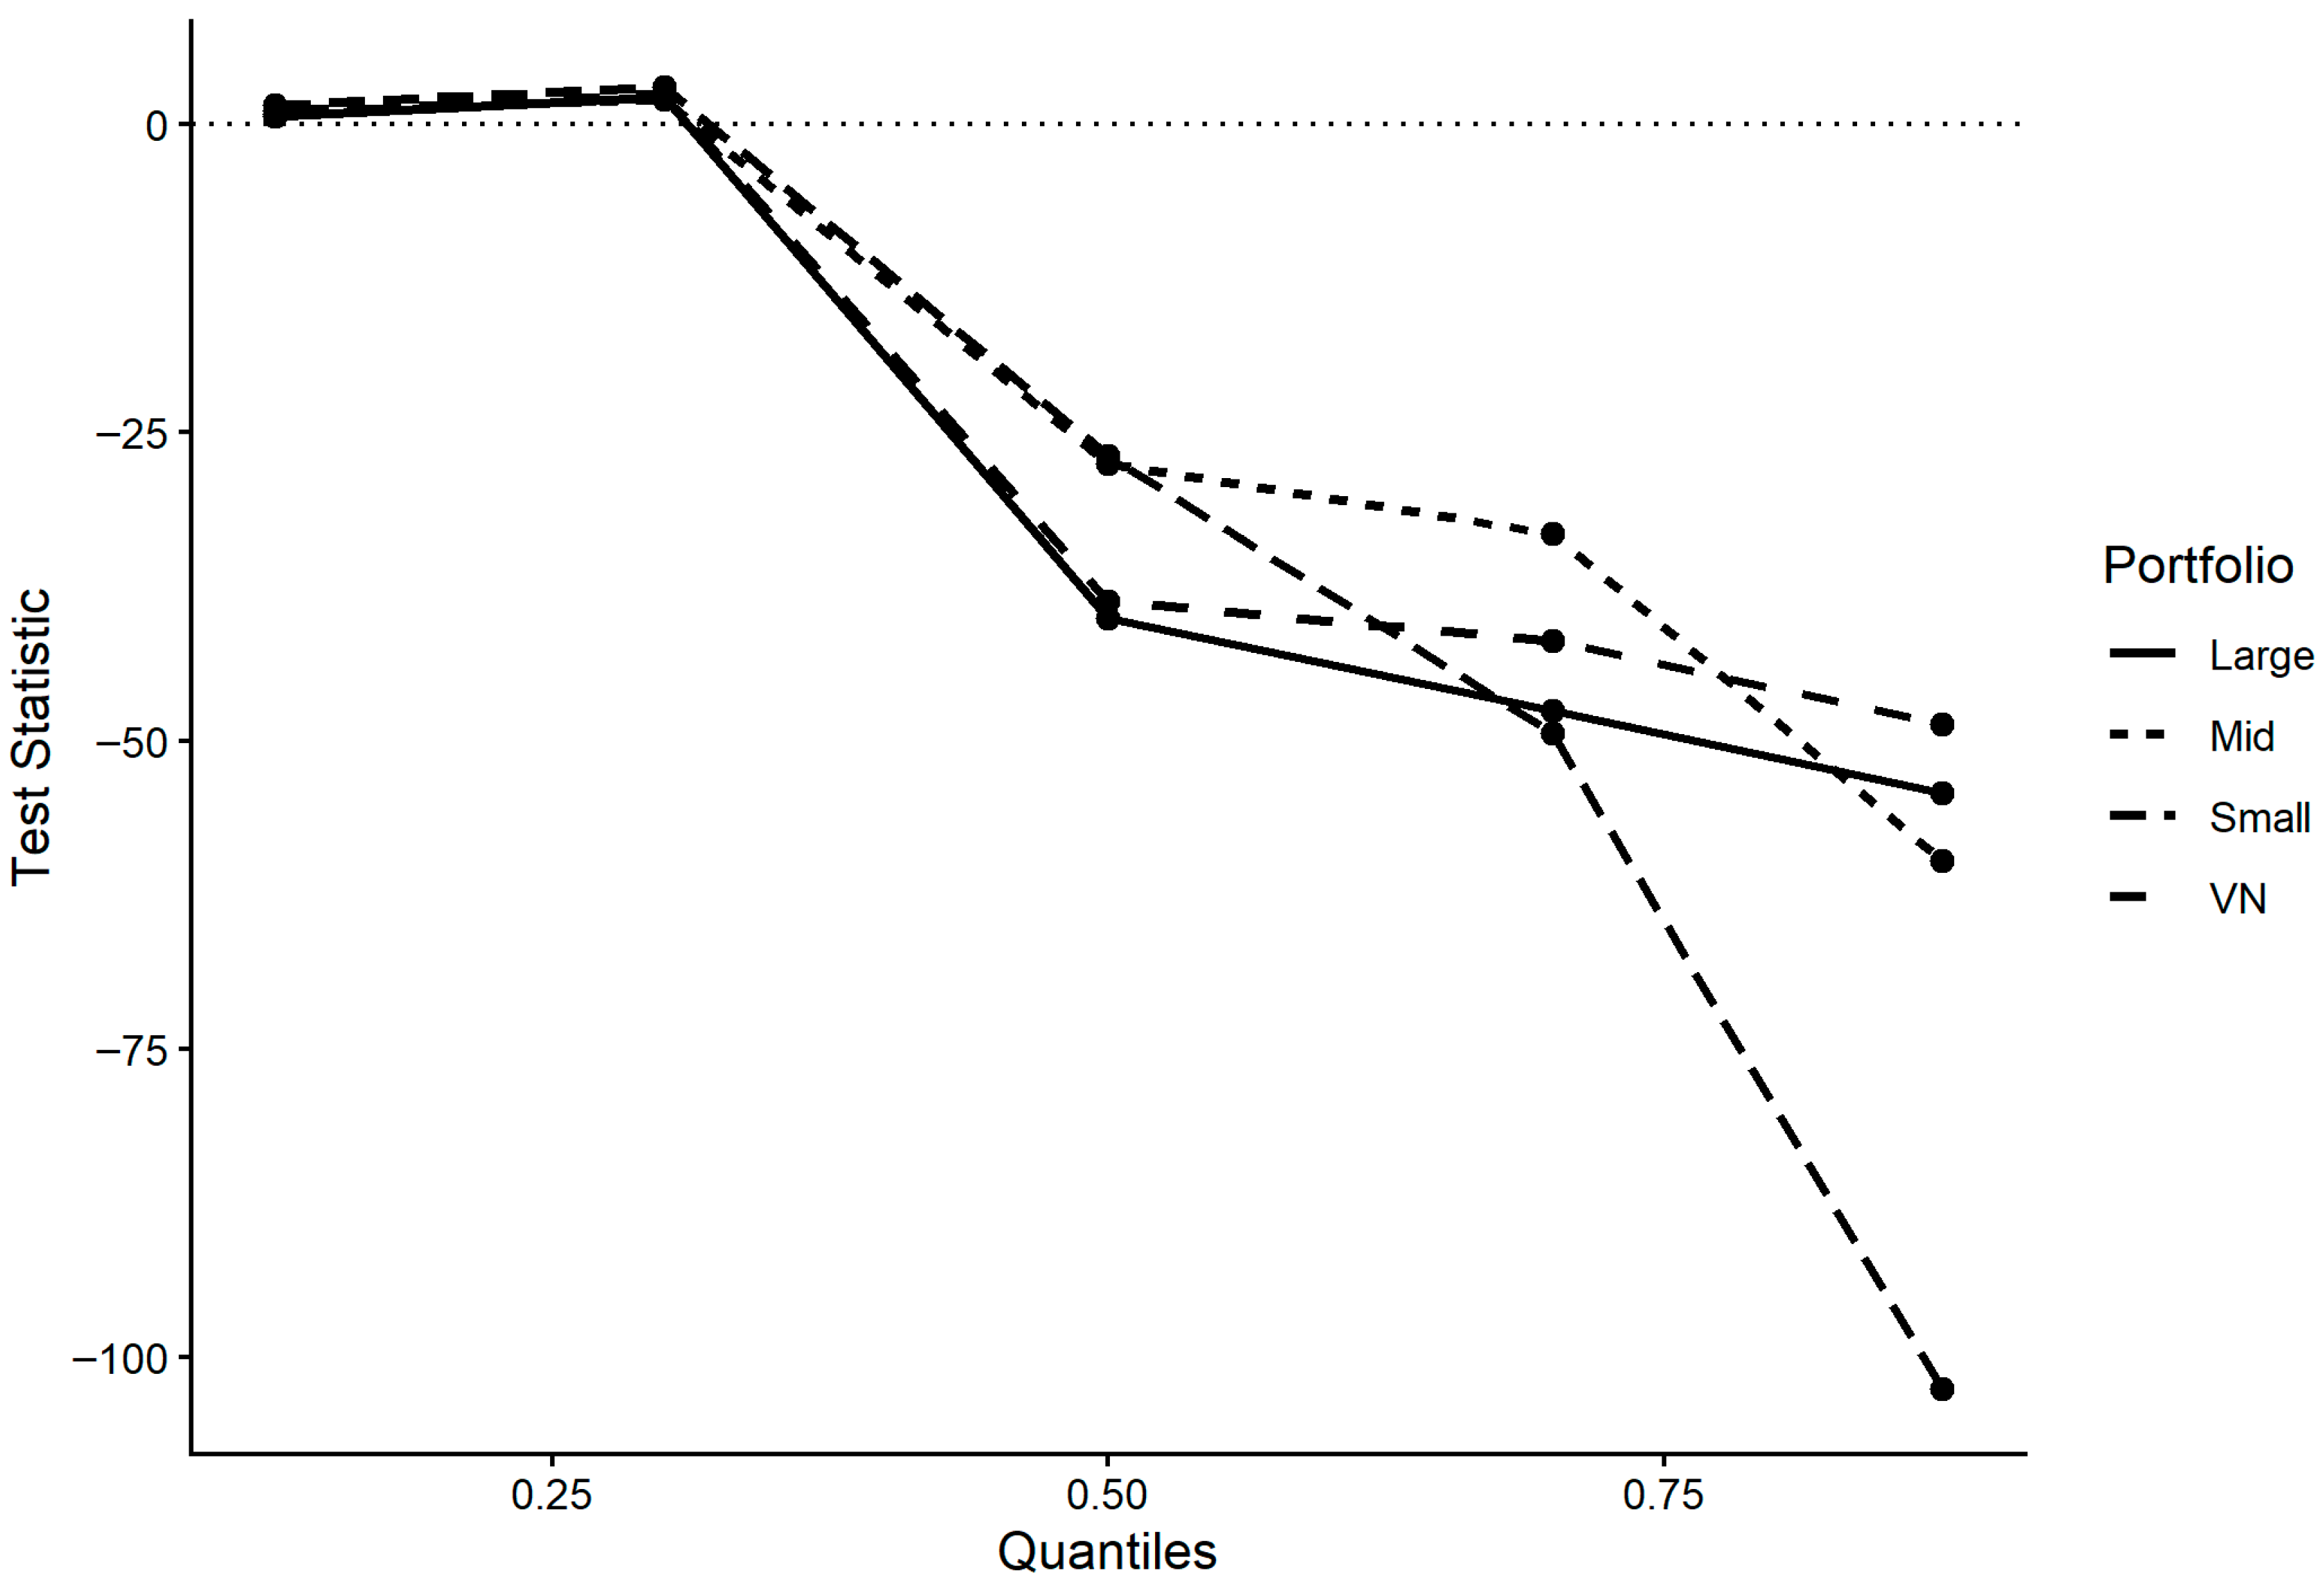
5.3. Reverse Causality: Stock Returns to Investor Sentiment
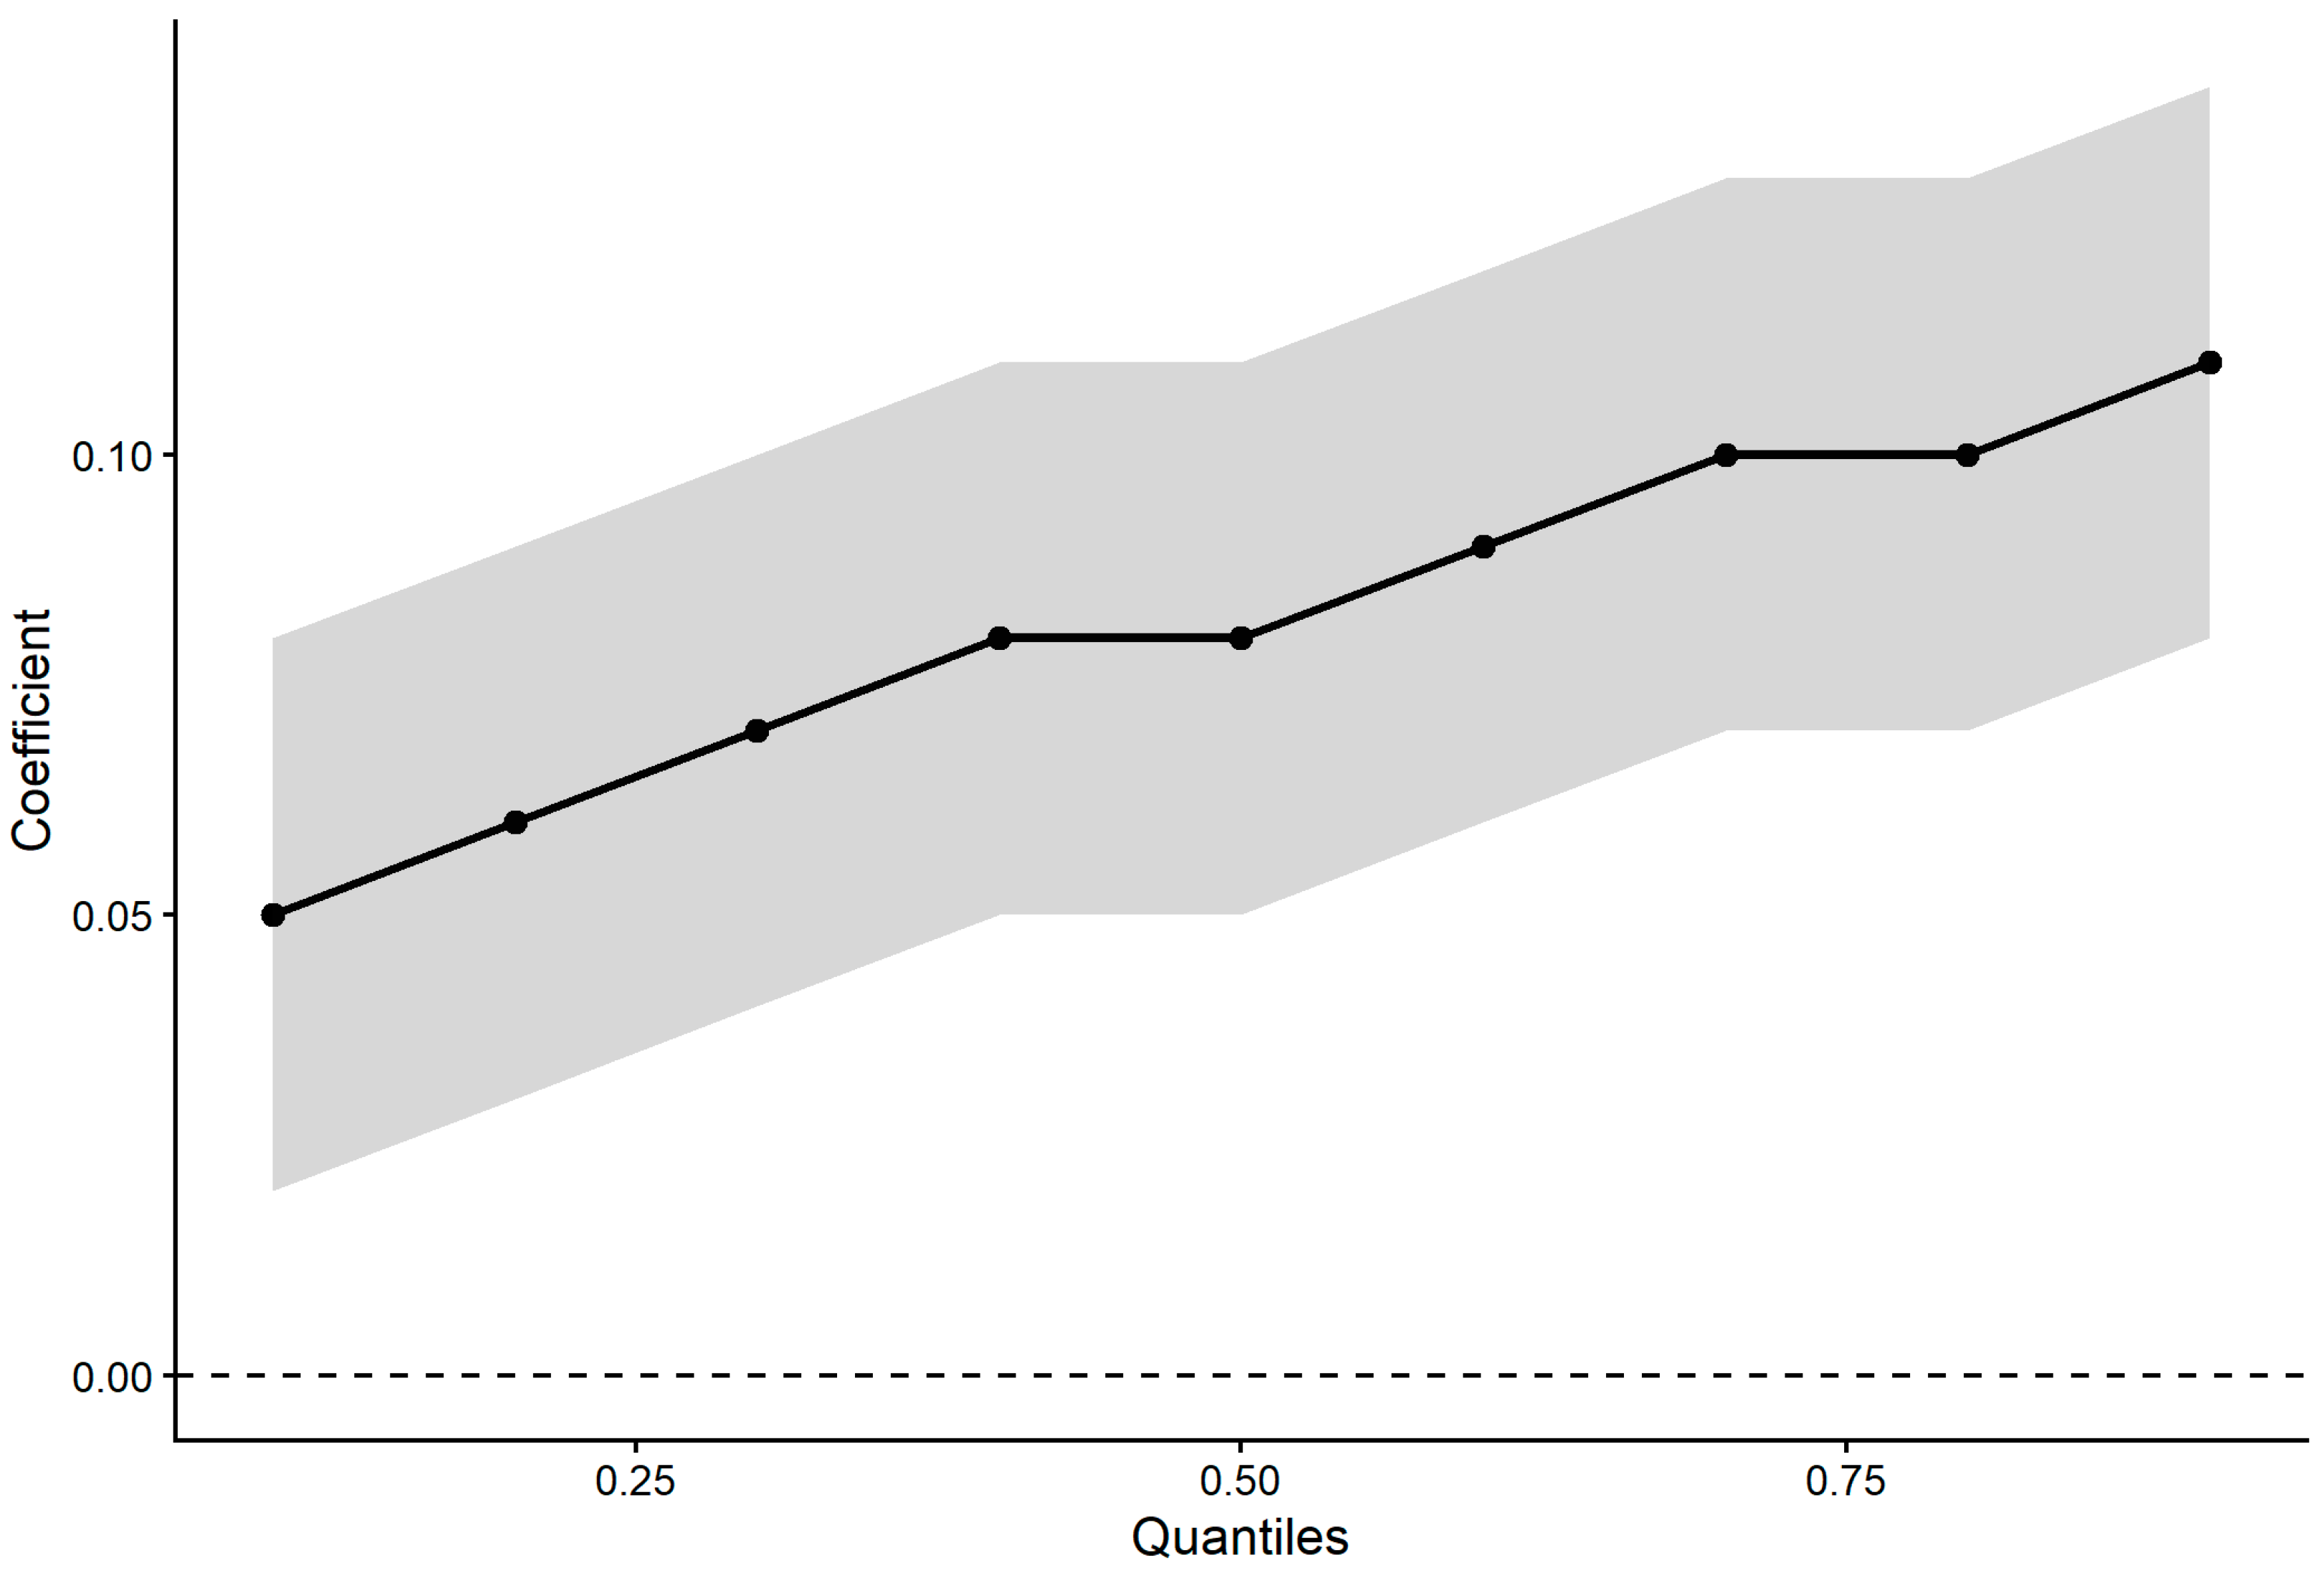
5.4. Additional Evidence from the QVAR Model
5.5. Investor Sentiment and Market Volatility
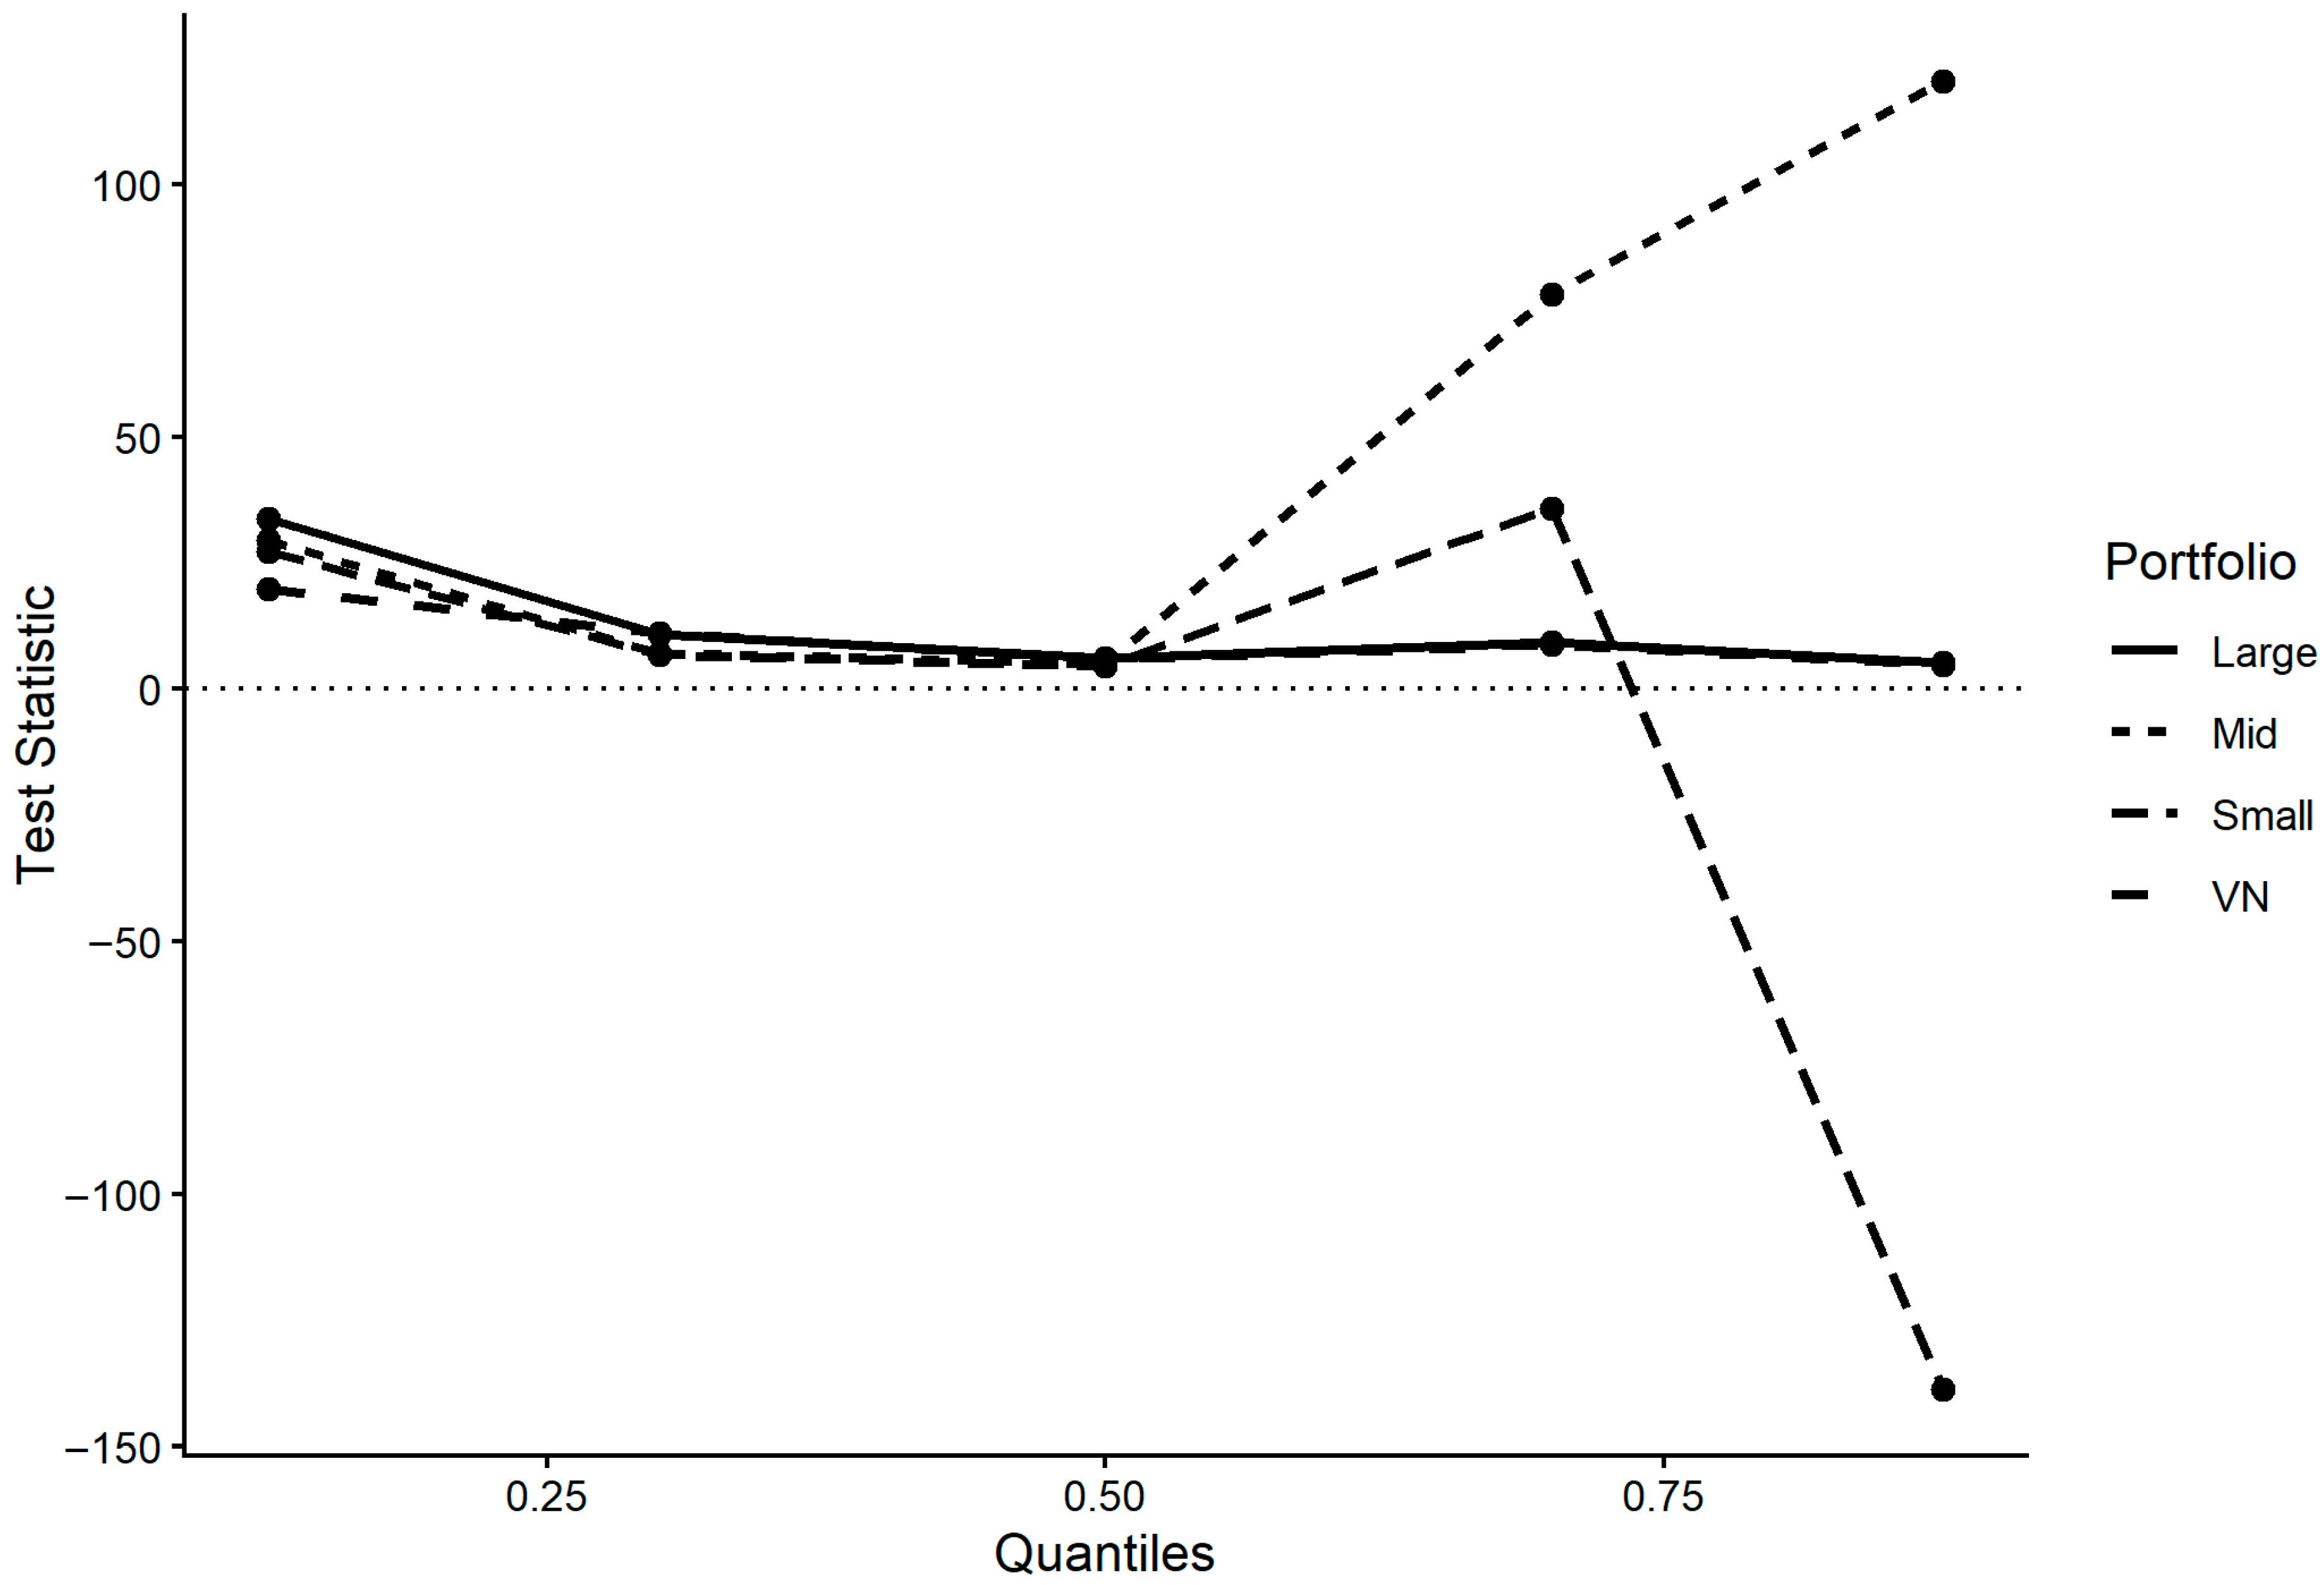
5.6. Reverse Causality: Volatility to Investor Sentiment
6. Robustness Checks
7. Conclusions
Funding
Institutional Review Board Statement
Informed Consent Statement
Data Availability Statement
Conflicts of Interest
References
- Abudy, M., Mugerman, Y., & Shust, E. (2022). The winner takes it all: Investor sentiment and the Eurovision Song Contest. Journal of Banking & Finance, 137, 106432. [Google Scholar] [CrossRef] [Scilit]
- Baker, M., & Wurgler, J. (2006). Investor sentiment and the cross-section of stock returns. Journal of Finance, 61(4), 1645–1680. [Google Scholar] [CrossRef] [Scilit]
- Baker, S. R., Bloom, N., Davis, S. J., & Terry, S. J. (2020). Covid-induced economic uncertainty (No. w26983). National Bureau of Economic Research. Available online: https://www.nber.org/papers/w26983 (accessed on 29 March 2026).
- Balcilar, M., Gupta, R., & Pierdzioch, C. (2017). Does uncertainty move the gold price? New evidence from a nonparametric causality-in-quantiles test. Resources Policy, 53, 227–235. [Google Scholar] [CrossRef] [Scilit]
- Barberis, N., Shleifer, A., & Vishny, R. (1998). A model of investor sentiment. Journal of Financial Economics, 49(3), 307–343. [Google Scholar] [CrossRef] [Scilit]
- Biswas, P., & Sharma, C. (2025). Does fear sentiment drive cryptocurrency volatility? Evidence from Google trends data. Finance Research Letters, 86, 108510. [Google Scholar] [CrossRef] [Scilit]
- Black, F. (1986). Noise. Journal of Finance, 41(3), 528–543. [Google Scholar] [CrossRef]
- Bollen, J., Mao, H., & Zeng, X. (2011). Twitter mood predicts the stock market. Journal of Computational Science, 2(1), 1–8. [Google Scholar] [CrossRef] [Scilit]
- Brown, G. W., & Cliff, M. T. (2004). Investor sentiment and the near-term stock market. Journal of Empirical Finance, 11(1), 1–27. [Google Scholar] [CrossRef] [Scilit]
- Brown, G. W., & Cliff, M. T. (2005). Investor sentiment and asset valuation. Journal of Business, 78(2), 405–440. [Google Scholar] [CrossRef] [Scilit]
- Chen, M. P., Chen, P. F., & Lee, C. C. (2013). Asymmetric effects of investor sentiment on industry stock returns: Panel data evidence. Emerging Markets Review, 14, 35–54. [Google Scholar] [CrossRef] [Scilit]
- Chen, Z., Liu, B., Wang, H., Wang, Z., & Yu, J. (2025). Investor sentiment and the pricing of characteristics-based factors. The Review of Financial Studies, 38(12), 3580–3625. [Google Scholar] [CrossRef] [Scilit]
- Da, Z., Engelberg, J., & Gao, P. (2015). The sum of all FEARS: Investor sentiment and asset prices. Review of Financial Studies, 28(1), 1–32. [Google Scholar] [CrossRef] [Scilit]
- Dai, J. (2025). The relationship between investor sentiment and stock returns under big data. Advances in Economics, Management and Political Sciences, 166(1), 82–89. [Google Scholar] [CrossRef] [Scilit]
- Daniel, K., Hirshleifer, D., & Subrahmanyam, A. (1998). Investor psychology and security market under- and overreactions. Journal of Finance, 53(6), 1839–1885. [Google Scholar] [CrossRef] [Scilit]
- Del Nero, L., & Giudici, P. (2025). Machine learning models to predict stock market spillovers. Finance Research Letters, 86, 108508. [Google Scholar] [CrossRef] [Scilit]
- De Long, J. B., Shleifer, A., Summers, L. H., & Waldmann, R. J. (1990a). Noise trader risk in financial markets. Journal of Political Economy, 98(4), 703–738. [Google Scholar] [CrossRef] [Scilit]
- De Long, J. B., Shleifer, A., Summers, L. H., & Waldmann, R. J. (1990b). Positive feedback investment strategies and destabilizing rational speculation. Journal of Finance, 45(2), 379–395. [Google Scholar] [CrossRef] [Scilit]
- Fama, E. F. (1965). The behavior of stock market prices. Journal of Business, 38(1), 34–105. [Google Scholar] [CrossRef] [Scilit]
- Fisher, K. L., & Statman, M. (2000). Investor sentiment and stock returns. Financial Analysts Journal, 56(2), 16–23. [Google Scholar] [CrossRef] [Scilit]
- Huang, D., Jiang, F., Tu, J., & Zhou, G. (2020). Investor sentiment aligned: A powerful predictor of stock returns. Review of Financial Studies, 33(4), 1682–1720. [Google Scholar] [CrossRef] [Scilit]
- Jeong, K., Härdle, W. K., & Song, S. (2012). A consistent nonparametric test for causality in quantile. Econometric Theory, 28(4), 861–887. [Google Scholar] [CrossRef] [Scilit]
- Kahneman, D., & Tversky, A. (1979). Prospect theory: An analysis of decision under risk. Econometrica, 47(2), 263–291. [Google Scholar] [CrossRef] [Scilit]
- Klemola, A. (2020). Internet search-based investor sentiment and value premium. Finance Research Letters, 33, 101224. [Google Scholar] [CrossRef] [Scilit]
- Koenker, R., & Bassett, G., Jr. (1978). Regression quantiles. Econometrica: Journal of the Econometric Society, 46, 33–50. [Google Scholar] [CrossRef] [Scilit]
- Koenker, R., & Machado, J. A. (1999). Goodness of fit and related inference processes for quantile regression. Journal of the American Statistical Association, 94(448), 1296–1310. [Google Scholar] [CrossRef]
- Koh, K. (2025). The impact of investor sentiment on stock returns in developed and emerging markets: The case of US and South Korea. Emerging Markets Finance and Trade, 1–24. [Google Scholar] [CrossRef] [Scilit]
- Lee, W. Y., Jiang, C. X., & Indro, D. C. (2002). Stock market volatility, excess returns, and the role of investor sentiment. Journal of Banking & Finance, 26(12), 2273–2289. [Google Scholar] [CrossRef] [Scilit]
- Li, B., Chan, K. C., Ou, C., & Ruifeng, S. (2017). Discovering public sentiment in social media for predicting stock movement of publicly listed companies. Information Systems, 69, 81–92. [Google Scholar] [CrossRef] [Scilit]
- Naeem, M. A., Farid, S., Nor, S. M., & Shahzad, S. J. H. (2021). Spillover and drivers of uncertainty among oil and commodity markets. Mathematics, 9, 441. [Google Scholar] [CrossRef] [Scilit]
- Neal, R., & Wheatley, S. M. (1998). Do measures of Investor Sentiment Predict Returns? Journal of Financial and Quantitative Analysis, 33, 523–547. [Google Scholar] [CrossRef] [Scilit]
- Negi, P., Kushwah, S. V., Jaiswal, A., & Rekunenko, I. (2025). Investor sentiment, market volatility, and ESG Index dynamics: An empirical analysis. Cogent Economics & Finance, 13(1), 2526721. [Google Scholar] [CrossRef] [Scilit]
- Ni, Z. X., Wang, D. Z., & Xue, W. J. (2015). Investor sentiment and its nonlinear effect on stock returns—New evidence from the Chinese stock market based on panel quantile regression model. Economic Modelling, 50, 266–274. [Google Scholar] [CrossRef] [Scilit]
- Pham, T. D., & Pham, D. K. (2025). Noise trader risk and its effect on market volatility: Evidence from Vietnam’s stock market. International Journal of Advanced and Applied Sciences, 12(4), 193–199. [Google Scholar] [CrossRef] [Scilit]
- Schmeling, M. (2009). Investor sentiment and stock returns. Journal of Empirical Finance, 16(3), 394–408. [Google Scholar] [CrossRef] [Scilit]
- Sethi, H., & Gupta, R. (2025). Artificial intelligence-based sentiment analysis models in the product and service industry: A state-of-the-art review and future directions. SN Computer Science, 6, 774. [Google Scholar] [CrossRef] [Scilit]
- Shahzad, S. J. H., Bouri, E., Roubaud, D., & Kristoufek, L. (2021). Safe haven, hedge and diversification for G7 stock markets: Gold versus Bitcoin. Economic Modelling, 87, 212–224. [Google Scholar] [CrossRef] [Scilit]
- Shiller, R. J., Fischer, S., & Friedman, B. M. (1984). Stock prices and social dynamics. Brookings Papers on Economic Activity, 1984(2), 457–510. [Google Scholar] [CrossRef] [Scilit]
- Shleifer, A., & Summers, L. H. (1990). The noise trader approach to finance. Journal of Economic Perspectives, 4(2), 19–33. [Google Scholar] [CrossRef] [Scilit]
- Smales, L. A. (2017). The importance of fear: Investor sentiment and stock market returns. Applied Economics, 49(34), 3395–3421. [Google Scholar] [CrossRef] [Scilit]
- Solt, M. E., & Statman, M. (1989). Good companies, bad stocks. Journal of Portfolio Management, 15(4), 39. [Google Scholar] [CrossRef] [Scilit]
- Todd, A., Bowden, J., & Moshfeghi, Y. (2024). Text-based sentiment analysis in finance: Synthesising the existing literature and exploring future directions. Intelligent Systems in Accounting, Finance and Management, 31(1), e1549. [Google Scholar] [CrossRef] [Scilit]
- Verma, R., & Verma, P. (2007). Noise trading and stock market volatility. Journal of Multinational Financial Management, 17(3), 231–243. [Google Scholar] [CrossRef] [Scilit]
- Yang, M., Hong, Y., & Yang, F. (2022). The effects of Mandatory Energy Efficiency Policy on resource allocation efficiency: Evidence from Chinese industrial sector. Economic Analysis and Policy, 73, 513–524. [Google Scholar] [CrossRef] [Scilit]
- Zhang, D., Zhang, J., Zhang, Y., & Wu, Y. (2021). Sentiment analysis of China’s education policy online opinion based on text mining. In 2021 9th international conference on information and education technology (ICIET) (pp. 73–77). IEEE. [Google Scholar] [CrossRef] [Scilit]



| Variable | Mean | Min | Max | Std. Dev | Skewness | Kurtosis | JB (p-Value) | ADF | PP |
|---|---|---|---|---|---|---|---|---|---|
| Sentiment Index | 52.84 | 18.23 | 89.67 | 14.92 | 0.21 | 2.35 | 0.000 | −6.842 *** | −6.731 *** |
| VN-Index Return | 0.00052 | −0.041 | 0.038 | 0.0112 | −0.18 | 6.12 | 0.000 | −12.384 *** | −12.102 *** |
| Large Cap Return | 0.00049 | −0.039 | 0.036 | 0.0105 | −0.12 | 5.98 | 0.000 | −11.982 *** | −11.745 *** |
| Mid Cap Return | 0.00071 | −0.052 | 0.045 | 0.0138 | 0.34 | 7.21 | 0.000 | −10.447 *** | −10.322 *** |
| Small Cap Return | 0.00079 | −0.061 | 0.058 | 0.0165 | 0.51 | 8.94 | 0.000 | −9.884 *** | −9.765 *** |
| Quantile | VN-Index | Large Cap | Mid Cap | Small Cap |
|---|---|---|---|---|
| 0.05–0.20 | 14.82 ** (+) | 18.95 *** (+) | 32.47 *** (+) | 48.12 *** (+) |
| 0.20–0.40 | 5.27 (ns) | 6.14 (ns) | 21.33 *** (+) | 19.84 ** (−) |
| 0.40–0.60 | 8.11 ** (+) | 6.92 (ns) | 5.88 (ns) | 7.45 ** (−) |
| 0.60–0.80 | 22.63 *** (+) | 26.74 *** (+) | 11.92 ** (+) | 6.88 (ns) |
| 0.80–0.95 | 35.91 *** (−) | 34.77 *** (−) | 24.63 *** (−) | 33.58 *** (−) |
| Quantile | VN-Index | Large Cap | Mid Cap | Small Cap |
|---|---|---|---|---|
| 0.05–0.20 | 82.41 *** (+) | 71.33 *** (+) | 55.12 *** (+) | 58.27 *** (+) |
| 0.20–0.40 | 69.25 *** (+) | 63.11 *** (+) | 52.77 *** (+) | 49.18 *** (+) |
| 0.40–0.60 | 64.88 *** (+) | 67.45 *** (+) | 48.92 *** (+) | 44.61 *** (+) |
| 0.60–0.80 | 51.73 *** (+) | 70.22 *** (+) | 53.66 *** (+) | 42.08 *** (+) |
| 0.80–0.95 | 58.96 *** (+) | 104.37 *** (+) | 97.84 *** (+) | 62.45 *** (+) |
| Quantile | VN-Index | Large Cap | Mid Cap | Small Cap |
|---|---|---|---|---|
| 0.05–0.20 | 0.81 (ns) | 0.64 (ns) | 1.12 (ns) | 1.55 (ns) |
| 0.20–0.40 | 2.44 (ns) | 2.18 (ns) | 1.96 (ns) | 3.02 (ns) |
| 0.40–0.60 | 38.74 *** (−) | 40.11 *** (−) | 27.53 *** (−) | 26.89 *** (−) |
| 0.60–0.80 | 41.92 *** (−) | 47.55 *** (−) | 33.21 *** (−) | 49.37 *** (−) |
| 0.80–0.95 | 48.63 *** (−) | 54.28 *** (−) | 59.74 *** (−) | 102.55 *** (−) |
| Quantile | VN-Index | Large Cap | Mid Cap | Small Cap |
|---|---|---|---|---|
| 0.05–0.20 | 19.72 *** (+) | 33.81 *** (+) | 29.45 *** (+) | 27.33 *** (+) |
| 0.20–0.40 | 11.04 ** (+) | 10.82 ** (+) | 7.12 ** (+) | 6.84 (ns) |
| 0.40–0.60 | 5.92 (ns) | 6.11 (ns) | 5.03 (ns) | 4.66 (ns) |
| 0.60–0.80 | 8.77 ** (+) | 9.33 ** (+) | 78.12 *** (+) | 35.66 *** (+) |
| 0.80–0.95 | 4.88 (ns) | 5.12 (ns) | 120.45 *** (+) | 138.72 *** (−) |
| Specification | Return Q10 | Return Q50 | Return Q90 | Vol Q10 | Vol Q50 | Vol Q90 |
|---|---|---|---|---|---|---|
| Baseline | 0.00001874 | 0.00001791 | −0.00002086 | −0.00003572 | 0.00001184 | −0.00005361 |
| No Vol | 0.00001869 | 0.00001788 | −0.00002079 | −0.00003565 | 0.00001179 | −0.00005348 |
| No Return | 0.00001742 | 0.00001796 | −0.00000438 | −0.00003987 | 0.00001267 | −0.00004492 |
| Lagged | 0.00001851 | 0.00001642 | −0.00002094 | −0.00003974 | 0.00001123 | −0.00004987 |
| Sub-Sample | Return Q10 | Return Q50 | Return Q90 | Volatility Q10 | Volatility Q50 | Volatility Q90 |
|---|---|---|---|---|---|---|
| 2015–2019 (Pre-COVID-19) | 0.000016 ** | 0.000014 * | −0.000018 ** | −0.000031 ** | 0.000010 | −0.000047 *** |
| 2020–2025 (Post-COVID-19) | 0.000022 *** | 0.000019 ** | −0.000025 *** | −0.000042 *** | 0.000013 * | −0.000059 *** |
| Difference in magnitude | Stronger | Moderate | Stronger | Stronger | Stable | Stronger |
Disclaimer/Publisher’s Note: The statements, opinions and data contained in all publications are solely those of the individual author(s) and contributor(s) and not of MDPI and/or the editor(s). MDPI and/or the editor(s) disclaim responsibility for any injury to people or property resulting from any ideas, methods, instructions or products referred to in the content. |
© 2026 by the author. Licensee MDPI, Basel, Switzerland. This article is an open access article distributed under the terms and conditions of the Creative Commons Attribution (CC BY) license.
Share and Cite
Khanh, P.D. Investor Sentiment and Market Volatility Across Quantiles: Evidence from Vietnam. J. Risk Financ. Manag. 2026, 19, 349. https://doi.org/10.3390/jrfm19050349
Khanh PD. Investor Sentiment and Market Volatility Across Quantiles: Evidence from Vietnam. Journal of Risk and Financial Management. 2026; 19(5):349. https://doi.org/10.3390/jrfm19050349
Chicago/Turabian StyleKhanh, Pham Dan. 2026. "Investor Sentiment and Market Volatility Across Quantiles: Evidence from Vietnam" Journal of Risk and Financial Management 19, no. 5: 349. https://doi.org/10.3390/jrfm19050349
APA StyleKhanh, P. D. (2026). Investor Sentiment and Market Volatility Across Quantiles: Evidence from Vietnam. Journal of Risk and Financial Management, 19(5), 349. https://doi.org/10.3390/jrfm19050349