Article

Family Ownership, ESG Strategies, and Corporate Risk: Evidence from Earning Volatility

1
Dipartimento di Management, Finanza e Tecnologia, LUM University Giuseppe Degennaro, 70010 Casamassima, Italy
2
Dipartimento di Scienze Economiche, Psicologiche, della Comunicazione, della Formazione e Motorie, Niccolò Cusano University, 00166 Roma, Italy
3
Dipartimento di Scienze Politiche e Sociali, University of Catania, 95131 Catania, Italy
*
Author to whom correspondence should be addressed.
J. Risk Financ. Manag. 2026, 19(5), 305; https://doi.org/10.3390/jrfm19050305
Submission received: 17 March 2026 / Revised: 16 April 2026 / Accepted: 20 April 2026 / Published: 23 April 2026
(This article belongs to the Special Issue Corporate Finance and ESG: Shaping the Future of Sustainable Business)

Abstract

In this article, we analyze the combined impact of sustainability activities and family governance on firm-level risk, measured by earning volatility, with particular attention to the timing of ESG involvement. Using panel regression models, we distinguish between short- and long-term ESG performance and between family ownership and family management. The empirical analysis reveals a negative correlation between long-term ESG performance and corporate risk, but short-term ESG impact is insignificant. Family ownership and having a family CEO both decrease firm risk; however, family ownership moderates the link between ESG risks and firm risk.
JEL Codes:
G32; M14; L25; G34; C23

1. Introduction

In recent years, the importance of ESG (environmental, social, and governance) considerations has grown considerably, as they underpin corporate social responsibility (CSR) theories and stakeholder approaches (Carroll, 1991; Freeman, 2010). In parallel, the topic of corporate risk, measured in relation to the company’s financial performance volatility, has continued to play a central role in financial economics within the risk-return paradigm (Markowitz, 2010). Research shows that companies with better sustainability performance exhibit greater resilience to crises and shocks, including those related to the coronavirus pandemic (Albuquerque et al., 2020; Broadstock et al., 2021; Ding et al., 2021). Hence, the following question arises: Do sustainable activities reduce corporate risks? Given the differences in institutional environments and investor protection between developed markets and emerging economies such as China, this issue becomes particularly relevant. Being a transition economy, China features evolving regulations, less effective investor protection, and a significant role of the state in governing corporations and their disclosures. As a result, ESG reporting in China has been developing rapidly over the last decade due to regulatory changes and stakeholder pressure, but it remains heterogeneous in terms of quality and measurability. Thus, China is particularly well-suited for investigating this topic.
Family businesses provide an ideal setting for investigating this issue. The ownership structures of Chinese listed firms tend to be highly concentrated, with ownership and control converged (La Porta et al., 1999; Fama & Jensen, 1983). Therefore, large shareholders, such as family owners, exercise significant control and influence over managerial decisions, leading to distinctive risk-taking patterns compared with non-family firms. In particular, family-owned enterprises exhibit distinct risk preferences due to the role of socioemotional wealth in strategic decision-making (Gómez-Mejía et al., 2007). At the same time, stakeholder and regulatory pressure encourage them to adopt more sustainable practices. Despite numerous studies on the relationship between ESG and corporate risk, several gaps remain. First, existing research highlights the need to consider corporate characteristics, such as corporate governance, in the analysis of the association (Hollnagel & Bueno, 2025). Second, the literature on family firms discusses ownership and management through the lens of socioemotional wealth, yet treats family governance as a unidimensional concept (Gómez-Mejía et al., 2007). Finally, despite advances in ESG measurement methodologies, heterogeneity persists across metrics, especially in emerging economies such as China (Berg et al., 2022). Generally, the interaction of family governance and sustainability practices is not well-explored.
To answer the research question, a sequential multi-method design will be applied. First, the framework for studying the association between ESG, family governance, and corporate risk will be designed. Second, average relationships between these variables will be identified using fixed-effects panel regressions. Third, cluster analyses will be applied to account for firm heterogeneity and group similar family firms based on distinct characteristics. Finally, machine learning methods will be used to estimate predictivity and identify non-linearities in these relationships.

2. Literature Review

This section presents the relevant literature on the association among ESG policies, family governance, and corporate risk. To provide a sound basis for further discussion, the literature review will be divided into three main themes. Firstly, it examines the association between ESG involvement and corporate risk, considering the theory and evidence behind it. Secondly, it examines how family governance affects corporate risks, separating them into two perspectives—ownership and management. Lastly, it examines the relationship between ESG policies and family governance, noting potential moderating influences and areas that remain unexplored in the current literature.

2.1. ESG and Corporate Risk

An adequate understanding of the relationship between ESG strategies and risk in firms presupposes consideration of the existing academic literature in financial economics and sustainability. Regarding the former, the risk associated with corporations has conventionally been studied in the context of asset pricing and risk-return models, where risk is frequently partitioned into systematic and idiosyncratic components based on specific features and corporate policies (Sharpe, 1964; Fama, 1970; Fama & French, 1993). According to sustainability theories, risk has primarily been analyzed from stakeholder perspectives (Freeman, 2010). The early contributions in the field of CSR emphasized the role of companies’ integration of social, environmental, and governance aspects into strategy for generating value (Carroll, 1991; McWilliams & Siegel, 2001; Porter & Kramer, 2006). Thus, ESG should be conceptualized not only as a type of corporate reporting but also as a strategic orientation used by organizations to develop strong stakeholder relationships, enhance legitimacy, and strengthen operational robustness. Relatedly, within the shared value framework, social impact and competitive advantage might reinforce each other over time (Porter & Kramer, 2006; Dembek et al., 2016). Empirically, most studies suggest that organizations with active involvement in ESG demonstrate higher levels of resilience and less volatile performances (Elkington & Rowlands, 1999; Eccles et al., 2014; Lins et al., 2017; Albuquerque et al., 2020). In particular, it appears that corporations with high sustainability ratings are better able to absorb shocks and face lower risks of reputational problems and regulatory sanctions. At the same time, the ESG metric is ambiguous because ratings from different agencies differ considerably (Kotsantonis et al., 2016; Berg et al., 2022). Specifically, the early ESG literature was based on the frameworks of socially responsible investing (Kinder et al., 1993), which was gradually replaced by a focus on ESG disclosure (Ioannou & Serafeim, 2015). One of the primary insights from ESG studies is that positive outcomes will rarely appear immediately. As shown by several empirical studies, ESG advantages are usually dynamic, as benefits, such as improved reputation, stronger relationships with stakeholders, and reduced information asymmetries, are likely to develop over time (Kölbel et al., 2017). In line with the findings mentioned above, modern empirical studies reveal that there is an inverse relation between risk and ESG engagement (Khaw et al., 2025; Adardour et al., 2025; Gega et al., 2025), although not all scholars draw a clear distinction between short-term and long-term ESG advantages in their analyses.

2.2. Family Governance and Corporate Risk

The other important stream of relevant literature deals with family governance and its impact on corporate risk. Family firms represent a unique organizational form where ownership, control, and managerial incentives are likely to coincide. According to SEW theory, family businesses tend to take less aggressive actions and have an inherently long-term focus since family members seek to not only maximize financial gains but also retain control, identity, continuity, and reputation from one generation to another (Gómez-Mejía et al., 2007; Berrone et al., 2012). As a result, family firms are expected to incur less risk and focus on maintaining stability rather than seeking immediate financial gains (Naldi et al., 2007; Zahra, 2005).
At the same time, the literature on this issue implies that family governance is not an all-encompassing concept. It is important to distinguish between family ownership and family management, as these two aspects may lead to different consequences for firm behavior and risk (Villalonga & Amit, 2006; Miller & Le Breton-Miller, 2006). While family ownership implies a certain level of economic involvement and stakeholder incentive structure, family management represents the extent of family members’ influence on organizational processes. Combining these two aspects may lead to misleading conclusions.
Another theoretical framework that complements the discussion is agency theory and, more generally, corporate governance research. The literature highlights the role of ownership in minimizing or exacerbating agency problems in corporations (Fama & Jensen, 1983; Jensen & Meckling, 2019). First, it can minimize such conflicts by increasing agents’ motivation to monitor owners’ actions. At the same time, concentrated ownership brings about new agency issues such as entrenchment, under-diversification, and the ability of controlling individuals to enjoy private benefits while imposing losses on other shareholders (Demsetz & Lehn, 1985; Shleifer & Vishny, 1997; Chrisman et al., 2004). Some research suggests that family ownership and family governance reduce uncertainty and promote better outcomes (Anderson & Reeb, 2003).
Consequently, the family business literature shows that family factors play a significant role in corporate risk, although their theoretical underpinnings are rather complicated.

2.3. ESG, Family Governance, and Conditional Effects on Risk

The third and newest research stream focuses on the effects of the interaction between ESG practices and family governance. While existing evidence from both the ESG and family business studies shows that sustainability and family control have separate effects on corporate risk, there is limited empirical and conceptual understanding of how these variables interact and affect risk levels. Some recent papers investigate the role of family governance in firm decision-making and its relation to sustainability choices (Gundry et al., 2014; Chen et al., 2019; Vollero et al., 2019; Doluca et al., 2018; Santos et al., 2022; Suder et al., 2024; Domańska et al., 2024; Häußler & Ulrich, 2024; Dan et al., 2024; ). However, while family governance in these studies is generally understood broadly, the relationship between family governance and the impact of ESG practices on corporate risk is rarely examined. Moreover, the mainstream research in the ESG literature focuses on the relationships between sustainability and corporate risk while largely ignoring differences in governance. This is rather surprising as the theoretical considerations suggest that family governance could moderate the effect of sustainability practices on firm performance. Indeed, sustainability investments require long-term strategic vision, commitment of resources, and strategic consistency, and family control could positively influence these aspects. On the other hand, conservative family governance may mitigate the potential positive impact of sustainability initiatives by restraining managers’ ability to act strategically. Therefore, the effect of ESG practices on corporate risk could be moderated by family control. These issues become especially relevant when one considers that family governance is multidimensional, as there can be various forms of family involvement in firm operations, such as family ownership or family management, each with distinctive features. Thus, while the effect of ESG practices on corporate risk may differ depending on whether family control exists, it may also vary with the degree of family involvement in corporate activities. In general, the existing literature shows a link between ESG engagement, family governance, and corporate risk, but it lacks a sufficiently detailed examination of the underlying mechanisms. Namely, existing research does not distinguish between the channels through which short- and long-term effects of ESG practices on corporate risk operate, nor does it distinguish between the roles of family ownership and family management as incentive mechanisms and decision-makers, respectively. Finally, the existing literature overlooks the effect of family ownership on the effectiveness of ESG initiatives.
A summary of the literature is given in Table 1.
Based on the above literature, the study develops a set of testable hypotheses concerning the role of ESG and family governance in shaping corporate risk. These hypotheses are formally presented in the following section.

3. Hypotheses on the ESG–Risk Relationship and the Role of Family Governance

Building on the literature reviewed above, this section develops the study’s hypotheses on the relationships among ESG engagement, family governance, and corporate risk. Importantly, these relationships are not univocal, as the underlying theories point to competing and partially conflicting mechanisms. Accordingly, the hypotheses are not formulated as strictly directional predictions, but rather as theoretically grounded expectations that explicitly reflect the presence of competing mechanisms and unresolved theoretical ambiguity. In the ESG literature, stakeholder-based arguments suggest that sustainability engagement reduces corporate risk by strengthening stakeholder relationships, improving transparency, and enhancing organizational resilience. However, alternative perspectives emphasize that ESG investments may involve substantial costs, managerial discretion, and reduced operational flexibility, which can increase uncertainty and risk exposure, particularly in the short term. As a result, ESG engagement may either mitigate or amplify corporate risk depending on the balance between its benefits and associated costs. This theoretical tension is closely related to the time horizon of ESG engagement. In the short term, the costs of sustainability initiatives are typically immediate, while their benefits—such as reputational gains, improved stakeholder trust, and reduced information asymmetry—tend to materialize gradually. Consequently, short-term ESG engagement may have a limited or insignificant effect on corporate risk. In contrast, sustained ESG strategies are expected to generate cumulative benefits over time, contributing to greater stability, resilience to external shocks, and more predictable firm performance. In this sense, ESG can be interpreted as a long-term strategic capability rather than a one-off investment. Accordingly, the following hypotheses are formulated by taking into account these competing theoretical mechanisms, which imply that the expected relationships may vary depending on underlying conditions and time horizons. Given the presence of competing theoretical mechanisms, the hypotheses are formulated to explicitly reflect this ambiguity, distinguishing between cases in which theoretical predictions are consistent and cases in which they remain inherently indeterminate. To better reflect the underlying theoretical ambiguities, we distinguish between hypotheses with clear directional predictions and hypotheses characterized by inherently competing mechanisms, for which no univocal directional effect is imposed a priori. Each hypothesis is formulated to reflect a specific configuration of the underlying theoretical tensions discussed above, rather than imposing uniform directional expectations across all relationships.
Hypothesis 1 (H1).
Short-term ESG engagement is unlikely to have a significant impact on corporate risk reduction.
Hypothesis 2 (H2).
Long-term ESG engagement is negatively associated with corporate risk and is expected to produce more persistent effects than short-term ESG engagement.
The literature indicates that family governance may influence corporate risks through distinct channels, even though its overall effect is theoretically ambiguous. Family ownership mainly operates through the incentive and monitoring channels, whereby greater cash flow rights increase the family’s financial exposure, thereby providing incentives for value preservation and risk minimization. Family management, on the other hand, operates through the decision-making channels, influencing the choice of strategies and risk attitudes. At the same time, these channels can have opposite effects. Although greater monitoring and focus on long-term perspectives are likely to minimize risks, ownership concentration and management control are likely to contribute to entrenched management, under-diversification, and non-financial pursuits, thus increasing risk. This implies that family governance is not necessarily expected to reduce corporate risks, and its effect cannot be predefined without examining the relationship between the two channels. The hypotheses are as follows:
Hypothesis 3a (H3a).
Family cash-flow rights are significantly associated with corporate risk, but the direction of the relationship is theoretically indeterminate due to competing monitoring and entrenchment mechanisms.
Hypothesis 3b (H3b).
The presence of a family CEO is significantly associated with corporate risk, but the direction of the relationship is theoretically indeterminate due to competing stewardship and agency-based mechanisms.
Finally, the risk implications of ESG engagement may vary according to the degree of family involvement. Since ESG investments typically require long-term commitment and strategic consistency, their effectiveness may depend on the underlying governance structure. Family ownership may reinforce ESG effects by supporting long-term orientation, but it may also attenuate them if conservative governance mechanisms already reduce risk or limit strategic flexibility. Therefore, family ownership can act as a moderating factor that conditions how ESG engagement translates into corporate risk outcomes. Accordingly, the following hypothesis is proposed:
Hypothesis 4 (H4).
The effect of long-term ESG engagement on corporate risk is conditional on the level of family ownership. Specifically, ESG is expected to reduce corporate risk when family ownership is low to moderate, whereas its risk-reducing effect may weaken or become insignificant at higher levels of family ownership, where governance structures already promote stability or limit strategic flexibility.
Table 2 summarizes the hypotheses by explicitly linking each expected relationship to its underlying theoretical mechanism.
Taken together, these hypotheses provide a structured framework to examine how ESG engagement and family governance jointly influence corporate risk. The next section describes the data and empirical strategy used to test these relationships.

4. Data Description and Variable Definitions

The empirical framework adopts panel data of non-financial A-share firms that are quoted in the Shanghai and Shenzhen Stock Exchanges, over the period 2010–2020. This period is chosen considering the emergence of sustainable practices and the increase in ESG reporting among Chinese corporations since 2010 (Broadstock et al., 2021; Liao et al., 2015). Corporations in financial sectors, ST/ST* firms, and observations without more than three-year data and missing values are omitted. Consequently, the sample includes 3830 firms (26,151 firm-year observations), 2409 of them being family firms. Data of financial characteristics are extracted from CSMAR database. However, data of ESG factors are obtained from the Sino-Securities Index Information Service. ESG scores of Sino-Securities Index Information Service can be used in this paper since they offer standardized ESG ratings for Chinese listed firms. They enable comparison of sustainability performance in firms operating in the same regulatory environment. In spite of that, as in the case of many previous studies, such measures of ESG scores can suffer from measurement error due to the different methods employed and their aggregation processes. For this reason, in addition to including ESG scores in level (ESG score in year t), a long-term average of ESG score (ESG score from year t − 3 to t − 1) is considered. All continuous variables are Winsorized at the 1st and 99th percentile to reduce the effect of outliers. Corporate risk is measured by means of earning volatility employing financial ratios calculated using three-year windows, in line with previous research (Ding et al., 2021). Thus, risk is measured by the standard deviation of industry-adjusted ROA and by the range between the highest and lowest industry-adjusted ROA. ESG engagement is measured by two proxies: the lagged ESG score in year t − 1 (L1ESG1) and the average of the ESG scores in three consecutive years (ESG score from year t − 3 to t − 1, LT_ESG). This allows for considering sustainability engagement as an evolving process. Such approach is coherent with the previous literature, according to which the ESG score influences the firm’s decisions and performance over time (Cheng et al., 2014; El Ghoul et al., 2018). To assess the effect of long-term ESG engagement depending on family governance, family cash flow right (FamilyCF) and family CEO (FamCEO, dummy variable) are considered. Interaction terms between long-term ESG engagement (LT_ESG) and family cash flow rights and family CEO are included. The following control variables are employed: BoardSize represents governance complexity and its relationship with efficiency of monitoring and information asymmetry reduction (Liao et al., 2015). FirmSize considers the size of the firm, Tangibility measures the portion of tangible assets in the corporation, and Financial Constraints (FC) account for the restrictions in external financings, which are closely related to ESG activities. See Table 3.
The descriptive statistics of the main variables used in this study are provided in Table 4 below. Every variable is based on more than 26,000 data points, which suggests that the data set used for this purpose is strong enough to look into the interrelations between the three variables under consideration. Different numbers of observations across different variables can be attributed to different availability of data. See Table 4.
Corporate risk (Risk1), proxied by the standard deviation of industry-adjusted ROA, has an average value of 0.033, which can be considered moderate, as well as being right-skewed, meaning that some corporations show substantial income fluctuations. The reason for applying accounting-based risk measures is their alignment with the previous literature (Erickson & Whited, 2000). The ESG performance levels are highly similar, yielding a mean value close to one and low dispersion. This observation coincides with research evidence showing that there is a tendency of ESG convergence, as well as possibly inconsistent ESG ratings (Berg et al., 2022). There is considerable heterogeneity in family ownership as some corporations exhibit very low levels of cash flow rights, while others have very high cash flow rights. Around half of the firms have family CEOs. Heterogeneity in firm size, board size, and asset tangibility is only moderate with asset tangibility being relatively high due to the nature of the sample. Financial constraints do not vary much across corporations. Therefore, there is heterogeneity in regard to the primary explanatory variables of the analysis. Nevertheless, the following problems exist in the data: accounting risk measure errors (Erickson & Whited, 2000), ESG measurement errors (Berg et al., 2022), and the selection of Chinese listed firms as the entire population. Last, but not least, ESG engagement might affect distress risk (Boubaker et al., 2020). Evaluation of data and variable construction is also provided. The use of the selected database is appropriate for investigating the research questions, since it includes firm-level financial data, along with ESG ratings. However, there are some limitations to take into account. First, the use of external ESG scores provided by vendors is prone to generating measurement error due to different methods of measurement and score aggregation (Christensen et al., 2022). Secondly, while lags and fixed effects control for simultaneity problems, endogeneity might still arise due to omission of certain factors. Also, the LT_ESG variable reflects the sustainability engagement of a firm as its persistent characteristic, as well as other factors. Thirdly, using accounting-based risk measures ensures comparability between firms but does not account for forward-looking risks related to the markets and climate change (Krueger et al., 2020). As the latest evidence shows, ESG disclosure affects the idiosyncratic risk process of a firm (Perera et al., 2026). Lastly, the obtained results are not generally applicable outside of the Chinese institutional setting. Methodologically speaking, the conclusions drawn from the data are purely descriptive and should be backed up by clustering analyses. Machine learning might allow for predictions but not prove causality. Future research should include other measures of risk, dynamic panel models, and robustness tests.
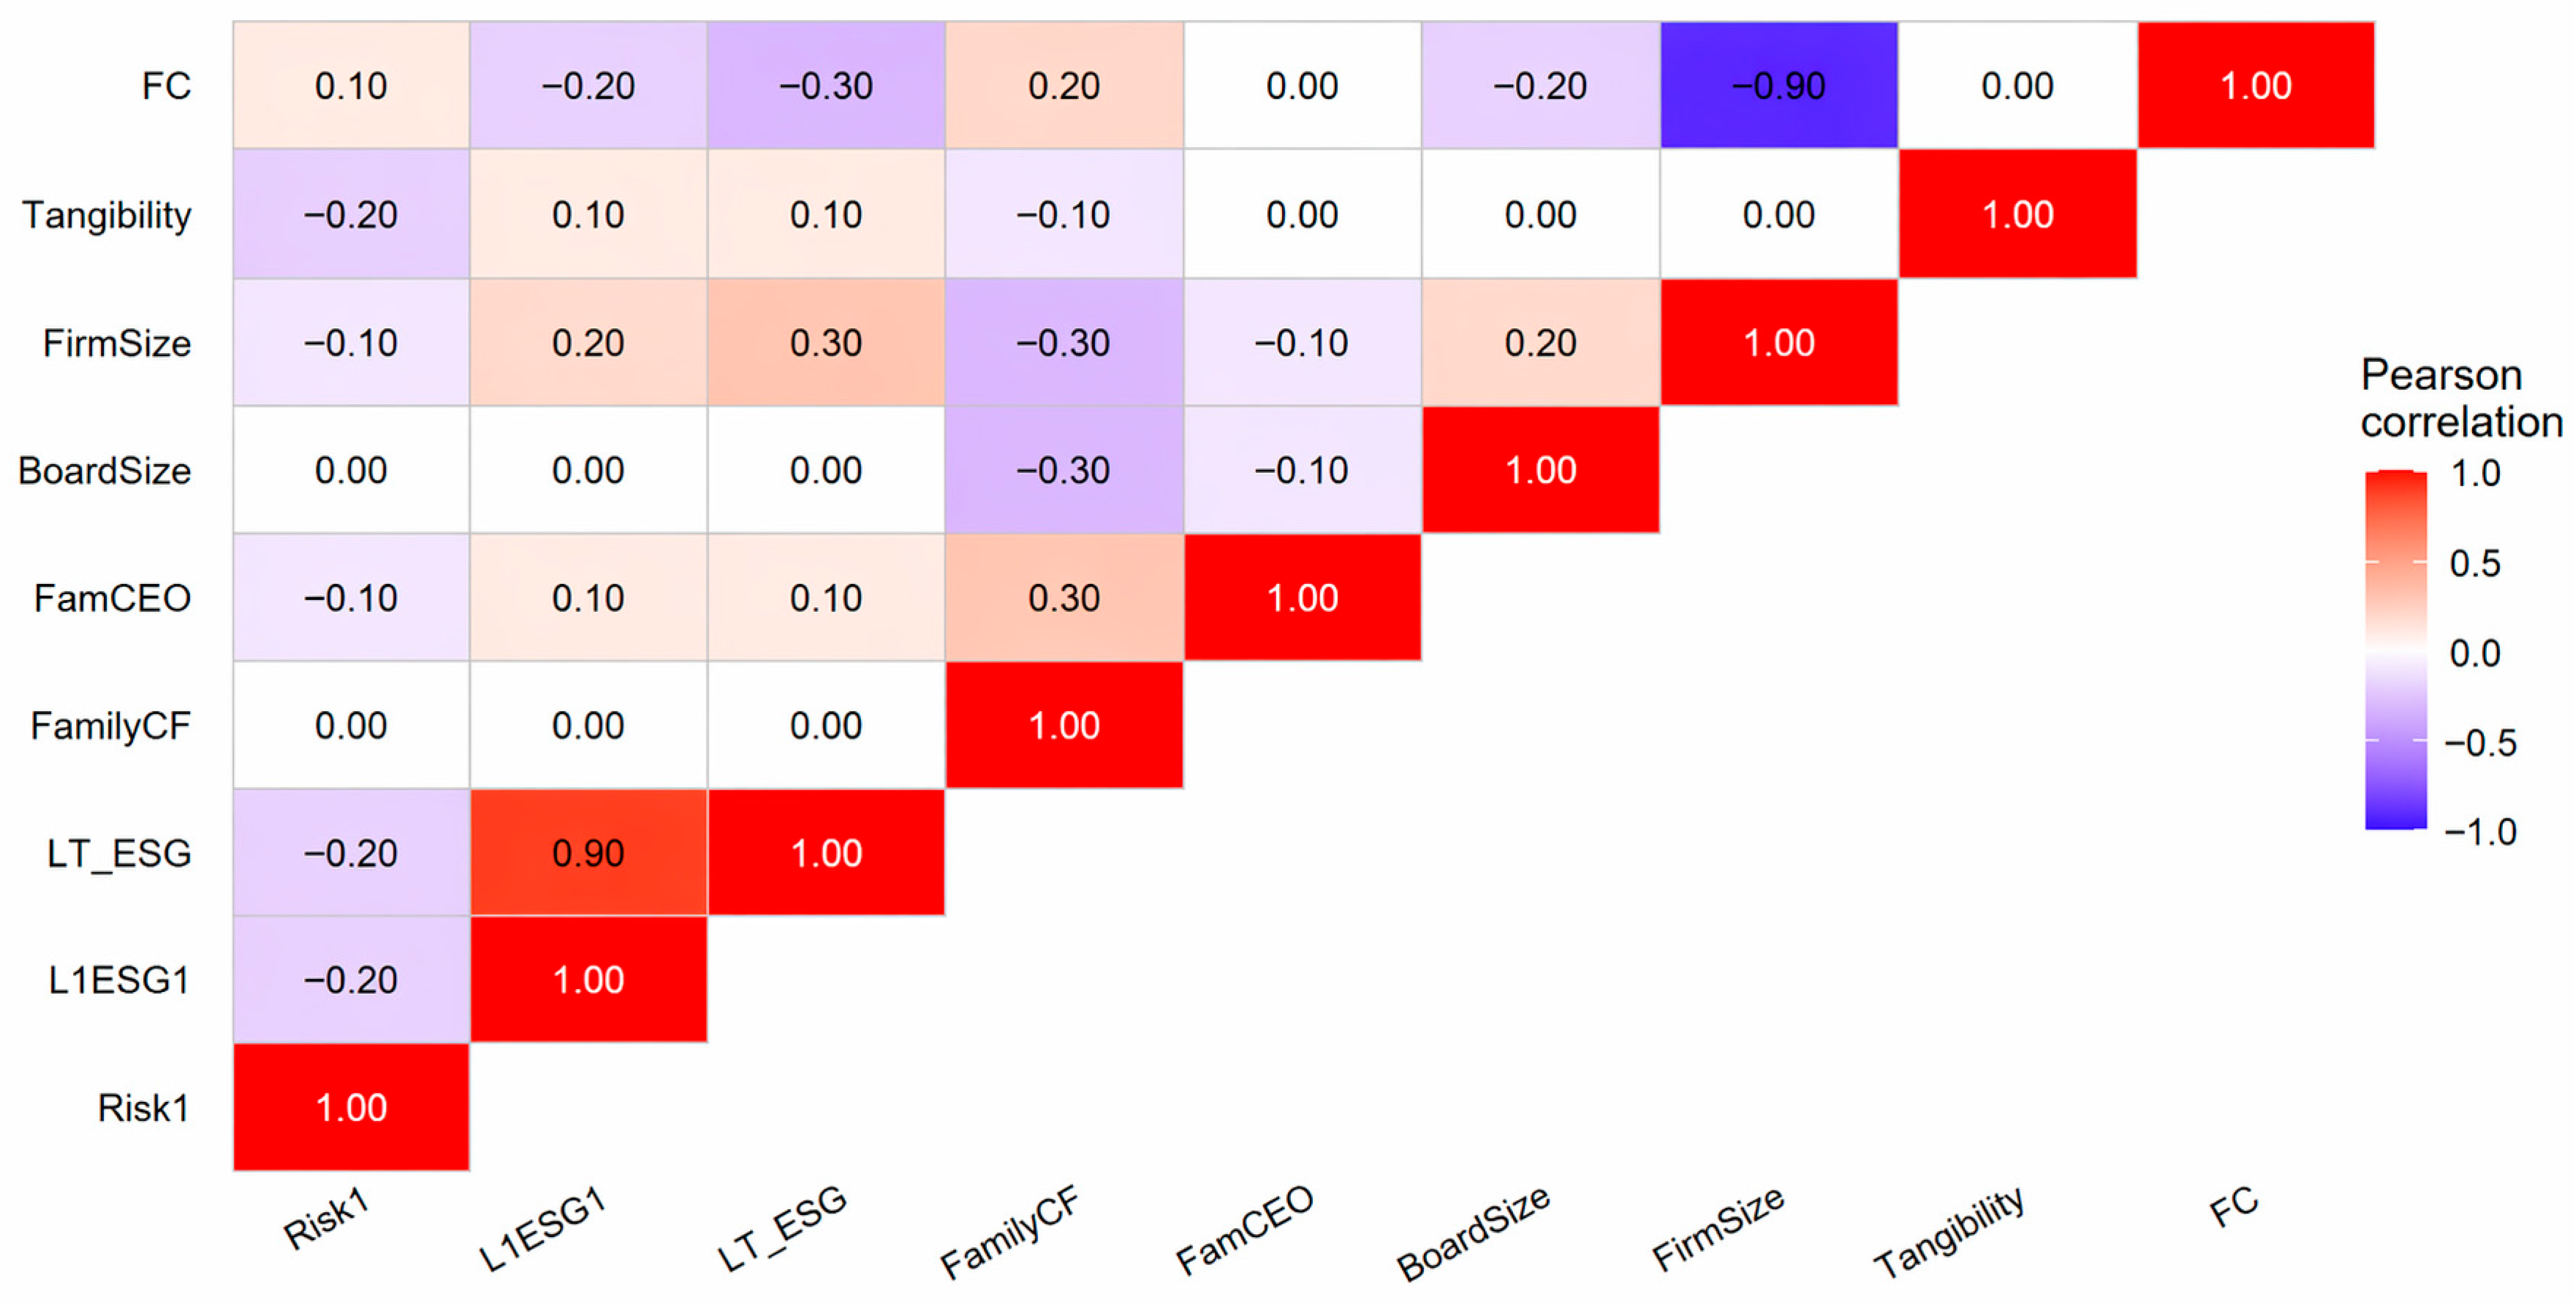
Correlation matrix. There are no correlations among independent variables, which are indicative of any multicollinearity. Predictably, the maximum value is observed between the L1ESG1 and LT_ESG variables, amounting to 0.90. Corporate risk (Risk1) has a negative correlation with the dependent variable and the majority of control variables. Among all controls, the strongest correlation is observed between firm size and financial constraints, and it is negative.
All variables used in both clustering and machine learning models are standardized before estimation to make them homogeneous predictors and to prevent biases due to scale differences (Géron, 2022; James et al., 2021). To minimize the effect of outliers, all continuous variables are Winsorized at the 1st and 99th percentiles, as is common in empirical financial studies (Gu et al., 2020). Missing values will be accounted for by selecting appropriate samples, as explained earlier. As a result, all variables are standardized to have a mean of zero and unit variance, which is important when clustering based on distances in the K-means algorithm (Géron, 2022; James et al., 2021). With variables, data description, and characteristics mentioned above, we now proceed to describe the econometric approach used to examine the study hypotheses and explore the connection between sustainability engagement, family governance, and corporate risks. Altogether, this information demonstrates the significance of institutional peculiarities in China for the current research, and the reasons for considering both lagged and extended ESG measures in this context.

5. Econometric Analysis: Estimation Strategy and Main Results

To investigate the role of sustainability strategies in shaping corporate risk and family governance, this study employs fixed-effects panel regression models. This approach exploits the panel structure of the data by controlling for unobserved firm-level heterogeneity and time effects, a standard procedure in panel data analysis (Wooldridge, 2010). The baseline model examines the effect of short-term ESG engagement to assess whether it has a significant impact on corporate risk and to compare it with long-term ESG engagement. The specification is then extended to include the long-term ESG component and its interaction with family cash-flow rights, allowing the analysis to capture both the dynamic nature of sustainability and the moderating role of family governance. Ownership structures are particularly relevant in this context, as family-controlled firms may adopt governance mechanisms that either reinforce or attenuate the impact of ESG engagement on risk (Pongsatitpat et al., 2025; D’allura et al., 2026). See Table 5.
Control variables are included in the models, along with firm- and year-fixed effects and clustered standard errors at the firm level. The analysis relies on firm-fixed-effects regressions with year dummy variables and clustered standard errors, a common method in finance panel data that accounts for within-firm correlation (Petersen, 2008; Wooldridge, 2010; Baltagi, 2008). The model with fixed effects is justified by the Hausman test (χ2(17) = 180.43, p < 0.001), meaning that the estimates in a random effects model will suffer from omitted-variable bias. Such an observation aligns with previous literature indicating that organizational culture, corporate governance, and managerial behavior shape corporate risk and sustainable development strategies. Corporate risk is defined using the dispersion measure of a company’s performance, calculated as the standard deviation of ROA adjusted to the industry level over three-year time windows, as is typical in the financial literature on corporate risk and resilience (Ding et al., 2021; Boubaker et al., 2020). Long-term ESG performance has a significant negative impact on corporate risk, supporting the assumption that sustainability promotes firm resilience and operational stability (Albuquerque et al., 2020; Broadstock et al., 2021; Flammer, 2021). Family involvement proves crucial when discussing corporate risk: family cash-flow rights are inversely related to risk, and family CEOs are associated with lower corporate risk, consistent with previous research on family-managed companies (Pongsatitpat et al., 2025; D’allura et al., 2026). The main contribution of the paper concerns the role of the interaction term between long-term ESG and family cash-flow rights. As shown, the term is positive and statistically significant, indicating that family involvement moderates the relationship between the two variables. Specifically, the effect of LT_ESG on corporate risk depends on the level of family involvement in a company, rather than being stable. Thus, it can be stated that family involvement moderates the effectiveness of sustainability as a corporate risk-reduction mechanism. When family involvement is high, the impact of ESG on risk reduction may not be sufficiently effective; conversely, when family involvement is low, ESG-related activities may involve changes in corporate strategy that further reduce risk. Finally, the set of control variables aligns with the literature and supports the empirical approach used in the current research. First of all, firm size is positively related to corporate risk, as large organizations, despite their resourcefulness, often face instability due to high complexity. Asset tangibility correlates strongly negatively with risk, meaning that assets that can be collateralized provide the needed cash flow stability. Financial constraints are positively correlated with risk, implying greater vulnerability and a weaker ability to smooth performance (El Ghoul et al., 2018; Bolton & Kacperczyk, 2021). Thus, the current findings show that the connection between sustainability and family governance in terms of corporate risk is complex. On the one hand, long-term ESG fosters business stability, while on the other, family governance ensures it and moderates the impact of ESG, thereby reducing its effectiveness. See Table 6.
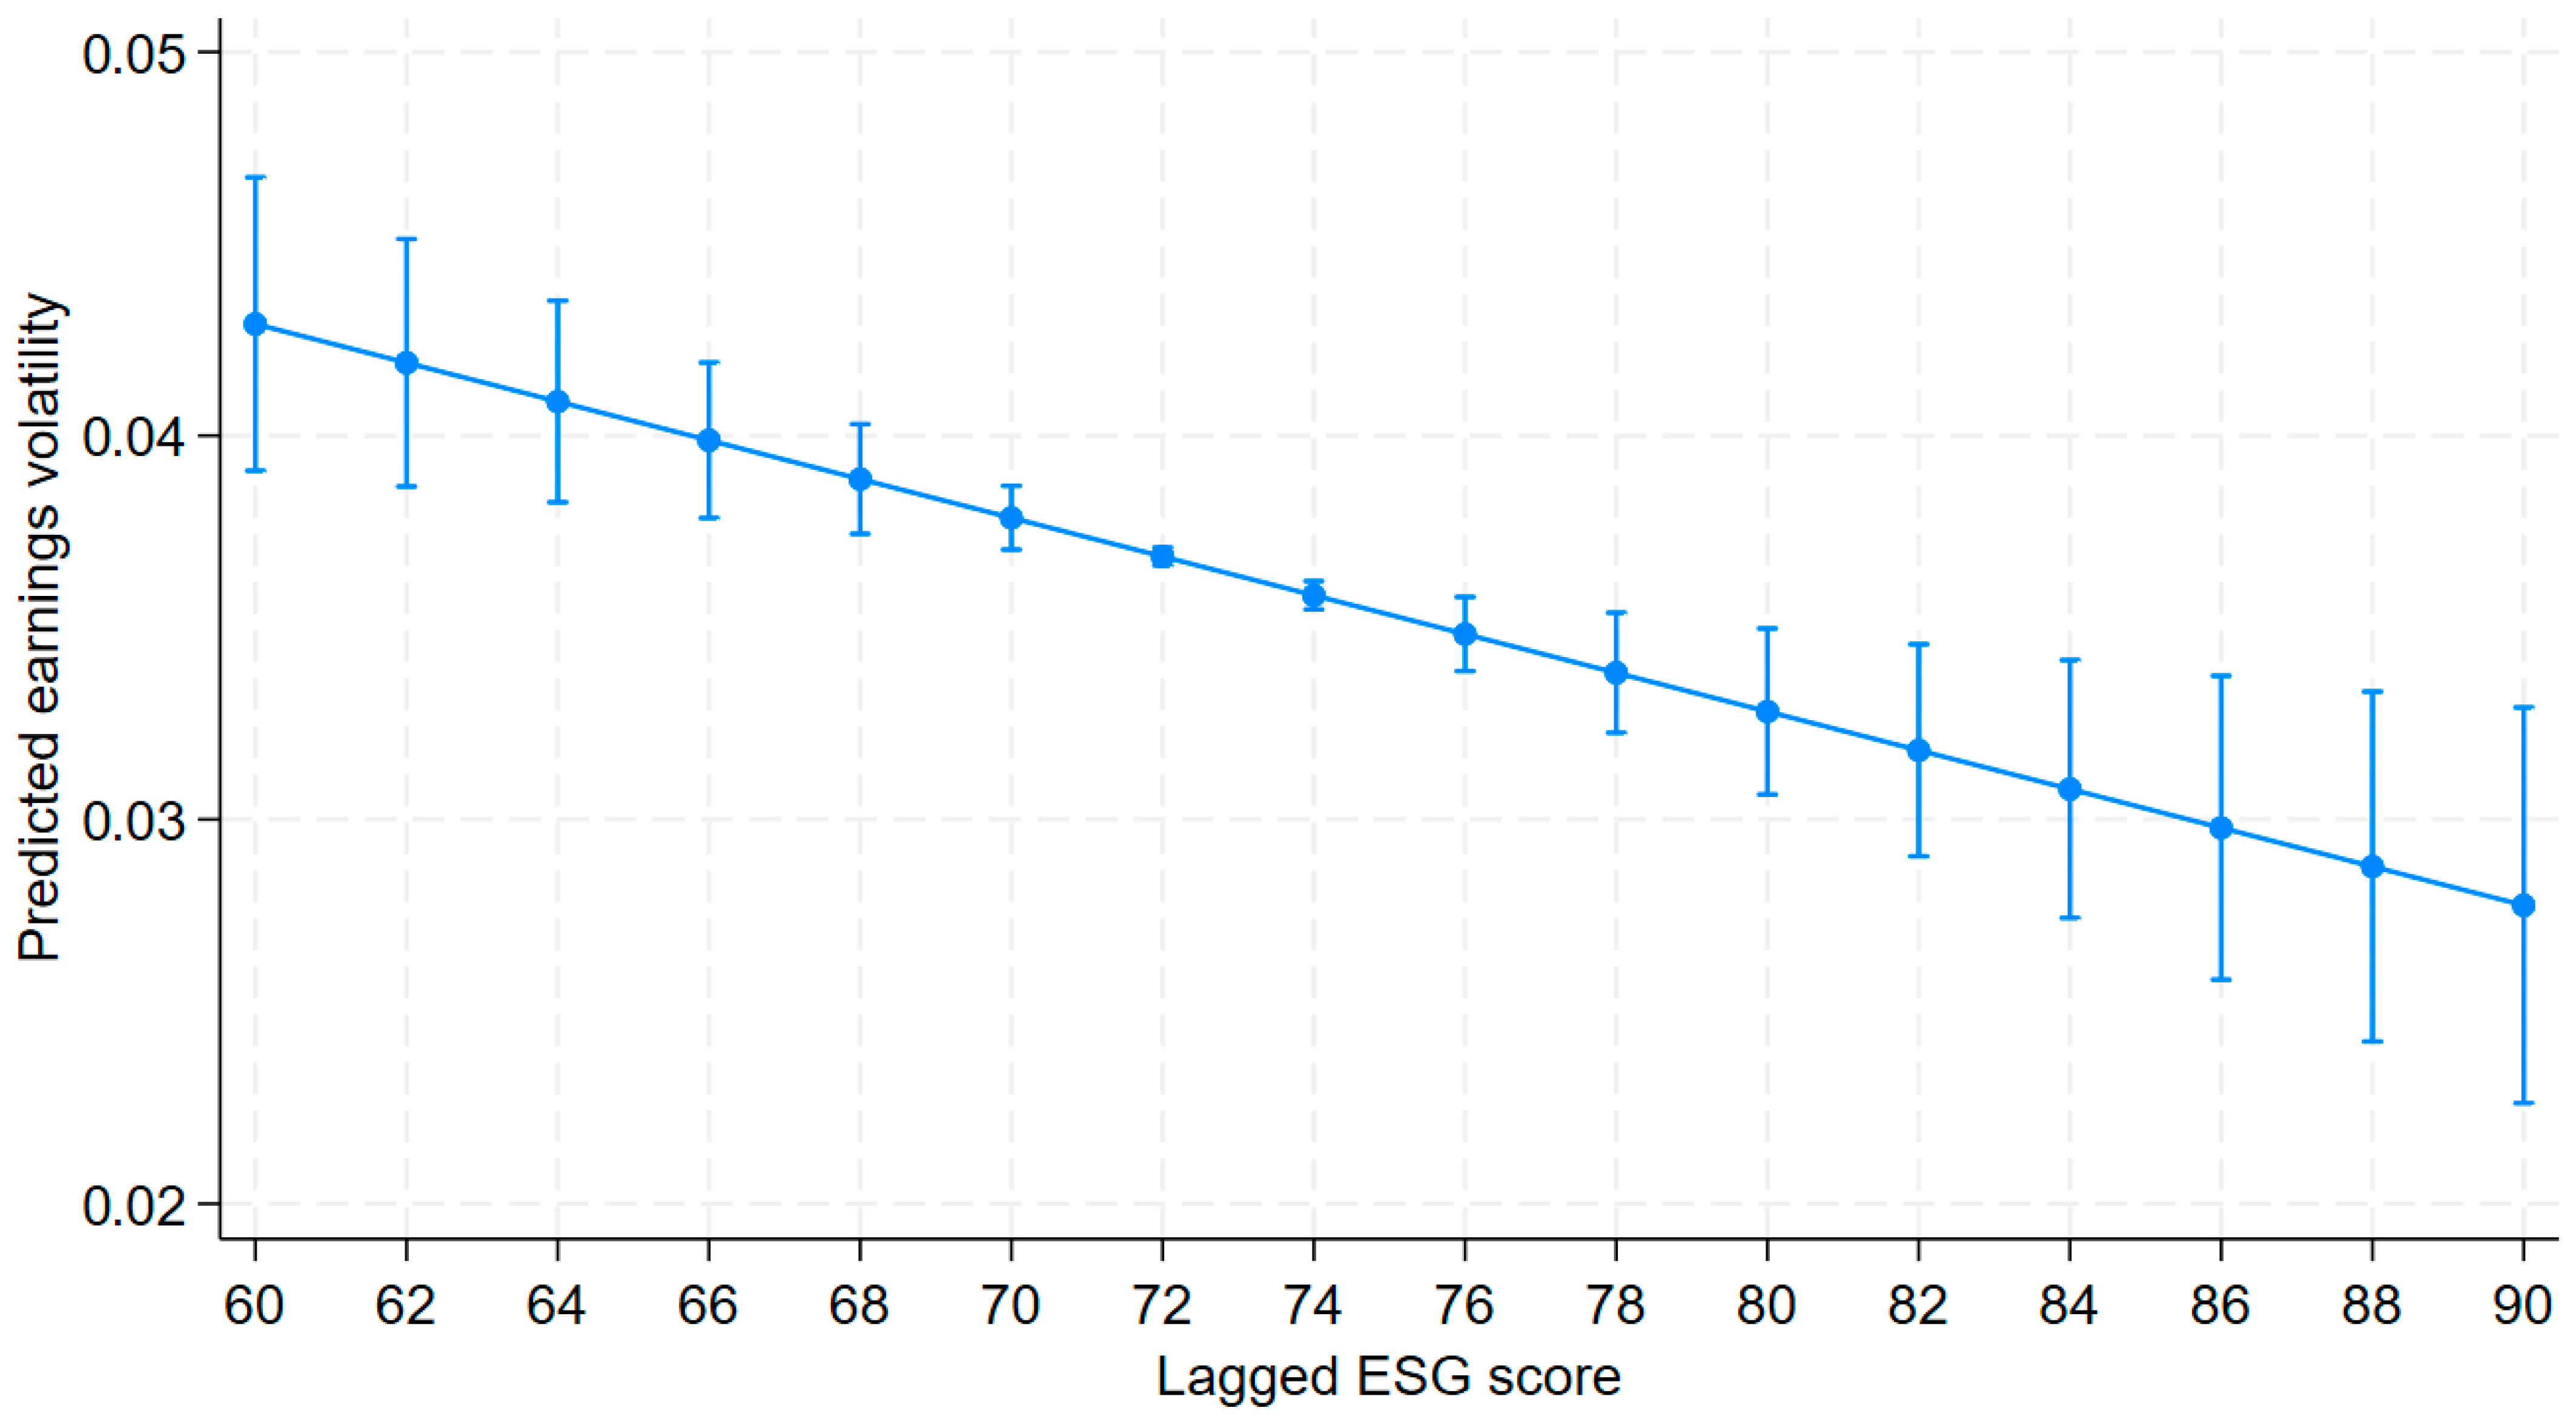
In addition to assessing statistical significance, it is equally important to evaluate the economic significance of estimates. As such, the LT_ESG variable estimate, which amounts to −0.0015, denotes that each increase in the long-term ESG rating by one unit will lead to a decrease in earning volatility of approximately 0.0015. Considering that the firm risk in this sample is 0.033 on average, this is indeed a considerable change in percentage terms. Therefore, the economic importance of ESG initiatives’ impact on risk management is quite high, as this result confirms earlier research findings that ESG engagement helps stabilize the company’s operations and reduce firm risk (Shiu & Yang, 2017). Another issue related to the economic significance of variables is the size of the FamilyCF coefficient estimate. It is also relevant to emphasize that the impact of LT_ESG on the company’s risk depends on FamilyCF, meaning that in some circumstances the impact of the LT_ESG variable will be larger than in others. For instance, when FamilyCF is lower, the negative association between LT_ESG and earning volatility will be stronger; on the other hand, when FamilyCF is higher, it will weaken because of diminishing returns to ESG initiatives. This aligns with previous research showing that the impact of ESG depends on firm-specific factors, including ownership structure (P. A. Nguyen et al., 2020). Figure 2 provides a visual illustration of the negative ESG–risk relationship.
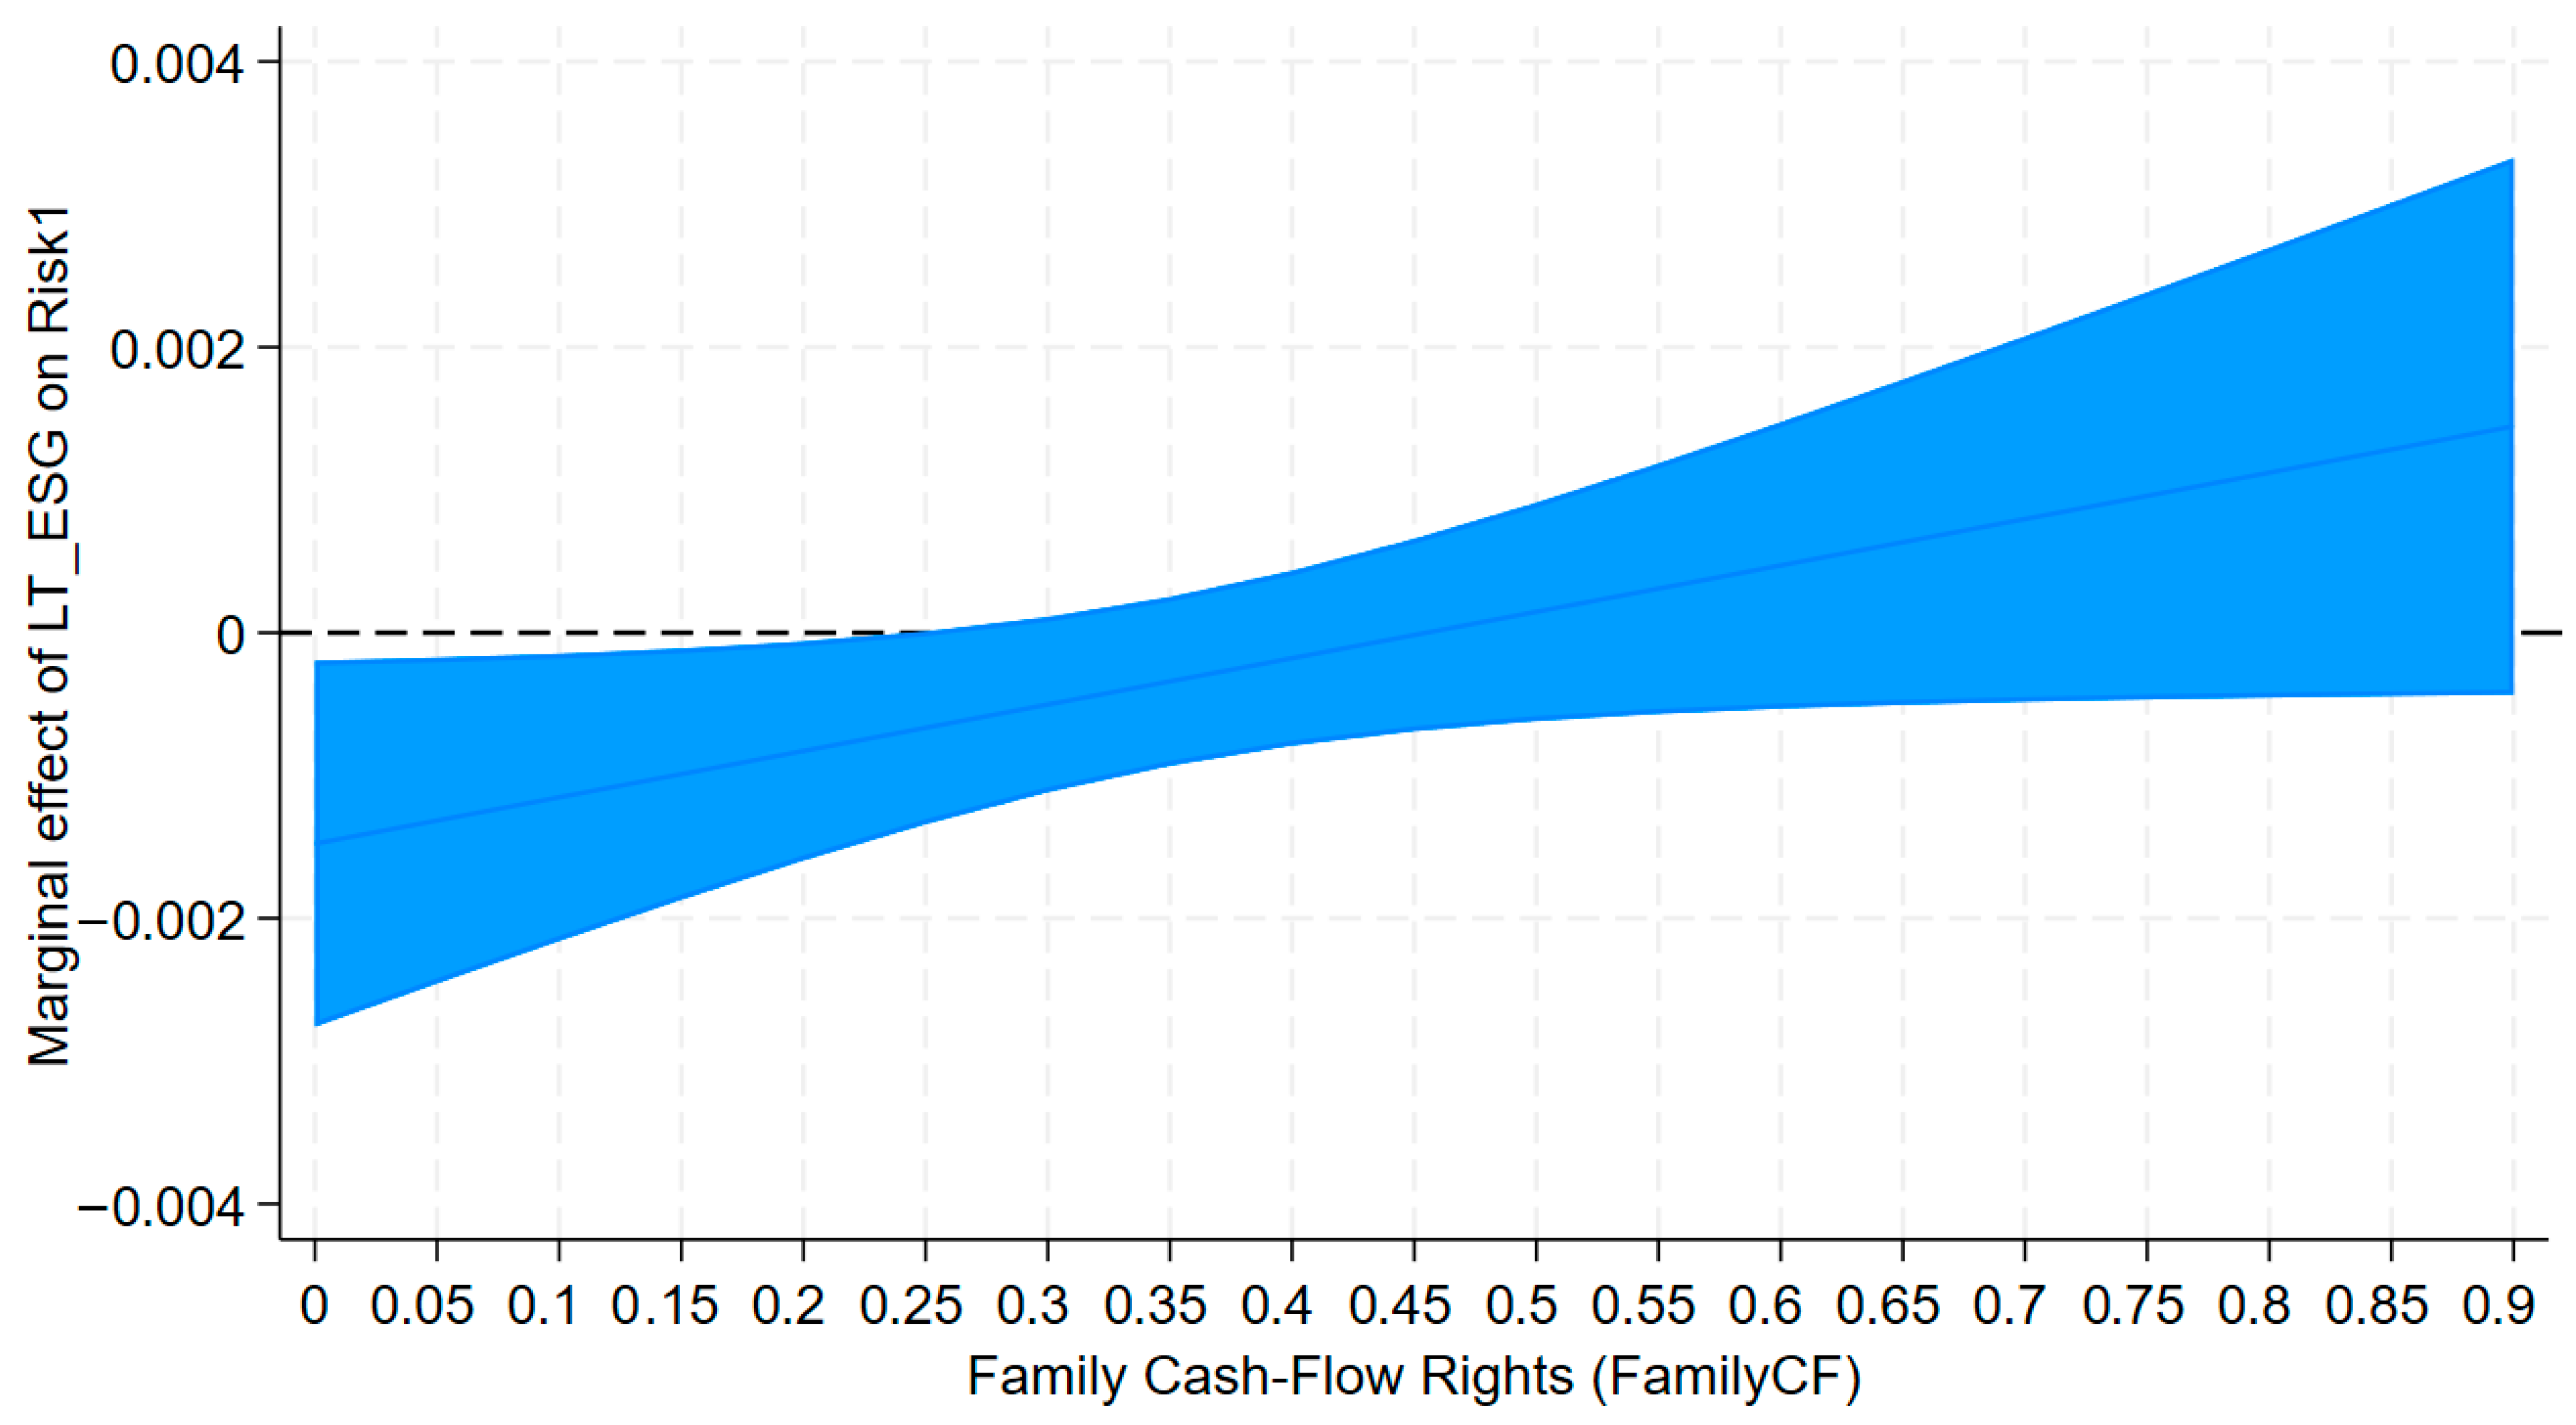
Interaction Effects and Economic Magnitude. To uncover the heterogeneous impact of sustainability engagement on corporate risk, we focus on marginal effects. Namely, we estimate the marginal effect of LT_ESG on corporate risk, conditional on FamilyCF (see Figure 3). We observe that the marginal effect of ESG depends on a company’s ownership structure. When family CF rights are small, the marginal effect of LT_ESG on corporate risk is negative, suggesting that a firm’s greater engagement in ESG initiatives leads to lower earning volatility. As the value of FamilyCF increases, the marginal effect declines and eventually becomes statistically insignificant. To sum up, the risk management properties of ESG depend on the company’s ownership structure. In particular, the benefits associated with ESG as a risk management strategy appear to be more significant in less family-owned firms than in highly family-controlled ones. From an economic perspective, the effect size is quite pronounced. It should be noted that comparing the changes in the marginal effect of LT_ESG with increases in FamilyCF and the earning volatility reported in Table 3 can be enlightening.
The results presented above provide empirical evidence on the relationship among ESG engagement, family governance, and corporate risk. The following subsection discusses these findings in relation to the existing literature and highlights their theoretical implications.

5.1. Discussion and Positioning of Results Within the ESG and Family Business Literature

This subsection interprets the empirical findings by relating them to the existing literature on ESG performance, family governance, and corporate risk. The interpretation explicitly builds on the competing theoretical mechanisms discussed in the hypotheses section, allowing the empirical results to be assessed in light of both risk-reducing and risk-enhancing channels associated with ESG engagement and family governance. The results indicate that only sustained ESG engagement contributes to risk mitigation, supporting prior evidence that long-term sustainability improves firm stability (Khaw et al., 2025; Adardour et al., 2025; Lee & Koh, 2024). Consistent with N. M. Nguyen et al. (2025), ESG performance appears to reduce corporate risk through enhanced stakeholder relations, lower regulatory exposure, and reduced information asymmetry. At the same time, the findings emphasize the dynamic nature of ESG, suggesting that its effects materialize gradually rather than instantaneously (Häußler & Ulrich, 2024; Khurshid et al., 2026). The evidence on family governance is also in line with the socioemotional wealth perspective. Both family ownership and family management are negatively associated with corporate risk, reflecting the long-term orientation and risk aversion typical of family-controlled firms (Santos et al., 2022; Hernández-Perlines et al., 2019; Mariani et al., 2023). Importantly, distinguishing between ownership and management allows the analysis to identify different mechanisms through which family involvement affects firm outcomes. Finally, the interaction results show that family ownership moderates the ESG–risk relationship. Specifically, the risk-reducing effect of ESG is weaker in firms with stronger family control, suggesting diminishing marginal benefits of sustainability when governance structures already promote stability. This finding connects stakeholder theory and information-asymmetry arguments (Lins et al., 2017) with agency theory and socioemotional wealth, highlighting that the effectiveness of ESG strategies depends on the underlying ownership structure.

5.2. Robustness Checks Using an Alternative Measure of Corporate Risk

To assess the robustness of the baseline findings discussed above, an alternative proxy for firm risk (AltRisk) is employed. This measure is defined as the difference between the highest and lowest industry-adjusted ROA over a rolling three-year window. The new proxy differs from the conventional proxy, which uses the standard deviation measure and is concerned with extreme movements rather than dispersion. The regression with the baseline specification, firm and year fixed effects, and AltRisk clustering of standard errors yields analogous results: the long-term ESG score coefficient remains negative but is statistically insignificant. This suggests that the effect of ESG on risk varies across proxies (Albuquerque et al., 2020; Broadstock et al., 2021). Similarly, the ESG-family ownership interaction coefficient is still negative and statistically insignificant. This implies that the main relationships are not entirely attributable to the baseline risk specification, while alternative risk measures capture different aspects of risk, especially across diverse economic environments (Billah et al., 2023). The robustness specification is as follows:
A l t R i s k i t   =   m a x ( A d j R O A i t ,   A d j R O A i , t 1 ,   A d j R O A i , t 2 )                                                               m i n ( A d j R O A i t ,   A d j R O A i , t 1 ,   A d j R O A i , t 2 ) .
This metric evaluates operating variability based on its amplitude rather than its dispersion. Thus, this measure provides an additional dimension compared to the standard proxy, the standard deviation, used in empirical studies. Using industry-adjusted ROA makes the analysis of financial risk more accurate because it accounts for differences across industries. I estimate the baseline model using this new risk measure within a fixed-effects framework, controlling for both firm and year effects and clustering standard errors. Results remain qualitatively similar. The long-term ESG variable continues to have a negative coefficient but becomes statistically insignificant, corroborating previous literature suggesting that associations between ESG and risk variables can be influenced by the choice of risk proxy (Albuquerque et al., 2020; Broadstock et al., 2021). A similar result is true for the interaction between the ESG score and family ownership. Thus, this robustness test indicates that the findings of the main analysis are not driven by the choice of risk measure, while also highlighting the differences in their meanings (Billah et al., 2023). The robustness test uses the following equation:
A l t R i s k i t   =   α +   β 1 ( L T _ E S G i t )   +   β 2 ( F a m i l y C F i t )   +   β 3 ( L T _ E S G i t   ×   F a m i l y C F i t ) +   β 4 ( F a m C E O i t )   +   β 5 ( B o a r d S i z e i t )   +   β 6 ( F i r m S i z e i t ) +   β 7 ( T a n g i b i l i t y i t )   +   β 8 ( F C i t )   +   μ i   +   λ t   +   ε i t
In our specification, AltRisk_it stands for extreme ROA adjusted for industry within a three-year rolling window and serves as another measure of volatility to help us assess firm performance (Albuquerque et al., 2020; Broadstock et al., 2021). The independent variable of interest is LT_ESG_it, whereas FamilyCF_it is a measure of family governance. The interaction term allows us to assess the impact of family ownership on the ESG-risk relationship. We include control variables such as family CEO (FamCEO_it), board size, firm size, tangibility, and financial constraints (Billah et al., 2023). Firm and year fixed effects are included in our specification, and ε_it is the error term. In total, this specification helps test the relationships between ESG and corporate risk, as well as the effects of family ownership. Table 7 contains robustness tests of our baseline specification, using AltRisk. Long-term ESG (LT_ESG) retains a negative coefficient, but it is statistically insignificant, suggesting that the ESG-risk relationship depends on the choice of risk measures (Albuquerque et al., 2020; Broadstock et al., 2021). Neither family ownership nor its interaction with ESG shows statistical significance, and the same conclusion holds for our family CEOs. Of the control variables, board size and financial constraints are positively and significantly related to corporate risk, consistent with previous studies (Farre-Mensa & Ljungqvist, 2016; Billah et al., 2023), whereas neither firm size nor tangibility matters. An increase in risk across years is observed. Altogether, we validate our conclusions through robustness tests, while noting differences in risk measures used. See Table 7.
The robustness specification is tested using a fixed-effects panel regression that controls for unobserved heterogeneity across firms (Wooldridge, 2010; Baltagi, 2008). The sample data consists of 9034 observations from 1883 firms. This specification has significant explanatory power, but its explanatory power is weak, a feature normally common to firm-level panel data models (Baltagi, 2008). Clustering standard errors improves the credibility of the results by correcting for heteroskedasticity and within-firm correlation (). See Table 8.
While the fixed-effects regressions identify the average relationships among ESG engagement, family governance, and corporate risk, they may not fully capture heterogeneity across firms. To complement the regression evidence, the next section applies clustering techniques to identify distinct firm profiles based on ESG performance, family involvement, and risk characteristics.

6. Clustering Analysis: Identification of Firm Profiles

Based on the regression analysis results, clustering analysis will be used to classify firms by ESG performance, family governance, and firm risk factors. To ensure consistency across all predictors, data standardization is performed before clustering, followed by K-means clustering with Euclidean distance as the default metric, a popular technique in statistical learning (James et al., 2021). Clustering is performed by examining silhouette scores and economic interpretability. The clustering is validated through several indices, such as the Calinski–Harabasz, Dunn, entropy, and maximum diameter indices to assess the tightness and dispersion of the clustered groups (Akhanli & Hennig, 2023). Clustering analysis is an exploratory technique that complements regression analysis, providing additional insights into firm heterogeneity. Among the other algorithms tested, K-means clustering is selected for its robustness in validation metrics. Consistent with Varian (2018), the clustering analysis will provide more information about data structure without making causal claims. See Table 9.
The selection of the 10-cluster solution is based on a combination of silhouette statistics and economic interpretability. While silhouette values provide information about cluster cohesion and separation, they are insufficient on their own in high-dimensional settings. The 10-cluster specification provides a meaningful representation of firm heterogeneity across ESG, family governance, and risk, despite some variation in cluster separation. Therefore, clustering results should be interpreted as an exploratory tool that complements regression analysis rather than as a strict classification. Table 10 summarizes the main characteristics of the selected clustering solution.
The number of observations per cluster is quite similar, implying that no cluster dominates the others. As far as heterogeneity and dispersion within clusters are concerned, there appears to be consistency in these aspects; however, some heterogeneity and variability regarding density and separation still remain. For example, there are clusters with high separation, but some clusters have lower homogeneity owing to overlap, which is a feature of empirical clustering (Vendramin et al., 2010; Hennig, 2007). Therefore, from the above discussion, it can be said that the clusters that have been identified show heterogeneous nature among firms. There are clusters that possess good ESG scores and low risk, while there are other clusters that demonstrate bad sustainability practices and high risk. Moreover, differences have been noticed between clusters concerning the issue of family ownership and management. The table below (Table 11) provides information about the centroids of standardized variables for the clusters. If the value is positive (negative), it implies that firms fall into clusters with high (low) ESG, governance, size, and risk compared to the mean value of all firms.
In regard to clustering, heterogeneity is noticeable in firm’s performance on ESG criteria, family governance, governance structure, firm size, and risk levels. There is much difference between firms within different clusters in engagement in ESG initiatives; certain clusters show superior sustainability performance compared to other clusters, emphasizing the growing importance of ESG for firm development (Zhang et al., 2025). Furthermore, ownership and management within family governance also have variations across clusters and do not always intersect, thus being specific traits of certain firms. Differences in terms of governance structure are consistent with prior studies, confirming the impact of contemporary governance practices and organizational forms on firms’ behavior (Fredson et al., 2024). Apart from governance structure, firm size can also be distinguished in terms of clustering analysis of firms. The most significant differences exist in risk levels, showing considerable variability, with some companies having high risk, whereas others display low risk. Such conclusion can be drawn based on previous studies on heterogeneity in firm risk and related climate risks (Sautner et al., 2023). Clustering provides exploratory classification, thus does not measure prediction performance. For this reason, the next section utilizes the machine learning approach in order to estimate predictive accuracy.

7. Machine Learning Analysis: Predictive Performance and Non-Linear Patterns

Building on the clustering results, machine learning techniques are applied to assess predictive performance and capture potential non-linear relationships among ESG engagement, family governance, and corporate risk. Among the models considered, Random Forest is selected due to its reliable and stable performance across multiple error-based metrics, as well as its ability to capture complex patterns in the data. It provides a balanced trade-off between prediction accuracy and goodness of fit compared to alternative approaches. See Table 12.
Upon analysis of non-standardized measures of performance, one can observe that most of the models have almost equal predictive accuracy levels. Measures such as the Root Mean Square Error and Mean Absolute Error have almost similar values for all models except for LASSO, whose performance is slightly lower than others. In terms of explaining the data, LASSO shows a higher value for R2. However, these values are relatively lower, indicating poor fitting models. Values for MAPE are high for all models, which may be caused by small values for the dependent variable. See Table 13.
Machine Learning Design: Data Partitioning and Hyperparameter Configuration. To address the reviewer’s concerns, Table 14 presents the design of the machine learning model, including data splitting and relevant hyperparameters. Specifically, the data is divided into a training set (64%), a validation set (16%), and a testing set (20%), creating a clear distinction between model estimation, hyperparameter optimization, and out-of-sample evaluation (Géron, 2022). Moreover, subsampling and limiting the number of variables included at each tree’s splitting step are used to increase diversity, a common approach in ensemble machine learning algorithms such as random forests (Biau & Scornet, 2016). Hyperparameter optimization is performed using a validation set, with the number of trees limited to 100 due to time and computational costs. Before estimating the models, the input variables are standardized for numerical reasons and to allow equal comparison across the different predictors (Géron, 2022). This work uses hold-out cross-validation, separating model estimation, hyperparameter optimization, and out-of-sample evaluation. The performance of machine learning models is evaluated using various metrics (MSE, RMSE, MAE, MAPE, and R2), all of which are commonly used to measure prediction accuracy (Franklin, 2005). Furthermore, out-of-bag predictions are used to estimate prediction accuracy and reduce overfitting in an ensemble framework (Biau & Scornet, 2016). Variable importance is calculated using permutation methods, while model interpretation uses additive explanations of test data points (Géron, 2022). See Table 14.
Validation Process. To improve the stability of the machine learning algorithm, a validation method was introduced that used the training set. Namely, 20% of the training samples were randomly assigned to the validation subset, while the other samples comprised the estimation subset. Both model parameter optimization and model selection were performed on the validation set, ensuring that the selected parameters were not dependent on the test dataset. This approach is consistent with common methods used in supervised learning for predicting model generalization and avoiding overfitting (Xu & Goodacre, 2018; Géron, 2022). The predictive ability of the selected model was tested on the test subset, which was kept separate from the training and validation datasets.
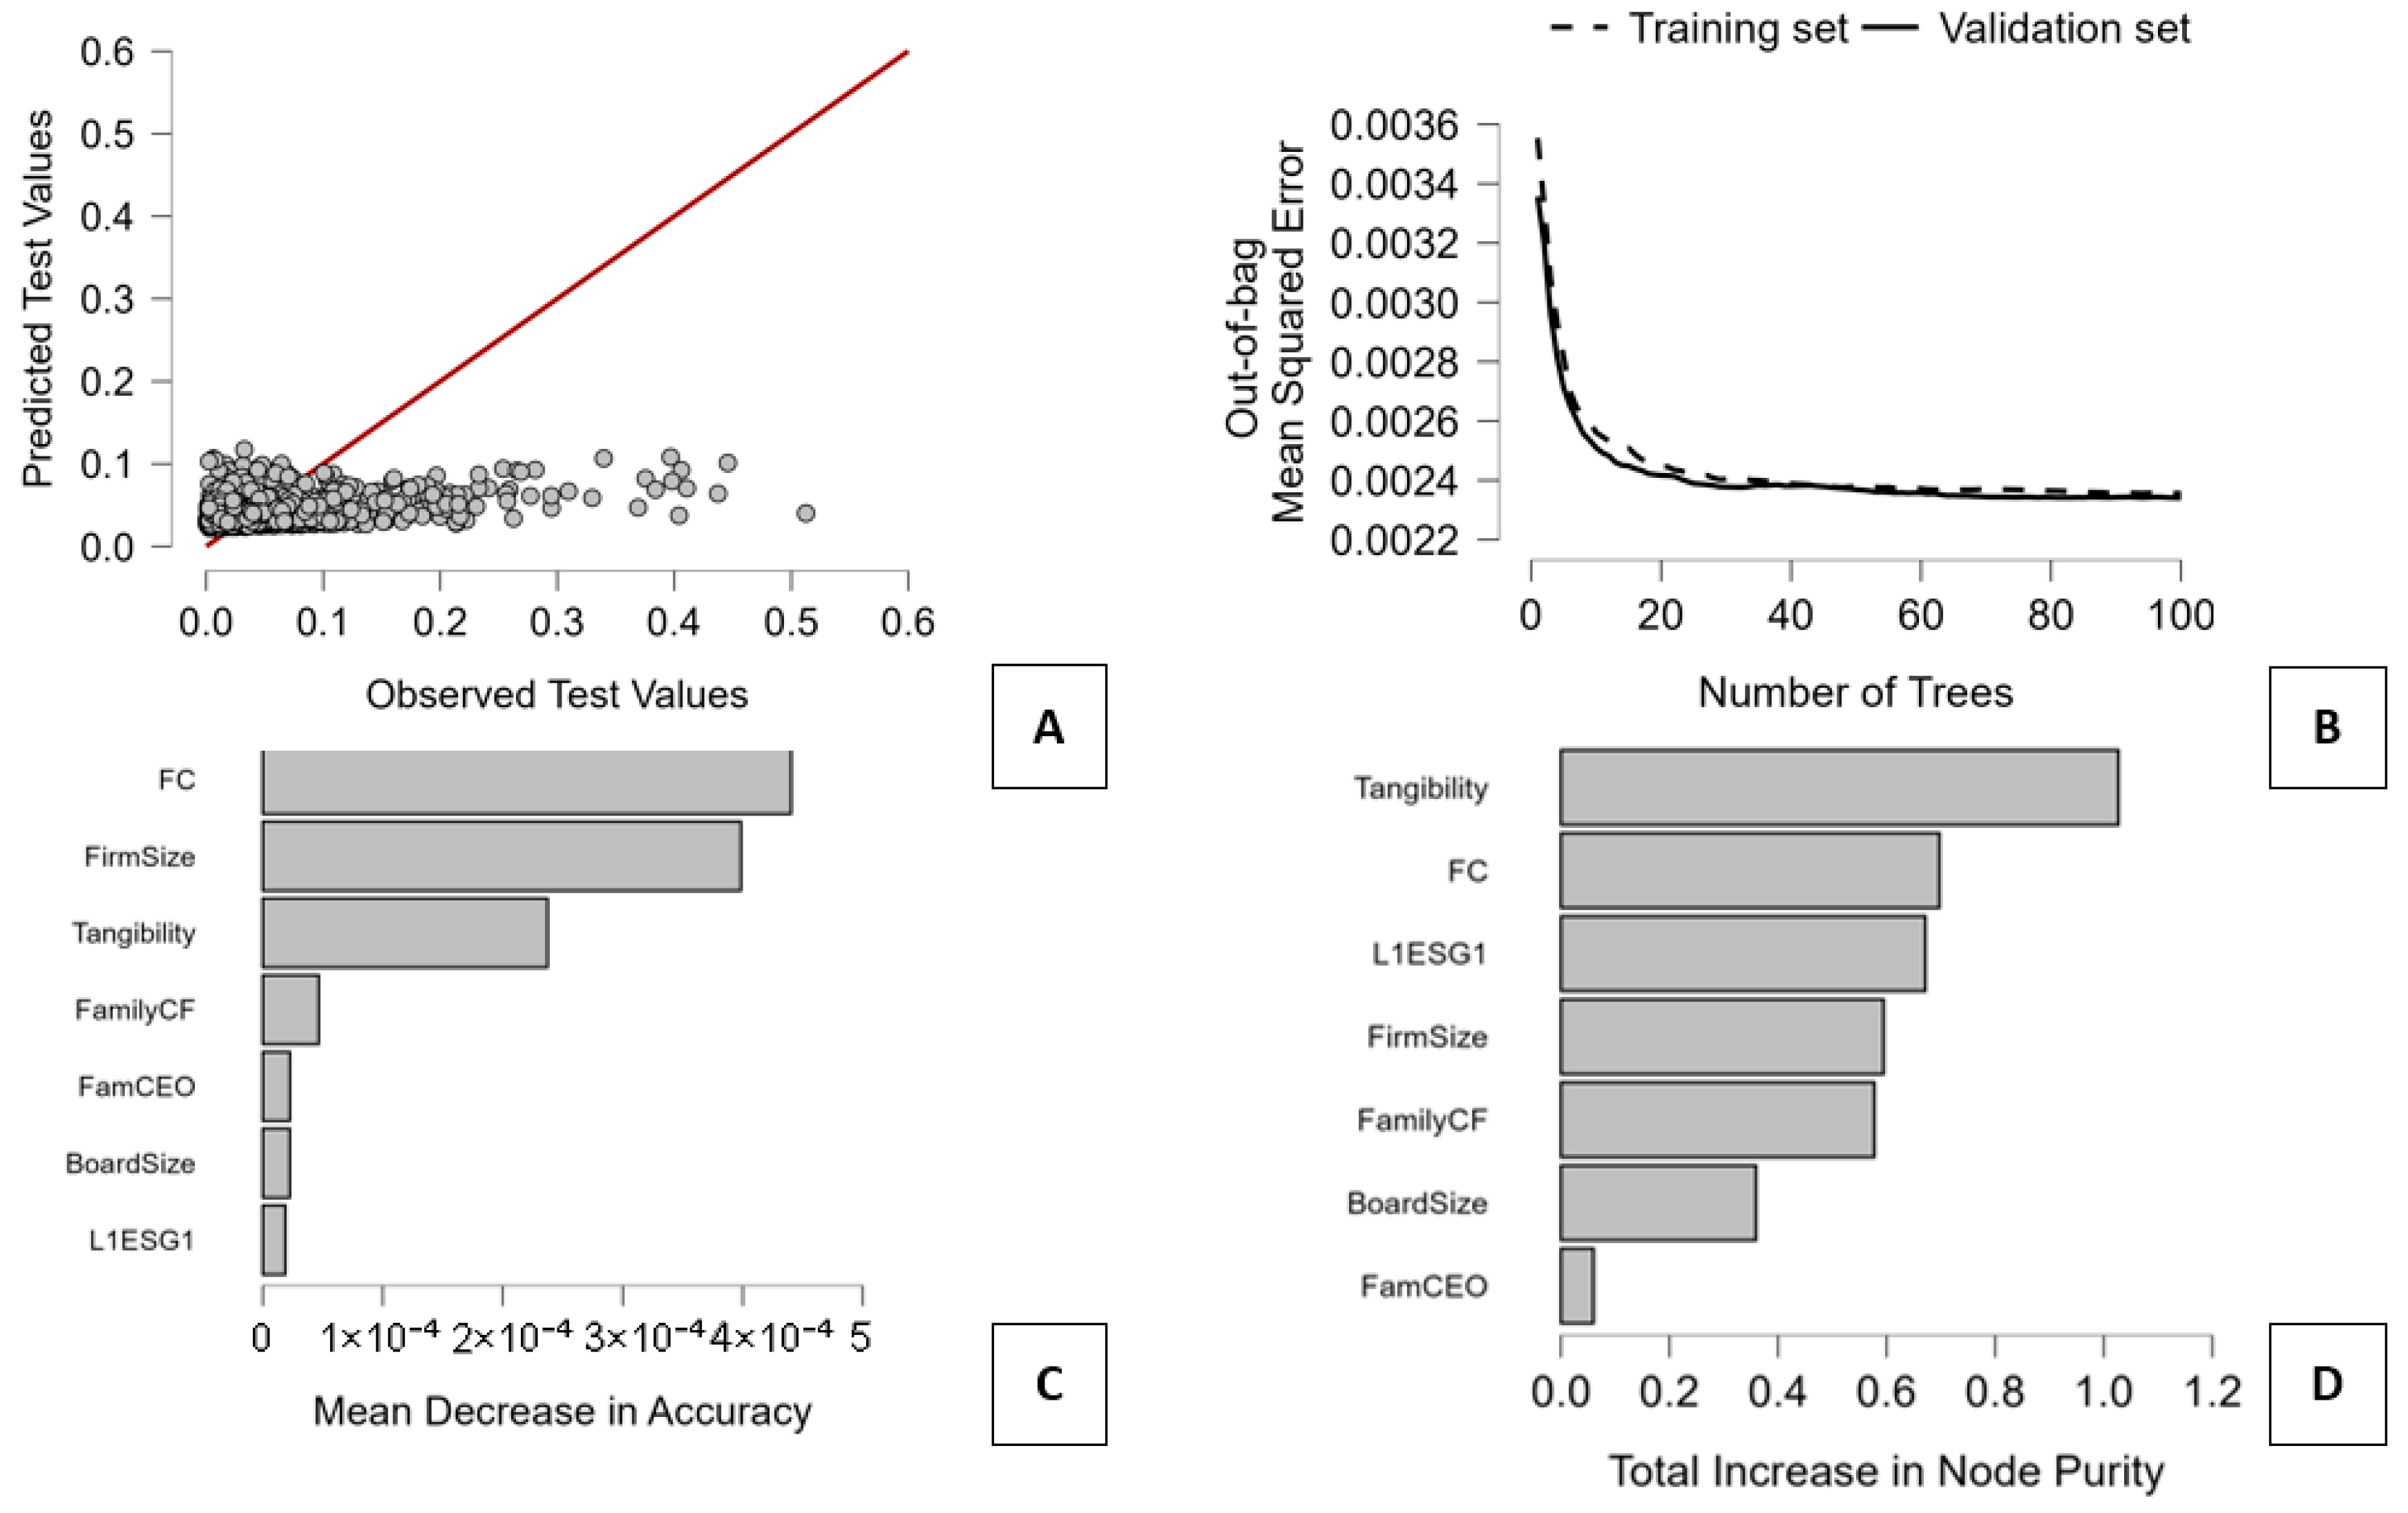
Machine Learning Reproducibility Information. For purposes of replicability, we describe the data, software, and model settings. Machine learning is performed using JASP with publicly accessible data from Mendeley Data (Khaw et al., 2025). The steps in preparing data are explained in the data section. The machine learning approach consists of splitting into training, validation, and test sets, and hyperparameters are optimized on the validation set. Random Forest uses bootstrapping (random subsampling with 50% of observations per tree), uses one feature per split, and uses at most 100 trees (ensemble-learning best practices according to Biau & Scornet, 2016; Géron, 2022). The availability of data and the settings of models improve replicability (Pineau et al., 2021). Three measures of variable importance in Table 15 are the mean decrease in accuracy, the total increase in node purity, and the mean dropout loss. These measures have become standard in analyzing predictive importance for models and features (Fisher et al., 2019). The findings show that the most relevant explanatory variables are asset tangibility, financial constraints, and firm size, whereas ESG and governance variables are relatively unimportant. These measures indicate predictive importance instead of causal relationships. Notably, ESG and governance variables can be predictive factors for corporate risks but may not perform well in terms of predictive accuracy in a machine learning context. The explanation relates to the current research on explainable artificial intelligence, which clarifies the distinction between prediction and causal inference (Arrieta et al., 2020). Therefore, using both econometric approaches and machine learning methods allows for more thorough analysis.
Table 16 reports additive explanations for the predictions of five test set cases, decomposing each predicted value into a common baseline component and the individual contributions of the explanatory variables.
The baseline value is the average model prediction, corrected for each variable’s contribution at the observation level. The results show significant heterogeneity in the effects of each variable on the model’s predictions. In particular, financial constraints and governance-related variables tend to become important predictors, whereas the impact of ESG factors, ownership, and balance sheet attributes tends to be more situational. In sum, the results presented above demonstrate the applicability of additive explanations for accounting for heterogeneous relationships. The importance of each variable was calculated using a permutation method. As for the random forest algorithm’s performance, it was estimated using out-of-bag estimates. Figure 1 illustrates the model’s performance and the main explanatory variables. It can be noted that the overall structure of the predictions is consistent with the real values; however, the extreme points are somewhat smoothed due to the nature of tree-based models and their tendency to reduce variance. The number of trees does not lead to overfitting and improves the model’s stability. See Figure 4.

8. Integrated Discussion: A Unified View of ESG, Family Firms, and Risk

This part discusses the implications of results from econometric analysis, clustering, and machine learning for interpreting the impact of sustainability and family governance on firm risk. The methods were used together rather than separately: econometrics shows average relationships between variables, while clustering and machine learning uncover heterogeneity and nonlinearity. To begin with, one can conclude that both the time horizon of ESG engagement and family involvement in corporate governance are critical determinants of the company’s risk profile. In particular, shorter ESG horizons do not appear to affect the risk profile, whereas long-term ESG activities help stabilize earning volatility. Thus, the benefits of sustainable corporate behavior emerge over time, suggesting that sustainability requires patience and persistence to achieve results. In terms of family governance, the presence of family owners and managers contributes to reduced risk, given the nature of such companies—they have long-term strategies and a motivation to monitor the performance of business processes. Still, there seems to be an interaction effect, suggesting that the ESG risk-reduction effect becomes weaker as family ownership increases. In other words, ESG becomes less effective for family corporations since the risks have already been minimized by well-developed governance structures. Furthermore, based on the cluster analysis outcomes, firm heterogeneity in sustainability practices, governance, and risk is high. Thus, the companies under consideration have chosen different sustainability and governance paths. Finally, the machine learning results demonstrate the importance of using ESG- and governance-related variables in corporate risk prediction models. See Table 17.
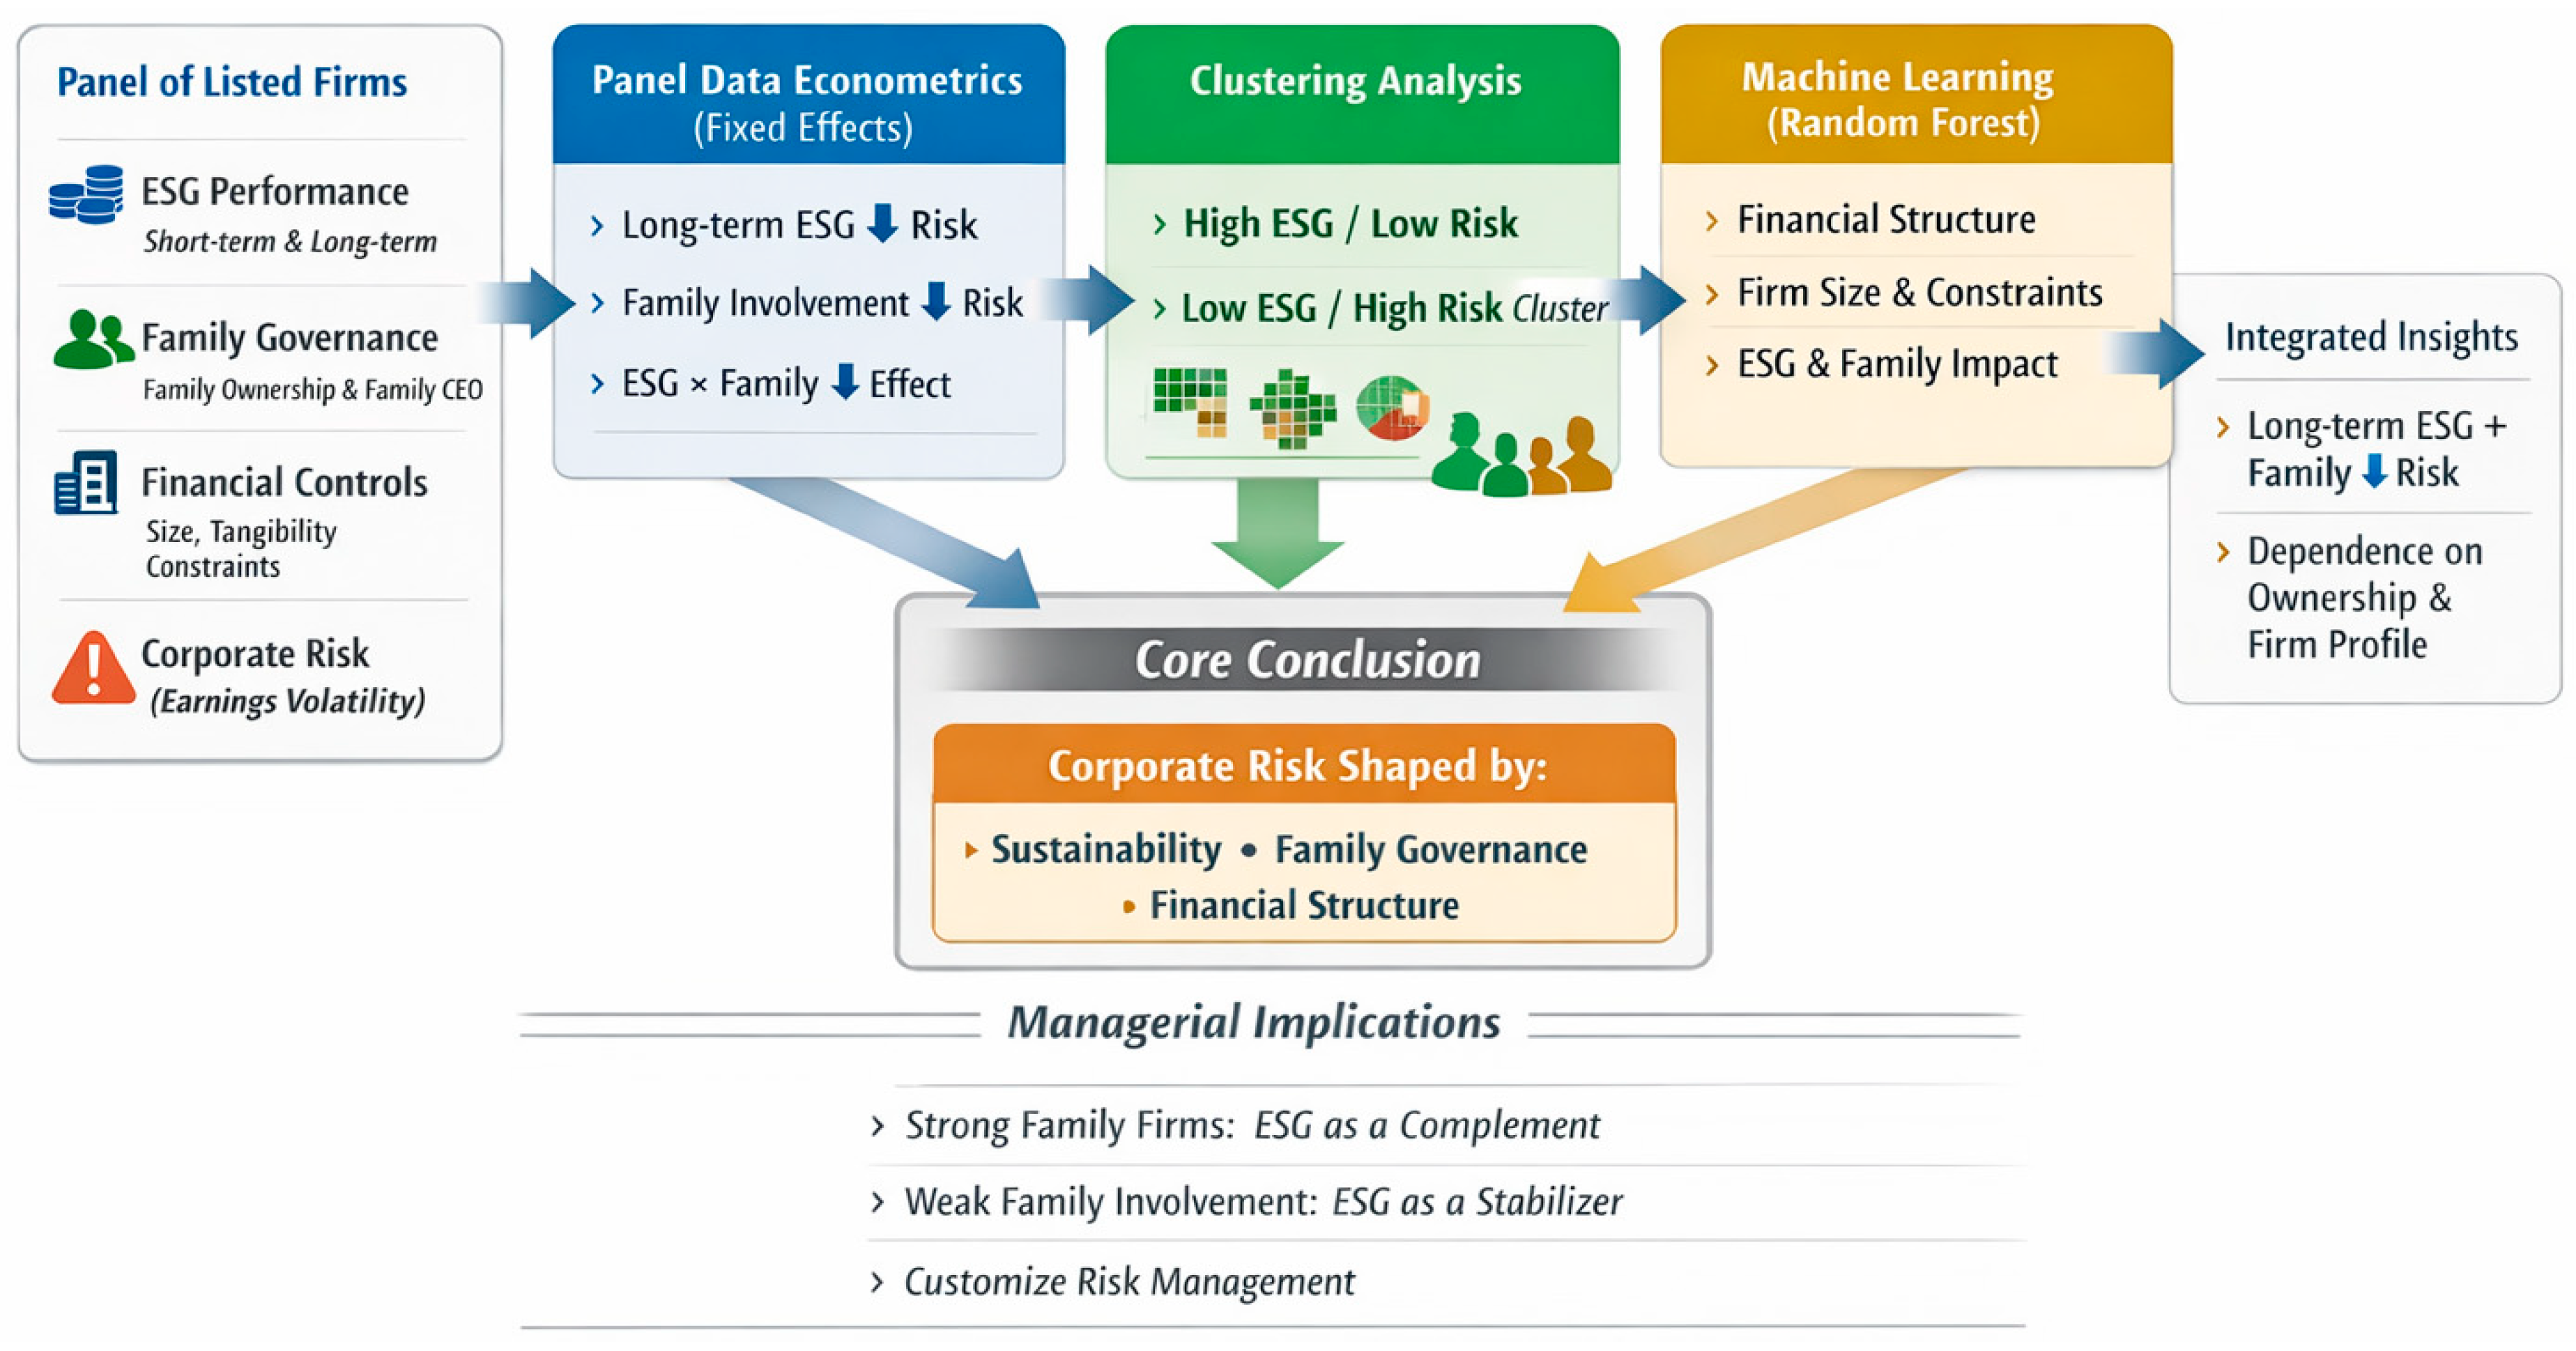
Figure 5 provides a graphical summary of the analytical approach and the study’s main findings. It provides a concise summary of the overall logic of the research process, presented as a logical sequence linking data, methodological tools, and conclusions within an analytical framework.
Figure 5 provides a synthesis of the research design and main findings. It illustrates how corporate risk is jointly shaped by ESG performance, family governance, and financial characteristics, and how these relationships are examined through econometric, clustering, and machine learning approaches. Overall, the figure highlights the complementary role of these methods in capturing structural relationships, firm heterogeneity, and predictive dynamics, supporting a unified view of corporate risk.
Theoretical Implications and Interpretation. The findings could be discussed with reference to well-developed theories concerning sustainability and family companies. Firstly, the negative correlation between long-term ESG engagement and business risk is explained by stakeholder and information asymmetry theories, which posit that sustainability positively affects stakeholder communication and transparency (Gillan et al., 2021). Secondly, the differentiation between short- and long-term ESG is based on a dynamic approach, according to which sustainability gradually offers certain advantages. Thirdly, the findings on the influence of family governance align with socioemotional wealth theory, which holds that both ownership and management in family-owned enterprises reduce risks and make companies more resilient (Miroshnychenko et al., 2024). Finally, family governance serves as a moderator, suggesting that the role of ESG is influenced by ownership structure, consistent with previous findings on this aspect (Ferrell et al., 2016). In general, the research enables the integration of several approaches into a single picture. See Table 18.
Overall, the integrated evidence provides a coherent interpretation of how ESG engagement and family governance jointly influence corporate risk. The next section discusses the main limitations of the study and outlines directions for future research.

9. Limitations and Directions for Future Research

Although an attempt was made to present a cohesive body of evidence, the current study has several limitations that warrant discussion and consideration in future studies. First, even with fixed effects and lagged controls employed, endogeneity bias may persist, and future researchers may address it through instrumental-variable regressions or quasi-experimental designs widely used in the corporate finance literature (Roberts & Whited, 2013). Second, the ESG metric is represented by composite measures that do not account for differences in underlying metrics, nor for potential measurement error arising from disparities in methodologies and aggregations (Berg et al., 2022). Third, while the risk metric reflects business uncertainty, it fails to address other types of risk, including market and downside risk, leaving room for a broader discussion of corporate risks (Kelly et al., 2019). Fourth, clustering is essentially descriptive and depends heavily on modeling choices, whereas machine learning is driven by predictive ability rather than causal inference. Finally, the results may lack external validity beyond the particular institutional environment investigated. Despite these limitations, the research contributes to the literature on ESG activities, family businesses, and risk-taking, which will be covered in more detail below.

10. Conclusions

This paper analyzes the combined impact of sustainability strategies and family governance on corporate risk using panel regressions, cluster analysis, and machine learning methods. All empirical evidence indicates that the presence of long-term sustainability strategies reduces business risk, whereas the impact of short-term sustainability strategies is statistically insignificant. Thus, long-term sustainability, as reflected in the regression coefficient (–0.0015), has a significant impact on reducing earning volatility relative to the dataset’s average dependent variable (0.033). Moreover, the presence of the family governance mechanism helps to decrease corporate risks through the impact of cash flow rights and the CEO family indicator, which have negative coefficients. Nevertheless, there is an important interaction between the long-term sustainability strategy and family governance that indicates diminishing returns on the impact of the former variable as the family ownership increases. Cluster analysis shows that firm characteristics vary depending on their involvement in sustainability efforts and the use of governance mechanisms, and highlights low- and high-risk clusters with distinct combinations of these elements. The results from machine learning confirm the importance of financial constraints, size, and tangibility, but indicate that sustainability strategies and governance are more important in certain cases. Overall, the findings show that corporate risk depends on the combined use of sustainability and governance tools. ESG does not have a consistent effect on firms’ risk levels.

Author Contributions

Conceptualization, A.L., M.S., A.C., C.D., M.A.; methodology, A.L., M.S., A.C., C.D., M.A., validation, A.L., M.S., A.C., C.D., M.A., formal analysis, A.L., M.S., A.C., C.D., M.A.; investigation, A.L., M.S., A.C., C.D., M.A.; resources, A.L., M.S., A.C., C.D., M.A.; data curation, A.L., M.S., A.C., C.D., M.A.; writing—original draft preparation, A.L., M.S., A.C., C.D., M.A., writing—review and editing, A.L., M.S., A.C., C.D., M.A.; supervision, A.L., M.S., A.C., C.D., M.A.; project administration, A.L., M.S., A.C., C.D., M.A. All authors have read and agreed to the published version of the manuscript.

Funding

This research received no external funding.

Institutional Review Board Statement

Not applicable.

Informed Consent Statement

Not applicable.

Data Availability Statement

The data used in this study are publicly available from Mendeley Data: Khaw et al. (2025).

Conflicts of Interest

The authors declare no conflict of interest.

References

  1. Adardour, Z., Ed-Dafali, S., Sbai, H., & Hussainey, K. (2025). ESG performance, family ownership, and corporate risk-taking: The moderating role of the CSR committee. International Journal of Finance and Economics. Advance online publication. [Google Scholar] [CrossRef] [Scilit]
  2. Akhanli, S. E., & Hennig, C. (2023). Clustering of football players based on performance data and aggregated clustering validity indexes. Journal of Quantitative Analysis in Sports, 19(2), 103–123. [Google Scholar] [CrossRef] [Scilit]
  3. Albuquerque, R., Koskinen, Y., Yang, S., & Zhang, C. (2020). Resiliency of environmental and social stocks: An analysis of the exogenous COVID-19 market crash. The Review of Corporate Finance Studies, 9(3), 593–621. [Google Scholar] [CrossRef] [Scilit] [PubMed]
  4. Anderson, R. C., & Reeb, D. M. (2003). Founding-family ownership and firm performance: Evidence from the S&P 500. The Journal of Finance, 58(3), 1301–1328. [Google Scholar]
  5. Arrieta, A. B., Díaz-Rodríguez, N., Del Ser, J., Bennetot, A., Tabik, S., Barbado, A., Garcia, S., Gil-Lopez, S., Molina, D., Benjamins, R., Chatila, R., & Herrera, F. (2020). Explainable Artificial Intelligence (XAI): Concepts, taxonomies, opportunities and challenges toward responsible AI. Information Fusion, 58, 82–115. [Google Scholar] [CrossRef] [Scilit]
  6. Baltagi, B. H. (2008). Econometric analysis of panel data (Vol. 4, pp. 135–145). John Wiley & Sons. [Google Scholar]
  7. Berg, F., Kölbel, J. F., & Rigobon, R. (2022). Aggregate confusion: The divergence of ESG ratings. Review of Finance, 26(6), 1315–1344. [Google Scholar] [CrossRef] [Scilit]
  8. Berrone, P., Cruz, C., & Gomez-Mejia, L. R. (2012). Socioemotional wealth in family firms: Theoretical dimensions, assessment approaches, and agenda for future research. Family Business Review, 25(3), 258–279. [Google Scholar] [CrossRef] [Scilit]
  9. Biau, G., & Scornet, E. (2016). A random forest guided tour. Test, 25(2), 197–227. [Google Scholar] [CrossRef] [Scilit]
  10. Billah, M., Elsayed, A. H., & Hadhri, S. (2023). Asymmetric relationship between green bonds and Sukuk markets: The role of global risk factors. Journal of International Financial Markets, Institutions and Money, 83, 101728. [Google Scholar] [CrossRef] [Scilit]
  11. Bolton, P., & Kacperczyk, M. (2021). Do investors care about carbon risk? Journal of Financial Economics, 142(2), 517–549. [Google Scholar] [CrossRef] [Scilit]
  12. Boubaker, S., Cellier, A., Manita, R., & Saeed, A. (2020). Does corporate social responsibility reduce financial distress risk? Economic Modelling, 91, 835–851. [Google Scholar] [CrossRef] [Scilit]
  13. Broadstock, D. C., Chan, K., Cheng, L. T., & Wang, X. (2021). The role of ESG performance during times of financial crisis: Evidence from COVID-19 in China. Finance Research Letters, 38, 101716. [Google Scholar] [CrossRef] [Scilit] [PubMed]
  14. Carroll, A. B. (1991). The pyramid of corporate social responsibility: Toward the moral management of organizational stakeholders. Business Horizons, 34(4), 39–48. [Google Scholar] [CrossRef] [Scilit]
  15. Chen, J., Wang, C., Wang, Q., & Luo, B. (2019). Sibling rivalry vs. brothers in arms: The contingency effects of involvement of multiple offsprings on risk taking in family firms. Sustainability, 11(16), 4447. [Google Scholar] [CrossRef] [Scilit]
  16. Cheng, B., Ioannou, I., & Serafeim, G. (2014). Corporate social responsibility and access to finance. Strategic Management Journal, 35(1), 1–23. [Google Scholar] [CrossRef] [Scilit]
  17. Chrisman, J. J., Chua, J. H., & Litz, R. A. (2004). Comparing the agency costs of family and non–family firms: Conceptual issues and exploratory evidence. Entrepreneurship Theory and Practice, 28(4), 335–354. [Google Scholar] [CrossRef] [Scilit]
  18. Christensen, D. M., Serafeim, G., & Sikochi, A. (2022). Why is corporate virtue in the eye of the beholder? The case of ESG ratings. The Accounting Review, 97(1), 147–175. [Google Scholar] [CrossRef] [Scilit]
  19. D’allura, G. M., Bannò, M., Leggerini, C., & Romano, F. (2026). When diversity meets family owners: ESG performance in European publicly listed firms. Corporate Social Responsibility and Environmental Management, 33(2), 1912–1931. [Google Scholar] [CrossRef] [Scilit]
  20. Dan, N., Shimizu, T., & Mohd, N. S. (2024). Charting new horizons in family tourism entrepreneurship and sustainability: Women in business succession. In Studies in systems, decision and control (Vol. 525, pp. 145–157). Springer. [Google Scholar]
  21. Dembek, K., Singh, P., & Bhakoo, V. (2016). Literature review of shared value: A theoretical concept or a management buzzword? Journal of Business Ethics, 137(2), 231–267. [Google Scholar] [CrossRef] [Scilit]
  22. Demsetz, H., & Lehn, K. (1985). The structure of corporate ownership: Causes and consequences. Journal of Political Economy, 93(6), 1155–1177. [Google Scholar] [CrossRef] [Scilit]
  23. Ding, W., Levine, R., Lin, C., & Xie, W. (2021). Corporate immunity to the COVID-19 pandemic. Journal of Financial Economics, 141(2), 802–830. [Google Scholar] [CrossRef] [Scilit]
  24. Doluca, H., Wagner, M., & Block, J. (2018). Sustainability and environmental behaviourin family firms: A longitudinal analysis of environment-related activities, innovation and performance. Business Strategy and the Environment, 27(1), 152–172. [Google Scholar] [CrossRef] [Scilit]
  25. Domańska, A., Hernández-Linares, R., Zajkowski, R., & Żukowska, B. (2024). Family firm entrepreneurship and sustainability initiatives: Women as corporate change agents. Business Ethics, the Environment and Responsibility, 33(2), 217–240. [Google Scholar] [CrossRef] [Scilit]
  26. Eccles, R. G., Ioannou, I., & Serafeim, G. (2014). The impact of corporate sustainability on organizational processes and performance. Management Science, 60(11), 2835–2857. [Google Scholar] [CrossRef] [Scilit]
  27. El Ghoul, S., Guedhami, O., Kim, H., & Park, K. (2018). Corporate environmental responsibility and the cost of capital: International evidence. Journal of Business Ethics, 149(2), 335–361. [Google Scholar] [CrossRef] [Scilit]
  28. Elkington, J., & Rowlands, I. H. (1999). Cannibals with forks: The triple bottom line of 21st century business. Alternatives Journal, 25(4), 42. [Google Scholar] [CrossRef] [Scilit]
  29. Erickson, T., & Whited, T. M. (2000). Measurement error and the relationship between investment and q. Journal of Political Economy, 108(5), 1027–1057. [Google Scholar] [CrossRef] [Scilit]
  30. Fama, E. F. (1970). Efficient capital markets: A review of theory and empirical work. The Journal of Finance, 25(2), 383–417. [Google Scholar] [CrossRef] [Scilit]
  31. Fama, E. F., & French, K. R. (1993). Common risk factors in the returns on stocks and bonds. Journal of Financial Economics, 33(1), 3–56. [Google Scholar] [CrossRef] [Scilit]
  32. Fama, E. F., & Jensen, M. C. (1983). Separation of ownership and control. The Journal of Law and Economics, 26(2), 301–325. [Google Scholar] [CrossRef] [Scilit]
  33. Farre-Mensa, J., & Ljungqvist, A. (2016). Do measures of financial constraints measure financial constraints? The Review of Financial Studies, 29(2), 271–308. [Google Scholar] [CrossRef] [Scilit]
  34. Ferrell, A., Liang, H., & Renneboog, L. (2016). Socially responsible firms. Journal of Financial Economics, 122(3), 585–606. [Google Scholar] [CrossRef] [Scilit]
  35. Fisher, A., Rudin, C., & Dominici, F. (2019). All models are wrong, but many are useful: Learning a variable’s importance by studying an entire class of prediction models simultaneously. Journal of Machine Learning Research, 20(177), 1–81. [Google Scholar]
  36. Flammer, C. (2021). Corporate green bonds. Journal of Financial Economics, 142(2), 499–516. [Google Scholar] [CrossRef] [Scilit]
  37. Franklin, J. (2005). The elements of statistical learning: Data mining, inference and prediction. The Mathematical Intelligencer, 27(2), 83–85. [Google Scholar] [CrossRef] [Scilit]
  38. Fredson, G., Adebisi, B., Ayorinde, O. B., Onukwulu, E. C., Adediwin, O., & Ihechere, A. O. (2024). Modernizing corporate governance through advanced procurement practices: A comprehensive guide to compliance and operational excellence. International Journal of Judicial Law, 3(1), 36–57. [Google Scholar] [CrossRef] [Scilit]
  39. Freeman, R. E. (2010). Strategic management: A stakeholder approach. Cambridge University Press. [Google Scholar]
  40. Gega, M., Höhler, J., Bijman, J., & Oude Lansink, A. (2025). Firm ownership and ESG performance in European agri-food companies: The mediating effect of risk-taking and time horizon. Corporate Social Responsibility and Environmental Management, 32(1), 1161–1181. [Google Scholar] [CrossRef] [Scilit]
  41. Géron, A. (2022). Hands-on machine learning with Scikit-Learn, Keras, and TensorFlow. O’Reilly Media, Inc. [Google Scholar]
  42. Gillan, S. L., Koch, A., & Starks, L. T. (2021). Firms and social responsibility: A review of ESG and CSR research in corporate finance. Journal of Corporate Finance, 66, 101889. [Google Scholar] [CrossRef] [Scilit]
  43. Gómez-Mejía, L. R., Haynes, K. T., Núñez-Nickel, M., Jacobson, K. J., & Moyano-Fuentes, J. (2007). Socioemotional wealth and business risks in family-controlled firms: Evidence from Spanish olive oil mills. Administrative Science Quarterly, 52(1), 106–137. [Google Scholar] [CrossRef] [Scilit]
  44. Gu, S., Kelly, B., & Xiu, D. (2020). Empirical asset pricing via machine learning. The Review of Financial Studies, 33(5), 2223–2273. [Google Scholar] [CrossRef] [Scilit]
  45. Gundry, L. K., Kickul, J. R., Iakovleva, T., & Carsrud, A. L. (2014). Women-owned family businesses in transitional economies: Key influences on firm innovativeness and sustainability. Journal of Innovation and Entrepreneurship, 3(1), 8. [Google Scholar] [CrossRef] [Scilit]
  46. Häußler, S., & Ulrich, P. (2024). Exploring strategic corporate sustainability management in family businesses: A systematic literature review. Review of Managerial Science. Advance online publication. [Google Scholar] [CrossRef] [Scilit]
  47. Hennig, C. (2007). Cluster-wise assessment of cluster stability. Computational Statistics & Data Analysis, 52(1), 258–271. [Google Scholar] [CrossRef] [Scilit]
  48. Hernández-Perlines, F., Moreno-García, J., & Yáñez-Araque, B. (2019). The influence of socioemotional wealth in the entrepreneurial orientation of family businesses. International Entrepreneurship and Management Journal, 15(2), 523–544. [Google Scholar] [CrossRef] [Scilit]
  49. Hollnagel, H. C., & Bueno, R. L. P. (2025). Corporate governance features and ESG Risk: A comparative analysis of listed companies in Brazil and the United States. International Journal of Risk, Fraud and Reliability, 1(1), 79–93. [Google Scholar]
  50. Ioannou, I., & Serafeim, G. (2015). The impact of corporate social responsibility on investment recommendations: Analysts’ perceptions and shifting institutional logics. Strategic Management Journal, 36(7), 1053–1081. [Google Scholar] [CrossRef] [Scilit]
  51. James, G., Witten, D., Hastie, T., & Tibshirani, R. (2021). Linear model selection and regularization. In An introduction to statistical learning: With applications in R (pp. 225–288). Springer. [Google Scholar]
  52. Jensen, M. C., & Meckling, W. H. (2019). Theory of the firm: Managerial behavior, agency costs and ownership structure. In Corporate governance (pp. 77–132). Gower. [Google Scholar]
  53. Kaplan, S. N., & Zingales, L. (1997). Do investment-cash flow sensitivities provide useful measures of financing constraints? The Quarterly Journal of Economics, 112(1), 169–215. [Google Scholar] [CrossRef] [Scilit]
  54. Kelly, B. T., Pruitt, S., & Su, Y. (2019). Characteristics are covariances: A unified model of risk and return. Journal of Financial Economics, 134(3), 501–524. [Google Scholar] [CrossRef] [Scilit]
  55. Khaw, K. L.-H., Wei, Y., & Ma, S. (2025). Family firms and risk taking: Does the integration of ESG practices matter? Emerging Markets Review, 69, 101359. [Google Scholar] [CrossRef] [Scilit]
  56. Khurshid, A., Xu, S., Khan, K., & Cifuentes-Faura, J. (2026). Resilience, Dynamic Capabilities, and ESG: The Strategic Connection. Business Strategy and the Environment, 1–15. [Google Scholar] [CrossRef] [Scilit]
  57. Kinder, P. D., Lydenberg, S. D., & Domini, A. L. (1993). Investing for good: Making money while being socially responsible. Harper Business. [Google Scholar]
  58. Kotsantonis, S., Pinney, C., & Serafeim, G. (2016). ESG integration in investment management: Myths and realities. Journal of Applied Corporate Finance, 28(2), 10–16. [Google Scholar] [CrossRef] [Scilit]
  59. Kölbel, J. F., Busch, T., & Jancso, L. M. (2017). How media coverage of corporate social irresponsibility increases financial risk. Strategic Management Journal, 38(11), 2266–2284. [Google Scholar] [CrossRef] [Scilit]
  60. Krueger, P., Sautner, Z., & Starks, L. T. (2020). The importance of climate risks for institutional investors. The Review of Financial Studies, 33(3), 1067–1111. [Google Scholar] [CrossRef] [Scilit]
  61. La Porta, R., Lopez-de-Silanes, F., & Shleifer, A. (1999). Corporate ownership around the world. The Journal of Finance, 54(2), 471–517. [Google Scholar] [CrossRef] [Scilit]
  62. Lee, J., & Koh, K. (2024). ESG performance and firm risk in the US financial firms. Review of Financial Economics, 42(3), 328–344. [Google Scholar] [CrossRef] [Scilit]
  63. Liao, L., Luo, L., & Tang, Q. (2015). Gender diversity, board independence, environmental committee and greenhouse gas disclosure. The British Accounting Review, 47(4), 409–424. [Google Scholar] [CrossRef] [Scilit]
  64. Lins, K. V., Servaes, H., & Tamayo, A. (2017). Social capital, trust, and firm performance: The value of corporate social responsibility during the financial crisis. The Journal of Finance, 72(4), 1785–1824. [Google Scholar] [CrossRef] [Scilit]
  65. Mariani, M. M., Al-Sultan, K., & De Massis, A. (2023). Corporate social responsibility in family firms: A systematic literature review. Journal of Small Business Management, 61(3), 1192–1246. [Google Scholar] [CrossRef] [Scilit]
  66. Markowitz, H. M. (2010). Portfolio theory: As I still see it. Annual Review of Financial Economics, 2(1), 1–23. [Google Scholar] [CrossRef] [Scilit]
  67. McWilliams, A., & Siegel, D. (2001). Corporate social responsibility: A theory of the firm perspective. Academy of Management Review, 26(1), 117–127. [Google Scholar] [CrossRef] [Scilit]
  68. Miller, D., & Le Breton-Miller, I. (2006). Family governance and firm performance: Agency, stewardship, and capabilities. Family Business Review, 19(1), 73–87. [Google Scholar] [CrossRef] [Scilit]
  69. Miroshnychenko, I., Vocalelli, G., De Massis, A., Grassi, S., & Ravazzolo, F. (2024). The COVID-19 pandemic and family business performance. Small Business Economics, 62(1), 213–241. [Google Scholar] [CrossRef] [Scilit]
  70. Naldi, L., Nordqvist, M., Sjöberg, K., & Wiklund, J. (2007). Entrepreneurial orientation, risk taking, and performance in family firms. Family Business Review, 20(1), 33–47. [Google Scholar] [CrossRef] [Scilit]
  71. Nguyen, N. M., Abu Afifa, M., Van, H. V., Vo, D. T. T., & Bui, D. V. (2025). The moderated mediation impact of corporate sustainability operations on firm outcomes: Empirical evidence from G7 countries. Meditari Accountancy Research. Advance online publication. [Google Scholar] [CrossRef] [Scilit]
  72. Nguyen, P. A., Kecskés, A., & Mansi, S. (2020). Does corporate social responsibility create shareholder value? The importance of long-term investors. Journal of Banking & Finance, 112, 105217. [Google Scholar] [CrossRef] [Scilit]
  73. Perera, K., Kuruppuarachchi, D., Suleman, M. T., & Kumarasinghe, S. (2026). Climate change and idiosyncratic volatility: Moderating role of ESG disclosure. Applied Economics, 1–19. [Google Scholar] [CrossRef] [Scilit]
  74. Petersen, M. A. (2008). Estimating standard errors in finance panel data sets: Comparing approaches. The Review of Financial Studies, 22(1), 435–480. [Google Scholar] [CrossRef] [Scilit]
  75. Pineau, J., Vincent-Lamarre, P., Sinha, K., Larivière, V., Beygelzimer, A., d’Alché-Buc, F., Fox, E., & Larochelle, H. (2021). Improving reproducibility in machine learning research (a report from the neurips 2019 reproducibility program). Journal of Machine Learning Research, 22(1), 7459–7478. [Google Scholar]
  76. Pongsatitpat, S., Saphio, M., Thunputtadom, P., & Srikaew, B. (2025). The moderating effect of family ownership structure on the relationship between ESG performance and firm value of sustainable listed firms in Thailand. Creative Business and Sustainability Journal, 47(1), 20–39. [Google Scholar] [CrossRef] [Scilit]
  77. Porter, M. E., & Kramer, M. R. (2006). The link between competitive advantage and corporate social responsibility. Harvard Business Review, 84(12), 78–92. [Google Scholar]
  78. Roberts, M. R., & Whited, T. M. (2013). Endogeneity in empirical corporate finance1. In Handbook of the economics of finance (Vol. 2, pp. 493–572). Elsevier. [Google Scholar]
  79. Santos, E., Tavares, V., Tavares, F. O., & Ratten, V. (2022). How is risk different in family and non-family businesses? A comparative statistical analysis during the COVID-19 pandemic. Journal of Family Business Management, 12(4), 1113–1130. [Google Scholar] [CrossRef] [Scilit]
  80. Sautner, Z., Van Lent, L., Vilkov, G., & Zhang, R. (2023). Firm-level climate change exposure. The Journal of Finance, 78(3), 1449–1498. [Google Scholar] [CrossRef] [Scilit]
  81. Sharpe, W. F. (1964). Capital asset prices: A theory of market equilibrium under conditions of risk. The Journal of Finance, 19(3), 425–442. [Google Scholar]
  82. Shiu, Y. M., & Yang, S. L. (2017). Does engagement in corporate social responsibility provide strategic insurance-like effects? Strategic Management Journal, 38(2), 455–470. [Google Scholar] [CrossRef] [Scilit]
  83. Shleifer, A., & Vishny, R. W. (1997). A survey of corporate governance. The Journal of Finance, 52(2), 737–783. [Google Scholar] [CrossRef]
  84. Suder, M., Okręglicka, M., Wodecka-Hyjek, A., Kłobukowski, P., & Tora, J. (2024). Are family firms more entrepreneurial than non-family firms? A multidimensional comparative approach. Sustainability, 16(24), 11098. [Google Scholar] [CrossRef] [Scilit]
  85. Varian, H. (2018). Artificial intelligence, economics, and industrial organization. In The economics of artificial intelligence: An agenda (pp. 399–419). University of Chicago Press. [Google Scholar]
  86. Vendramin, L., Campello, R. J., & Hruschka, E. R. (2010). Relative clustering validity criteria: A comparative overview. Statistical Analysis and Data Mining: The ASA Data Science Journal, 3(4), 209–235. [Google Scholar] [CrossRef] [Scilit]
  87. Villalonga, B., & Amit, R. (2006). How do family ownership, control and management affect firm value? Journal of Financial Economics, 80(2), 385–417. [Google Scholar] [CrossRef] [Scilit]
  88. Vollero, A., Siano, A., & Della Volpe, M. (2019). A systems perspective for conceptualizing sustainability in long-lived family businesses: Research proposals on risk taking and innovativeness. Systems Research and Behavioral Science, 36(1), 111–127. [Google Scholar] [CrossRef] [Scilit]
  89. Wooldridge, J. M. (2010). Econometric analysis of cross section and panel data. MIT Press. [Google Scholar]
  90. Xu, Y., & Goodacre, R. (2018). On splitting training and validation set: A comparative study of cross-validation, bootstrap and systematic sampling for estimating the generalization performance of supervised learning. Journal of Analysis and Testing, 2(3), 249–262. [Google Scholar] [CrossRef] [Scilit]
  91. Zahra, S. A. (2005). Entrepreneurial risk taking in family firms. Family Business Review, 18(1), 23–40. [Google Scholar] [CrossRef] [Scilit]
  92. Zhang, C., Zhang, S., Zhou, Z., & He, B. (2025). Merging economic aspirations with sustainability: ESG and the evolution of the corporate development paradigm in China. Sustainability, 17(20), 9108. [Google Scholar] [CrossRef] [Scilit]
Figure 1. Correlation matrix of corporate risk, ESG measures, and firm characteristics. Note. This figure displays Pearson correlations among variables. No severe multicollinearity is detected. ESG measures are highly correlated as expected. Corporate risk is negatively associated with key variables, while firm size and financial constraints show a strong inverse relationship.
Jrfm 19 00305 g001
Figure 2. Predictive margins of earnings volatility across lagged ESG scores. Note: The figure displays predictive margins from fixed-effects estimates, illustrating the association between lagged ESG performance (L1ESG1) and earning volatility (Risk1). Higher ESG scores are associated with lower predicted volatility, with 95% confidence intervals reported.
Jrfm 19 00305 g002
Figure 3. Marginal effect of long-term ESG on corporate risk across family ownership. Note. This figure shows that ESG reduces corporate risk at low family ownership levels, but the effect weakens and becomes insignificant as ownership increases, highlighting heterogeneous ESG effectiveness and diminishing risk-reduction benefits in highly family-controlled firms.
Jrfm 19 00305 g003
Figure 4. Predictive margins of earning volatility (Risk1) across lagged ESG scores (L1ESG1), based on fixed-effects estimates. The figure illustrates a negative association between ESG performance and corporate risk, with 95% confidence intervals reported. Panel (A) compares observed and predicted values for the test set, showing a generally good alignment between actual and estimated outcomes. The red line represents the 45-degree line of perfect prediction, where predicted values exactly match observed ones. While most observations cluster around this line, extreme values appear slightly smoothed, reflecting the tendency of tree-based models to reduce variance. Panel (B) reports the out-of-bag mean squared error as the number of trees increases, illustrating how the model rapidly stabilizes and avoids overfitting. Panel (C) presents variable importance based on the permutation method (mean decrease in accuracy), highlighting the relative contribution of each predictor. Panel (D) shows variable importance based on the total increase in node purity, confirming the relevance and ranking of the key explanatory variables.All the analyses were performed in JASP with the use of public data available on Mendeley Data. The preprocessing of data, definition of variables, and model parameters are described in detail in the paper. Even though there is no fixed random seed, all the model specifications, testing processes, and parameters used for tuning are explicitly specified and therefore allow for independent replication of the analysis. Overall, these results provide complementary evidence on the predictive relevance and non-linear interactions among ESG engagement, family governance, and corporate risk.
Jrfm 19 00305 g004
Figure 5. Cluster structure of firms based on ESG performance, family governance, and corporate risk. The figure illustrates the heterogeneity across clusters identified using the clustering procedure.
Jrfm 19 00305 g005
Table 1. Theoretical foundations and analytical expectations on ESG, family governance, and corporate risk.
Macro-ThemeKey ReferencesMain FindingsTheoretical MechanismAnalytical Expectation
ESG and corporate riskKhaw et al. (2025); Adardour et al. (2025); Gega et al. (2025); Eccles et al. (2014); Lins et al. (2017); Albuquerque et al. (2020)ESG is generally associated with lower corporate risk, especially when embedded in firm strategy.Stakeholder theory: ESG builds trust, reduces information asymmetry, and enhances resilience.Long-term ESG reduces corporate risk, while short-term ESG has a limited or negligible effect due to the time required for sustainability benefits to materialize.
Family ownership and riskGómez-Mejía et al. (2007); Berrone et al. (2012); Naldi et al. (2007); Zahra (2005); Anderson and Reeb (2003)Family firms exhibit lower risk and stronger long-term orientation.SEW theory: families prioritize control, identity, and continuity over risk.Family ownership and managerial control are negatively associated with corporate risk, although their effects may operate through distinct mechanisms.
Ownership vs. managerial controlVillalonga and Amit (2006); Miller and Le Breton-Miller (2006); Fama and Jensen (1983); Jensen and Meckling (2019)Ownership and management roles have distinct effects on firm behavior.Agency theory: incentives vs. decision-making authority differ.Ownership and managerial control have distinct (but complementary) effects on risk.
ESG measurement and limitationsBerg et al. (2022); Kotsantonis et al. (2016)ESG measurement is heterogeneous and sometimes inconsistent.Measurement theory: ESG effects depend on persistence and interpretation.Long-term ESG is a more reliable proxy than short-term ESG.
ESG, governance, and conditional effectsKölbel et al. (2017); Lins et al. (2017); Albuquerque et al. (2020)ESG reduces exposure to reputational and crisis-related risksStakeholder + SEW interactionESG effects are moderated by governance (e.g., family control)
Note. This table synthesizes the prior literature by linking empirical findings to underlying theoretical mechanisms. It highlights how ESG, governance, and family involvement jointly shape risk, emphasizing temporal dynamics, measurement issues, and conditional effects across firm contexts.
Table 2. Hypotheses, expected relationships, and underlying theoretical mechanisms.
HypothesisVariables ExaminedExpected AssociationTheoretical Mechanism and Challenge
H1Short-term ESG and Corporate RiskNo significant association expectedShort-term ESG involves immediate implementation costs, while reputational and stakeholder-related benefits require time to materialize, limiting its short-run impact on risk.
H2Long-term ESG and Corporate RiskNegative association with more persistent effectsLong-term ESG operates as a cumulative strategic capability that strengthens stakeholder trust, reduces information asymmetry, and improves resilience over time.
H3aFamily Cash-Flow Rights and Corporate RiskAmbiguous (dependent on monitoring vs. entrenchment effects)Family ownership reduces risk through stronger monitoring incentives and long-term value preservation, although high ownership concentration may also generate entrenchment costs.
H3bFamily CEO Presence and Corporate RiskAmbiguous (dependent on long-term orientation vs. non-economic objectives)Family management affects risk through direct strategic control and decision-making, although non-economic objectives may influence managerial choices.
H4Long-term ESG × Family Cash-Flow Rights and Corporate RiskConditional effect (boundary condition based on level of family ownership)Family ownership conditions the effectiveness of ESG by either reinforcing long-term orientation or attenuating ESG’s marginal contribution to risk reduction.
Note. This table summarizes the study’s hypotheses by linking each expected relationship to a distinct theoretical mechanism. It highlights how temporal ESG effects, ownership incentives, managerial control, and governance-based moderation provide different explanatory channels for corporate risk.
Table 3. Variables used to analyze ESG, family governance, and corporate risk.
AcronymVariable NameDescription
L1ESG1Lagged ESG ScoreOne-year lagged overall ESG score ranging from 0 to 100, obtained from the Sino-Securities Index. It captures the firm’s prior sustainability performance and is used to mitigate simultaneity and reverse causality concerns in the risk–sustainability relationship.
LT_ESGLong-term ESG ScoreIn addition to the lagged ESG measure, we construct a long-term ESG indicator (LT_ESG) to capture the persistence of sustainability engagement. Specifically, LT_ESG is defined as the three-year rolling average of ESG scores:
L T _ E S G i , t = E S G i , t + E S G i , t 1 + E S G i , t 2 3
This specification smooths short-term fluctuations and reflects the sustained nature of ESG strategies over time, in line with the theoretical expectation that the benefits of sustainability materialize gradually. The construction of LT_ESG requires the availability of ESG scores for three consecutive years; observations with missing values within the rolling window are excluded.
FamilyCFFamily Cash-Flow RightsMeasure of the family’s cash-flow rights calculated as the sum of the products of equity stakes held along control chains. It captures the family’s economic exposure and incentives to preserve firm value and long-term stability.
LT_ESG × FamilyCFInteraction: Long-term ESG and Family Cash-Flow RightsInteraction term between long-term ESG performance and family cash-flow rights, capturing how the effect of sustained sustainability engagement on corporate risk varies with the intensity of family ownership and economic involvement in the firm.
FamCEOFamily CEODummy variable equal to one if the firm is led by a family member acting as the chief executive officer, and zero otherwise. It captures the direct involvement of the controlling family in day-to-day management and strategic decision-making.
BoardSizeBoard SizeNumber of directors on the board (measured in levels and not log-transformed). It proxies for the size and complexity of corporate governance structures.
FirmSizeFirm SizeNatural logarithm of total assets. It captures the scale of the firm’s operations and resource base, reflecting differences in organizational complexity, market exposure, and the ability to absorb shocks and smooth performance over time.
TangibilityAsset TangibilityRatio of fixed assets to total assets. It measures the degree to which the firm’s asset base is composed of tangible, collateralizable assets, which are typically associated with more stable cash flows and lower operational and financial risk.
FCFinancial ConstraintsFinancial constraint index based on Kaplan and Zingales (1997). Higher values indicate tighter financing constraints, capturing limited access to external capital markets and greater vulnerability to liquidity and investment shocks.
Note. This table defines variables used to analyze ESG and risk in family firms, covering sustainability orientation, family involvement, governance, firm characteristics, asset structure, and financial conditions, and motivating suitability given incentives and socioemotional wealth considerations.
Table 4. Descriptive statistics of corporate risk, ESG, and family governance variables.
VariablesNMeanSDMinp25p50p75Max
Risk126,1510.033280.0457820.0001580.0102280.0188510.0369280.524703
L1ESG124,79272.814734.87818443.6970.0573.027692.38
LT_ESG21,52563.637053.87460841.8312561.3512563.8037566.1662577.7425
FamilyCF26,1510.1983380.214315000.15560.3615840.8999
FamCEO14,8880.5005370.50001700111
BoardSize26,15110.166722.57743659101218
FirmSize26,15122.193361.30058719.505621.268722.022622.932126.0982
Tangibility26,1510.9233150.0919210.5164440.909820.9545130.9780791
FC21,353−1.023650.072816−1.24002−1.06723−1.02038−0.97562−0.85935
Note. This table reports descriptive statistics for the main variables. The sample includes over 26,000 firm-year observations, providing a comprehensive overview of corporate risk, ESG performance, family involvement, governance structure, firm size, asset composition, and financial constraints.
Table 5. Econometric specifications for the analysis of ESG, family governance, and corporate risk.
ModelCharacteristics
R i s k 1 i , t = β 0 +   β 1 L 1 E S G 1 i , t 1 + β 2 F a m i l y C F i , t + β 3 F a m C E O i , t +   β 4 B o a r d S i z e i , t + β 5 F i r m S i z e i , t +   β 6 T a n g i b i l i t y i , t + β 7 F C i , t + μ i + λ t + ε i , t This specification estimates firm risk using a fixed-effects panel regression where the key explanatory variable is the one-year lagged ESG score. The model controls for family ownership, family management, board size, firm size, asset tangibility, and financial constraints, while including firm and year fixed effects to account for unobserved heterogeneity and common shocks. Standard errors are clustered at the firm level.
R i s k 1 i , t = β 0 +   β 1 L T E S G i , t + β 2 F a m i l y C F i , t +   β 3   ( L T E S G i , t × F a m i l y C F i , t ) + β 4   F a m C E O i , t +   β 5 B o a r d S i z e i , t + β 6 F i r m S i z e i , t +   β 7 T a n g i b i l i t y i , t + β 8 F C i , t + μ i + λ t + ε i , t This specification estimates firm risk using a fixed-effects panel regression where the key explanatory variable is the long-term ESG indicator (LT_ESG). The model also includes the interaction between LT_ESG and family cash-flow rights (FamilyCF) to capture how the association between sustained ESG engagement and corporate risk varies with the intensity of family ownership. Control variables include family management, board size, firm size, asset tangibility, and financial constraints, while firm and year fixed effects account for unobserved heterogeneity and common shocks. Standard errors are clustered at the firm level.
Note. This table reports two fixed-effects panel regression specifications. The first model uses the one-year lagged ESG score (L1ESG1) as the main explanatory variable. The second model is based on the long-term ESG indicator (LT_ESG) and includes its interaction with family cash-flow rights (FamilyCF).
Table 6. Fixed-effects regression results on ESG, family governance, and corporate risk.
VariableRisk1 on L1ESG1 (Coef. [SE])Risk1 on LT_ESG, FamilyCF, and Interaction (Coef. [SE])
L1ESG1−0.0002438 [0.0001515]
LT_ESG −0.0014774 ** [0.0006539]
FamilyCF−0.0267665 *** [0.0099285]−0.2287966 ** [0.1088365]
LT_ESG × FamilyCF 0.0032477 * [0.0016562]
FamCEO−0.0048197 * [0.0024596]−0.0050748 * [0.0028466]
BoardSize0.0005782 * [0.0002952]0.0006293 * [0.0003159]
FirmSize0.0063846 ** [0.0025372]0.0070386 ** [0.0029188]
Tangibility−0.0903111 *** [0.0147279]−0.0890153 *** [0.0163043]
FC0.0767508 *** [0.0200962]0.0838521 *** [0.0224544]
Note. This table reports fixed-effects estimates linking corporate risk to short-term and long-term ESG and family governance. Results show that sustained ESG and family involvement are associated with lower corporate risk, while their interaction suggests diminishing marginal effects under stronger family control, highlighting stability-oriented strategies in family firms. Standard errors are reported in brackets. Significance levels: p < 0.10 (*), p < 0.05 (**), p < 0.01 (***).
Table 7. Fixed-effects regression results using alternative corporate risk measure (AltRisk).
Dependent Variable: AltRisk
Fixed-Effects Panel Regression with Firm-Clustered Standard Errors
VariableCoefficientStd. Err.tp > |t|95% CI
LT_ESG−0.0011550.0008015−1.440.150[−0.0027269, 0.0004169]
FamilyCF0.03567890.14391120.250.804[−0.2465634, 0.3179212]
LT_ESG × FamilyCF−0.00113560.0021808−0.520.603[−0.0054126, 0.0031413]
FamCEO−0.00230760.0034898−0.660.509[−0.0091520, 0.0045367]
BoardSize0.00149170.00036494.090.000[0.0007760, 0.0022075]
FirmSize0.00002430.00382610.010.995[−0.0074795, 0.0075281]
Tangibility0.01821940.01630611.120.264[−0.0137605, 0.0501992]
FC0.11780940.02575574.570.000[0.0672968, 0.1683221]
Year 20120.01931230.001709811.300.000[0.0159590, 0.0226655]
Year 20130.01562100.00266375.860.000[0.0103968, 0.0208452]
Year 20140.01427170.00294874.840.000[0.0084886, 0.0200548]
Year 20150.01808990.00331995.450.000[0.0115788, 0.0246010]
Year 20160.01957960.00379675.160.000[0.0121335, 0.0270257]
Year 20170.01931010.00450114.290.000[0.0104824, 0.0281378]
Year 20180.03093870.00538705.740.000[0.0203736, 0.0415037]
Year 20190.03807920.00579986.570.000[0.0267044, 0.0494540]
Year 20200.04174300.00603426.920.000[0.0299086, 0.0535773]
Constant0.19795050.09668012.050.041[0.0083391, 0.3875619]
Note. The dependent variable is AltRisk, defined as the three-year range of industry-adjusted ROA. The model includes firm and year fixed effects. Standard errors are clustered at the firm level to account for serial correlation.
Table 8. Robustness check: fixed-effects panel regression results (dependent variable: AltRisk).
StatisticValue
EstimatorFixed-effects (within) regression
Dependent variableAltRisk
Observations9034
Groups (firm)1883
Obs per group (min/avg/max)1/4.8/10
R-squared (within)0.0677
R-squared (between)0.0394
R-squared (overall)0.0541
F(17, 1882)16.25
Prob > F0.0000
corr(u_i, Xb)−0.0782
sigma_u0.04432293
sigma_e0.04508466
rho0.49148085
Standard errorsRobust, clustered by firm
Note. The table reports the robustness-check regression using AltRisk as the dependent variable. Coefficients are estimated with firm fixed effects, year dummies, and standard errors clustered at the firm level.
Table 9. Comparison of clustering algorithms based on validation indices.
Density-BasedFuzzy C-MeansHierarchicalModel-BasedK-MeansRandom Forest
Maximum diameter0.3220.3850.0000.7091.0000.239
Minimum separation1.0000.0060.5670.0170.0000.014
Pearson’s γ0.7601.0000.0000.7600.8710.379
Dunn index1.0000.0000.5000.0160.0080.000
Entropy0.6890.1531.0000.0000.0070.337
Calinski–Harabasz index0.8170.6340.0000.8471.0000.262
Note. This table compares alternative clustering algorithms using multiple validation criteria. The results indicate that K-means provides the best overall trade-off between cohesion and separation, supporting its selection as the most robust and balanced clustering solution for identifying firm profiles.
Table 10. Characteristics and validation metrics of the ten-cluster solution.
Cluster12345678910
Size134310651297113821361001460178720181470
Explained proportion within-cluster heterogeneity0.0960.0950.1000.0840.1100.1150.0900.1080.1040.097
Within sum of squares3442340035773006394741033236386837223482
Silhouette score0.1140.1220.1390.1410.2380.0530.2180.1900.2060.172
Center L1ESG10.300−0.3100.4500.1110.166−1.957−0.4680.3890.0110.218
Center FamilyCF−0.148−0.532−0.323−0.121−0.799−0.541−0.3871.436−0.1811.053
Center FamCEO1.030−0.967−0.9651.030−0.971−0.615−0.1621.0301.030−0.971
Center BoardSize−0.2851.7150.1471.322−0.313−0.1460.218−0.399−0.583−0.362
Center Risk1−0.1980.001−0.245−0.168−0.1760.1994.178−0.181−0.186−0.185
Center FirmSize1.071−0.0011.565−0.136−0.300−0.5360.032−0.335−0.623−0.202
Note. This table summarizes the size, cohesion, separation, and centroid characteristics of the ten-cluster solution, highlighting differences in ESG orientation, family involvement, governance, firm size, and risk, and indicating a generally balanced and stable clustering structure across firms.
Table 11. Standardized cluster centroids for the ten-cluster solution.
ClusterL1ESG1FamilyCFFamCEOBoardSizeRisk1FirmSize
1−0.2851.030−0.1481.0710.300−0.198
21.715−0.967−0.532−5.062 × 10⁻⁴−0.3109.022 × 10−4
30.147−0.965−0.3231.5650.450−0.245
41.3221.030−0.121−0.1360.111−0.168
5−0.313−0.971−0.799−0.3000.166−0.176
6−0.146−0.615−0.541−0.536−1.9570.199
70.218−0.162−0.3870.032−0.4684.178
8−0.3991.0301.436−0.3350.389−0.181
9−0.5831.030−0.181−0.6230.011−0.186
10−0.362−0.9711.053−0.2020.218−0.185
Note. This table reports standardized cluster centroids for the ten-cluster solution. The values represent the mean standardized scores of each variable within each cluster, allowing comparison of ESG performance, family governance, firm size, and corporate risk across clusters.
Table 12. Comparison of machine learning models for predicting corporate risk.
StatisticsBoostingDecision TreeKNNLinear RegressionRandom ForestLASSO
MSE1.0001.0001.0001.0001.0000.000
MSE(scaled)0.6740.0000.2390.3100.8641.000
RMSE1.0001.0001.0001.0001.0000.000
MAE/MAD1.0001.0001.0001.0001.0000.000
MAPE0.3030.2851.0000.0000.0940.371
R20.6350.0000.2120.2880.8461.000
Note. This table compares alternative machine learning models using error and fit metrics. Random Forest achieves the best overall trade-off between predictive accuracy and explanatory power, while other methods show unbalanced performance across criteria, supporting its selection as the preferred model for subsequent analysis.
Table 13. Predictive performance comparison of machine learning models using non-standardized metrics.
Statistics Boosting Regression Decision TreeKNNLinear RegressionRandom Forest LASSO
MSE0.0020.0020.0020.0020.0020.003
MSE(scaled)1.4051.5291.4851.4721.371.345
RMSE0.0450.0450.0450.0450.0450.055
MAE/MAD0.0280.0280.0280.0280.0280.029
MAPE206.65%207.45%174.37%220.66%216.33%203.5%
R20.0880.0550.0660.070.0990.107
Note. This table reports predictive accuracy and explanatory power across models using non-standardized metrics. Results indicate similar performance for most models, with LASSO showing slightly weaker prediction but higher R2. High MAPE values likely reflect small dependent variable magnitudes.
Table 14. Machine learning design: data partitioning and hyperparameter configuration.
CategoryParameterSetting
Data SplitTest set (holdout)20% of total data
Training set80% of total data
Validation set (within training)20% of training data
Algorithmic SettingsTraining data per tree50%
Features per split1 (manual)
Feature scalingEnabled
Random seedNot set
Model TuningNumber of treesOptimized
Maximum number of trees100
Note. This table summarizes the machine learning design, including data partitioning, algorithmic settings, and tuning procedures. The approach ensures separation between training, validation, and testing, enabling robust model evaluation, hyperparameter optimization, and reduction of overfitting.
Table 15. Variable importance measures from the Random Forest model.
VariablesMean Decrease in AccuracyTotal Increase in Node PurityMean Dropout Loss
Tangibility2.373 × 10−41.0270.047
FC4.403 × 10−40.6970.045
L1ESG11.890 × 10−50.6710.045
FirmSize3.985 × 10−40.5940.044
FamilyCF4.669 × 10−50.5770.044
BoardSize2.261 × 10−50.3590.043
FamCEO2.273 × 10−50.0600.043
Note. This table reports three complementary variable importance measures from the Random Forest model. These metrics capture the relative contribution of each variable to predictive performance, rather than causal or structural effects. The results indicate that asset tangibility, financial constraints, and firm size contribute most to the model’s predictive accuracy, while ESG, ownership, and governance variables have a comparatively smaller but non-negligible role in prediction.
Table 16. Additive explanations of Random Forest predictions for selected test cases.
CasePredictedBaseL1ESG1FamilyCFFamCEOBoardSizeFirmSizeTangibilityFC
10.0610.037−0.002−0.0040.0090.009−0.001−0.0050.018
20.0500.0370.0070.0010.002−0.003−0.004−0.0060.017
30.0630.0370.0062.684 × 10−50.0060.002−0.0018.131 × 10−40.013
40.0250.037−0.0033.075 × 10−4−8.455 × 10−47.492 × 10−40.008−0.005−0.011
50.0290.0370.007−0.004−0.004−3.530 × 10−40.003−0.005−0.005
Note. This table decomposes predicted risk into a baseline and variable-specific contributions for selected cases, illustrating heterogeneous effects across firms. Results show how ESG, ownership, governance, and financial structure can either mitigate or amplify risk, highlighting the value of additive explanations for model interpretability.
Table 17. Synthesis of results across methods and implications for family firms.
MethodMain EvidenceRole for Family FirmsManagerial Implications for Family FirmsCritical Perspective
Panel data econometrics (fixed effects)Long-term ESG performance is negatively associated with risk. Family cash-flow rights and the presence of a family CEO are associated with lower risk. The positive interaction between long-term ESG and family cash-flow rights indicates diminishing marginal risk-reducing effects of ESG when family control is strong.Family firms exhibit a built-in orientation toward stability and long-term value preservation. ESG reinforces this orientation, but its incremental contribution is smaller when family control is already strong.In strongly family-controlled firms, ESG should be integrated as a complement to existing governance mechanisms rather than as the primary risk-mitigation tool. In firms with weaker family involvement, ESG can represent a more powerful lever to stabilize performance.The estimates capture average within-firm effects and may conceal substantial heterogeneity across different types of family firms (e.g., across generations or ownership structures).
Clustering analysisDistinct clusters emerge with coherent combinations of ESG orientation, family involvement, governance structure, firm size, and risk. A clearly identifiable high-risk cluster coexists with groups of more sustainability-oriented and more stable firms.Family firms are not a homogeneous group but are characterized by different strategic profiles combining ownership, management, and sustainability orientation.Sustainability and risk-management strategies should be tailored to the specific profile of the family firm (e.g., family-managed vs. family-owned but professionally managed). One-size-fits-all policies are unlikely to be effective.The approach is descriptive and sensitive to methodological choices such as the number of clusters and variable scaling. It does not provide causal inference but highlights strategic profiles.
Machine learning regression (Random Forest)Financial fundamentals (tangibility, financial constraints, and firm size) are the main predictors of risk, while ESG performance and family cash-flow rights play a secondary but non-negligible and non-linear role. Case-level explanations reveal strong heterogeneity across firms.In family firms, the impact of ESG and family governance on risk is highly context-dependent and interacts with financial structure and scale. There is no single “family firm model” of risk behavior.For risk management in family firms, predictive tools that capture non-linearities and interactions can complement traditional analysis and support more customized decision-making.High predictive accuracy comes at the cost of lower interpretability. Variable importance should not be interpreted as causal effects and needs to be combined with econometric evidence.
Note. This table integrates evidence from econometric, clustering, and machine learning analyses, showing how ESG, ownership, and governance jointly shape corporate risk. The triangulation highlights complementary insights, underscores heterogeneity among family firms, and strengthens the credibility of conclusions regarding strategic stability and risk management.
Table 18. Summary of hypotheses, empirical findings, and theoretical interpretations.
HypothesisEmpirical FindingTheoretical InterpretationMethodological EvidenceConsistency with Hypothesis
H1Short-term ESG shows weak and less consistent association with corporate riskSuggests that ESG benefits require time to materialize, in line with dynamic views of sustainability and limitations of short-term stakeholder engagementPanel data econometrics (fixed effects)Partially supported
H2Long-term ESG is negatively associated with corporate riskConsistent with stakeholder theory and information asymmetry theory; supports the view of ESG as a cumulative, long-term strategic capabilityPanel data econometrics; Machine learning (predictive relevance)Supported
H3Family governance (cash-flow rights and family CEO) is negatively associated with corporate riskIn line with socioemotional wealth (SEW) theory, emphasizing risk aversion and long-term orientation in family firmsPanel data econometrics; Clustering (strategic profiles)Supported
H4The interaction between long-term ESG and family governance shows a moderating effect, with diminishing marginal impact of ESG under strong family controlExtends SEW and stakeholder theory by highlighting that governance structures condition the effectiveness of sustainability strategiesPanel data econometrics; Machine learning (non-linear interactions); Clustering (heterogeneity)Supported (with theoretical nuance)
Note. This table synthesizes hypotheses, empirical results, and theoretical interpretations, integrating stakeholder, information asymmetry, and socioemotional wealth theories. Findings highlight the long-term benefits of ESG, the role of family governance, and moderating effects across methodologies.
Disclaimer/Publisher’s Note: The statements, opinions and data contained in all publications are solely those of the individual author(s) and contributor(s) and not of MDPI and/or the editor(s). MDPI and/or the editor(s) disclaim responsibility for any injury to people or property resulting from any ideas, methods, instructions or products referred to in the content.