1. Introduction
The pension system is the cornerstone of social protection (
Lundberg, 2024;
IOE, 2024,
Kondrat et al., 2022). By guaranteeing income security for the elderly and other vulnerable groups, a resilient pension system prevents poverty, reduces inequality, and contributes to consumption smoothing. The continuing trend of increasing the number of pension recipients and decreasing the number of working persons paying pension contributions is leading to a widening of the pension gap, defined at the micro-level as the difference between the present value of the annual lifetime income needed to maintain an adequate standard of living in retirement and the actual amount of an individual’s savings for retirement, plus the present value of the Pay-as-you-go (PAYG) contributions over 40 years. According to the Geneva Association, the global pension gap is estimated at USD 41 trillion. Japan shows the highest current pension gap in the world due to the combination of the second-longest life expectancy after Monaco and one of the lowest fertility rates in the world. As a result of the one-child policy and declining mortality in China, the ratio of working persons to pensioners will be 2.4 in 2050. The fourth largest pension gap in the world after China (USD 14.3 trillion), Japan (USD 13.5 trillion), and Germany (USD 12.3 trillion) exists in the United States (USD 8.5 trillion) (
The Geneva Association, 2016).
The consequence of the pension gap is poverty in retirement. Poverty is a complex phenomenon that means not only depriving a person of sufficient financial resources but also violating human and civil rights. It also means neglecting an important social value—a decent retirement life. The main reasons for the pension gap are the steady increase in life expectancy and the decline in the fertility rate. This causes pressure on the old-age-support ratio, which is defined as the ratio of the number of people of working age (15 to 64 years) to the number of people aged 65 and over. The current global index is 6.9 workers per pensioner, expected to fall to around 3.7 in 2050. In developed countries, the ratio will fall to 2.5 in 2050 (
The Geneva Association, 2016).
In response to an ageing population and slowing economic growth, many countries have adopted reforms that have gradually shifted from public to private pension schemes (
James & Brooks, 2001). This transition has provoked concerns that the privatisation of pension plans will increase income inequality among the elderly, thus deepening poverty. However,
van Vliet et al.’s (
2012) empirical analysis of the distributional effects of the transition from public to private pensions in 15 European countries from 1995–2007 did not confirm that it led to higher income inequality or poverty among the elderly. The opposite conclusion was drawn by
Been et al. (
2017). According to
Ebbinghaus (
2021), the more pension systems are switched from public responsibility to a multi-pillar system, the less redistributive and the less effective in reducing poverty they are.
Díaz-Giménez and Díaz-Saavedra (
2025) have shown that, if properly designed, sustainable PAYG systems can significantly outperform current multi-pillar pension systems.
Ukraine’s current pension system operates as a life-cycle redistribution mechanism, whereby insurance contributions paid by the officially employed population are used to fund payments to current pensioners, whilst also providing insurance against longevity risk. Under the law, entitlement to an old-age pension depends on reaching the statutory age (60–65 years) and having the required insurance record (gradually increasing to 35 years), which highlights the direct link between the duration of working life and the amount of future benefits. The system is funded on a pay-as-you-go basis (Pillar I), supplemented by targeted transfers from the State Budget to cover the Pension Fund’s deficit, whilst the introduction of a mandatory funded Pillar II remains the subject of ongoing reforms aimed at strengthening the individual financial resilience of future beneficiaries. Additionally, the voluntary Pillar III comprises non-state pension provision, allowing individuals and employers to build supplementary savings through private funds to increase the income replacement rate upon retirement.
Another detrimental factor is the decline in interest rates, which results in lower asset returns, higher pension liabilities, and a larger pension gap. Recent studies emphasise that pension liabilities represent a significant source of financial risk affecting long-term capital allocation and valuation decisions, as pension risk exposure alters the sustainable cost of capital and increases systemic vulnerability in ageing economies (
Klumpes, 2024). A significant challenge for the funded pillar is the global trend of declining real interest rates driven by demographic shifts. As demonstrated by
Carvalho et al. (
2025), population ageing exerts downward pressure on real rates across countries, particularly in financially integrated economies.
This is particularly relevant for Ukraine, where future pension funds may face lower-than-expected returns on safe assets (such as government bonds), risking the adequacy of future payouts unless investment strategies are diversified internationally. In this context, adequacy is understood as a multidimensional construct: it refers to the system’s capacity to prevent poverty (social protection) and provide a sufficient income replacement rate to maintain a standard of living reasonably close to pre-retirement levels. However, because the perception of an “adequate” pension differs between individuals and evolves over different time periods, pension adequacy increasingly depends on individual saving behaviour and financial decision-making. As households take on a greater responsibility for retirement outcomes within multi-pillar systems, recent evidence highlights that personal saving behaviour is shaped by psychological, institutional, and financial literacy factors, which significantly influence long-term retirement preparedness (
Batham et al., 2025). Understanding these complex behavioural dynamics and predicting workforce actions under high uncertainty require robust data-driven models. For instance, advanced data mining techniques, such as decision tree algorithms, have been successfully utilised to analyse employees’ psychophysiological characteristics and decision-making processes (
Bublyk et al., 2020). Such approaches can be adapted to better forecast individuals’ transition to the informal sector or their retirement decisions during severe socio-economic stress.
All three factors (an ageing population, slow economic growth, and low interest rates) combine to create a perfect storm, forcing governments to reconsider social benefit levels, which often risks deepening poverty. Pensioners are among the social groups at the highest risk of poverty. According to the Pension Fund of Ukraine, the average pension in Ukraine at the end of 2024 was UAH 5789 (USD 138). However, out of 10.34 million Ukrainian pensioners, 26% receive a pension of less than UAH 3000 (USD 71) (
Opendatabot, 2025). In the EU, the share of poor pensioners in 2023 was 18.7%. At the same time, due to inequalities in wages in previous years, women’s pensions are almost 30% lower than men’s. Consequently, women have a 35% higher risk of poverty (
Eurostat, 2025). The European Commission’s Policy Recommendations for 2024–2029 announced the first-ever EU anti-poverty strategy, which is expected to be adopted in the first half of 2026 (
ATD Fourth World, 2025).
Ukraine, where the population’s demographic behaviour corresponds to the Second Demographic Transition, has experienced a unique situation of extreme demographic shock: a full-scale, long-term, high-intensity war from 2022 to the present, the exceptionally low birth rate, low fertility, shift in childbearing to older reproductive ages, and increasing ageing of the population have been compounded by the surge of extreme mortality and extremely high emigration of the predominantly working-age, educated population and children. These circumstances are so extraordinary that there are no adequate historical analogies for assessing the prospects for post-war recovery of the country’s population and economy (
Gladun et al., 2025).
To understand the gravity of the current shock, it must be viewed against the backdrop of Ukraine’s demographic evolution. While the First Demographic Transition (FDT) was characterised by a shift from high to low mortality and birth rates—effectively modernising the population structure and enabling industrial growth—the Second Demographic Transition (SDT), which Ukraine entered in the late 20th century, shifted the focus toward individual self-realisation, sub-replacement fertility, and delayed childbearing. The current war-induced crisis does not merely accelerate the SDT. It creates an extreme demographic shock that reverses the gains in life expectancy and population stability achieved during the First Transition. These circumstances are so extraordinary that there are no adequate historical analogies for assessing the prospects for post-war recovery of the country’s population and economy (
Gladun et al., 2025).
Demographic shocks can be understood as rapid demographic changes—often associated with conflict, health crises, or forced migration—that disrupt population dynamics and place pressure on social and economic institutions (
Department of Economic and Social Affairs, Population Division, 2022;
Heuveline, 2023). It is caused by events such as famines, epidemics, wars, or significant migration surges, which disrupt the standard demographic patterns. These events lead to sudden changes, such as mortality spikes, declines in fertility, and increased population movement. Following a shock, populations undergo an adjustment period, striving to return to demographic equilibrium, with opposing forces initiating recovery—often observed through reduced mortality, fertility rebounds, and possibly a return to migration. In essence, demographic shocks break the “steady or semi-steady state” of population dynamics, triggering imbalances that require time and mechanisms to restore the underlying equilibrium (
Lee & Mason, 2011;
Livi-Bacci, 2001). They alter labour supply, dependency ratios, and the intertemporal allocation of resources in an economy (
Auerbach & Kotlikoff, 1987).
The situation in Ukraine has global impacts. This is especially relevant for countries that not only share borders with Ukraine but also face similar demographic and economic challenges. The uncertainty of global energy markets, sanctions, and political manoeuvres by energy-supplying countries significantly affects numerous economies, worsening their economic well-being (
Gabriel et al., 2024). The impact of geopolitical risks increases the likelihood of reduced social payments, as unfavourable geopolitical events shift investment spending towards less productive goals, such as reconstruction and security (
Olanipekun & Alola, 2020).
The study aims to evaluate the financial resilience and long-term sustainability of the Ukrainian pension system by analysing its capacity to withstand demographic and macroeconomic shocks over the period 2015–2023 and by simulating alternative development scenarios under conditions of heightened uncertainty. By integrating demographic dynamics with financial sustainability assessment, the study positions pension system analysis within the broader framework of risk management in ageing economies.
The remainder of this is structured as follows:
Section 2 presents a brief literature review, focusing on studies related to ensuring the financial sustainability of the pension system and its assessment.
Section 3 describes the database and methodological framework employed in our study.
Section 4 reviews the results of the empirical analysis.
Section 5 summarises the main findings of this study and highlights some of its key implications.
3. Materials and Methods
The Global Pension Index (GPI) calculation method developed by the
Mercer & CFA Institute (
2024) was applied to assess the long-term sustainability of Ukraine’s pension system. For 2024, the GPI was determined for the pension systems of 48 countries representing 65% of the world’s population, but Ukraine is not one of them. The GPI uses three sub-indices—adequacy, sustainability and integrity—that include more than 50 indicators. For this research, we calculated the long-term sustainability of the pension system. This future-focused measure uses various indicators that affect the likelihood that a pension system will be able to provide pension benefits for decades to come. We have estimated the sustainability index of the Ukrainian pension system (S) in the dynamics, making it possible to conduct a detailed assessment over the past nine years, identify problems, compare it with other countries’ pension systems, and outline development options. The lack of statistical data forced the authors to limit the study to 2023.
The pension system sustainability index S is a combination of nine sub-indexes (S1–S9) that can reach a score ranging from 0 (minimum) to 10 (maximum). Each has a certain weight in calculating the sustainability score, determined by Mercer experts. Sub-indexes are grouped. Demographic indicators, such as old-age dependency ratio and the fertility rate, cannot be changed in the short term. However, the state retirement age and the labour force participation rate of pensioners can be influenced by government policy. In the context of a declining ratio of working persons to pensioners, the level of financing is important, considering pension contribution rates, the level of pension assets, and the population’s involvement in the private pension system. In the long run, real economic growth significantly impacts the sustainability of the pension system, as it affects employment, savings, and investment returns. Global climate change has become a substantial factor influencing investment strategies in some countries at the state level. Therefore, the sub-index examines the relevance of ESG factors to investment returns. Since the PAYG pension system is crucial for retirement security in most countries, the level of public debt and public pension expenditures are important factors for long-term sustainability.
The formula is as follows:
S—the sustainability index;
i—the indicators that influence the long-term sustainability of pension system;
S1—the proportion of the working-age population members of retirement savings plans, %;
S2—the level of private pension assets, % of GDP;
S3a—the life expectancy at state pension age;
S3b—the projected life expectancy at the expected state pension age in 2053;
S3c—the projected old-age dependency ratio in 2053;
S3d—the estimated total fertility rate (TFR);
S4—the level of mandatory contributions that are set aside for future retirement benefits;
S5a—the labor force participation rate for those aged 55–64;
S5b—the labor force participation rate for those aged 65 or over;
S6a—the level of adjusted government debt;
S6b—the level of public expenditure on pensions expressed as a percentage of GDP;
S7—the provision for older workers to partially withdraw pension savings while maintaining active employment;
S8—the real economic growth rate averaged over seven years;
S9—the regulatory requirement for pension fund trustees and fiduciaries to integrate environmental, social, and governance (ESG) factors into their investment policies and long-term strategies;
n—a number of indicators, n = 9;
wi—the weight of each indicator in the sustainability index.
Taken together, these indicators capture the main demographic, fiscal, and macroeconomic drivers that determine the long-term sustainability of pension systems.
The indicator weights are shown in
Table 1.
The weights assigned to the indicators follow the methodology of the Global Pension Index developed by Mercer and the CFA Institute. These weights reflect the relative importance of different structural factors affecting pension system sustainability. Demographic indicators receive significant weight because population ageing directly influences the dependency ratio and pension expenditures. Fiscal indicators are also emphasised, as government debt and public finance capacity affect the ability to support pension commitments. In this study, the original weighting scheme is retained in order to ensure comparability with the international Global Pension Index results. In the context of Ukraine, an alternative weighting scheme could assign greater importance to fiscal sustainability and labour market indicators, reflecting the country’s demographic shock, labour migration trends, and the increased pressure on public finances.
While dynamic general equilibrium models with overlapping generations (OLG) are frequently employed to simulate long-term pension sustainability (
Auerbach & Lee, 2011;
Kamar & Magnani, 2024), their application in the current Ukrainian context is constrained by the extreme volatility of input parameters. OLG models typically require relatively stable demographic projections and predictable labour market frictions to estimate intergenerational risk-sharing effectively (
Auerbach & Lee, 2011). However, Ukraine is experiencing a ‘demographic structural break’ due to the war, making standard stochastic simulations less reliable for immediate policy guidance.
Therefore, our methodological approach prioritises a stress-test assessment using a modified Mercer index over a steady-state equilibrium model. This allows us to incorporate structural distortions specific to transition economies, such as the high share of the informal sector. As
Kamar and Magnani (
2024) show in the case of Lebanon, ignoring labour market frictions and informality in developing economies can lead to a significant overestimation of a pension system’s sustainability. By adapting the sustainability index to reflect these rigidities, we provide a more realistic assessment of the system’s resilience to the ongoing shock.
Despite its analytical value, the Global Pension Index has several methodological limitations that should be considered when interpreting its results. Firstly, the GPI is a composite index that aggregates a large number of indicators reflecting various dimensions of pension systems, including demographic trends, labour market characteristics, fiscal conditions and institutional design. Whilst this multidimensional structure allows for comprehensive cross-country comparisons, it also entails certain normative assumptions about the desirable architecture of pension systems. In particular, some indicators assign higher scores to systems that include funded pension components, potentially skewing sustainability assessments toward a particular policy direction. Secondly, the sustainability sub-index is not a direct actuarial measure of the long-term financial balance of pension systems. Instead, it provides a proxy estimate based on structural and macroeconomic indicators that are statistically linked to the long-term viability of pension systems. The index should therefore be interpreted primarily as a benchmarking tool rather than as a precise indicator of future financial solvency. Thirdly, composite indices inherently involve methodological choices regarding indicator selection, weighting schemes, and aggregation procedures. These methodological solutions can influence the scores and rankings obtained, requiring careful interpretation of the results, particularly when the methodology is applied to countries not included in the original international sample. At the same time, composite indicators are widely used in comparative public policy analysis as heuristic tools that help synthesise complex multidimensional phenomena into interpretable analytical frameworks (
Freudenberg, 2003).
After calculating the sustainability sub-index, we have used a multi-scenario analysis that intersects possible reform measures with feasible socio-economic scenarios. Here, 3 scenarios are simulated. Scenario 1 assumes a change in the actual structure of the Ukrainian pension system by significantly increasing the share of the population participating in private pension provision, while keeping other factors at their current levels. Scenario 2 is associated with changes in demographic factors, while other indicators remain unchanged. Scenario 3 simulates the sustainability sub-index under the increased influence of economic factors (increase in Ukraine’s GDP due to growth in employment in the labour market), with other indicators remaining unchanged.
Sources of data for the sustainability index were official statistics of the state authorities of Ukraine, the authors’ calculations based on them, and expert estimates.
4. Results
Sub-index S
1 is the ratio of the working-age population members of retirement savings plans (voluntary funded life insurance and private pension contracts with non-state pension funds (NPFs) (
Table 2). The higher this ratio is, the more likely the pension system will be sustainable as the pension assets will grow. An important caveat is that pension coverage should extend to officially employed persons and workers in non-standard forms of work, which is important given the changes in the employment structure following the COVID-19 pandemic and during the war.
This sub-index is weighted at 20%, as funded pension plans play an essential role in a multi-pillar pension system, especially in the face of financial pressures associated with an ageing population. During the research period, the share of Ukraine’s working-age population participating in private pension plans hovered around 20%, reflecting paternalistic attitudes and a heavy reliance on the PAYG pension system. Only 19 of the 47 pension systems assessed by Mercer in 2023 have enrollment rates of more than 64% of the working-age population. However, more than 80% of the working-age population in Chile, Denmark, Finland, Hong Kong, South Africa, Iceland, Israel, the Netherlands, and Taiwan own private pension plans.
More information about the scale of private pension provision is revealed by S
2, the ratio of private pension assets to GDP, which reflects the level of assets already set aside to finance future pension payments. Its weight is equal to 15%. The calculation of S
2 usually includes assets held in private pension plans, assets of funded pension insurance contracts, social insurance reserve funds, and sovereign wealth funds intended for future pension payments. In Ukraine, S
2 includes life insurance reserves and private pension assets (
Table 3).
The level of assets varied from less than 10% of GDP for Austria, China, Indonesia, the Philippines, Thailand and Turkey to more than 175% for Canada, Denmark, Iceland, Canada, the Netherlands, Switzerland and the United States. The ratio of private pension assets to GDP in Ukraine is negligible. This means that the PAYG pension system bears the entire burden of pension payments, leading to the pension adequacy problem. Hence, the estimate of S2 is almost 0.
The third group of sub-indicators (S
3a, S
3b, S
3c, S
3d) is demographic (
Table 4 and
Table 5). The longer people spend in retirement, the higher the benefits required and the greater the financial burden on the pension system. As life expectancy increases, one way to reduce the burden is to encourage later retirement by raising the retirement age. Some governments have already made this decision, reducing the financial pressure on the future. The projected old-age dependency ratio highlights the impact of an ageing population and the demands on financing pensions, healthcare and elderly support. The projected fertility rate provides an even longer-term perspective, indicating the likely balance between the workforce and pensioners in the coming decades. The demographic indicators are weighted 20% and 5% each.
The old-age dependency ratio in 2053 (the ratio of pensioners to working-age persons) will be 36.9%. This value yields a score of S3c = 6.62 points.
The impact of demographic indicators is twofold. On the one hand, the number of years of retirement for both men and women does not exceed 18 years, giving this sub-index the maximum score. However, the fertility rate has steadily declined over the past 9 years, reaching a value of less than 1. This means a deterioration in the demographic structure in the future, which can only be addressed by immigration.
S4 is the share of mandatory employer and/or employee pension insurance contributions subject to investment. International practice shows that accumulating contributions in the respective funds and their investment provides stronger sustainability for the system and a greater level of security for future pensioners. In Ukraine, only the PAYG pillar of the pension insurance system is in operation, with mandatory contributions being used to pay pensions to existing pensioners and not invested. Therefore, the share of invested mandatory contributions is 0, S4 = 0. The weight of the index is 10%.
S
5 is the share of the employed population (labour force of a certain age group divided by the total population of that group) by age: S
5a—55–64 years; S
5b—65 years and older. The weight of the index is 10%, distributed between S
5a and S
5b in the proportion of 8% and 2%. The results of the calculation of the indexes are shown in
Table 6.
Higher labour force participation at older ages means that people retire later, reducing the number of years in retirement and the level of pension benefits required and accumulating more savings for retirement during their working years. According to the IMF, labour market policies should encourage the participation of workers of retirement age.
Since PAYG pensions are an important source of income for the vast majority of Ukrainian pensioners, the government’s ability to pay pensions in the future is a critical factor in the pension system’s sustainability. Due to the significant healthcare expenditures incurred during the COVID-19 pandemic and defence expenditures during the full-scale war on the territory of Ukraine, the level of public debt has increased significantly. The accumulated debt increases the pressure on pension funding, which is already under pressure from demographic change. Countries with lower debt levels are in a better financial position to sustain current pension payments in the future. Public debt levels range from zero for Norway and Singapore to 261% of GDP in Japan. Indicator S
6 shows the public debt ratio to GDP (
Table 7).
Ukraine’s debt-to-GDP ratio has gradually decreased in recent years, reaching 50% in 2019. However, the level rose to 60% in 2020 amid the epidemic but has increased significantly since the outbreak of the war.
Sub-index S
6b shows the level of public pension spending as a percentage of GDP. In 2023, it amounted to UAH 746,300 million, or 11.4% (
Accounting Chamber of Ukraine, 2024). In emerging economies, public pension spending is expected to increase by 5% of GDP between 2015 and 2100, i.e., up to 15% (
Amaglobeli, 2017). The S
6b score for the 2053 forecast is very low, at 1.
The S7 sub-index consists of two parts: S7a—whether or not retirees have access to a part of their pension savings and continue to work (e.g., part-time); S7b—if the answer to S7a is yes, whether or not retirees have access to continue to contribute and accumulate benefits at the appropriate rate.
Allowing for a gradual retirement by reducing the dependence on earned income while providing access to a part of the accumulated pension increases the sustainability of the pension system and the welfare of pensioners. According to Art. 61 of the
Law of Ukraine (
2003) “On Non-State Pension Provision” the reasons for pension payments by pension funds are: the participant of the fund reaches retirement age; recognition of the fund participant as a person with a disability; medically confirmed critical health condition of the fund participant; departure of the fund participant for permanent residence outside Ukraine; death of the fund participant. In other words, Ukraine does not allow partial use of pension savings. Therefore, S
7 = 0. The weight of the indicator is 5%.
Significant real economic growth will make the system more sustainable by improving the government’s financial position, thereby increasing the likelihood of continuing pension payments and allowing for higher savings rates. The S
8 sub-index is the real economic growth rate averaged over seven years (actual values for the last four years and expected values for the next three years). The indicator’s weight is 10% (in 2015–2019) and 8% starting in 2020 (this year, an additional indicator S
9 was added, with a weight of 2%). The results of the sub-index calculation are shown in
Table 8.
Long-term real economic growth means that GDP is growing faster than inflation. A positive sub-index value indicates higher incomes and higher savings, lower unemployment, reduced government borrowing, and the ability to provide stable pension payments in the future. The growth or decline of Ukraine’s economy will be determined by the intensity of hostilities in the war and the financial support of Ukraine’s partners.
Sub-index S9 reflects the presence/absence of a requirement for an asset management company, NPF or other fiduciary to consider environmental, social and governance criteria when developing an investment policy. Taking into account the UN Principles for Responsible Investment is the prerequisite for ethical investment. The Norwegian Government Pension Fund, the Public Pension Fund of Thailand, the Canada Pension Plan for Investment, and the California Public Employees’ Retirement System are among the well-known responsible investors. Ukrainian legislation does not yet impose responsible investment requirements on domestic investors. Therefore, S9 = 0. The weight of the indicator is 2%.
Considering the defined sub-indexes and their weights,
Table 9 shows the calculated index of the pension system sustainability for 2015–2023.
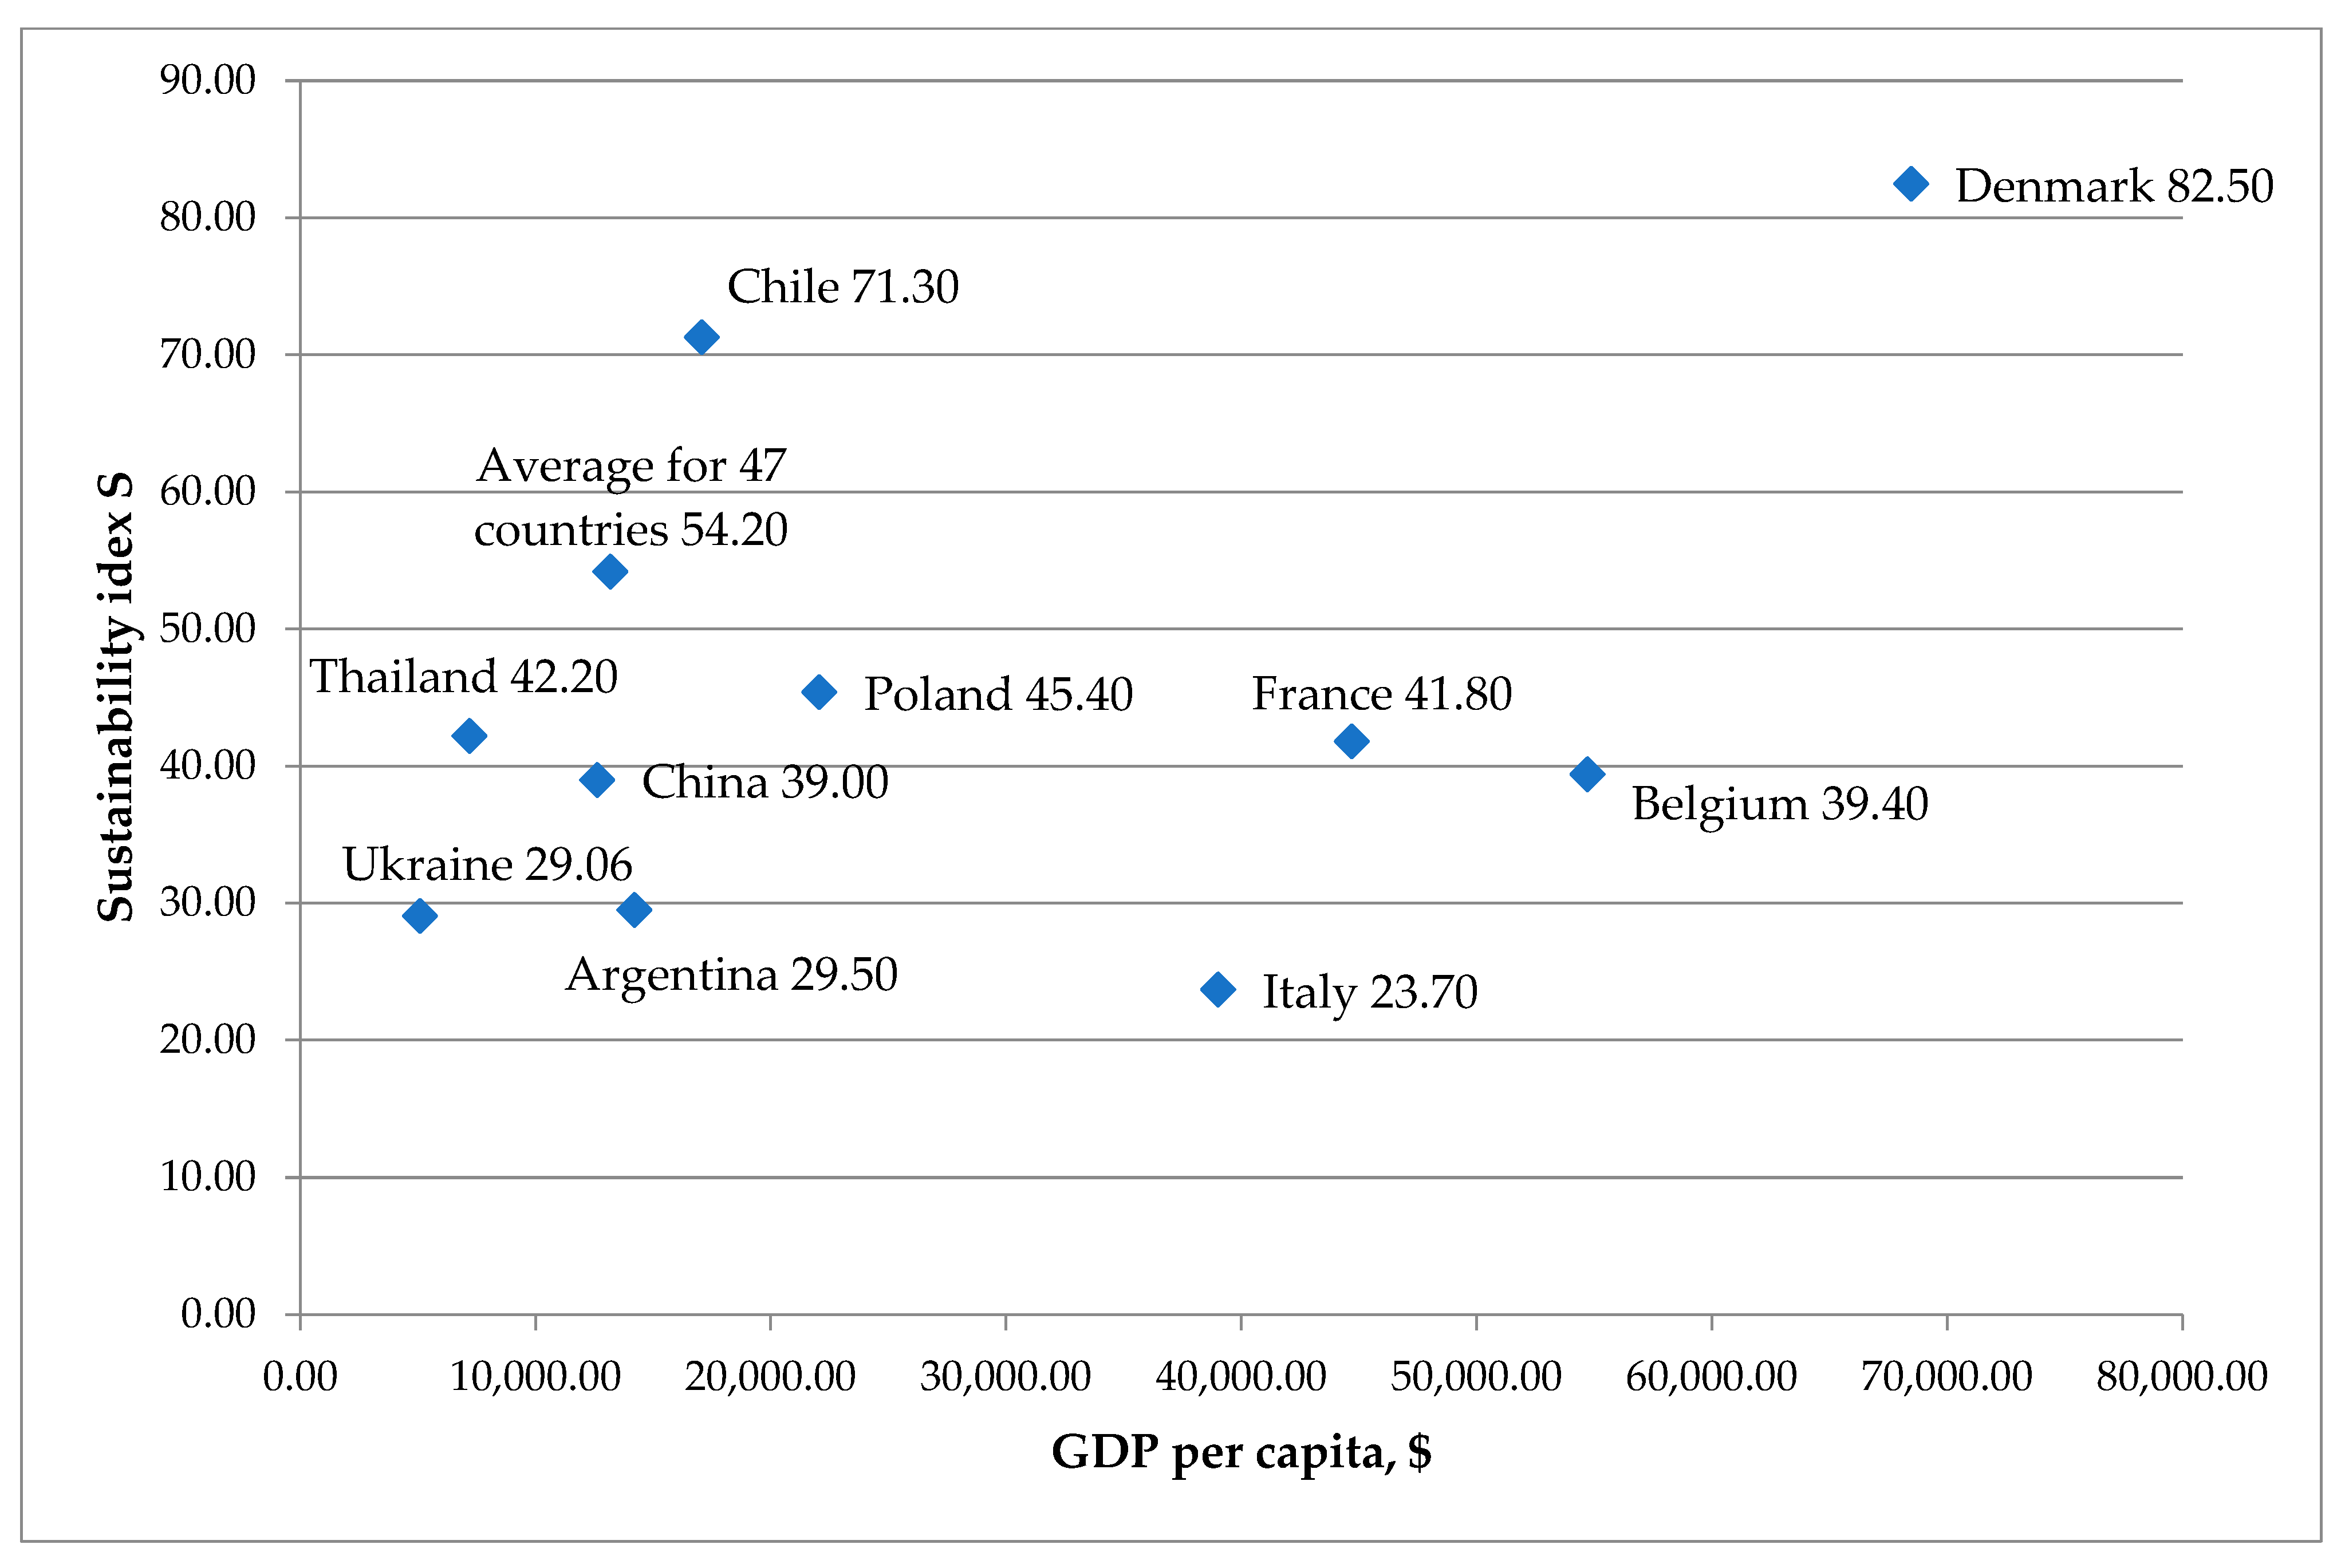
According to Mercer’s classification, the sustainability of the pension system was classified as category E (less than 35), which is the lowest possible and means that the pension system is at the initial stage of development and has an unsatisfactory structure. It is clear that sustainability decreased during the war, but it was shallow even before that. A similar problem of low sustainability is inherent in developing countries (e.g., Argentina) and some developed countries (e.g., Italy). The assessment of Ukraine’s pension system in 2023 among selected countries can be seen in
Figure 1.
Surprisingly, countries with high economic development and well-being (GDP per capita) do not necessarily have a more sustainable pension system than poorer countries. The S value of Chile’s pension system is almost twice that of Belgium, while Belgium’s GDP per capita is more than three times that of Chile. The sustainability of Poland’s pension system is higher than France’s, with France’s GDP being twice as high as Poland’s.
5. Discussion
Contrary to the intuition that structural reforms should be delayed until stability returns, recent empirical evidence suggests that economic downturns often serve as necessary catalysts for pension reform.
Romp and Beetsma (
2023), analysing OECD countries, found that the timing of pension reforms is strongly linked to the business cycle, with contractionary measures often implemented during economic downturns when the fiscal pressure becomes undeniable. For Ukraine, the current war-induced economic shock creates a unique «window of opportunity» to overcome political inertia and implement unpopular but necessary structural changes (such as introducing a mandatory funded pillar) that might be impossible during times of relative stability. However, attempts to balance the Pension Fund deficit simply by increasing contribution rates may be counterproductive.
Zheng et al. (
2024) provide empirical evidence that higher mandatory pension contributions negatively affect enterprise total factor productivity (TFP) and crowd out R&D investment. In a post-war recovery context, Ukraine cannot afford to inhibit firm productivity; thus, expanding the tax base through labour market formalisation is preferable to increasing the rate burden on existing payers.
To assess the potential pathways for improving the sustainability of Ukraine’s pension system, we construct a scenario-based analytical framework based on the sustainability sub-indices of the Global Pension Index. The analysis distinguishes three groups of drivers that may influence the sustainability of the pension system in the long term: structural, demographic, and economic factors. The Ukrainian case provides a particularly important context for such an analysis because the pension system is currently operating under conditions of an extreme demographic shock caused by war, large-scale migration and labour market disruption. This environment makes Ukraine a natural laboratory for analysing how pension system sustainability may evolve under severe demographic stress, a situation that many ageing societies may face in the future.
Each scenario isolates one group of factors while keeping the others broadly constant, allowing us to estimate the potential contribution of different policy directions to the overall sustainability of the pension system.
Scenario 1 is predicated on the intensification of structural factors. The structure of Ukraine’s pension system is unsustainable, as the PAYG system almost entirely finances pensions. Therefore, there is a need to significantly increase the share of private pension participation and the share of private pension assets in GDP (through the conclusion of pension insurance contracts with life insurers and NPFs).
These findings are consistent with the results of research by
Mečkovski et al. (
2025), who modelled the possible development of the pension system (in Lithuania) by integrating several sources of pension funding. They found that different distributions of contributions between pension pillars, financed from different sources, lead to different retirement incomes, or that a constant pension replacement rate is achieved through varying contribution rates, depending on the sources and financing methods.
Andersen et al. (
2024) also empirically demonstrated, using Denmark as an example, that the transition from a predominantly solidarity-based pension system to a hybrid system with a significant share of fully funded pensions not only leads to an increase in the welfare of pensioners but also ensures a more equal distribution of wealth in society.
The transition to a multi-pillar system is not merely a financial mechanism but a tool for labour market formalisation. As
Mitchell and Piggott (
2016) argue, workplace-linked pensions play a crucial role in an ageing demographic by acting as a commitment device for long-term saving, which individuals often fail to do on their own due to behavioural biases. Furthermore, shifting the burden from a purely public PAYG system to a mixed system can mitigate the distortionary effects of labour taxes on formal employment. However, this transition requires careful design to ensure that pension assets are not eroded by inflation, a risk that is particularly acute in war-torn economies.
While introducing a funded pillar is often seen as a panacea, comparative studies suggest caution.
Lin et al. (
2021), analysing pension reforms in Taiwan—an economy with rapidly ageing demographics similar to Ukraine’s—found that a complete shift to individual retirement accounts could lower long-term welfare compared to parametric reforms within the PAYG system. Their findings indicate that the cross-subsidisation inherent in PAYG systems plays a vital role in poverty prevention during demographic transitions. This suggests that, for Ukraine, the funded pillar should complement, rather than replace, a strengthened solidarity system.
In Ukraine, as in other countries with a post-communist past, the population exhibits a lower level of savings and investment activity compared to Western countries.
Endrődi-Kovács et al. (
2024) explain this by the limited experience of households in the capital market, distrust of banks and other financial institutions, and poorer financial literacy, which limits their ability to form an individual investment portfolio. Therefore, household savings behaviour in Eastern countries differs from the behaviour in Western countries. Specifically, an increase in income is more conducive to higher consumption demand than to higher savings rates. Researchers have also confirmed that the higher inflation expectations, the more consumption increases and household savings decrease.
As concluded by
Shkvarchuk and Slav’yuk (
2024), in times of crisis, the population’s propensity to save increases significantly, as uncertainty reinforces consumption restraint. Deposits are the preferred form of investment for Ukrainians. According to the
Deposit Guarantee Fund (
2025), household deposits reached UAH 1392.2 billion by the end of 2024. The increase in the military levy from 1.5% to 5% reduced the attractiveness of bank deposits, as inflation exceeded returns. By the end of 2024, the volume of investments by individuals in Ukrainian government bonds amounted to UAH 79 billion. Thus, the total volume of investments in these two financial instruments amounted to UAH 1471.2 billion, which is almost 60 times higher than the total assets of private pension funds accumulated in 2023. Investing at least half of this amount in the private pension system will boost pension assets to almost 12% of GDP, raising the S
2 sub-index score from 0.5 to 2 points. Furthermore, as the funded pillar grows, policymakers must consider its impact on financial stability.
Aldunate et al. (
2025) show that portfolio reallocations by pension funds can induce significant volatility in exchange rates, necessitating active liquidity management by the central bank. Given the fragility of Ukraine’s currency market, regulations on foreign investment of pension assets must be carefully calibrated to avoid currency shocks.
Closely related to the growth of S2 is sub-index S1, which reflects the share of the working-age population participating in private pension plans. An increase in this share to 50% of the working-age population yields a 5.4 point increase. Structural factors also include S4—the level of mandatory contributions accumulated for future pension payments, expressed as a percentage of the annual salary of an average full-time employee. Many pension systems require mandatory contributions from both employers and employees. However, the financial component of the Ukrainian pension system should only be introduced if Ukraine’s economy grows objectively, which will allow pension funds to be effectively distributed and used. This cannot be achieved in the foreseeable future.
Scenario 2 focuses on identifying opportunities to enhance the sustainability of the pension system by leveraging demographic factors. Demographic factors refer to sub-indices S
3, S
5, and S
7. Population ageing is putting increasing pressure on public finances.
Chen et al. (
2025) found that rising ageing levels slow down innovation and significantly reduce patent applications across cities. Empirical studies by
Papetti (
2019) concluded that population ageing has led to lower interest rates in recent decades. There is a contrary view that, since the proportion of the population over 65 is significant and they use their savings, interest rates should rise.
Juselius and Takáts (
2021) empirically investigated the relationship between the age pyramid and inflation. They concluded that, all other things being equal, an increase in the dependent (non-working) population is associated with higher inflation. In comparison, an increase in the working-age population is associated with lower inflation. However, the percentage of people aged 80 and over in the total population is strongly negatively associated with inflation. The authors suggest that population changes will lead to higher inflation from 2010 to 2050 in all developed countries, whereas they reduced it from 1980 to 2010.
While demographic adjustments such as raising the retirement age are theoretically sound, they face significant political hurdles.
Cremer and Pestieau (
2000) emphasise that the «old-age crisis» is often less about demographics and more about political sustainability. In a system where the median voter is ageing, reforms that reduce immediate benefits are politically costly. However,
Cremer and Pestieau (
2000) also note that entrenched interests can play a positive role by protecting the transition generation from bearing the full cost of adjustment. In Ukraine’s case, this implies that any parametric reform must be accompanied by a clear social contract that protects current retirees who are most vulnerable while signalling credible future commitments to the working-age population.
The demographic structure of the population is inertial, meaning that changes in demographic indicators, such as birth rates, mortality rates, and migration, occur slowly and have a lasting impact on the population. Even if measures are taken now to alter demographic trends, their effects will only become noticeable over time. In addition, the gap between life expectancy and retirement age is steadily narrowing for both men and women. As a consequence, it is not possible to raise the retirement age. The birth rate in Ukraine is one of the lowest in the world, and there are no absolute preconditions for its increase. Therefore, it is impossible to improve the assessment under sub-index S3.
The ageing population highlights the issue of widespread involvement of people of retirement age in the labour market. Due to consistent pension reforms in almost all OECD countries over the past 20 years, the employment rate of people aged 55 to 64 has increased from 46% in 2000 to 67% in 2022, which is faster than the overall participation rate of the working-age population (
Cohen, 2024). This trend has also been facilitated by increased life expectancy, higher levels of education, greater opportunities for lifelong learning, and improved working conditions for older workers. Another way to reduce labour shortages is to replace labour with capital. Robotisation and the implementation of artificial intelligence can reinforce this positive tendency. However, in the current situation in Ukraine, given the relatively low life expectancy, especially for men, the participation of older people (aged 65 and above) in the labour force (indicator S
5) does not have significant potential for growth.
At the country level, population change depends on the natural increase, which is the difference between fertility and mortality, and net migration, which is the difference between the number of people entering the country and the number of people leaving. In developed countries, natural population growth is negative. Some countries avoid population decline through positive net migration. In the future, migration is expected to become a more pressing issue. As
Angrisani et al. (
2012) and
Pânzaru (
2015) point out, only the immigration of working-age people can solve demographic problems in the face of an ageing population. According to the Ministry of Economy of Ukraine and the
International Labour Organization (ILO) and International Organization for Migration (IOM) (
2023), to achieve the GDP growth targets set by the government for the next ten years, it will be necessary to attract between 4.5 and 8.6 million additional workers, indicating a requirement for the involvement of migrants. Liberal immigration policies have been pursued over the past 30 years by developed countries where the birth rate is below the replacement rate (Canada, the United States, New Zealand, Australia) (
Vollset et al., 2020). However, such policies can elicit adverse political reactions, potentially slowing economic growth. The optimal strategy is considered to be liberal immigration with effective assimilation into society. However, several countries are experiencing demographic decline that have not chosen immigration as a strategy (Japan, Hungary, Slovakia, the Baltic states). A similar situation can be observed in Ukraine with its mono-ethnic nation, which wants to maintain a linguistically and culturally homogeneous society (
International Organization for Migration, 2024). However, in the context of demographic shock, this position will likely have to be revised.
Vollset et al. (
2020) make a pertinent observation that there is currently a steady flow of migrants, which could significantly decrease or even cease altogether if access to education and its quality improved and living standards in migrants’ home countries rose.
Therefore, today it is only possible to change sub-index S7, which indicates the possibility of accessing part of one’s pension savings and continuing to work as a pensioner (e.g., part-time), as well as paying contributions and accumulating a pension at the appropriate rate. In the context of an ageing population, it is reasonable to amend the legislation to give people this opportunity. The assessment of sub-index S7 is then 2.
Scenario 3 focuses on enhancing the sustainability of the pension system through economic factors. In 2022, after the outbreak of war, there was an unprecedented 22.8% collapse in GDP and nearly 7 million refugees abroad. According to the results of modelling probable scenarios for GDP growth until 2032 by experts from the
International Labour Organization (ILO) and International Organization for Migration (IOM) (
2023), three possible scenarios are considered (baseline, first and second). Ukraine’s GDP target for 2032 is set at US
$246.41 billion.
According to the baseline scenario, to reach this target, employment in Ukraine must increase by 67% compared to 2022 and by 37% compared to 2021. An additional 8.6 million workers will be required compared to 2022, which is highly doubtful. The first option would enable Ukraine’s GDP to reach its target by 2032 if employment recovers to 2021 levels by 2025 and continues to grow in line with historical trends. However, labour productivity needs to grow by an average of 6.1% per year between 2023 and 2032, which is twice the historical rate. The second scenario assumes that employment and productivity continue to grow at historical trends. However, in this case, GDP will be significantly lower than the target proposed by the government (USD 202 billion compared to the government’s target of USD 246 billion). In other words, if both productivity and employment grow in line with trends until 2022, Ukraine’s GDP in 2032 is projected to be 17,8% below the target set by the Ministry. The option of achieving employment growth by 8.6 million people attracts the most attention from a gender perspective. To reach the GDP target, the growth rate of the female labour force in Ukraine must increase sharply to 5% per year between 2023 and 2032, compared to an average decline of 1% between 2016 and 2021. Such a substantial increase in women’s labour market participation will require effective government policies to provide childcare, introduce flexible working hours, and find effective incentives for women with low educational levels, who are significantly underrepresented in the labour market compared to more educated women. Implementing the basic or second scenario would result in 4.6% annual GDP growth. The S8 score would increase to 8 points.
Private pension assets must generate annual returns to maintain their value. However, there is a growing awareness that investments should be made in accordance with the principles of responsible investment. Additionally, the EU-Ukraine Association Agreement includes provisions to ensure that investments take into account ESG factors. While there is no such requirement in Ukrainian legislation, the regulator should encourage this direction through public announcements or direct communication. In this case, the S9 score would be 1.
To improve transparency of the scenario analysis,
Table 10 summarises the key assumptions and parameter changes underlying each scenario.
Table 11 summarises the assessment of the long-term sustainability of Ukraine’s pension system under the three scenarios we have considered.
In addition, a decomposition of the sustainability index across individual sub-indices has been included in the
Appendix A to clarify how the scenario results reported in
Table 11 are obtained.
Forming a high-quality pension system is an absolute task for every government that cares about the welfare of its citizens. For Ukraine, this challenge is complicated not only by an ageing population, low birth rates, increased budgetary expenditure on pensions, and declining interest rates, which are common to many countries, especially in Eastern and Central Europe, but also by an unprecedented demographic shock and large-scale migration of the working-age population. Therefore, the Ukrainian case is a unique experience from which neighbouring governments, which may face a similar situation in the foreseeable future, would be wise to draw lessons.
Finally, the sustainability of Ukraine’s pension system is inextricably linked to the structure of its labour market.
Kamar and Magnani (
2024) demonstrate that in developing economies with high informality, population ageing exerts a dual pressure: it increases the dependency ratio while simultaneously reducing the tax base as workers shift to the informal sector to avoid higher contribution rates. Our findings echo this concern: without reducing the shadow employment rate (currently estimated at over 30%), parametric adjustments to the pension system will yield diminishing returns. Thus, pension reform must be viewed not in isolation but as part of a broader strategy to reduce labour market frictions and formalise the economy.