1. Introduction
In the era of globalization, the digitalization of the financial sector has become imperative (
Garg et al., 2025). In the payment landscape, especially, global economies are undergoing significant changes (
Priyadarshini & Kar, 2021;
Barontini & Holden, 2019;
Boros & Horvath, 2022), transitioning currency (fiat) from paper money to its digital representations (
BIS, 2020a,
2020b;
Agur et al., 2019;
Ozili, 2023). With the emergence of cryptocurrencies, central banks around the world have shown keen interest in introducing their respective currencies in their digital form, which are referred to as ‘central bank digital currency’ (CBDC). Globally, many advanced and emerging economies, such as Sweden (e-krona), China (e-CNY), the Bahamas (Sand Dollar), Nigeria (eNaira), and the Eastern Caribbean (Dcash), have piloted digital currencies. The Atlantic Council
1 has set up a ‘CBDC tracker’ and has found that nearly 98% of global gross domestic product (GDP) is exploring the possibility of CBDC. This clearly shows the growing importance of CBDC in the digital world.
In India, an
Inter-Ministerial Committee (
2019) examined the implications of digital currency. In 2022, the Reserve Bank of India (RBI) introduced its first digital currency under the name of e-Rupee as part of a controlled pilot phase in both retail and wholesale segments. This initiative seeks to complement the success of existing payment systems like the Unified Payments Interface (UPI). The introduction of the e-Rupee aims to enhance financial inclusion by reducing transaction costs and promoting transparency in monetary transactions (
RBI, 2023). Unlike cryptocurrencies, the e-Rupee is introduced as a centralized, sovereign-backed liability of the RBI, ensuring both trust and stability in digital transactions (
RBI, 2023;
Sankar, 2021;
Bhaskar et al., 2022).
Despite plausible benefits and the rapid growth of the digital economy, the behavioral acceptance of the e-Rupee remains a critical challenge. Evidence from other countries highlights that technological readiness and policy push alone do not guarantee user adoption (
Garg et al., 2025;
Xu, 2022;
Zhao et al., 2023). For instance, China’s e-CNY pilot demonstrated high wallet creation rates but low active usage among individuals due to the perceived convenience of existing payment apps and limited user incentives (
Cheng, 2020). Similarly, Nigeria’s eNaira and the Bahamas’ Sand Dollar faced public skepticism, low awareness, and infrastructural limitations that hindered mainstream adoption (
Ozili & Alonso, 2024). This international evidence underscores that behavioral constructs, including trust and intention to use, play a decisive role in the success of CBDCs’ adoption more than the technological capabilities. In the Indian context, even though the population is increasingly tech-savvy, adoption decisions are still influenced by perceptions of usefulness, ease of use, security, and institutional trust. Further, the pre-existing payment landscape may create payment inertia (
Aggarwal et al., 2023). Moreover, as CBDCs aim to promote financial inclusion, the extent of public awareness represents a key determinant of their adoption. Therefore, to understand the e-Rupee’s adoption trajectory, it is essential to explore how individuals perceive and evaluate this new digital currency in comparison with existing payment instruments.
2. Theoretical Framework and Review
Economic incentives, institutional trust, and personal perception of value have always been key factors in influencing the adoption of new financial technology (
Sandhu et al., 2023;
Nayak & Kumar, 2025). The adoption of any new technology and its implications have been extensively examined in the literature through established theoretical models like UTAUT (Unified Theory of Acceptance and Use of Technology) and its extensions, such as DOI (Diffusion of Innovation theory). All these frameworks add their unique explanatory value, but they vary in their scope and depth in explaining behavioral aspects of technology adoption. In this section, we will explore the applicability of these models for the present study.
The DOI model (
Rogers, 1962) explains the process of technology adoption by considering the perceived characteristics of the technology, and has been widely adopted to study innovations like mobile banking and blockchain technology (
Xu, 2022). However, one of the major drawbacks of this model is that it looks at the macro-level adoption rather than the individual perceptions. DOI, therefore, does not describe the nuanced psychological aspects that may affect the uptake of a central bank digital currency by individual users. The UTAUT model, on the other hand, is a more comprehensive theory than the DOI model, which considers social influence and performance expectancy (
Rahi & Abd. Ghani, 2018). Although this model has been effective in exploring user behavior, its complexity poses challenges for empirical application, especially for emerging economies like India (
Aggarwal et al., 2023).
Contrary to this, the Technology Acceptance Model (TAM) proposed by
Davis (
1989) is the most parsimonious and empirically supported model of technology adoption. The model posits that perceived usefulness (PU) and the perceived ease of use (PEOU) are the key determinants shaping users’ attitudes and behavioral intentions towards adopting a technology. With time, TAM extensions have included constructs like trust, perceived risk, and self-efficacy, particularly in the study of financial technology (
Raza & Tursoy, 2024;
Putri et al., 2023;
Kelly & Palaniappan, 2023). This simplicity and strength of the model are particularly applicable to understanding the e-Rupee adoption, where the behavioral choice is determined by the perceptions of convenience and institutional reliability instead of peer influence or infrastructural support.
Despite its proven effectiveness across domains such as e-banking, mobile wallets, and fintech platforms, TAM has not yet been empirically applied to examine the e-Rupee adoption, forming a significant research gap. The implementation of TAM to the e-Rupee adoption thus brings both conceptual and methodological novelty. It not only places the research into an established framework of behavioral research, but also adjusts it to the specific socio-technical conditions of the digital economy in India. The confidence in the issuing authority (RBI) and data security are the key determinants in estimating the adoption of digitally issued currency by a state (
RBI, 2023). Apart from behavioral aspects, education, mainly digital literacy, is assumed to have an influence on the perceived ease of use and perceived usefulness of digital payment tools (
Adel, 2024). These constructs, when combined, add value to the explanation of the e-Rupee adoption behavior. The nudge theory (
Thaler & Sunstein, 2009), on the other hand, has been used to describe the impact of small nudges on the behavior of finances, like the default choice or the presence of incentives, which may shape behavior without coercion (
Ozili & Alonso, 2024). Even a study by
Koonprasert et al. (
2024) explained how awareness would prepare for CBDC adoption.
The TAM was selected as the foundational framework over the UTAUT (
Venkatesh et al., 2003;
Venkatesh et al., 2012) for three theoretically grounded reasons. First, TAM’s parsimony—focusing on perceived usefulness (PU) and perceived ease of use (PEOU)—is ideally suited to early-stage pilots like India’s e-Rupee. This is particularly relevant in nascent digital currency contexts (
Kaur et al., 2025;
Singh et al., 2025), where factors such as social influence or facilitating conditions (UTAUT constructs) play a secondary role. Second, TAM facilitates direct empirical testing via logit regression on binary adoption intention, aligning with our demographic focus, whereas UTAUT’s multi-construct SEM complexity often yields lower fit in survey-limited emerging markets (e.g., low digital literacy samples). Third, TAM’s adaptability to behavioral extensions, such as nudge interventions, allows seamless integration without the structural rigidity of UTAUT’s moderators (age, gender, experience), which we incorporate parsimoniously as controls.
Nudge theory extends TAM by addressing bounded rationality in CBDC adoption. Low-salience information nudges (e.g., RBI trust cues) boost PEOU for older/lower income groups, while social proof nudges enhance PU amid gender disparities—directly testable in the logit via interactions. This hybrid TAM-nudge model advances prior UTAUT applications in India (
Kaur et al., 2025) by quantifying nudge-amplified demographic effects during the 2023–2025 e-Rupee rollout, filling a gap in behavioral policy design for financial inclusion. The study makes a distinct theoretical contribution by blending TAM constructs with nudge theory to explain behavioral modifications. In order to frame the information nudges into a real-life situation, the stated preference method is used. The study adopted an information nudge to elicit the willingness to shift to e-Rupee. Since no monetary benefits or sacrifice are involved, this method stands unique from the classic stated preference theory or bounded rationality theory. The mechanism used in the study is provided in the methodology section. By embedding specific information nudge into the TAM framework, the study moves beyond attitudinal and perceived usefulness–based explanations (constructs of TAM) to explicitly model how choice architecture can shift adoption decisions in a large emerging economy. Focusing on India, where governments and regulators increasingly deploy behavioral nudges in financial and digital policy, the paper empirically tests this blended framework using primary data, thereby generating context-specific insights that extend both the TAM and nudge theory literature.
Empirical Review
Past studies on digital currencies have mainly concentrated on macroeconomic effects and policy evaluations (
Ozili & Alonso, 2024;
Bains et al., 2023;
Auer et al., 2020;
Bijlsma et al., 2024;
Fadli et al., 2023;
BIS, 2020b;
Dong et al., 2024;
Elsayed & Nasir, 2022;
Bhaskar et al., 2022;
Xu, 2022;
Zhang, 2020).
Schilling et al. (
2020) is the first study to examine the effect of CBDC on efficiency and financial stability. Similar arguments are provided by
Luu et al. (
2023),
Fernández-Villaverde et al. (
2021), and
Ahnert et al. (
2022,
2023). Though there are studies that have examined the user adoption and perceptions towards CBDC in other countries (
Xu, 2022;
Kiff et al., 2020;
Barkhordari et al., 2017;
Ghosh et al., 2023;
Fadli et al., 2023;
Qu et al., 2022;
Tronnier et al., 2022), their payment ecosystem is quite different from that of India. While the macro-level studies like
Koparan (
2025),
Alfar et al. (
2023),
Bhatnagr et al. (
2025), and
Maryaningsih et al. (
2022) identify country-level drivers of CBDC adoption, some micro-level studies like
Kaur et al. (
2025),
Bhatnagr (
2025), and
Rajan and Trivedi (
2025) have adopted the UTAUT and its extension to explore the behavioral antecedents in India. The user adoption of digital currency, given the pre-existing complex ecosystem of digital payments, becomes quite challenging. For instance, studies like those of
Cheng (
2020),
Xia et al. (
2023), and
Xu (
2022) examined the adoption of e-CNY in China. Given their existing payment apps like Alipay and WeChat Pay, the study found that despite the growth in the number of digital wallets, their user adoption remained low due to established habits, comfort of interoperability, and network effects. Even a study by
Aggarwal et al. (
2023) explained that people are prone to pay inertia, where they would choose familiar, trusted systems over newer and different ones, unless they observe relative benefits. Hence, understanding the influence of perceived ease of use or convenience of CBDC adoption becomes important.
One of the interesting studies by
Rahi and Abd. Ghani (
2018) and
Wright et al. (
2022) on the Bahamas’ adoption of the Sand Dollar found that, even though the country pioneered in deploying large-scale CBDC, its adoption, especially in rural areas, was low due to a lack of awareness and trust in digital systems.
Ozili and Alonso (
2024) found that behavioral elements like trust and perceived credibility have a significant impact on the adoption of the Nigerian eNaira. In the case of the digital euro,
Tronnier et al. (
2022) analyzed that privacy concerns and trust affect the willingness to adopt CBDC.
The studies exploring the adoption of CBDC in India are still in their infancy. However, the literature on its concept, feasibility, and challenges is widely discussed.
RBI (
2023), in its concept note, has described the benefits of CBDC, including efficiency, transparency, and inclusion.
Banerjee and Sinha (
2023) highlight the potential of CBDC to boost financial inclusion in the country, and the implications of CBDC have been explored by
Chawla (
2023),
Kumari (
2022), and
Shekhar and Ramesh (
2025). A recent study by
Prajapati and Kumar (
2025) highlighted the challenges of CBDC operation in a given complex ecosystem of UPI, ULI (Unified Lending Interface).
Empirical studies on retail CBDC adoption, though, remain meager, and existing studies like that of
Di Maggio et al. (
2024) primarily examined the impacts of CBDC on bank deposits and the impact of UPI tax, rather than the behavioral aspect of user adoption. Even theoretical debates have been made on technological architecture, financial considerations, or comparison of CBDCs to other nations (
Bains et al., 2023), excluding the adoption determinants. A study by
Dixit et al. (
2025) integrated interpretive structural modeling and the UTAUT3 framework to understand the acceptance of CBDC. The study highlighted that perceived ease of use, infrastructure, and user intent are the key drivers of acceptance of CBDC. In a similar line,
Sandhu et al. (
2023) found that trust and ease of use are the strong predictors of CBDC adoption in India. A recent study by
Nayak and Kumar (
2025) emphasized that the usage pattern of CBDC among the bank employees depends on the awareness of CBDC. However, these studies have restricted themselves to examining the perceptions of users by conducting a primary survey.
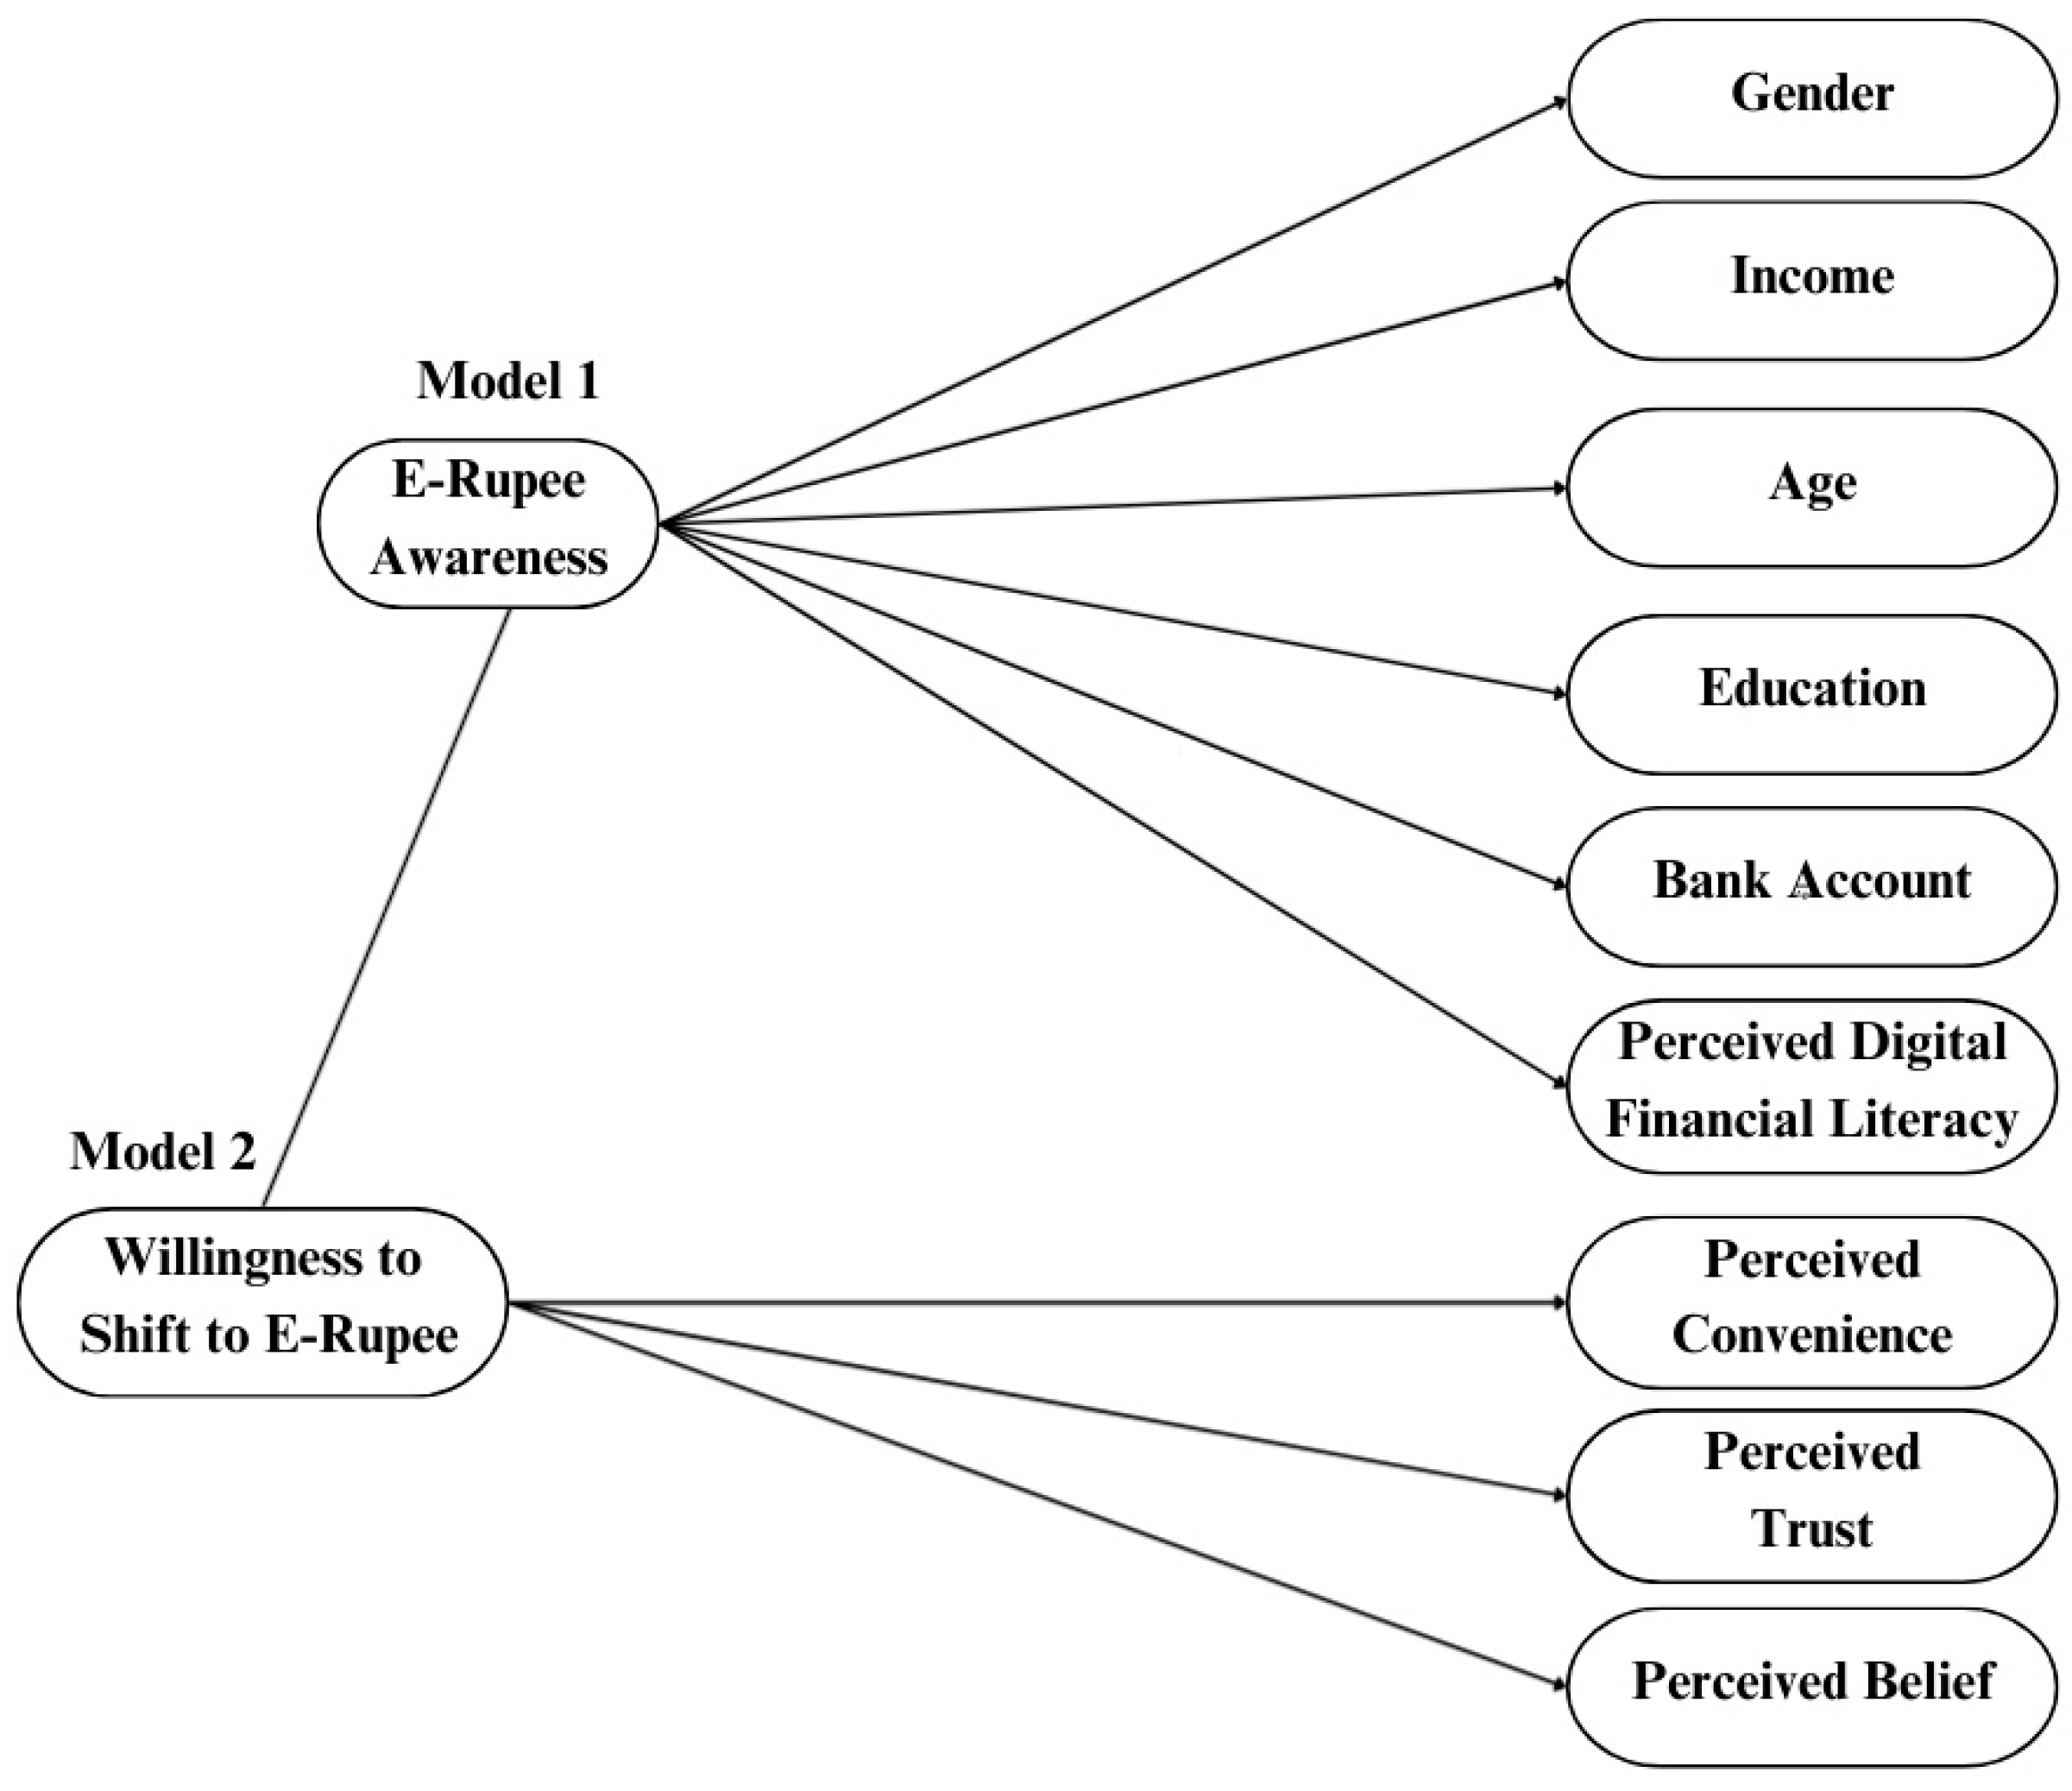
With this theoretical and empirical review, the present study formulated two models to understand the awareness of e-Rupee (model 1) and also the willingness to shift to e-Rupee (model 2) among the public.
Figure 1 provides the conceptual framework for both models. Given the theoretical and empirical literature, the study explores the behavioral resistance using the TAM and nudge model that expressly models the way perceptions are converted into behavioral intention. The study further makes a unique explanation of how the two models are interlinked in the conceptual framework (
Figure 1).
3. Research Gaps and Objectives
The empirical literature reveals three major gaps. First, the majority of CBDC research is macro and descriptive in nature. Second, some behavioral studies are based on generalized constructs like UTAUT or DOI without experimenting with the perceptual constructs of TAM. Finally, there is no systematic quantitative study on the e-Rupee, though it gained increasing policy significance and has a plausible impact at global scale. Our paper specifically advances the literature by conducting primary micro-level logit analysis of retail adoption of CBDC during the active phase of the e-Rupee (2023–2025). Further, deriving targeted policy implications for nudge-based intervention is a novelty of our paper. The research gaps are addressed by using primary data with two main objectives. The first objective deals with the factors influencing the e-Rupee awareness among the public, and the second objective provides the factors that influence the willingness to shift to the e-Rupee, given the present payment mechanisms. To attain these objectives, the study forms the following hypothesis:
Model 1:
H0. The predictor variables do not affect the e-Rupee awareness.
H1. At least one predictor significantly affects the e-Rupee awareness.
Model 2:
H0. The predictor variables do not affect the willingness to shift (WTS) to e-Rupee.
H1. At least one predictor significantly affects the willingness to shift to e-Rupee.
4. Study Area and Research Methodology
The dataset for the study is obtained from the primary survey in one of the major metropolitan cities of India. Being the ‘Silicon Valley’ of the country, the city leads in the technological adoption (
Scaler Report, 2025). The city also topped in the adoption of cryptocurrency among major metro cities in the country. Hence, Bengaluru makes an ideal city to conduct a primary survey, given its demographic, technological, and academic characteristics. However, the study acknowledges the limitation of the generalizability of the results as it restricted itself to one city.
A total of 780 responses were collected, out of which 751 responses are considered after eliminating the non-responses. The study adopted a simple random sampling method due to the large population. Before moving on to the main survey, the study conducted a pilot study to validate the questionnaire. The questionnaire is structured into three sections. Section A gathered socioeconomic information of respondents, including their demographic characteristics such as age, gender, education, income level, and occupation. This providesa contextual understanding of the respondents’ background and their potential influence on digital financial behavior. Section B focused on understanding the participants’ access to formal financial services and their patterns of digital financial engagement. This section collected information on the frequency of online transactions, use of mobile wallets, digital payment habits, and the extent of dependence on technology-enabled financial systems. Lastly, Section C had details of respondents’ awareness, perceptions, and usage behavior concerning India’s central bank digital currency (CBDC). This section provided the information nudge to the respondents regarding the e-Rupee operation, and the willingness to shift to the e-Rupee was elicited. The information nudge that is posed to the respondents is as follows: “The e-Rupee (Digital Rupee) is a digital form of currency (Legal tender) issued by the Reserve Bank of India. Unlike UPI, e-Rupee does not require a bank account and can work even without an internet connection. It can be stored in a digital wallet and used offline through QR codes or device-to-device transfer. It offers privacy in transactions, similar to cash, and is backed directly by the RBI.” With this nudge, their willingness to shift from cash to e-Rupee is elicited. Even the reasons for their preferences are also collected by the study. The data descriptions are provided in the next section.
Data Description
Among the total sample of 751, the gender distribution follows around 51.4% of female and 48.6% of male respondents. The age distribution of the sample is categorized into four groups. Age1 has the respondents below 25 years who constitute nearly 38.5% of the total sample, whereas age2 comprises the 26–45 years group with 44.4%, age3 has 12.6% belonging to the 46–60 years group, and around 4.5% are above 60 years, in age4. With respect to the educational qualification, about 30.5% of the respondents completed 12th grade, 43% are graduates, 23.7% had post-graduate degree, and only 2.8% had education above the post-graduate level.
Regarding banking access, 97% of the respondents have a bank account, showing a high level of financial inclusion. When classified by monthly income, over half of the respondents (53.5%) are in the income category of less than INR 25,000, while 22% are in the income range between INR 25,000 and INR 50,000. Respondents with income between INR 50,000 and INR 1 lakh formed 16.5% of the sample, and those above INR 1 lakh represented nearly 8%.
In terms of digital financial literacy (DFL) levels, 10.1% of the respondents have self-reported that they have the lowest literacy level, and another 10.7% ranked their literacy to be modest. Around 33% of the respondents reported an average level of DFL, while 28.2% indicated good DFL, and 18% reported the highest literacy. Regarding the awareness of the e-Rupee, the majority of the respondents (51%) reported being aware. However, when asked about willingness to shift (WTS) to the digital currency, 60% expressed affirmative intent, whereas 40% indicated reluctance. In terms of adoption, it is observed that only 9% of the respondents use e-Rupee as a payment mode. This forms a critical area of interest given the surge of CBDC at the global level. Hence, the major objective of the study is to understand the adoption of the e-Rupee. Further, the study explored the existing preferences for transactions by the respondents. In terms of payment preferences, a clear inclination toward digital modes is observed—about 58% of respondents preferred both UPI and cash, whereas around 27.8% preferred UPI alone, and the remaining 14.2% preferred cash payments. Further, this preference has been explored to know the rationale in
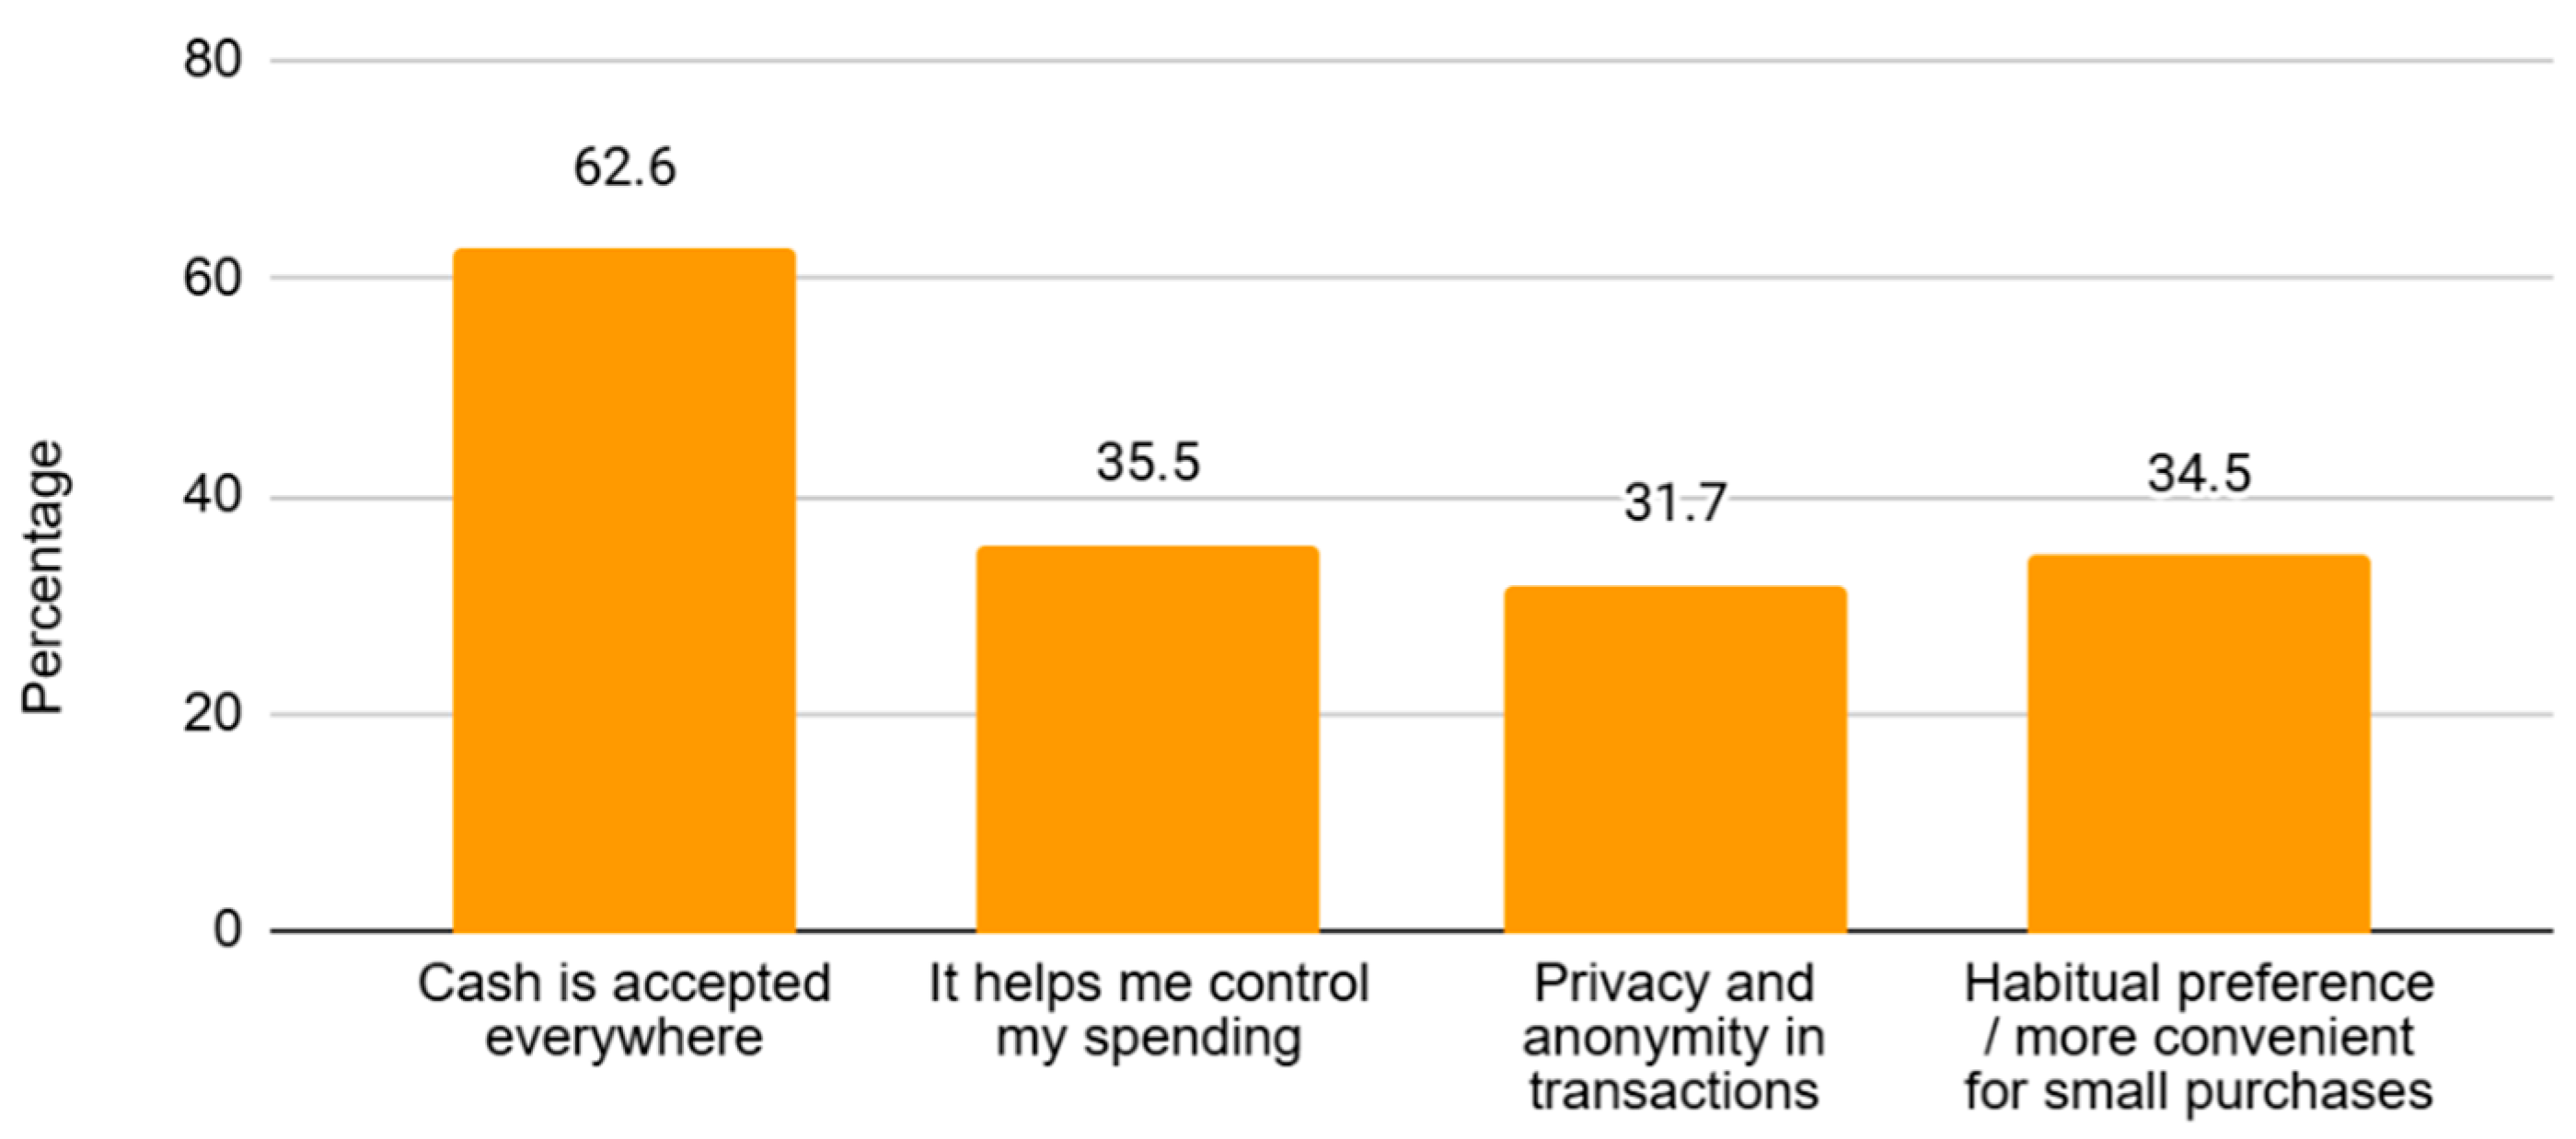
Figure 2 and
Figure 3.
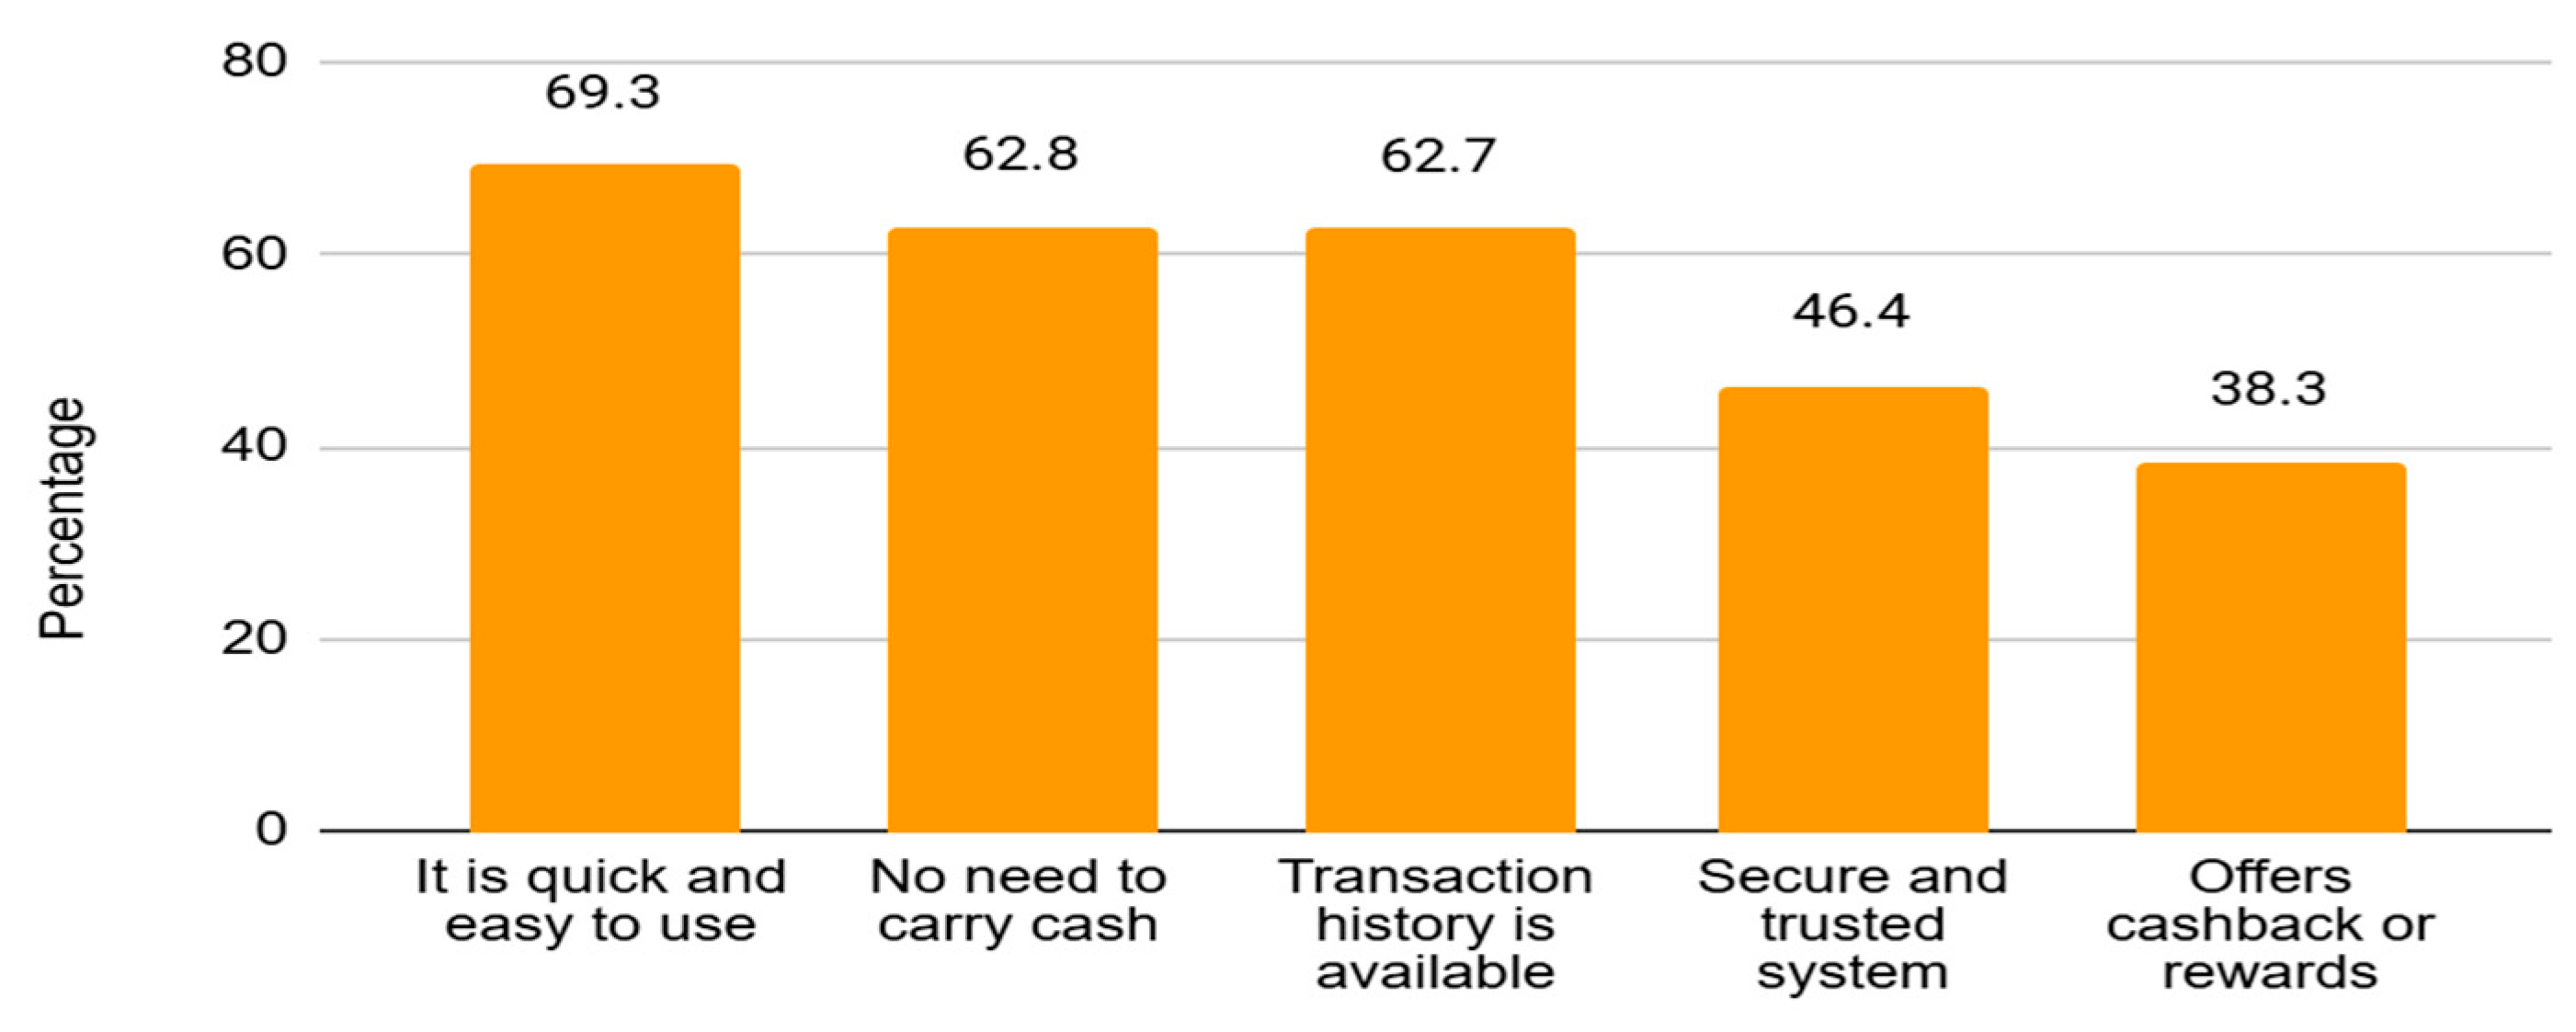
Among those who preferred UPI (27.8%), a majority (69.3%) of them reported ease of use as the major reason, followed closely by no need to carry physical cash (62.8%) and availability of transaction history (62.7%). Additionally, 46.4% believed that the UPI is a secure and trusted mode of payment, while 38.3% valued it for cashback offers and promotional incentives.
Those who preferred cash transactions constituted 14.2% of the total respondents (n = 751). Among them, the most common reason for preferring cash was its universal acceptability (ranked I by 62.6% of cash users). This suggests that cash continues to be valued for its widespread usability and dependability in all kinds of transactions. The next major reason was the perception that cash helps control spending (35.5%), followed by habitual use (34.5%) and privacy concerns (31.7%).
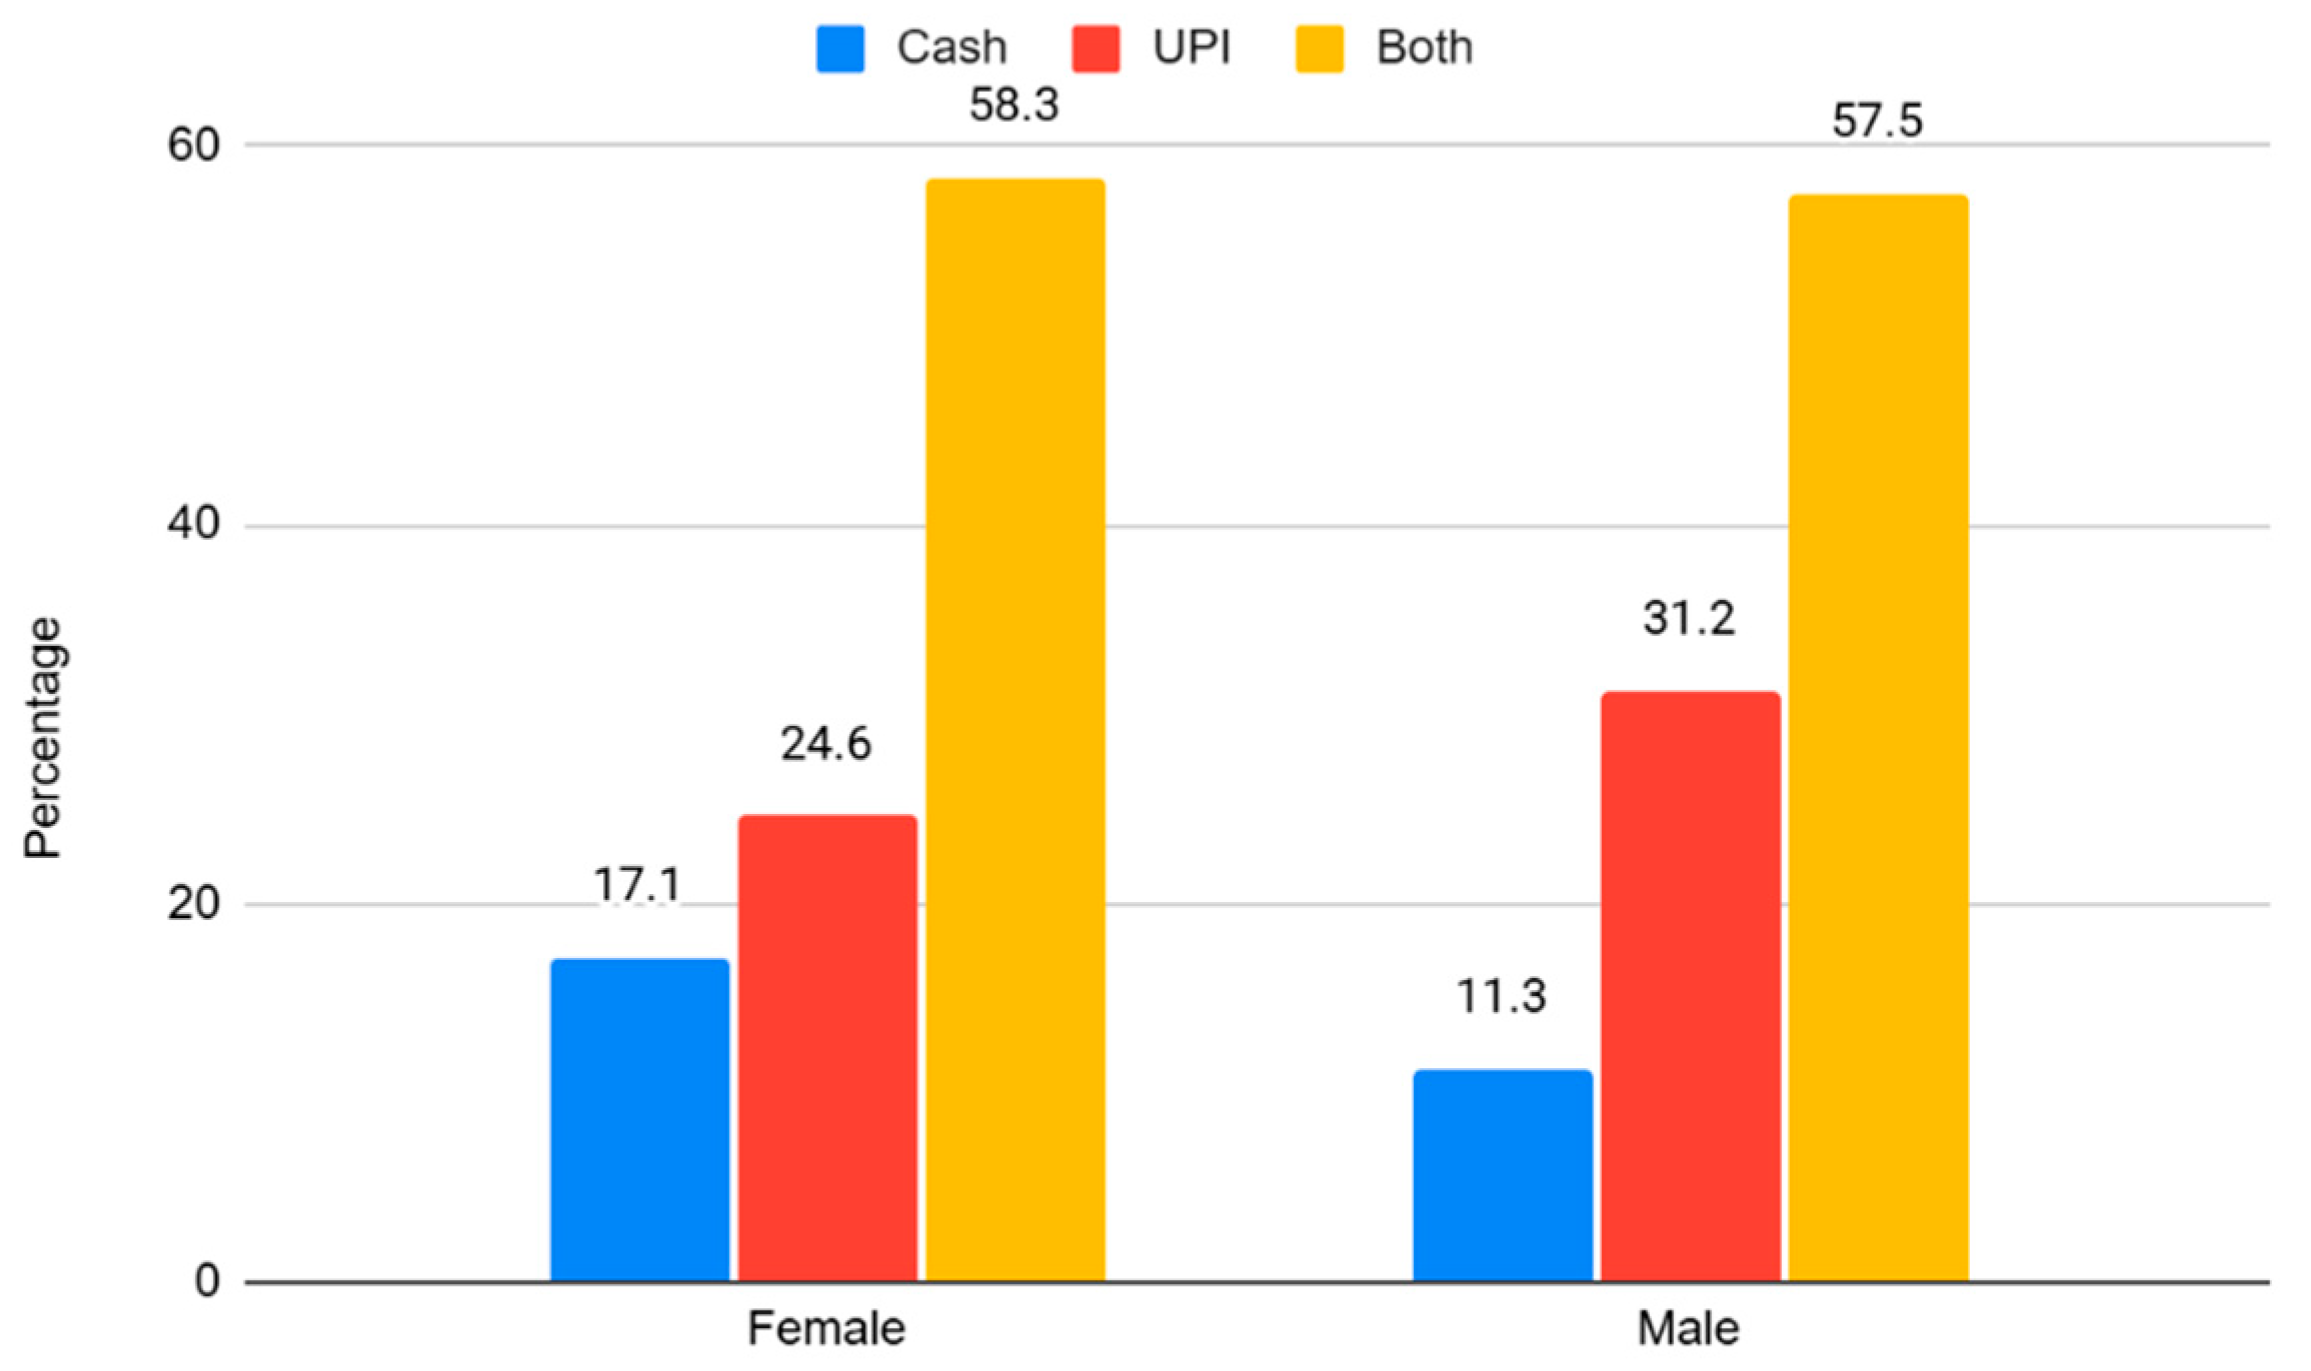
The gender orientation towards the payment mode is mapped in
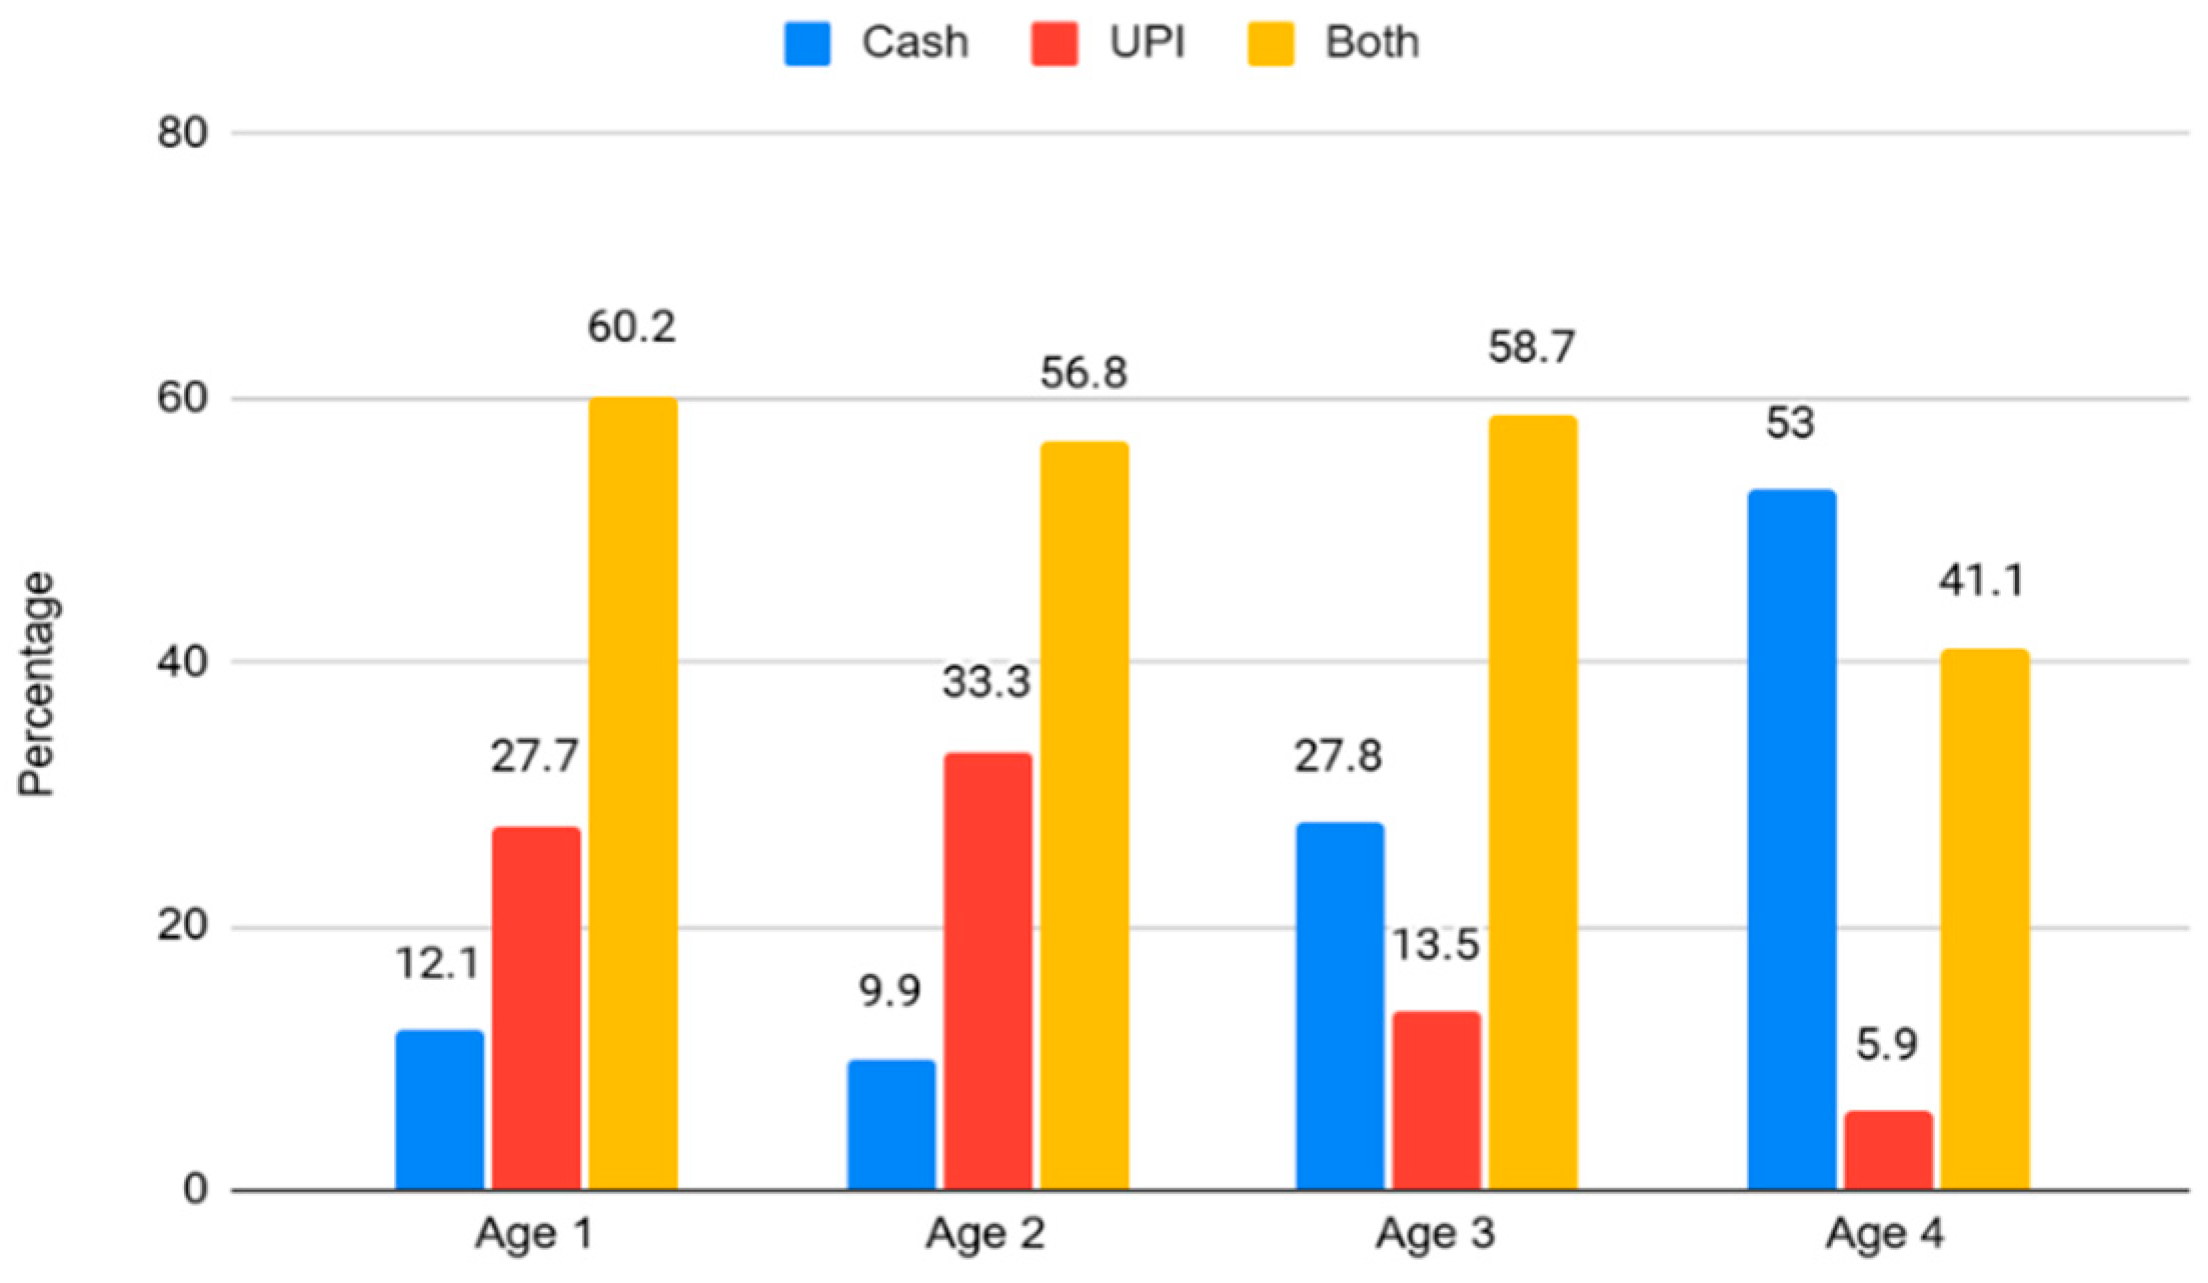
Figure 4 to understand inclinations based on gender. It is quite clear that both men and women prefer both UPI and cash. However, the preference for the UPI is slightly higher among males (31.2%) than among females (24.5%), whereas preference for cash is slightly higher among females (17.1%) than among males (11.4%). Though the difference is very minor, it does tell us the gender orientation towards the payment mechanisms. Further, in terms of age, we can observe from
Figure 5 that though all the age groups prefer both cash and UPI, it can be seen that older respondents (above 61 years) prefer cash (53%) to UPI (5.9%), and younger respondents have an inclination towards UPI (27.7%) than cash. This clearly indicates that digital literacy is one of the key determinants of the e-Rupee adoption.
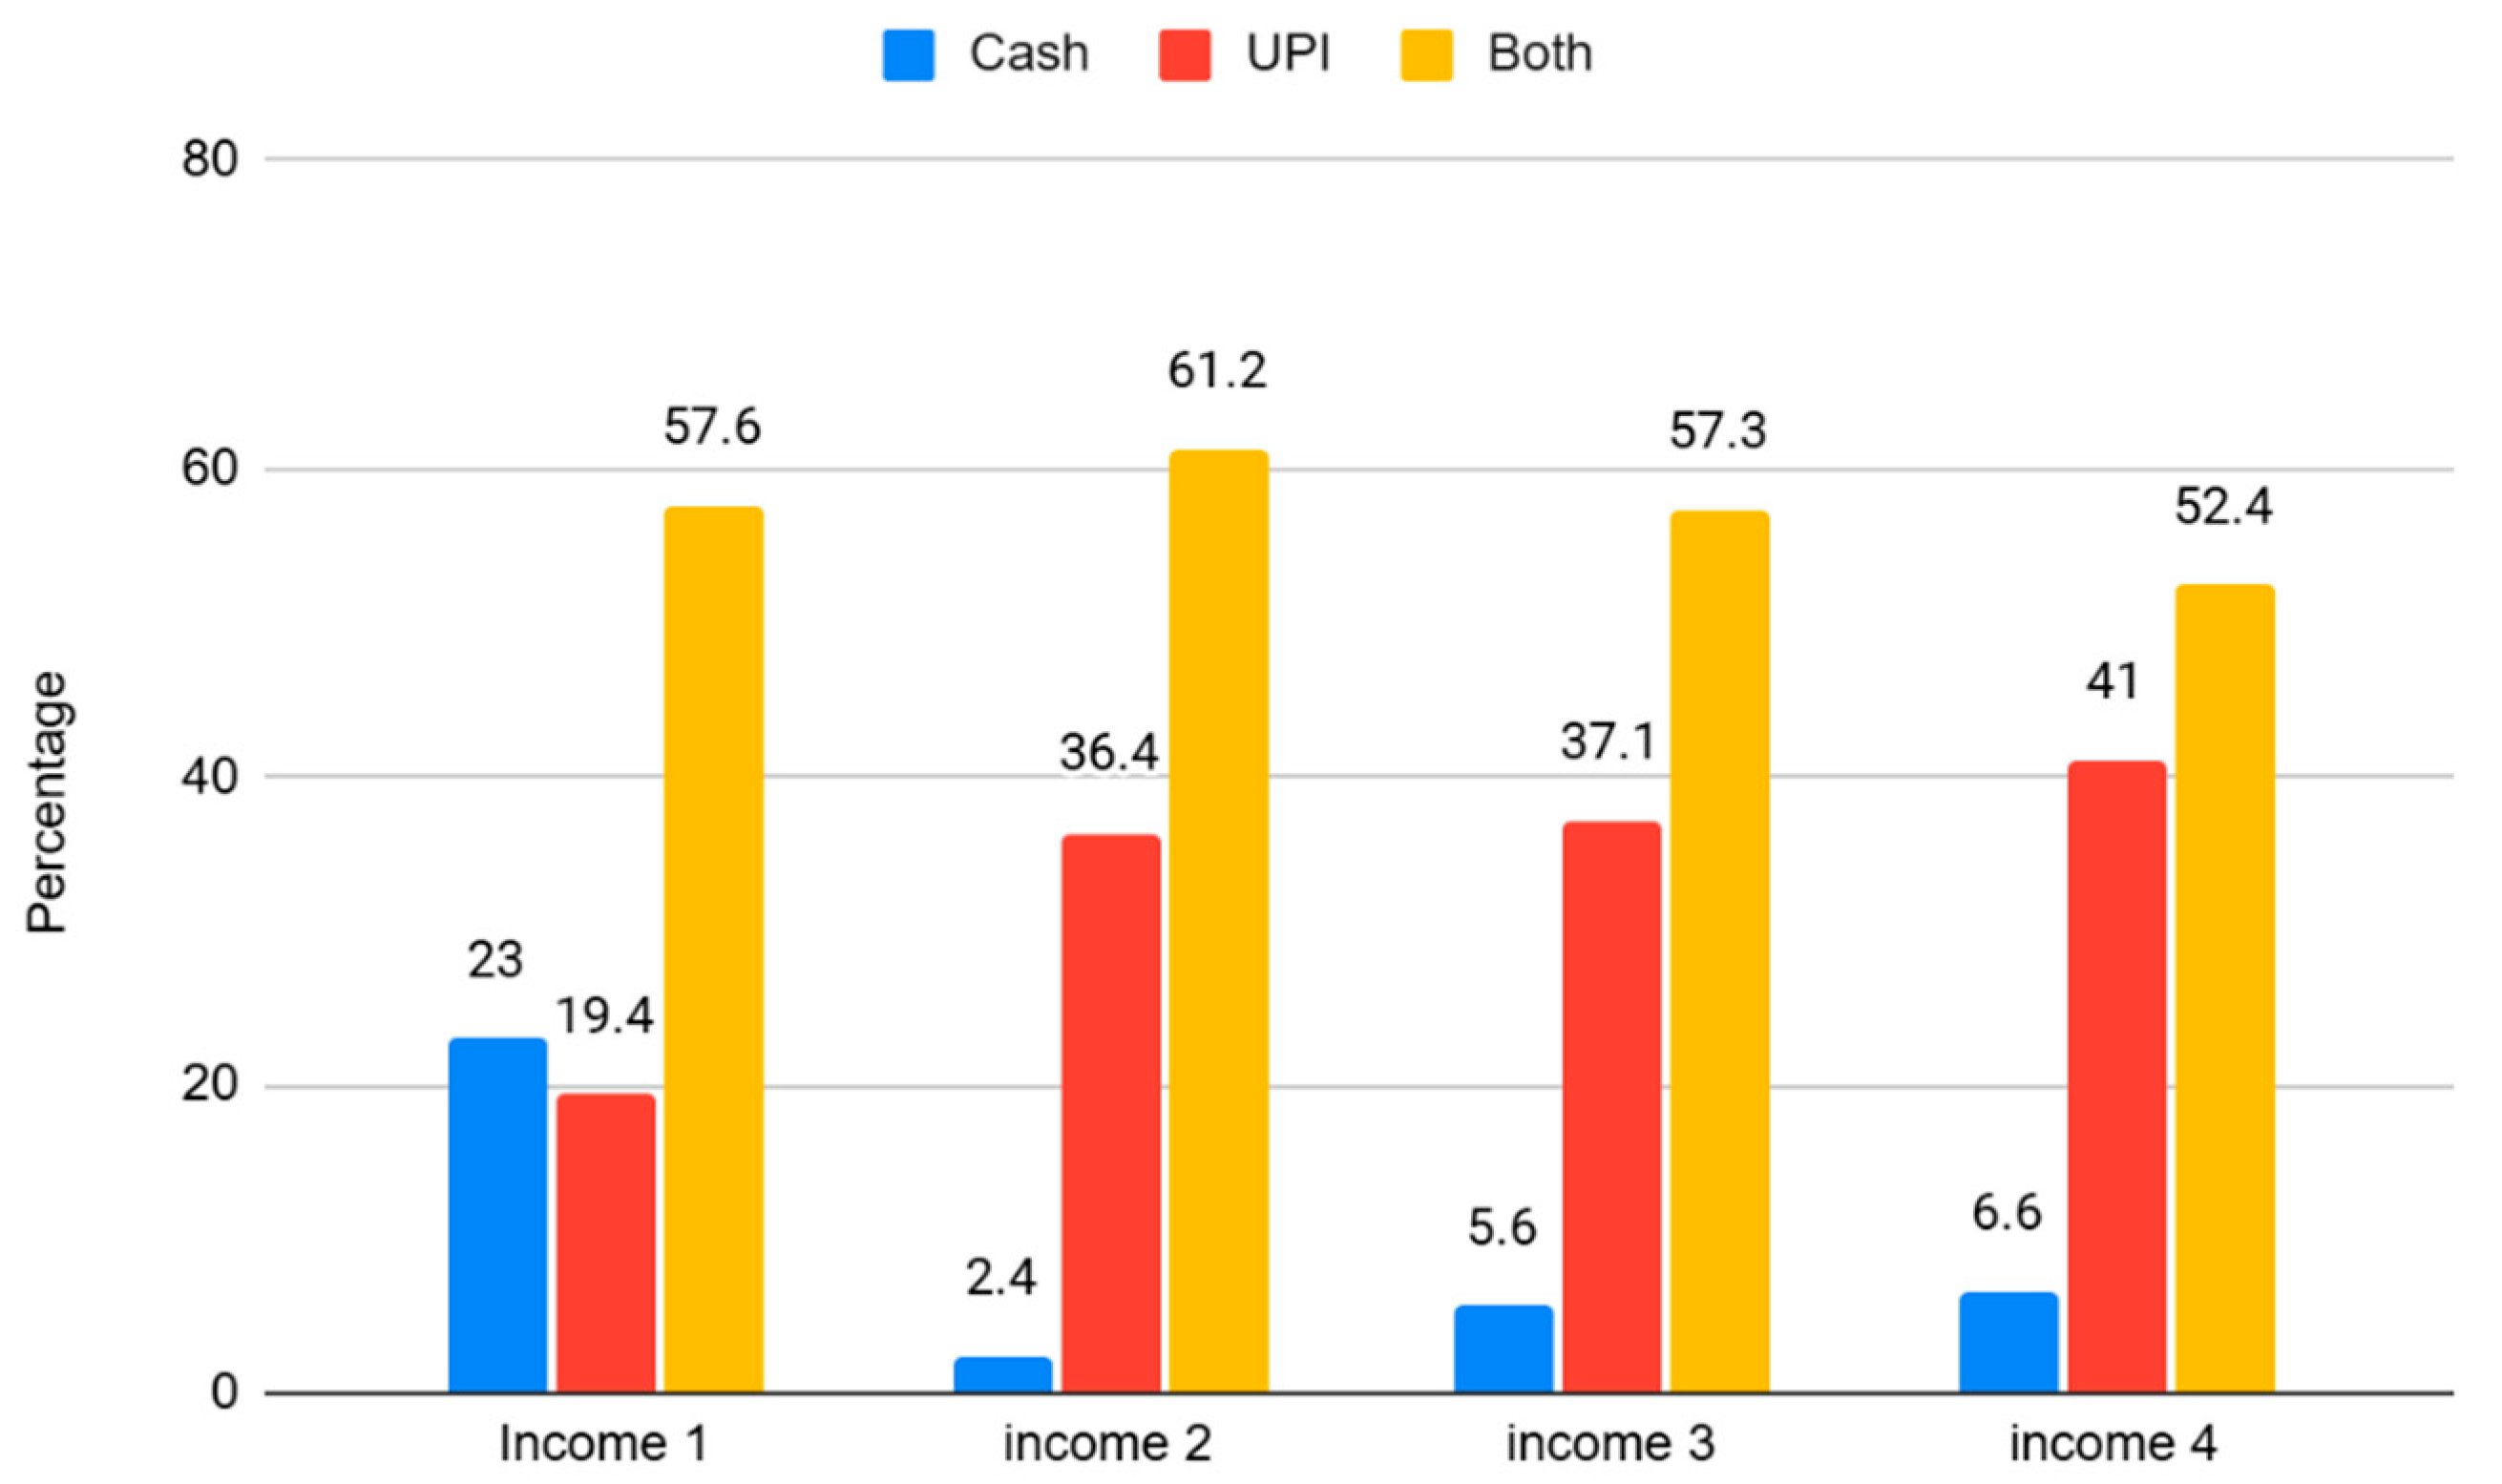
Further, in terms of income (
Figure 6), the majority of the income groups preferred both UPI and cash. However, the higher income category (above INR 1 lakh) prefers UPI (41%) over the lower income groups. This clearly indicates that the preference for the payment model is based on income.
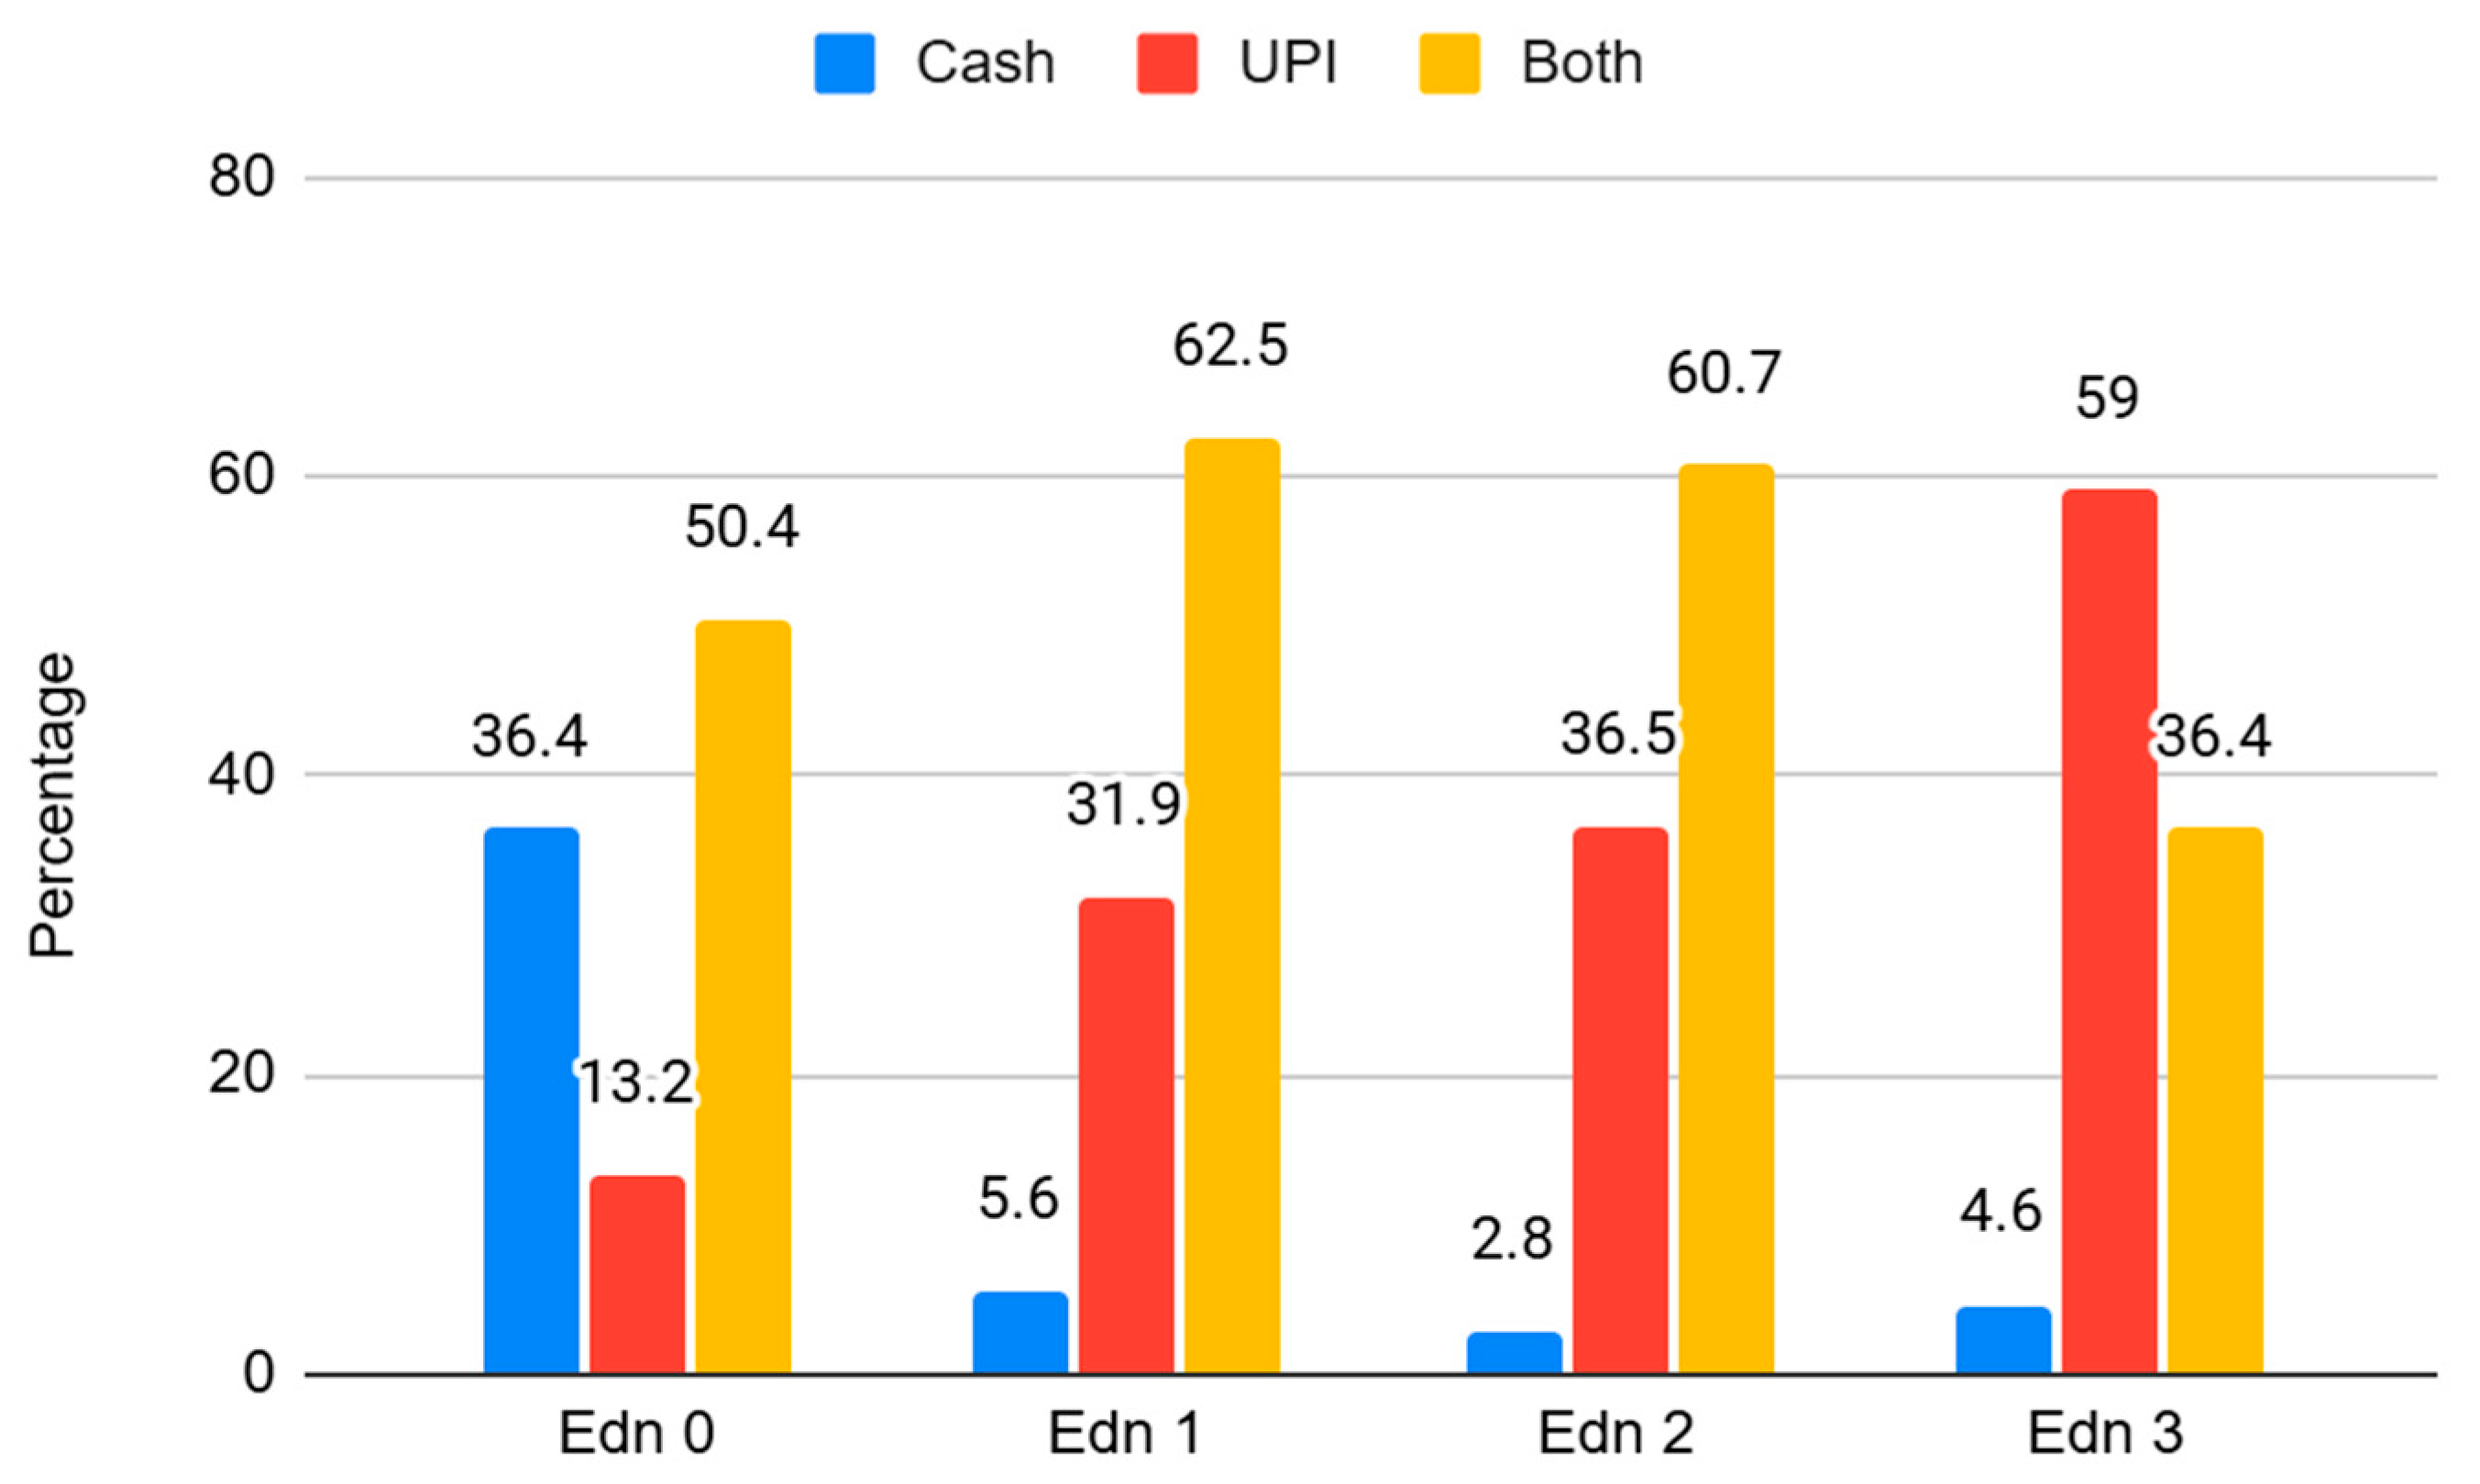
In terms of education, it can be observed from
Figure 7 that respondents who belong to edu1 (education above PG) group rely more on digital payments like UPI (59%), and less on cash (4.6%), whereas all the other groups use both UPI and cash as their daily payment mode. However, edu0 (education less than 12th) prefer more cash (36.4%) than UPI (13.2%). This variation clearly indicates that education is a significant factor in understanding the e-Rupee adoption in India.
This descriptive analysis indicates a clear transition trend in the economy towards UPI. At this juncture, introducing the e-Rupee has been a game-changer. To elucidate the determinants of e-Rupee adoption, the study relied on econometric modeling, which provides key insights to policymakers to enhance the viability and implementation. The details of the modeling are provided in the next section.
5. Methodology
The study relied on a binary logit model whose rationale is provided in this section. When the response variable Y follows a Bernoulli distribution of parameter μ, then the generalized linear model (GLM) uses the logit function as the canonical link function and becomes a logistic regression model. As
Yi ~
Ber (
μi), then
μi = P (
Yi = 1) (adopted from
Costa e Silva et al., 2020). The variable e-Rupee aware and WTS (willingness to shift) are dichotomous variables Y such that
Model 1: Y1 = 1 if they are aware, and 0 otherwise;
Model 2: Y2 = 1 if they are willing to shift to e-Rupee and 0 otherwise.
The logit model predicts the logit of Y from X, which represents a natural logarithm of the odds of Y. The model is written (following
C. Peng et al., 2002;
Akinyemi et al., 2021) as follows:
where ln is the log-odds and p is the probability of the outcome given that X =
x. The LR model has a logit that is linear in X, which can be written as follows:
where α is the parameter of the Y-intercept and β is the parameter of the slope. X can be a qualitative (categorical) or quantitative variable, and Y is always categorical in the binary logit regression. The equation can be extended for multiple linear regression as
where Li = 1 is the probability of an outcome; 0 otherwise.
ϵ is the error term. When applied to the current study, Li = 1 is the awareness of e-Rupee and 0 otherwise, and WTS to e-Rupee and 0 otherwise.
To estimate the regression coefficients of the GLM, the maximum likelihood method is used. The estimates for β are obtained as a solution of a system of likelihood equations, which is usually solved using the Nelder and Wedderburn algorithm, which is an iterative method that uses Fisher’s information matrix. Note that several methods may be used to estimate the coefficients of a GLM (e.g., Bayesian methods and M-estimation) (
Costa e Silva et al., 2020).
The binary logit regression results are presented in terms of odds ratios and marginal effects. Odds ratios reveal the impact of independent variables on the odds of obtaining a ‘better’ outcome, while marginal effects denote the change in the probability of a ‘better’ outcome due to a unit change in the independent variable.
6. Data Analysis and Results
The study has examined the factors determining e-Rupee awareness and the willingness to shift to e-Rupee using a binary logit regression model. The description and summary statistics of the variables adopted in the model are provided in
Table 1.
6.1. Model 1: Factors Affecting e-Rupee Awareness
The logistic regression model examining the factors affecting the e-Rupee awareness based on income, age, gender, awareness, having a bank account, digital financial literacy, perceived convenience, perceived trust, and perceived belief on the e-Rupee role in the future is provided in
Table 2. Overall, LR (
χ2) (12) = 74.23, ρ < 0.001, indicating that the predictors jointly explain the dependent variable. The pseudo R
2 value of 0.0713 suggests that approximately 7 percent of the variance in the dependent variable is explained by the model. Though the pseudo R
2 value is low, this is typical of logit regression and does not imply poor model performance. The model accuracy is supported by the highly significant LR (
χ2).
Table 2 and
Table 3 provide the logistic regression estimation and their odds-ratio (exp(β)). Following
Sperandei (
2014) and
C. J. Peng and So (
2002), the study will report and interpret the odds ratio. The predictors like age, income, education, and digital financial literacy are found statistically significant. In the case of age, as the base category age4 (above 61 years)
2, the results indicate that as age increases, the e-Rupee awareness will also increase. A similar result is found in the case of education, which shows positive and significant results. For instance, compared to lower educated respondents (less than 12th Standard), the e-Rupee awareness will increase with education among those who did graduation, PG, and above PG by 148%, 139%, and 136%, respectively. One of the interesting results is found in the case of the income category, where, compared to the lower income group (less than 25,000), the higher income category respondents have a higher probability of e-Rupee awareness. For instance, though the income group of Y1 has odds of 41% higher probability of e-Rupee awareness, the variable is found to be insignificant. However, the income groups of Y2 and Y3 are found to have a higher probability of 174% and 105%, respectively. This indicates that people in the higher income group are more aware of the e-Rupee operation in the study area. Another important variable of the model is the digital financial literacy, which is taken as the ordinal variable. This perceived literacy is found to be positive and significant, indicating that one level increase in the literacy level increases the odds of being aware of e-Rupee by approximately 30%, controlling for other variables.
To make the result interpretation more intuitive, the study adopted the change in probability by calculating the marginal effect in
Table 4. Marginal effects are more preferable for behavioral and policy interpretation (
Norton et al., 2024).
The predicted probabilities of education are showing positive and significant results. Compared to less educated respondents (edu0), individuals with a graduate degree exhibited a 22% higher probability of e-Rupee awareness, while those with education beyond post graduate level show 28% higher probability of awareness. In the case of the age group, compared to the older age group (Age4), people belonging to age1, age2, and age3 are less likely to be aware of e-Rupee. For instance, respondents aged less than 25 years are nearly 14.4% less likely to know about e-Rupee. People belonging to age2 (26–45 years) are 10.7% less likely to know about e-Rupee. The income group is found to have a significant impact on the awareness. Compared to the lower income group (Y0), the income groups of Y2 andY3 are found to have positive and significant values, except for Y1. This indicates that people in the higher income group have a higher probability of digital currency awareness. To elaborate, people belonging to Y2 (50,000 to 1) have nearly 13.7% higher probability of e-Rupee awareness compared to people belonging to Y1 (less than 25,000). Similarly, people who earn more than 1 lakh (Y3) have around 17.3% higher probability of e-Rupee awareness compared to Y1.
Model 1 Validation (Results Are Provided in Appendix A.1)
The fitted model’s log-likelihood (−483.35) is higher (less negative) than the null model’s log-likelihood (−520.47) (Refer
Table A1). This indicates that including the predictors in the model improves the model fit compared to using only the intercept. Further, the study conducted the goodness-of-fit test (Hosmer–Lemeshow Test) to evaluate whether the predicted probability from the model matches the actual data (Refer
Table A2). The null hypothesis is framed as the model fits the data well. The
p-value of this model is 0.2252, which is greater than 0.05; we fail to reject H0. This mean model shows no significant lack of fit. The predicted probability is consistent with the observed data. Further, the study developed a classification table (confusion matrix) to evaluate how well a classification model predicts the outcome. The
Appendix A.1 (
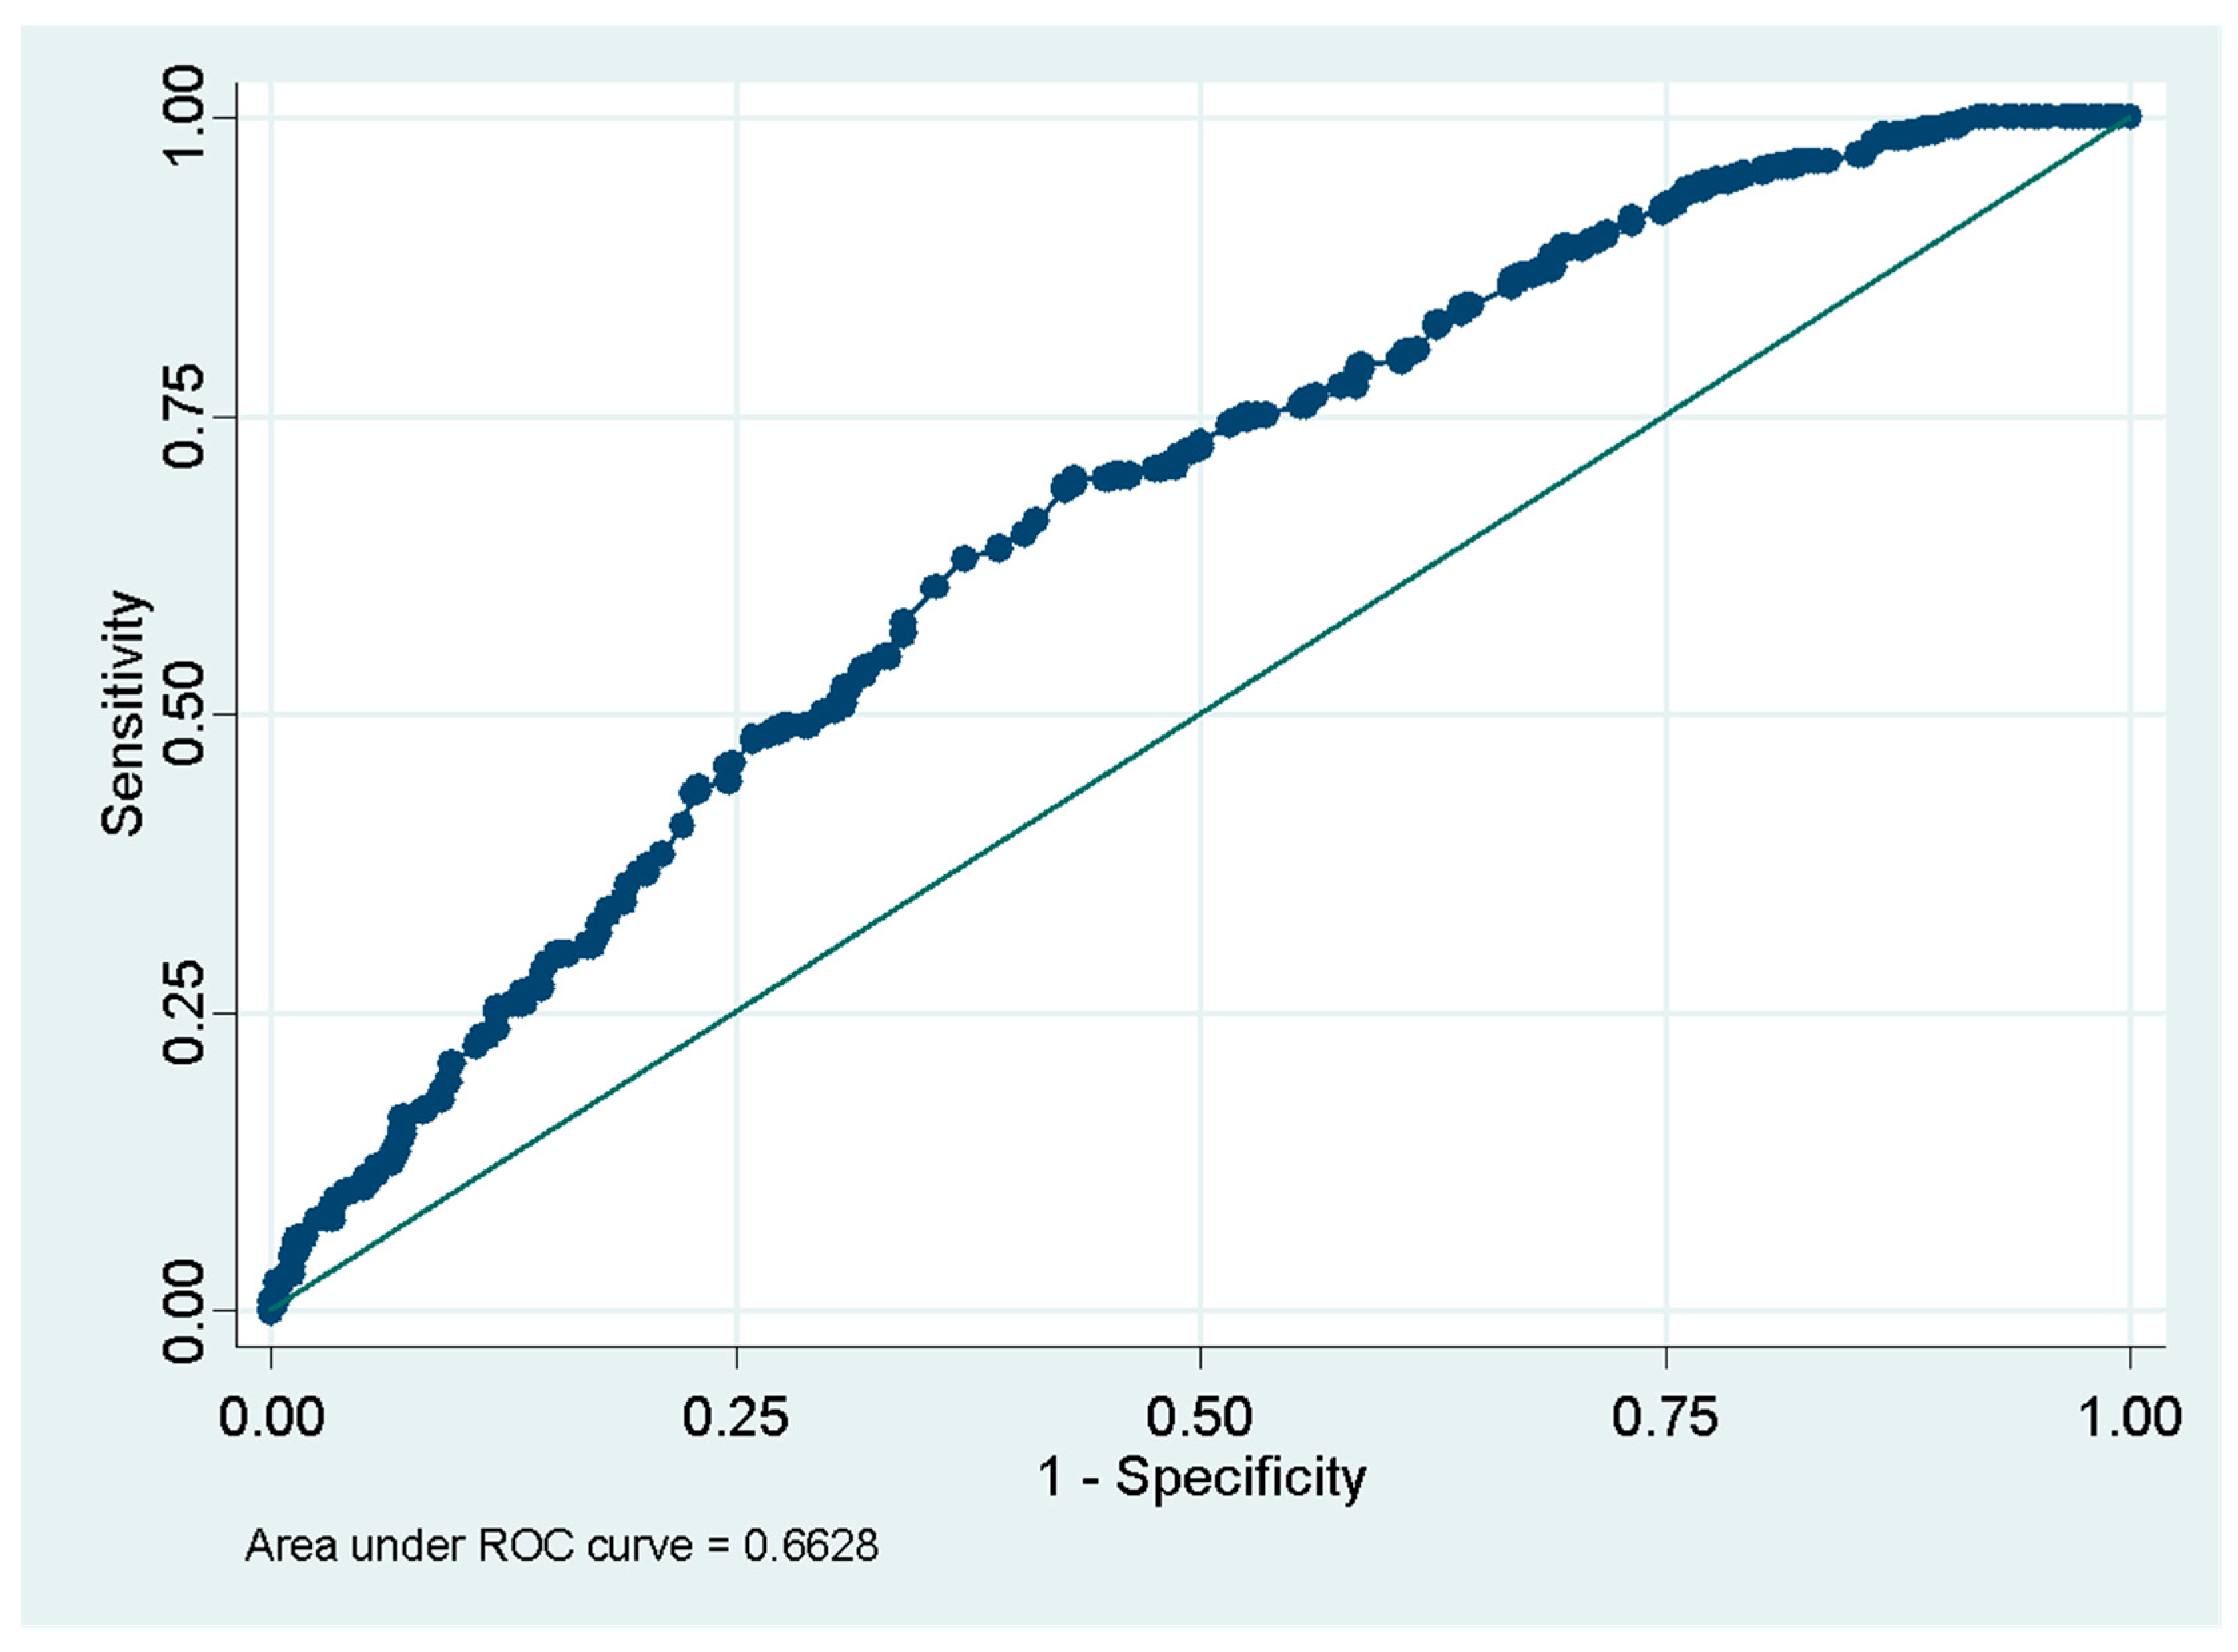
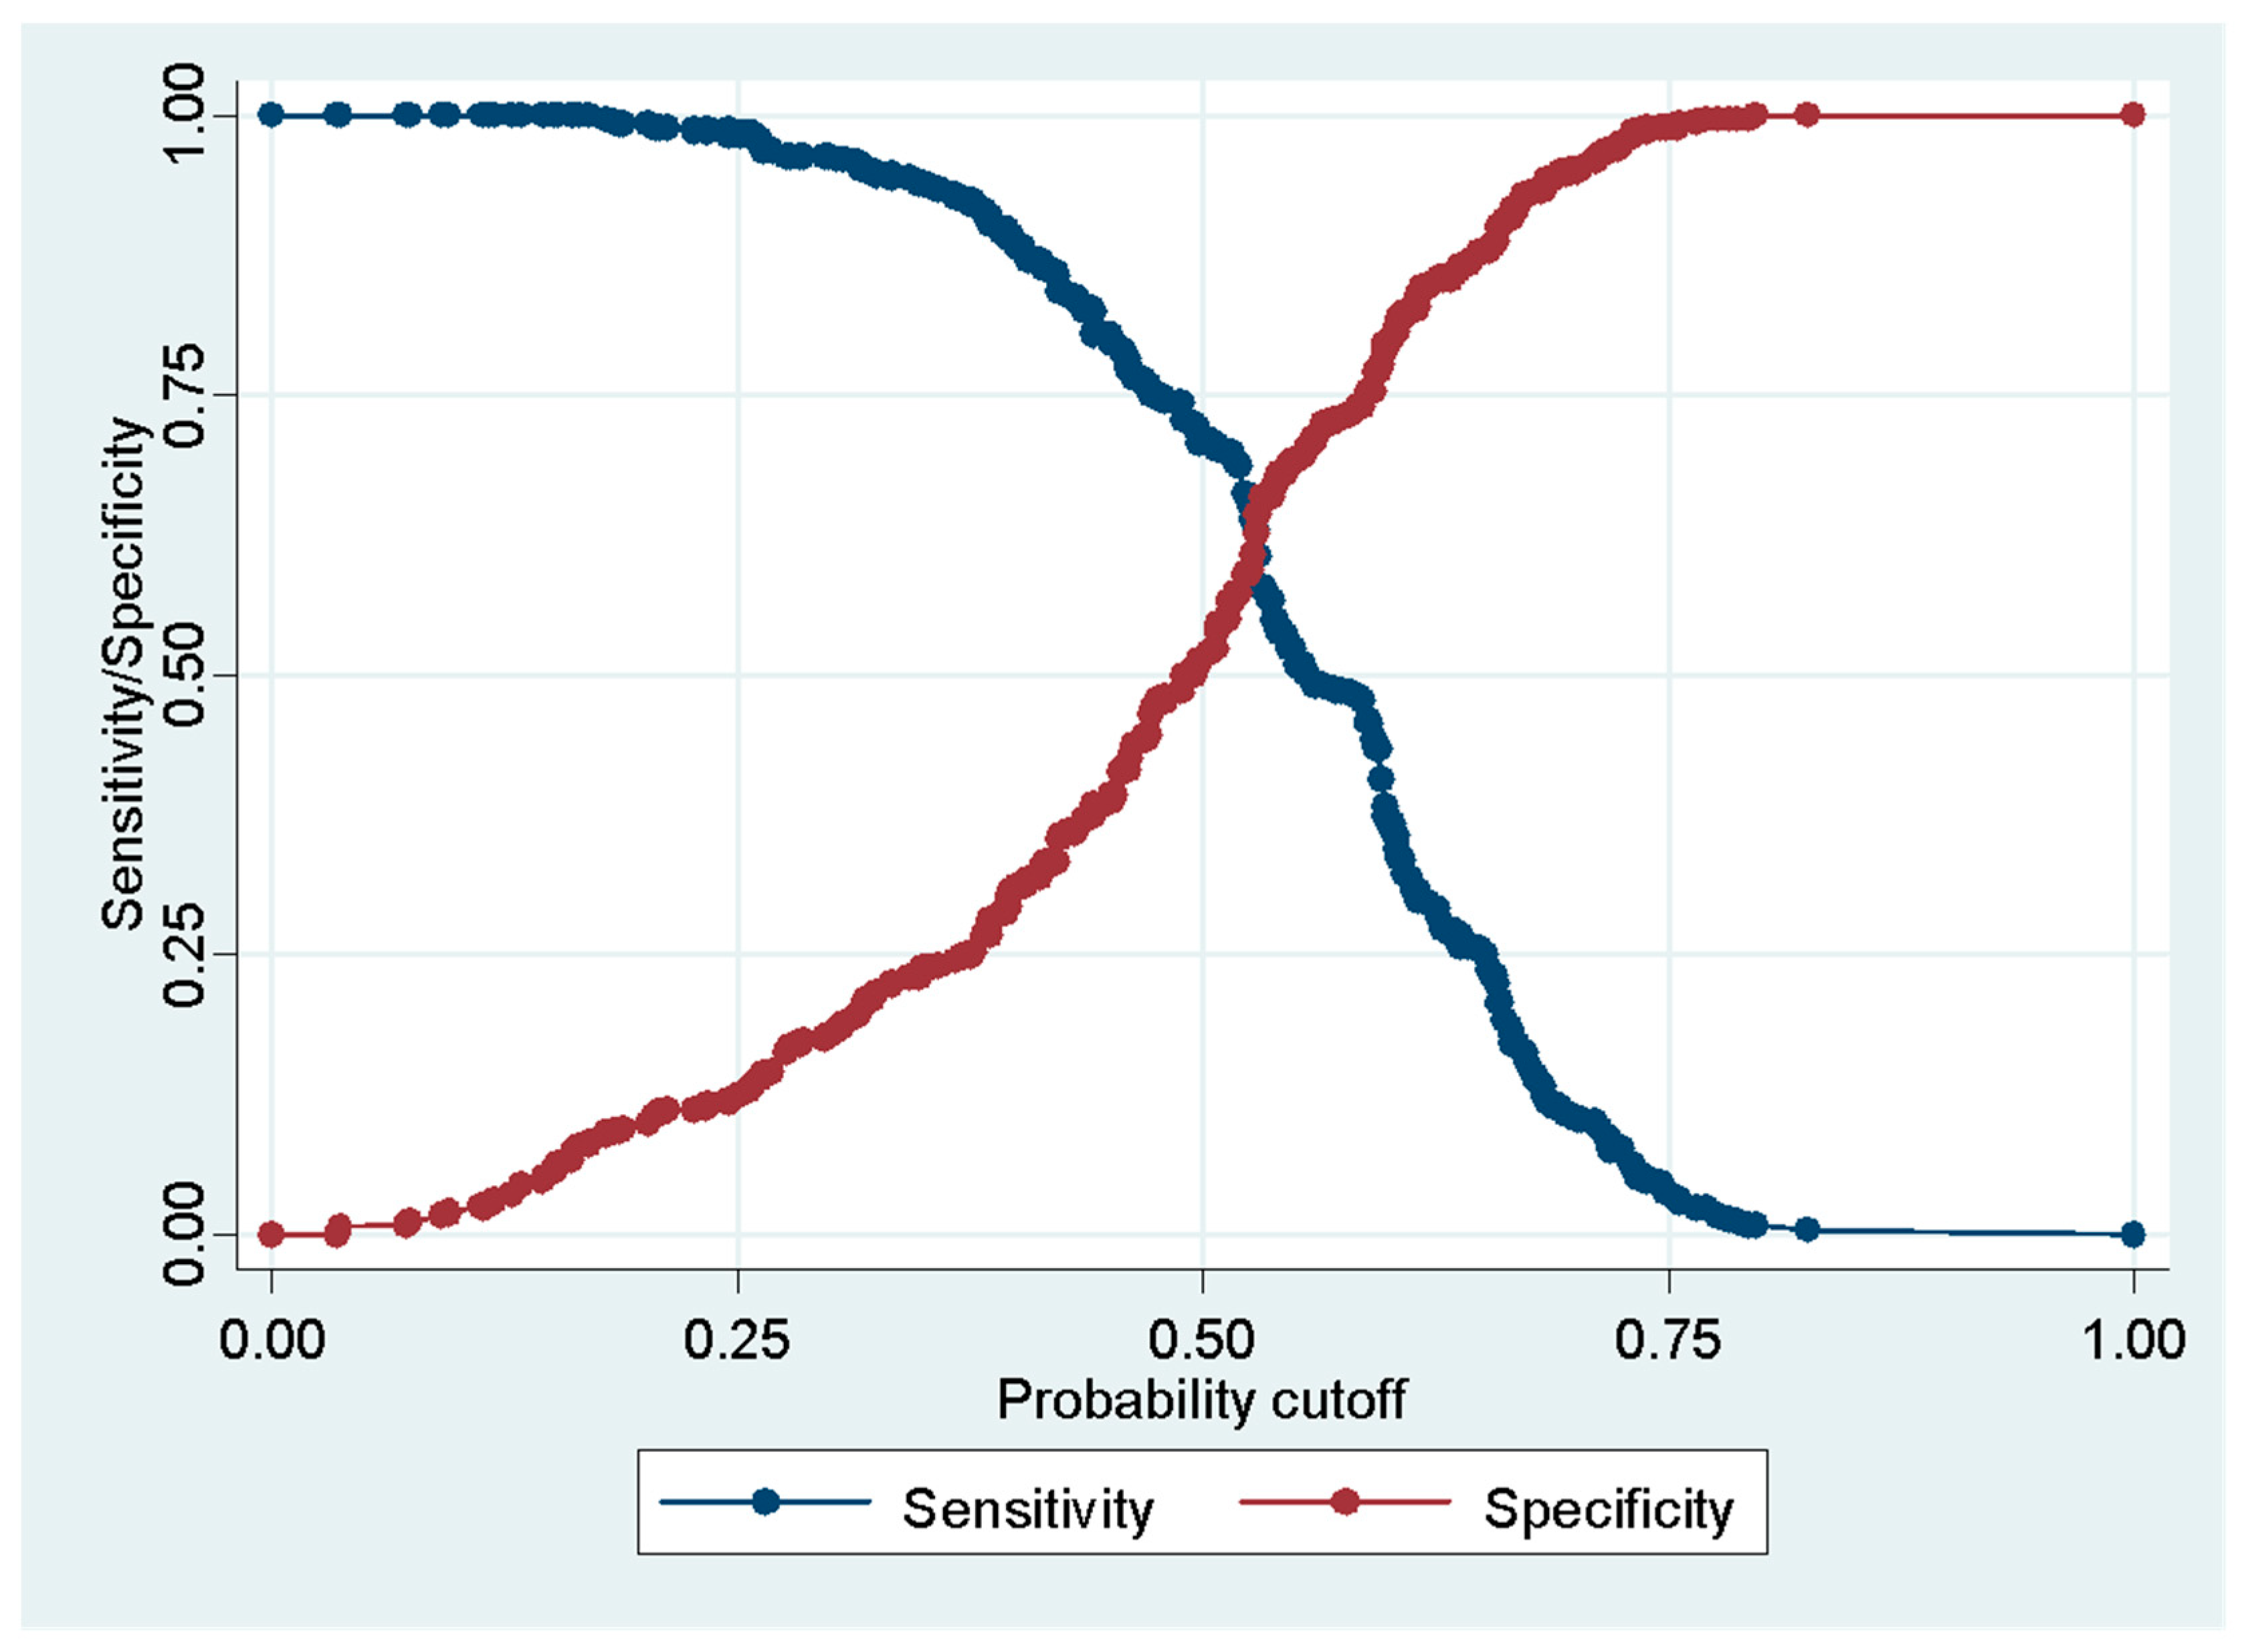
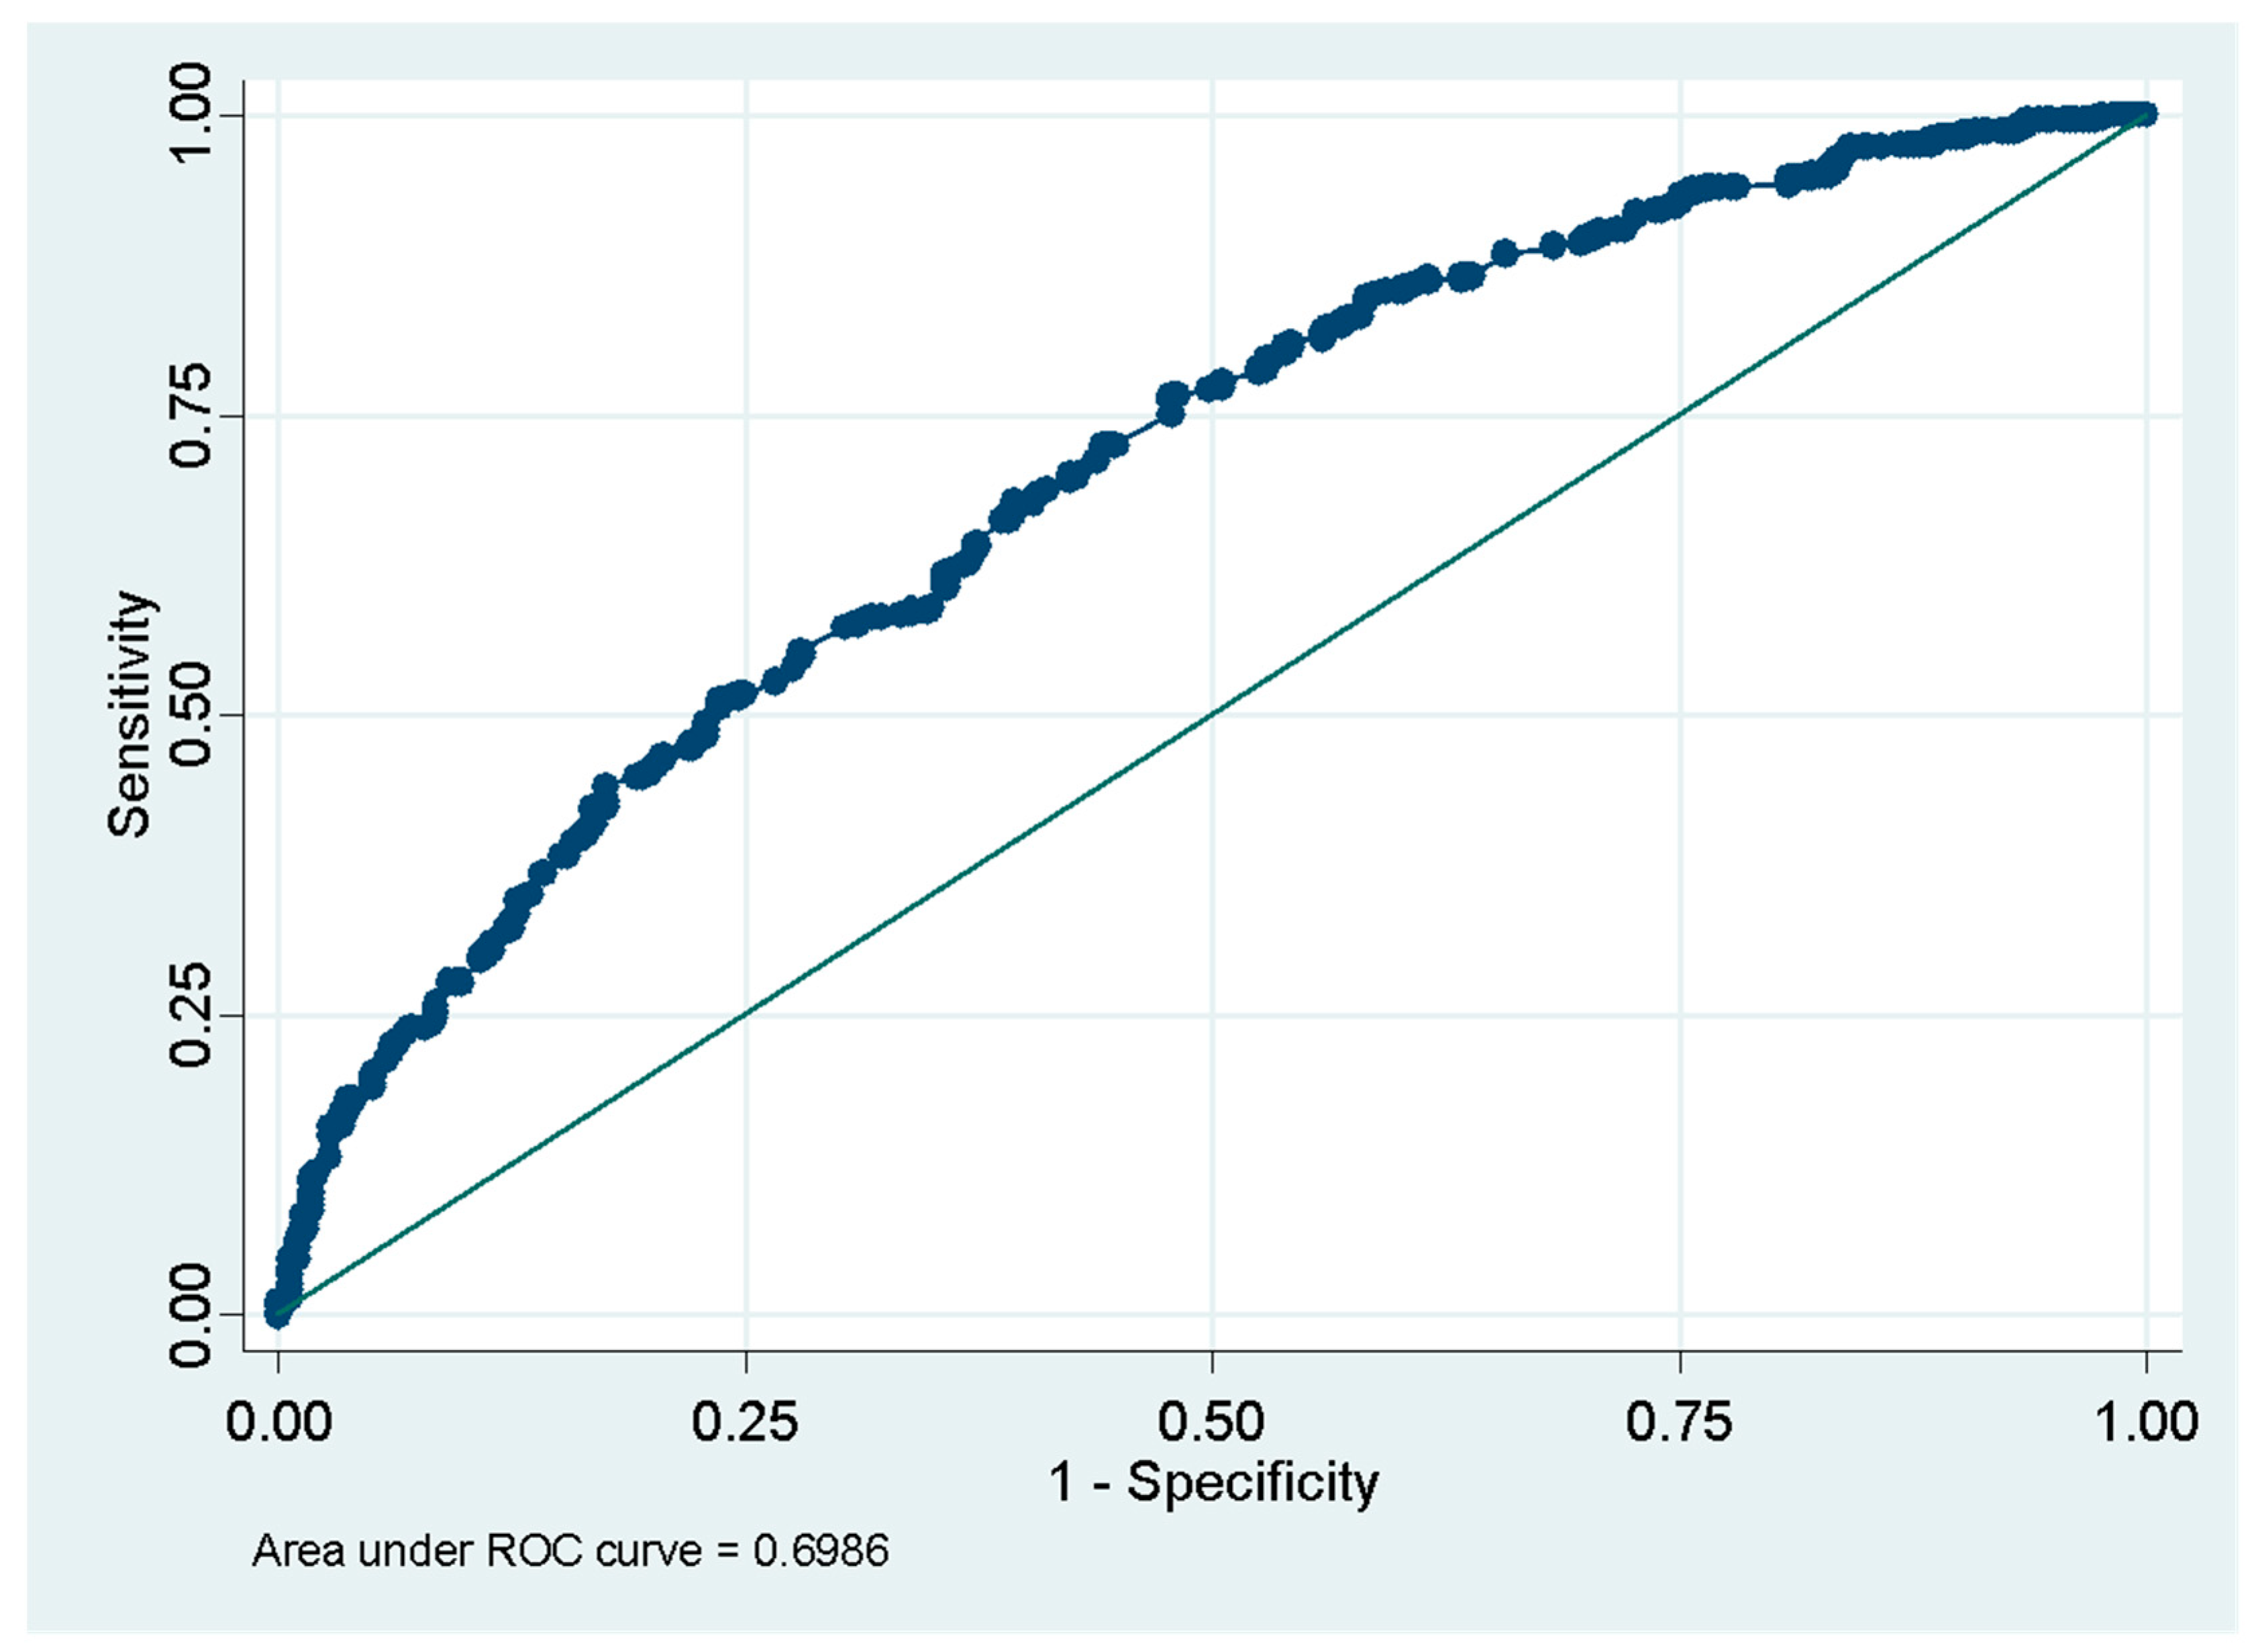
Table A3) provides the details of the matrix. Around 270 cases correctly predict the e-Rupee awareness, and around 178 cases incorrectly predict the e-Rupee awareness, but, actually, they do not. Further, around 192 cases are correctly predicted as not aware of e-Rupee, and 111 cases are predicted as not aware of e-Rupee but are actually aware. The sensitivity value (Recall/True positive rate) of 70.8% for those who are actually aware is correctly predicted. Around 51.8% of those not aware are correctly predicted (specificity). The model is good at identifying those who are not aware. Among those who are predicted as aware of e-Rupee, 60.2% are truly aware, and among those who are predicted as not aware, 63.3% are truly not aware. The ROC and sensitivity curves of the model are provided in
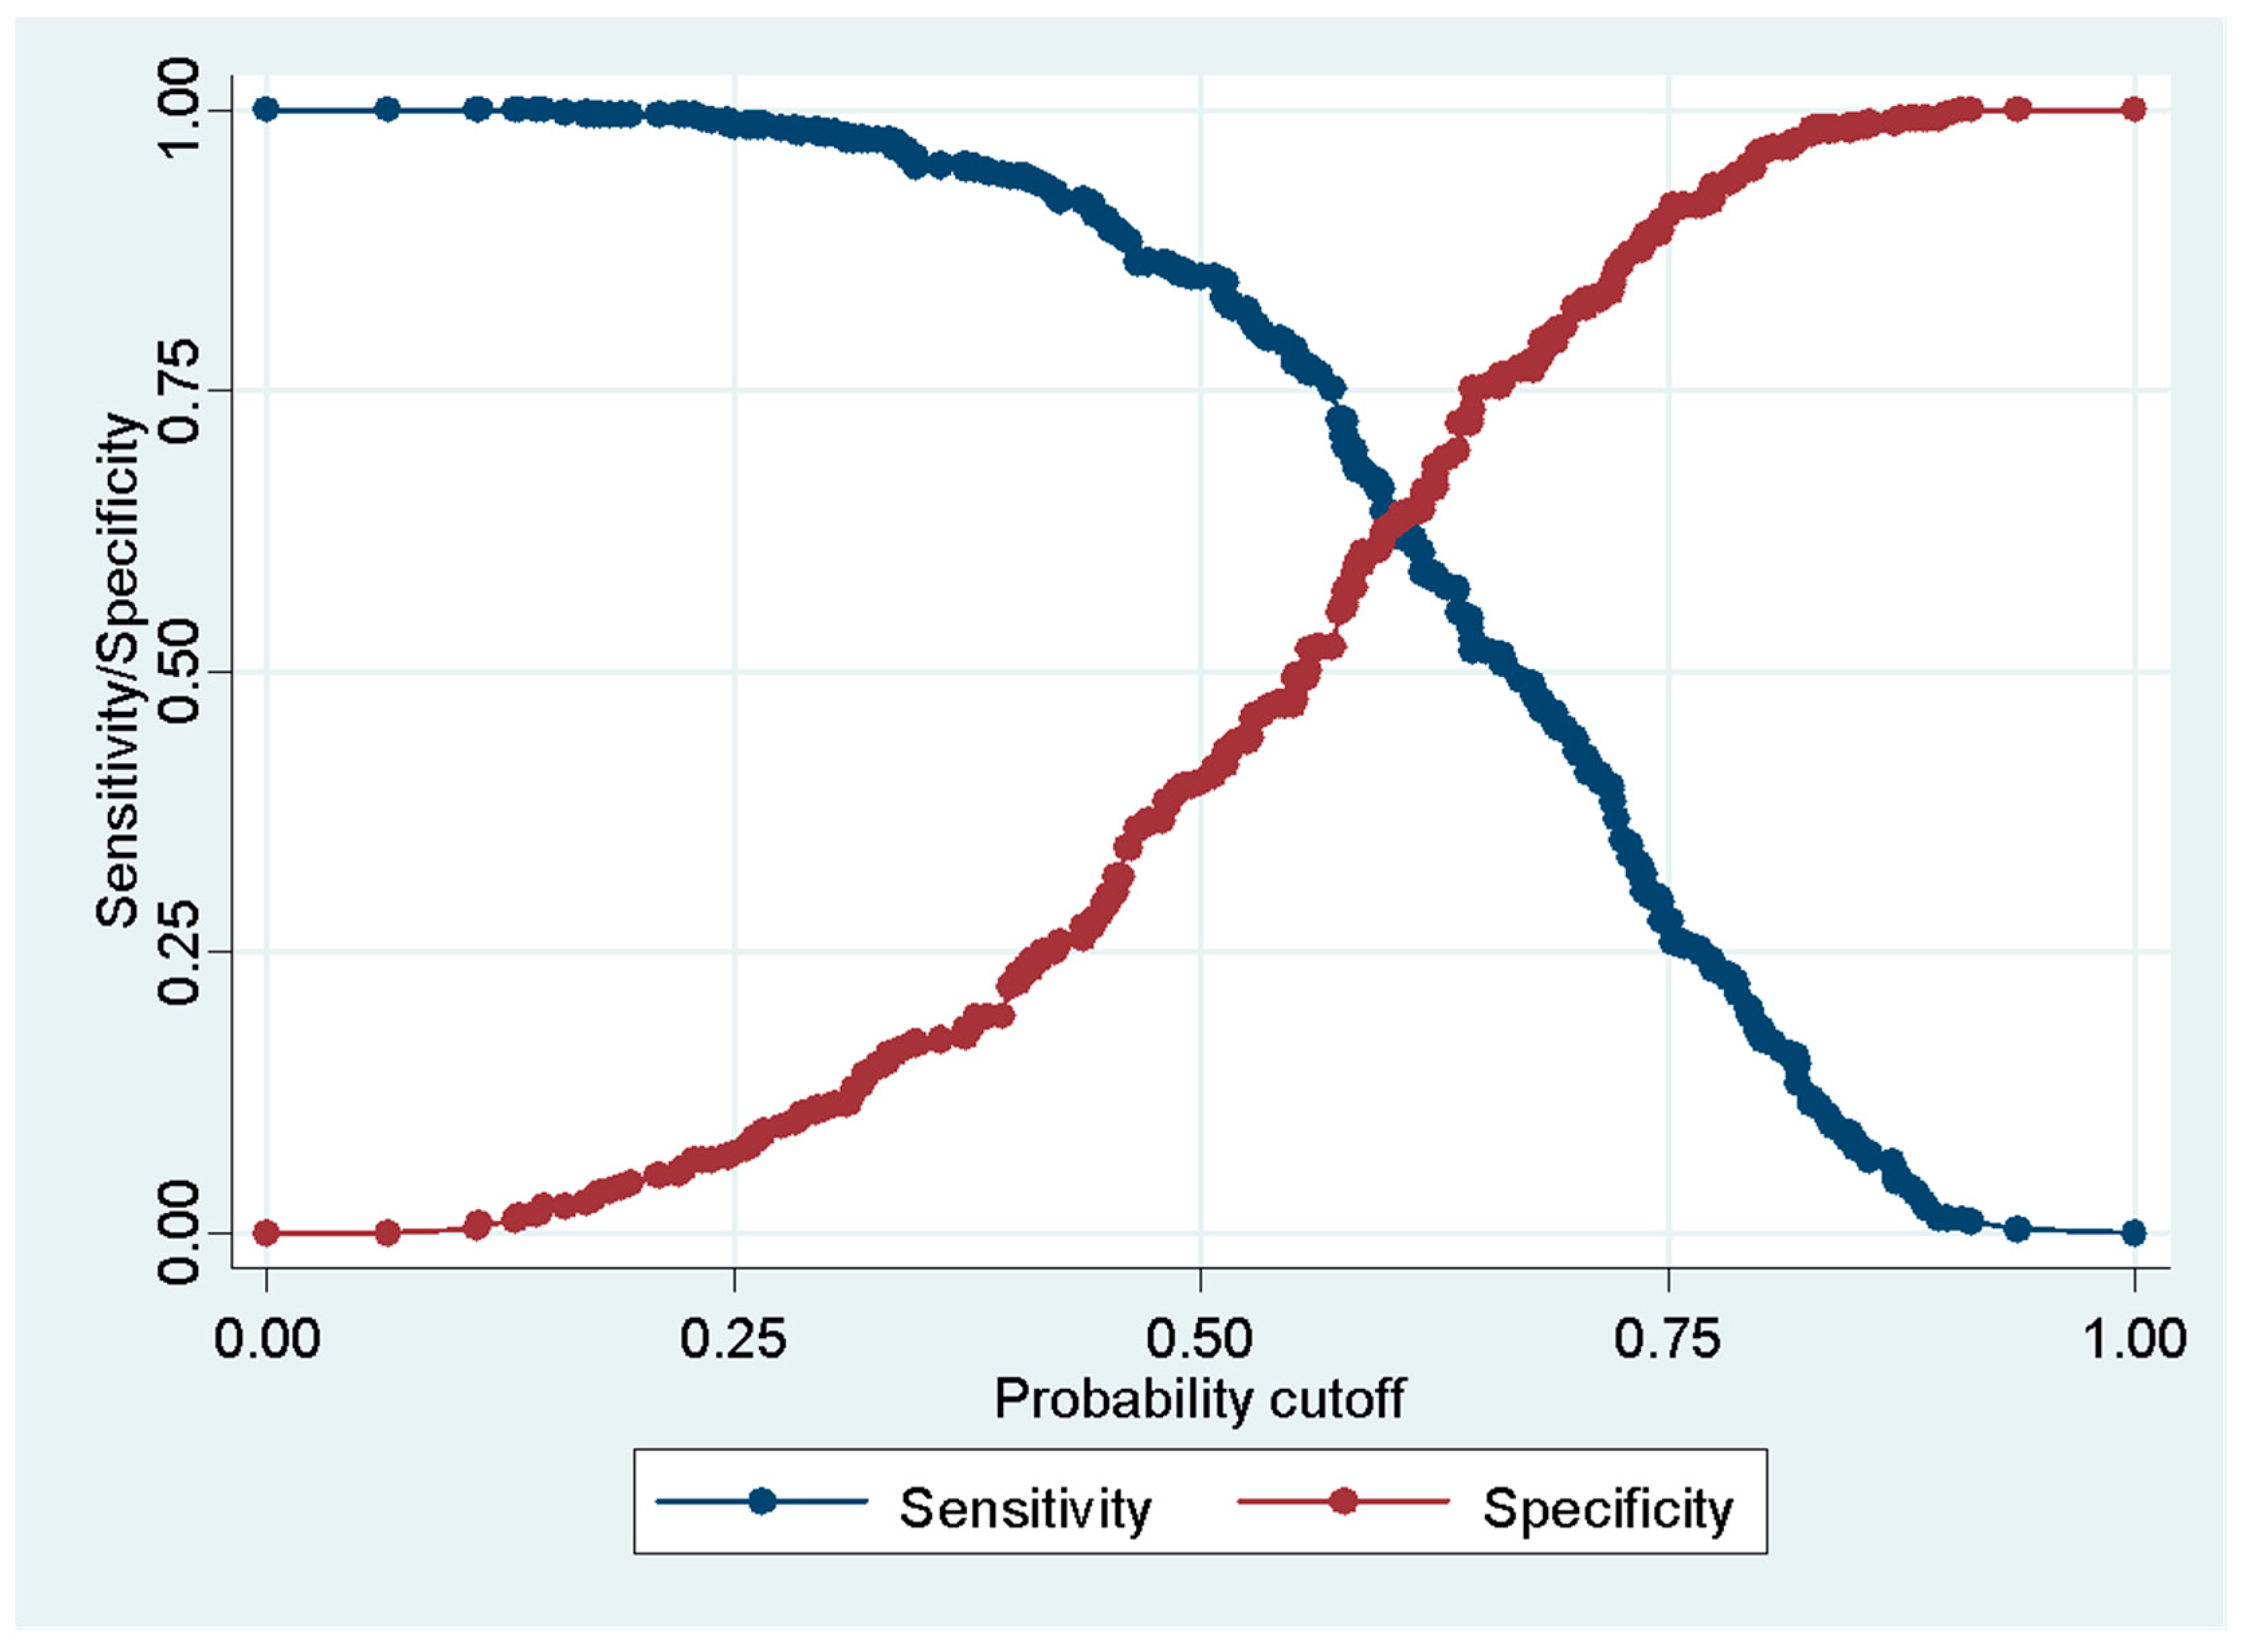
Appendix A.1. The ROC Curve (Receiver Operating Characteristic Curve) shows that the model has a 66% probability of correctly ranking a randomly chosen positive instance higher than a randomly chosen negative instance. This ensures models’ modest predictive strength. The ROC and specificity curves are provided in
Figure A1 and
Figure A2 in the
Appendix A.1. Further, the model is tested for multicollinearity. The Variance Inflated Factor (VIF) test is conducted (refer to
Appendix A.2,
Table A4), and the mean VIF score remains below 5 with no individual variable VIF score exceeding the conventional threshold of 10, signaling no problem of multicollinearity. High VIF variables like bank ac (9.09), dfl (8.93), and pr_convc (6.33) reflect moderate correlation among predictors and also reflect theoretical collinearity between financial literacy proxies. However, these do not bias the estimates or inflate standard errors in logit regression
6.2. Model 2: Factors Affecting Willingness to Shift (WTS) to e-Rupee
The logistic regression model examining the likelihood of willingness to shift to e-Rupee adoption based on income, age, gender, awareness, having a bank account, digital financial literacy, perceived convenience, perceived trust in the operation, and perceived belief in the e-Rupee role in the Indian Financial system is provided in
Table 5.
Table 6 provides the odds ratio of the model. Overall, LR (
χ2) (13) = 95.63, ρ < 0.001, indicating that the predictors jointly explain the dependent variable. The pseudo R
2 value of 0.0949 suggests that approximately 9.4 percent of the variance in the dependent variable can be explained by the model. The significant LR value indicates the fitness of the model.
The predictors like age, having a bank account, e-Rupee awareness, digital financial literacy, perceived convenience, and perceived belief on the e-Rupee role in the future, are found statistically significant. The odds ratio (
Table 6) of e-Rupee awareness is 1.54 (
p = 0.010), indicating that the odds of WTS to e-Rupee would increase by 54% with an increase in e-Rupee awareness. In the case of digital financial literacy, the odds ratio is 1.32 (
p = 0.000), which suggests that, for each unit increase in this scope, the odds of WTS to e-Rupee increase by 32%. Similarly, the perceived convenience and perceived belief in the future of e-Rupee have the odds ratio of 2.41 and 2.66 (
p = 0.000), indicating that for every unit increase in perceived convenience and belief in the future of e-Rupee, the WTS to e-Rupee would increase by 141% and 166%, respectively. In the case of age, compared to the base age group of less than 25 years, people belonging to the higher age group are more WTS to e-Rupee. Further, the odds of WTS to e-Rupee increase with an increase in bank account by 213% (odds ratio is 3.13,
p = 0.010); however, it is significant at a 10% level of significance. Further, though not all the categories of income are showing a significant probability, we can observe that the higher category of income (Y3) has a higher probability of WTS to e-Rupee compared to the lower income category.
The predicted probability (
Table 7) of e-Rupee awareness is 0.10 (
p = 0.010) indicate that compared to the respondents who are aware of e-Rupee, have a higher probability to shift to e-Rupee by 10% than those who are unaware of it. In the case of digital financial literacy, the predicted probability of 0.06 indicates that with every one unit increase in the literacy, the WTS to e-Rupee would increase by 6%. For those who perceive e-Rupee as convenient and believe in its role in the future have the predicted probability of 0.21 and 0.24 (
p = 0.000, respectively, suggesting that WTS to e-Rupee would increase by 21% and 24% for them. One of the interesting findings of the study is related to trust in e-Rupee. The variable is found to be insignificant and negative, indicating that, in the case of India’s CBDC, trust is not a key determinant for adoption.
7. Discussion and Implications
By adopting the blend of TAM and the nudge models for the first time, this paper made a novel contribution by understanding the e-Rupee adoption in India. The behavioral aspect of users, like perceived convenience, perceived trust, and perceived belief in the e-Rupee in the financial system, has been empirically tested using the econometric model. By collecting primary data, the study makes key observations on the e-Rupee adoption. In the study sample (751), it is observed that only a smaller share of respondents (14.2%) primarily use cash, mainly due to its accessibility and familiarity. A majority of respondents (58%) are using UPI and is preferred primarily for its speed, convenience, and record-keeping benefits. This has highlighted the growing comfort of users with digital payment mechanisms, and the influence of ease and incentives in shaping payment behavior. In terms of the income groups, a majority of the lower-income groups are still heavily dependent on cash transactions, whereas the higher-income groups are gradually transitioning towards digital payment modes. This signifies India’s push toward a cashless economy. The study also found that, among the total respondents, though nearly 60% of them are aware of the e-Rupee, only 9% of them use it as their mode of payment. However, when we nudged them with the information, nearly 60% of them were willing to shift to e-Rupee. This forms a key policy implication for the central monetary authority to encourage awareness of the e-Rupee to enhance its adoption.
By adopting the binary logit regression, the study examined the possible impacts on e-Rupee adoption in the country. It is found that income, age, and education positively influence the e-Rupee awareness, and also the willingness to shift to the e-Rupee. In terms of income, the study identified that higher income levels will increase access to information and thereby the awareness about e-Rupee. This suggests that e-Rupee as a payment model holds substantial potential in the emerging economy of India. Further, the digital financial literacy variable is found to have a positive and significant impact on the e-Rupee awareness. This underscores the critical role of public investment in strengthening digital financial literacy to increase e-Rupee awareness and thereby its adoption in the country.
In the second model, the paper relied on the stated preference method to elicit the willingness to shift to the e-Rupee and found that the behavioral variables have a significant influence. By introducing the information about the e-Rupee operation, the study provided an information nudge to the respondents to elicit their WTS to the e-Rupee. This unique blend of nudge theory with stated preference model stands novel in the finance literature. Apart from socio-economic variables like age, income, and digital financial literacy, behavioral constructs like perceived convenience and perceived belief in the e-Rupee as future currency were found to have a positive and significant influence on WTS to the e-Rupee. A key finding of the study is related to the trust factor. The variable has a low mean and a negative and insignificant value. This indicates that there is a very small number of respondents who opted for this option. This clearly shows that there is high credibility and trust in the RBI among the respondents. The sign negative and insignificant value further highlights that RBI, as the supreme monetary authority, holds significant credibility in the Indian Financial System. This forms an important policy insight, as there are many studies in other countries that identified institutional trust as a key deterrent to adoption. However, in our sample, nearly 85% respondents believe that the e-Rupee will play a crucial role in the financial system transformation in the future, and we can argue that people hold trust in the RBI and its initiatives are well taken. Furthermore, though nearly 97% of the respondents have their bank accounts, only 18% of them reported that they have good digital financial literacy. Hence, if the e-Rupee adoption improves, more awareness, especially in digital education, would make the digital currency of India more successful.
In summary, the study findings advance TAM-nudge integration by revealing three context-specific mechanisms. The behavioral constructs, like perceived convenience, show a greater positive response due to the informational nudge. The willingness to shift to the e-Rupee is also significantly associated with its awareness and digital financial literacy. Another key behavioral factor that advances TAM-nudge integration is the trust in the e-Rupee mechanism. These behavioral constructs, in alliance with the nudge information, form a crucial methodological novelty of the study.
8. Limitations of the Study
Though the study has made a novel attempt in examining the e-Rupee adoption under the blend of TAM and nudge theory by using the primary data, there are certain limitations that the study would like to acknowledge. At first, the study adopted a simple random sampling method, which, though it removes the sampling bias, is a quite simple technique of sampling that might average out the sample. Further, there are chances of self-reporting errors in the data collected. Lastly, the generalizability of the results is limited as the study is restricted to one metropolitan city. However, the results can be replicated in other similar metropolitan cities of the country.
9. Conclusions and Policy Suggestions
The majority of the economies today are experimenting with CBDC adoption. India has been a forerunner in introducing digital currency by the name e-Rupee. A wide array of research in CBDC has investigated the macroeconomic effects of CBDC more than the adoption part. One of the key elements in the CBDC adoption is the behavioral aspect. This study has made a novel attempt to adopt the most widely used model, TAM, in the e-Rupee domain with the blend of nudge theory. In addition to this, the study is the first of its kind to use extensive primary data to understand the e-Rupee adoption and the willingness to shift to the e-Rupee for a major metropolitan city of India. Given the pre-existing payment ecosystem, the study stands at a key juncture to provide policy insights to policymakers. Our study suggests that, apart from the technological aspects of the e-Rupee, the behavioral intention of users, especially awareness and digital financial literacy, has a significant impact on the e-Rupee adoption. Further, the study made an innovative attempt to bring the stated preference method and nudge theory to the fintech domain. The willingness to shift to e-Rupee has been examined, and the result has provided key insights to policymakers. For instance, with the general education, a targeted awareness program on the e-Rupee will have a significant positive effect on its adoption. Further, users have given more preference for the behavioral aspects like perceived convenience and perceived ease of use while eliciting their preference towards WTS to the e-Rupee. Lastly, in the case of India, trust in the e-Rupee mechanism highlighted the credibility of the monetary authority. This forms a significant implication on the policy insight to have a more targeted awareness program (information delivery) about the e-Rupee to enhance its willingness to shift.