Abstract
This paper selects 50 listed commercial banks in China from 2012 to 2023 as research samples, and employs the fixed effects model and Hansen’s threshold regression method to systematically examine the impact mechanism and non-linear characteristics of FinTech development on the profitability of commercial banks. The key findings are summarized as follows: (1) FinTech significantly undermines the overall profitability of commercial banks by reshaping the competitive landscape of the industry and intensifying the technology substitution effect. This is primarily reflected in the reduction in traditional interest income and the erosion of market share in intermediary business. (2) Heterogeneity analysis indicates that large state-owned banks and joint-stock banks experience more pronounced negative impacts compared to small and medium-sized banks. (3) Additional research findings reveal a significant single-threshold effect between FinTech and bank profitability, with a critical value of 4.169. When the development level of FinTech surpasses this threshold, its inhibitory effect diminishes substantially, suggesting that after achieving a certain degree of technological integration, commercial banks may partially alleviate external competitive pressures through synergistic effects. This study offers crucial empirical evidence and theoretical support for commercial banks to develop differentiated technology strategies and for regulatory authorities to design dynamically adaptable policy frameworks.
1. Introduction
In recent years, the rapid global development of FinTech has led to profound changes in the financial industry’s ecosystem through innovations such as artificial intelligence, blockchain and cloud computing (Li et al., 2022). This transformation is particularly notable in developing countries. As highlighted in the “FinTech Ecosystem Blue Book 2024”, published by the China Academy of Information and Communications Technology, emerging economies commonly confront challenges including limited access to traditional financial services, rapid mobile internet penetration, and continuous evolution of regulatory frameworks. These conditions have enabled digital banks in countries such as Brazil and Kenya to capture market share through innovative and disruptive business models. In China, the application of FinTech has been increasingly expanded and deepened through the dual impetus of policy support and technological advancement, ranging from mobile payments and robo-advisors to the pilot implementation of digital currencies. These technological advancements have not only spurred the emergence of new financial models but also significantly influenced the operational methods, service efficiency and profit structures of traditional commercial banks (Kayed et al., 2025). Compared to other developing countries, China demonstrates a notably pronounced policy-driven development model, characterized by continuously refined top-level design. The “FinTech Development Plan (2022–2025)” issued by the People’s Bank of China has delineated a clear roadmap for digital transformation, outlining key tasks such as enhancing governance systems, unlocking the value of data elements, and deepening the application of technologies. The 2023 Central Financial Work Conference further underscored the importance of advancing the “five major areas” of sci-tech finance, green finance, inclusive finance, pension finance and digital finance, providing strategic direction for the core applications of FinTech. Meanwhile, the regulatory framework has been continuously optimized. By reinforcing institutional supervision, conduct supervision, functional supervision, penetrative supervision, and continuous supervision, the state ensures comprehensive coverage of all financial activities, thereby effectively guiding the regulatory practices of FinTech. Furthermore, as noted in the “FinTech Ecosystem Blue Book 2024”, while many developing countries remain focused on basic regulatory compliance, China has advanced over 200 FinTech innovation projects into regulatory sandbox testing through its sophisticated implementation of functional and penetrative supervision. In terms of market scale and technological application, China’s FinTech industry has experienced rapid expansion. As reported in the “China Fintech and Digital Finance Development Report 2024”, by the end of 2023, the FinTech market size in China had reached CNY 618.3 billion. Although it still lags behind global leading markets in certain dimensions, China demonstrates a significantly deeper penetration into the banking sector compared to similar economies such as India and Vietnam.
However, Chinese commercial banks are under increasing pressure due to the deepening of interest rate liberalization, heightened industry competition and stricter regulatory requirements (Shen et al., 2023). In conjunction with the disruptive impact of FinTech, these factors have substantially undermined the sustainability of their traditional profit models. Historically, the profit sources of Chinese commercial banks have predominantly depended on the traditional interest margin between deposits and loans (Zhang et al., 2023). With the deepening of interest rate liberalization reform, lending rates on the asset side have progressively decreased, while deposit costs on the liability side have steadily increased. This dynamic has directly squeezed the profit margins of commercial banks (Wu et al., 2023). Simultaneously, the rapid rise in FinTech has substantially disrupted the traditional banking business model. FinTech not only reshapes how customers access financial services but also challenges the traditional bank service model, which is largely reliant on offline branches, to meet the growing demand for online services (Baker et al., 2023). Moreover, commercial banks have historically neglected the long-tail customer segment. In contrast, FinTech companies, leveraging their technological advantages and agile service models, have swiftly penetrated this market segment, engaging in fierce competition with commercial banks (Ma, 2024). By influencing the development of commercial banks’ asset side, liability side, and intermediary businesses, FinTech has further intensified market competition, thereby profoundly impacting the profitability of commercial banks (Song et al., 2023).
As illustrated in Figure 1, the Return on Assets (ROA) of Chinese commercial banks has exhibited a pronounced downward trend over the past decade. Notably, the performance varies across different types of commercial banks. In particular, rural commercial banks have experienced the most significant decline in ROA. This phenomenon is likely attributable to the fact that rural commercial banks primarily serve small and medium-sized cities and rural areas, where the economic development level and residents’ income are relatively low. Consequently, borrowers in these regions tend to have weaker repayment capabilities and face higher credit risks, which imposes a substantial negative impact on ROA risks (W. Wang et al., 2022). In contrast, state-owned large commercial banks and joint-stock banks initially displayed a similar trend. However, the decline in ROA for state-owned large commercial banks was more moderate. It is important to highlight that despite the vigorous development of FinTech by Chinese commercial banks starting around 2016, the ROA of various commercial banks continued to decline during the early stages of FinTech adoption. Nevertheless, in recent years, as FinTech has gradually matured, the rate of decline in commercial banks’ ROA has slowed down. Moreover, some joint-stock commercial banks have even shown signs of ROA recovery.
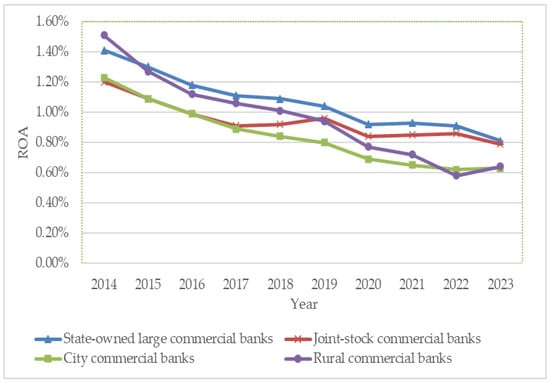
Figure 1.
Return on Asset of China’s Different Types of Banks, 2014–2023. Source: China Banking and Insurance Regulatory Commission (2014–2023).
It is important to emphasize that, within the commercial banking sector, FinTech not only introduces new competitive pressures but also creates significant opportunities for innovation and growth (Tong & Yang, 2025). The rapid advancement of FinTech has substantially broadened the strategic options for commercial banks in terms of business management and operational development. This has driven banks to proactively pursue transformation and innovation, thereby unlocking new potential for profitability enhancement (Hu et al., 2024). Presently, the construction of a digital China has emerged as a critical strategic direction for national development. In this context of digital transformation, major banks are actively advancing the deep integration of FinTech into the banking sector by increasing R&D investment, strengthening the recruitment of technology talent, and enhancing the application of cutting-edge technologies (Lee et al., 2021). It is evident that FinTech exerts a significant “double-edged sword” effect on the profitability of commercial banks. Against this backdrop, clarifying the underlying mechanisms, comprehensive impacts, and heterogeneous effects of FinTech across different types of banks has become a critical research priority requiring in-depth investigation. Further exploration of this issue contributes not only to the theoretical understanding of the interplay between financial innovation, technological disruption, and bank performance, particularly within China’s unique policy and market context, but also enables banks to comprehensively evaluate the opportunities and challenges posed by FinTech, optimize resource allocation, and develop differentiated, stage-based competitive strategies to enhance their core competitiveness. Furthermore, such research provides valuable theoretical insights and practical guidance for regulators seeking to strike a balanced approach between fostering FinTech innovation, mitigating potential risks, and ensuring fair competition within the banking sector. Therefore, examining the impact of FinTech on the profitability of Chinese commercial banks holds significant theoretical and practical implications for understanding the evolution of banking business models (Qi et al., 2021), refining strategic decision-making processes, and strengthening regulatory policy frameworks.
2. Literature Review
“FinTech” is an abbreviation of “Financial Technology”. In recent years, it has gained prominence globally and is now widely applied across various sectors of financial services, effectively becoming synonymous with innovation in this domain. In 2016, the Global Financial Stability Board (FBS) provided an initial definition that has since gained widespread acceptance in academic circles. This definition elucidates how advancements in network information technology drive financial innovation, thereby facilitating enhancements in operational models, products, and services within the financial sector while simultaneously improving the overall quality of financial offerings. Ba and Bai (2016) are widely acknowledged as two pioneers in China who first articulated the concept of FinTech. They emphasized that FinTech facilitates the deep integration of finance and technology through the application of advanced technological tools, thereby more effectively addressing public needs, substantially reducing operational costs, and simultaneously enhancing service efficiency. Furthermore, Yu and Li (2023) expanded on the notion of FinTech as a form of financial transformation propelled by diverse technological innovations, which has been extensively adopted in traditional financial institutions and their operational processes. Such innovations not only redefine financial products, service models, and operational methods, but also significantly improve overall operational efficiency while effectively cutting costs.
Based on an extensive review of the existing literature, the rapid advancement of FinTech has profoundly and transformationally impacted the traditional business models of commercial banks. As a technology-driven form of financial innovation, FinTech has not only substantially enhanced the allocation efficiency of financial resources but also significantly boosted the profitability of financial institutions. As Yu and Yu (2021) stated, their empirical analysis reveals that FinTech positively impacts the profitability of Chinese commercial banks. This effect is particularly pronounced for banks with larger asset scales, as these institutions experience a more substantial increase in profits. Chhaidar et al. (2022) comprehensively examined the interaction between FinTech investment and the overall performance of European banks, with a particular focus on how bank size influences the effectiveness of digital transformation. The findings reveal a significant positive correlation between FinTech adoption and bank profitability, suggesting that higher levels of digitalization can substantially enhance profit margins. Furthermore, the study highlights that larger banks possess greater advantages in leveraging FinTech investments to boost operational efficiency. Consequently, intensifying investment in FinTech has been demonstrated to be a viable and promising strategy for improving bank performance, particularly yielding more pronounced benefits for large banks. Kharrat et al. (2024) investigated the relationship between the level of FinTech development and the performance of both traditional banks and Islamic banks in the Middle East-and-North African region. Their findings demonstrate that FinTech innovation positively contributes to enhancing bank performance, profitability, and stability. In addition, Nugroho and Sugiyanto (2023) explored the influence of FinTech on bank profitability and examined the shifts in profitability as FinTech progressively evolved in Indonesia. Their findings indicate that FinTech innovation in the banking sector has not substantially altered the traditional business model. Rather, it has created new avenues for expanding FinTech services and enhancing bank profitability. According to the research by Y. Wang et al. (2024), a systematic analysis of data from 13 representative listed commercial banks in China between 2011 and 2021 was conducted to explore the impact of FinTech innovation on the sustainable profitability of commercial banks. The findings indicate that financial innovation has significantly enhanced the operational efficiency and profitability of these banks. More specifically, advancements in key areas such as digital payment systems, online banking services and blockchain technology are identified as the primary drivers of this positive transformation.
Nevertheless, several academics argue that FinTech could potentially have adverse effects on commercial banks. Zhao et al. (2022) employed patent data and the FinTech development index to investigate the precise impact of FinTech innovation on the performance of Chinese banks. The results reveal that, in general, FinTech innovation tends to weaken bank profitability and negatively affect asset quality, with this trend being especially pronounced in large state-owned commercial banks. Corbet et al. (2023) constructed a regression model to systematically analyze the impact of FinTech innovation on the profitability of 36 listed banks in China. Their findings indicate a significant inverse relationship between FinTech innovation and bank performance. Further analysis demonstrates that state-owned banks, joint-stock commercial banks, and institutions with longer operating histories are more vulnerable to the adverse effects of FinTech innovation compared to city commercial banks, rural commercial banks, and those with shorter establishment times. Yudaruddin (2023) focused on investigating the impact of FinTech on the operational efficiency of Islamic banks and traditional banks in Indonesia. The research findings suggest that the rise in FinTech start-ups has exerted a certain degree of negative pressure on the operational performance of traditional banks. Yin and Peng (2024) selected 42 A-share listed banks as research subjects to investigate the impact of FinTech on the profitability of commercial banks. Using the period from 2011 to 2022 as the sample timeframe, they constructed an unbalanced panel dataset for empirical analysis. Their findings indicate that the advancement of FinTech has substantially enhanced the operational efficiency and service quality of commercial banks. Nevertheless, it also exerts a certain restraining effect on their profitability.
In addition, some scholars have also highlighted that the relationship between FinTech and commercial banks is not merely a linear correlation but instead exhibits a complex non-linear dynamic. Xiong et al. (2021) investigated the impact mechanism through which FinTech influences the operational performance of commercial banks. The findings show that, overall, the crowding-out effect of FinTech on commercial banks outweighs its technology spillover effect, thereby significantly diminishing the operational performance of banks. By employing a piecewise regression model to further analyze the dynamic relationship between FinTech and bank performance, the results reveal that as the development level of FinTech advances, the crowding-out effect gradually diminishes, while the technology spillover effect progressively intensifies. Consequently, a non-linear relationship exists between FinTech and the operational performance of commercial banks, characterized by an initial inhibitory phase followed by a promotional phase. Pham et al. (2023) selected 57 banks as their research sample and integrated FinTech financing data from Malaysia, the Philippines, Thailand, Indonesia, and Vietnam spanning from 2017 to 2021. They conducted a systematic analysis of the impact of FinTech financing on bank profitability. The results demonstrate that while the growth of FinTech financing exerts a certain negative influence on bank profitability in the short term, its lagged effect substantially enhances bank profitability over time. According to the research by Bu and Tang (2024), an empirical analysis using a two-way fixed effects model was carried out to examine how FinTech development influences the operating performance of commercial banks. The findings indicate that, from a dynamic perspective, there exists a significantly U-shaped relationship between FinTech development and the performance of commercial banks.
At present, significant advancements have been achieved in the research on the impact of FinTech on commercial banks. However, several limitations remain that require further investigation. These gaps offer valuable theoretical potential and practical foundations for the development and expansion of this study. In the existing literature on the impact of FinTech on commercial bank profitability, the focus has predominantly centered on linear relationships, with limited attention given to potential non-linear effects, particularly the structural changes that may occur when FinTech development reaches a critical threshold. To address this gap, this study departs from the conventional linear analytical framework and employs a threshold effect regression model to empirically examine the presence of key threshold values in FinTech development. It further investigates the dynamic shifts in the direction and magnitude of FinTech’s impact on bank profitability as these thresholds are crossed, thereby providing deeper insight into the complex non-linear relationship and identifying pivotal turning points between FinTech advancement and banking performance. Additionally, regarding the selection of FinTech indicators, most existing studies predominantly rely on the Digital Inclusive Finance Index developed by Peking University and directly utilize the data from the provinces where the bank headquarters are located for analysis. This paper addresses this limitation by introducing an improvement. Specifically, it incorporates the number of bank branches in each province as a weighting factor into the analytical framework, thereby recalculating the provincial Digital Inclusive Finance Index. This adjustment enables a more precise depiction of the FinTech environment in which commercial banks operate. Therefore, this study seeks to enhance the precision of measuring the shaping of commercial banks by the FinTech environment and to thoroughly examine the non-linear dynamic pathways through which this environment influences profitability. This provides more detailed and in-depth empirical evidence for understanding the complexity of the interaction between FinTech and commercial banks.
3. Mechanism and Research Hypotheses
In terms of the impact of FinTech on the profitability of commercial banks, FinTech not only intensifies external competitive pressure but also systematically affects their traditional profit models through technological substitution. This mechanism can be examined in greater detail across multiple dimensions.
FinTech platforms, by leveraging their technological advantages, have exerted a dual impact on the core businesses of banks (Wei & Yang, 2024). On the liability side, internet payment systems and digital currencies, through scenario integration and data-driven strategies, have significantly diverted bank deposits and increased the cost of funds (Chen et al., 2019; Yin & Peng, 2024). For instance, third-party payment platforms such as Alipay and WeChat Pay, capitalizing on high-frequency application scenarios like e-commerce transactions and social interactions, have transformed traditional demand deposits in banks into low-interest reserve funds or money market funds. This has compelled banks to raise interest rates in order to maintain the scale of their liabilities. Meanwhile, blockchain-supported digital currencies, through their peer-to-peer transaction mechanisms, have diminished the intermediary role of banks in money creation, further reducing opportunities for acquiring low-cost funds. On the asset side, FinTech companies, utilizing big data credit assessment and algorithmic pricing technologies, have expanded the service boundaries of traditional banks in catering to small and micro enterprises as well as individual customers, thereby weakening the dominant position of banks in credit negotiation (Zhang, 2023). According to the financial intermediation theory, the primary function of banks is to reduce information asymmetry and lower transaction costs. However, FinTech, through technological spillover effects (such as big data risk control and distributed ledger technology), has lowered market entry barriers and gradually eroded the traditional advantages of banks in the deposit-loan interest rate spread.
In addition, the impact of FinTech on banks’ non-interest income is particularly pronounced (Bu & Tang, 2024). The standardized and disintermediated nature of robo-advisors and blockchain technology has gradually eroded banks’ traditional dominance in areas such as wealth management and payment settlement. For example, FinTech companies like Ant Group have attracted substantial funds from long-tail users by launching standardized wealth management products such as Yu’E Bao (Li et al., 2022). Additionally, through blockchain technology, these companies have enabled disintermediated cross-border payment and settlement operations, directly compressing banks’ revenue streams in wealth management fees, custody fees, and cross-border settlement services.
Meanwhile, to counter the competitive pressure posed by FinTech, banks are compelled to invest heavily in developing AI-based risk control systems, constructing cloud computing infrastructure, and enhancing data governance frameworks. However, it is challenging for individual banking institutions to achieve the scale advantages possessed by internet platforms or to offset high technology investment costs through efficiency improvements in the short term.
Therefore, the impact of FinTech on the profitability of commercial banks is not only manifested in direct operational aspects, such as the narrowing of the deposit-loan interest rate spread and the decline in non-interest income, but also through the “cost black hole” effect caused by technological investment, which has fundamentally reshaped the competitive dynamics and profit model of the banking industry. Based on the above analysis, this paper proposes the following hypothesis:
H1.
Overall, the development of FinTech will have a significant negative impact on the profitability of Chinese commercial banks.
At present, Chinese commercial banks can be categorized into four major types based on their scale and business scope: large state-owned commercial banks, joint-stock commercial banks, city commercial banks, and rural commercial banks. These four types of banks exhibit significant differences in business philosophy, business structure, resource allocation, regional market positioning, and policy support. Based on the core principles of the resource-based view and financial intermediary theory, bank profitability is fundamentally tied to its unique resource endowments, core competencies, and strategic positioning within a given market structure. As a disruptive external force and a critical technological enabler, FinTech influences bank profitability through multiple pathways, such as reshaping cost structures, generating new revenue streams, enhancing risk management efficiency, and intensifying market competition (Li et al., 2022). However, the magnitude and direction of these effects are significantly moderated by both internal resource conditions and external market environments, leading to substantial heterogeneity across institutions. Specifically, while large state-owned and joint-stock banks possess advantages in capital strength and operational scale, their heavy reliance on traditional interest income, complex organizational structures, and rigid decision-making processes may hinder their adaptability to rapid FinTech-driven changes, rendering their core businesses more susceptible to competitive displacement (Bu & Tang, 2024). In contrast, city commercial banks and rural commercial banks, despite having relatively limited resource endowments, often exhibit greater agility and responsiveness due to their localized focus, streamlined decision-making, and lighter institutional legacies. These characteristics may enable them to better leverage FinTech for service innovation, regional market expansion, and targeted risk management. Consequently, theoretical analysis suggests that the impact of FinTech on bank profitability is systematically differentiated by variations in resource configuration, business model dependency, transformation capacity, and organizational inertia across bank types. Based on the aforementioned analysis, this paper puts forward the following research hypothesis:
H2.
The impact of FinTech on the profitability of different types of commercial banks varies significantly.
4. Materials and Methods
4.1. Model
In order to investigate the impact of FinTech development on the profitability of commercial banks, this paper selects balanced panel data from 50 listed banks for empirical analysis. Given that incorporating time fixed effects might dilute the influence of macro-control variables, and in line with the research hypotheses proposed in this paper, the following individual fixed effects model is constructed:
where i denotes an individual bank; t represents time; corresponds to the individual fixed effect; signifies the parameter to be estimated within the model; and stands for the random disturbance term.
4.2. Variables
Profitability serves as a critical metric for assessing the performance of commercial banks. Currently, the academic community predominantly employs two approaches to evaluate profitability: return on assets (ROA) and return on equity (ROE). Specifically, ROA is defined as the ratio of net profit to average total assets, whereas ROE represents the ratio of net profit to average net assets. Higher values of these ratios generally indicate stronger profitability for commercial banks. In this study, drawing on the research by Song et al. (2023), Bu and Tang (2024), Wei and Yang (2024), and Yin and Peng (2024), we opt to use ROA as the primary indicator for measuring profitability. This decision aligns with scholarly observations that while ROE effectively captures the profit contribution of net assets, it overlooks the pivotal role of credit assets in the operational dynamics of commercial banks (Song et al., 2023; Wei & Yang, 2024).
Regarding the core explanatory variable of the FinTech development level, numerous scholars currently employ two primary measurement approaches. The first approach leverages text mining technology to construct a FinTech index through steps such as text dimensionality reduction and factor analysis. Nevertheless, due to the subjectivity in keyword selection and the dynamic nature of these keywords, this method may introduce certain fluctuations in the index results. The second approach utilizes the provincial Digital Inclusive Finance Index jointly developed by the Peking University Digital Finance Research Center and the Ant Financial Research Institute as an alternative indicator. Given the continuity, authority, and wide applicability of these data, this study draws on the research of scholars such as Lv et al. (2022), Song et al. (2023), and Bu and Tang (2024), ultimately selecting the Peking University Digital Inclusive Finance Index as the core indicator for measuring the development level of FinTech. It is important to note that the core business activities of banks primarily occur in their branches, which are directly influenced by FinTech. Therefore, depending exclusively on the Inclusive Finance Index of the city where the headquarters is located may result in an underestimation of the actual disparities in FinTech application among sample banks. To more accurately capture the characteristics of the FinTech environment in which banks operate, this paper introduces the number of bank branches in each province as a weighting factor and applies a weighted adjustment to the provincial Digital Inclusive Finance Index.
When selecting control variables, this paper conducted an analysis from three dimensions: macro, industry, and micro. At the macro level, the growth rate of gross domestic product (GGDP) is chosen as a key influencing factor. GGDP indirectly affects credit demand and asset quality, thereby having a profound impact on the profitability of commercial banks. Generally, the profit level of commercial banks is positively correlated with the overall trend of economic development. At the industry level, the market concentration ratio (CR4), specifically represented by the proportion of the assets of the four major banks in China in the total assets of the banking industry, is selected as an important influencing factor. A higher ratio indicates that commercial banks have a stronger competitive edge in terms of asset size, which enhances their ability to withstand risks. At the micro level, this paper selects multiple indicators for analysis, including the net interest margin (NIM), the cost-to-income ratio (CIR), the capital adequacy ratio (CAR), and the non-interest income ratio (NIIR). The NIM refers to the ratio of net interest income to the average scale of interest-earning assets, reflecting the bank’s ability to generate net interest income through deposit and loan businesses. A higher NIM typically signifies stronger profitability. The CIR measures the proportion of business and management expenses to operating income. A lower ratio indicates higher operational efficiency and cost control ability, further enhancing profitability. The CAR reflects the ratio of net capital to risk-weighted assets and serves as a critical indicator for assessing the bank’s risk-bearing capacity. Appropriately increasing the CAR can enhance market confidence and expand credit lending capacity. The NIIR is defined as the ratio of non-interest income, including net fees and commissions income as well as investment income to total revenue. This metric reflects the degree of diversification in a bank’s income structure. A higher NIIR indicates that banks are less reliant on traditional interest income and possess an enhanced capacity to withstand interest rate risks. Descriptions of the variables are shown in Table 1.

Table 1.
Descriptions of Variables.
In addition, in the robustness testing step, we further incorporated control variables such as the asset/liability ratio (ALR) and bank competitiveness (measured by the Lerner Index). The ALR represents the proportion of funds sourced from liabilities relative to a bank’s total assets, calculated as total liabilities divided by total assets. A higher ALR implies that a bank can utilize more external financing to expand its interest-bearing assets, thereby potentially enhancing net interest income. However, this may also expose the bank to risks such as deteriorating asset quality and increased liquidity risk. The Lerner Index functions as a key metric for evaluating the degree of market power within the banking sector, illustrating the external competitive landscape faced by firms. It is calculated as the ratio of the difference between operating revenue and operating costs to operating revenue (Peress, 2010; Datta et al., 2011). A higher Lerner Index value indicates a less competitive market structure, implying greater market power for firms.
4.3. Data
On 18 May 2011, the People’s Bank of China granted payment licenses to 27 third-party payment institutions, signifying the formal initiation of the integration between the internet and the financial sector. This action also marked the inclusion of third-party payment services within the national regulatory framework (Tang et al., 2024). Given that the Digital Inclusive Finance Index for 2024 has not yet been released by Peking University, this study employs the balanced panel data of 50 listed banks from 2012 to 2023 for research. The relevant financial data are mainly obtained from the CSMAR database, while missing figures are supplemented and adjusted by referring to the annual reports of each bank. The index of FinTech data is provided by the Digital Finance Research Center of Peking University, while the macroeconomic data are obtained from the official website of the National Bureau of Statistics. To mitigate the influence of extreme values, this paper applies a 1% winsorization to all continuous variables at both tails.
5. Results and Discussion
5.1. Descriptive Statistics
Table 2 displays the descriptive statistical results of the variables. The mean of ROA is 0.916, while the median is 0.910. The proximity between the two suggests that the distribution of ROA is relatively symmetric. The standard deviation of ROA is 0.274, indicating moderate variation in profitability among the sample banks, with overall fluctuations remaining relatively small. For the level of FinTech development, the mean is 2.890, the median is 2.977, and the standard deviation is 0.971. The relatively high standard deviation highlights significant heterogeneity in FinTech adoption across the sample. Concerning the control variables, GGDP, CIR, and NIIR exhibit large standard deviations and wide ranges between their maximum and minimum values, reflecting substantial variability among the sample banks in these dimensions. Conversely, NIM, CAR, CR4, Lerner, and ALR demonstrate smaller standard deviations and narrower ranges, suggesting stability or moderate differences in these variables.
Table 2.
Descriptive Statistics for Variables.
Figure 2 reveals the relationship between the development level of FinTech and the profitability of commercial banks. Using the quantile method, this paper categorizes the development level of FinTech into ten groups and calculates the mean of ROA of banks in each group. As shown in the figure, as the regional FinTech development level increases gradually, the profitability of banks exhibits a trend of first declining and then rising. Notably, when the FinTech development level reaches or exceeds the 90th percentile, the ROA indicator for banks rebounds significantly, indicating a marked improvement in profitability. This finding suggests that once FinTech development enters a relatively advanced stage, it may positively enhance the operational performance of commercial banks.
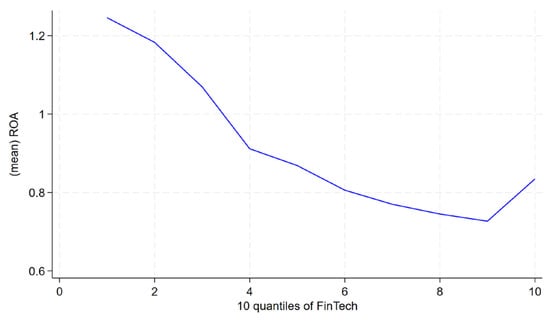
Figure 2.
The Development Level of FinTech and Profitability.
5.2. Correlation Analysis and Multicollinearity Test
To examine whether a correlation exists among the variables, this study employs the Pearson correlation coefficient for quantitative analysis and assesses the multicollinearity issue using the Variance Inflation Factor (VIF). The detailed results are shown in Table 3 and Table 4. An in-depth analysis of the correlation matrix reveals that the Pearson correlation coefficients between all variables do not exceed 0.8. Notably, the correlation coefficient between ROA and FinTech is −0.588, which preliminarily supports the hypothesis that FinTech may negatively affect the profitability of traditional banks. Furthermore, the VIF test results indicate that all VIF values are below 10, thereby confirming the absence of significant multicollinearity in the constructed regression model.
Table 3.
Correlation Matrix.
Table 4.
VIF Test.
5.3. The Results of Basic Regression
In the empirical analysis, this paper sequentially employs the Pooled Ordinary Least Squares (POLS) model, the Random Effects (RE) model, and the fixed effects (FE) model for estimation. The optimal model specification is determined through a series of rigorous statistical tests. The Breusch–Pagan Lagrangian Multiplier (BPLM) test result with p = 0.0000 strongly rejects the null hypothesis, suggesting that the RE model outperforms the POLS model. Furthermore, the Hausman test result with p = 0.0001 clearly rejects the null hypothesis, thereby confirming the suitability of the FE model. Additionally, the F-test with a result of p = 0.0000 demonstrates that the individual fixed effects are jointly significant, statistically validating the necessity of the FE model. Based on these test results, the FE model is ultimately chosen as the benchmark estimation method.
The regression results from the FE model indicate that FinTech exerts a significantly negative impact on ROA, with a coefficient of −0.058 as shown in Table 5, thereby validating Hypothesis 1. Among the control variables, the coefficients of GGDP, NIM, CAR, NIIR, and CR4 are all positive, suggesting that these factors significantly enhance the profitability of commercial banks. Notably, the coefficient of the NIM is 0.187, underscoring the continued importance of traditional interest income as a core driver of bank profits. It is also worth highlighting that while the NIIR exhibits a negative correlation in the correlation analysis, it demonstrates a significant positive effect in the FE model after controlling for bank-specific characteristics. This reversal in sign implies that digital transformation ultimately enhances banks’ profitability over the long term, providing robust empirical support for the diversification of banking operations. Additionally, the coefficient of CIR is negative, indicating that a higher CIR weakens the profitability of commercial banks, thus confirming the constraining influence of operational efficiency on bank profits.
Table 5.
The Regression Analysis Results.
5.4. Heterogeneity Analysis
This paper classifies the samples by the types of commercial banks to conduct heterogeneity tests, thereby investigating the differences in how the development of FinTech affects the profitability of these banks. In this study, commercial banks are classified according to their business geographical scopes into two categories: country banks and local banks. Country banks include large state-owned commercial banks and joint-stock banks, whereas local banks consist of urban commercial banks and rural commercial banks.
Overall, the penetration of FinTech has exerted a restraining effect on the performance of banks. However, the extent of its impact varies significantly across different types of banks. As shown in Table 6, in the case of country banks, the FinTech coefficient is significantly −0.094, whereas for local banks, it is −0.044. Since the trends of the regression coefficients in the two groups are the same, the Chow Test is employed to determine the differences in coefficients between the groups. The test yields a Chow statistic of 6.510, with a p-value of 0.000, indicating significant differences between the groups. A comparison of the regression coefficients reveals that the negative impact of FinTech on the profitability of country banks is more pronounced than that on local banks. Furthermore, as shown in the marginal effect plot in Figure 3, for every one-unit increase in FinTech development, the decline in ROA for the country bank group is substantially greater than that for the local bank group. Therefore, the grouping results indicate that despite having a relative advantage in terms of capital adequacy ratio and business diversification, large state-owned banks and joint-stock banks still exhibit a high degree of reliance on traditional interest margin businesses. In the context of the rapid advancement of FinTech, these banks face particularly significant pressure regarding performance decline. Furthermore, given the massive scale of their traditional operations and the relatively slow progress of digital transformation, such institutions have experienced more pronounced negative effects. In contrast, small and medium-sized banks, characterized by their local roots and relatively flexible mechanisms, exhibit greater resilience. Consequently, the adverse effects of FinTech on these smaller banks are considerably less severe compared to those on larger banks. In conclusion, the impact of FinTech on the profitability of different types of banks exhibits significant heterogeneity, thereby validating the validity of Hypothesis 2.
Table 6.
Heterogeneity Regression Analysis Results.
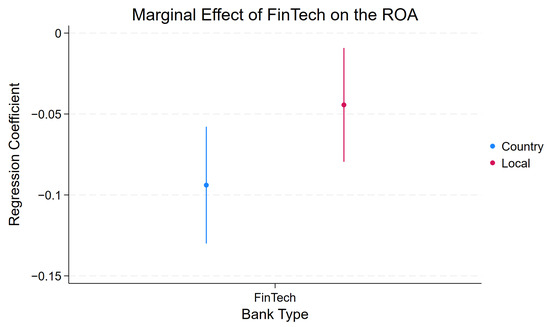
Figure 3.
The Graph of the Marginal Effect of FinTech on the ROA.
5.5. Robustness Tests
To test the robustness of the regression results and address potential endogeneity issues in the model, this paper draws on the existing literature (Xiong et al., 2021; Bu & Tang, 2024) and re-estimates the model by substituting the one-period lag value of FinTech development (L.FinTech) for its current value. This approach effectively mitigates reverse causality concerns, as current bank profitability cannot influence the prior period’s regional FinTech development level. Table 7 presents the re-estimated regression results. The core explanatory variable remains significantly negatively correlated with ROA, while the coefficients of other control variables exhibit magnitudes and signs consistent with the initial findings. These results further substantiate the stability and reliability of the conclusions.
Table 7.
Regression Results of Endogeneity Test.
To address the potential concern of omitted variable bias, this paper expands upon the initial model by including extra control variables ALR and Lerner. The results are presented in Table 8. The empirical analysis demonstrates that the negative effect of FinTech on ROA is highly robust. Furthermore, the conclusion remains consistent even after model expansion, reflecting strong universality. Specifically, a one-unit increase in the ALR significantly enhances ROA by 0.036, further validating the critical supporting role of optimized credit resource allocation in enhancing banks’ profitability. Meanwhile, a one-unit increase in the Lerner Index can significantly boost ROA by 0.532, fully emphasizing the strategic importance of market power as a key competitive advantage in the face of technological shocks. Additionally, the significance and sign direction of other control variables remain largely unchanged, indicating the stability and reliability of the model results.
Table 8.
Robustness Test Results of Adding Control Variables.
6. Further Analysis
The empirical analysis presented above has verified the two hypotheses proposed in this paper. Nevertheless, the equilibrium point regarding the impact of FinTech on the profitability of commercial banks and its underlying mechanism warrant further in-depth exploration. Based on the aforementioned panel data, this study employs the panel data threshold regression method to delve deeper into the equilibrium point of FinTech’s influence on the profitability of commercial banks. Furthermore, by integrating Equation (1), the following econometric model is constructed:
where FinTech is used as the threshold variable, \delta is the estimated threshold value, and the other symbols are consistent with those in the benchmark regression model mentioned above. The specific results of the threshold effect are shown in Table 9 and Figure 3.
Table 9.
Results of the Threshold Effect Test.
The empirical results indicate that the p-value for the single threshold is 0.000, with a corresponding F-value of 72.800, which demonstrates an extremely high level of statistical significance. In contrast, the p-value for the double threshold is 0.090, with a corresponding F-value of 18.240. Given that the p-value exceeds 0.05 and does not pass the significance test, it can be concluded that there exists a significant non-linear threshold characteristic in the relationship between variables, specifically manifesting as a single-threshold effect. The estimated value of this threshold is 4.169. This robust statistical evidence suggests that when the FinTech index surpasses this critical threshold of 4.169, the internal mechanism among the research variables undergoes a structural change. This threshold effectively partitions the sample into two distinct intervals, indicating essential differences in either the direction or intensity of the influence exerted by core variables on the explained variables before and after the threshold. Furthermore, as shown in Figure 4, the threshold value can be observed more intuitively, with its corresponding 95% confidence interval being [4.143, 4.219].
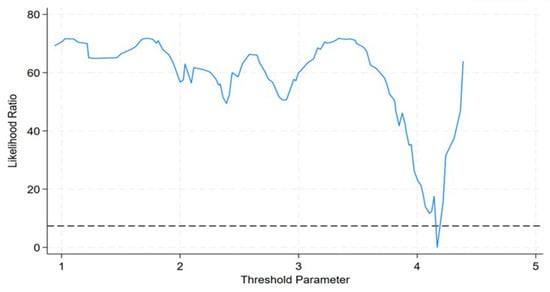
Figure 4.
The Graph of the Likelihood Ratio Function with a Single Threshold.
Table 10 presents the findings from the non-linear regression analysis on the relationship between FinTech development and ROA. All coefficients of variables are significant at the 1% significance level. When the development level of FinTech surpasses the critical threshold of 4.169, its inhibitory effect on bank profitability exhibits a structurally weakening trend. Specifically, during the stage of relatively low FinTech development (FinTech ≤ 4.169), the coefficient is −0.109, indicating a relatively substantial negative impact on bank profitability. This phenomenon demonstrates that in the early stages of technological emergence, FinTech significantly compresses the profit margins of traditional banking through customer diversion and intensified market competition. However, once the development level of FinTech exceeds this threshold (FinTech > 4.169), while its negative influence persists, the coefficient decreases to −0.057, reflecting a markedly reduced inhibitory effect. The determination of this threshold provides a practical decision-making basis for commercial banks to adjust their strategies. When the FinTech index approaches 3.8 (with a 10% buffer range), banks should implement corresponding technological response strategies: large commercial banks may increase technology investment, while small and medium-sized banks should prioritize the embedding of localized scenarios to mitigate external shocks. According to the “Fintech Ecosystem Blue Book 2024” released by the China Academy of Information and Communications Technology, during the early stage of FinTech development, banks can adopt a defensive strategy, such as the China Merchants Bank, by connecting to third-party payment traffic via an open API platform, thereby converting payment diversion into intermediary business income. In contrast, during the advanced stage, banks may follow China Construction Bank’s proactive innovation model by piloting “AI Customer Managers”, which has led to a 40% reduction in per-customer operating costs. This threshold also signals the maturity of regulatory sandbox programs, enabling banks to collaborate with FinTech firms on joint innovation projects under a penetration-based regulatory framework to achieve risk-controlled technology integration. The mechanism reflects a dynamic evolutionary process from technological disruption to adaptive response: initial profit pressures drive increased digital investment, while post-threshold recovery stems from the benefits generated by technological convergence.
Table 10.
Results of the Non-linear Regression Analysis between FinTech and ROA.
7. Conclusions and Suggestions
7.1. Conclusions
This paper selects 50 listed commercial banks as research objects and uses the period from 2012 to 2023 as the sample interval. A fixed effects model is employed to investigate the relationship between FinTech and the profitability of Chinese commercial banks. The findings indicate that, in general, FinTech has intensified external competitive pressures on commercial banks. Furthermore, through the technological substitution effect, it has impacted the traditional profit model, thereby partially restraining the improvement of commercial banks’ profitability. Additionally, by conducting heterogeneity analysis across different types of banks, it is observed that the adverse effects of FinTech are particularly pronounced for large state-owned banks and joint-stock commercial banks. Moreover, this paper utilizes a threshold model to confirm the existence of a non-linear relationship between FinTech and the profitability of commercial banks. When the development level of FinTech surpasses the critical threshold of 4.169, its inhibitory impact on the profitability of commercial banks is significantly mitigated.
7.2. Suggestions for Chinese Commercial Banks to Develop FinTech
7.2.1. The Government Should Guide the Integration of Finance and Technology
In order to facilitate the healthy development of FinTech, the government should implement multi-faceted measures to guide commercial banks in actively adapting to digital transformation. Firstly, the government could mandate that commercial banks regularly disclose detailed data regarding technology investment, such as key indicators like the proportion of digital R&D expenses and the coverage rate of intelligent risk control, and integrate these metrics into the regulatory rating system. This would incentivize banks to more proactively embrace FinTech. Additionally, commercial banks should incorporate FinTech-related risks into their stress testing frameworks and periodically submit comprehensive risk assessment reports to regulatory authorities. Simultaneously, innovative pilot projects should be encouraged. For instance, by leveraging the “regulatory sandbox” mechanism, commercial banks can test FinTech applications within a controlled environment, gaining valuable experience through a trial-and-error process and accelerating the transformation and upgrading of traditional business models.
Secondly, the government can introduce differentiated regulatory policies to refine the industry competition environment. By considering the distinct characteristics and competitive pressures faced by large state-owned banks, joint-stock banks, and small and medium-sized banks, tailored regulatory frameworks should be established. For instance, large banks could be required to enhance technological innovation, thereby preventing them from leveraging their market-dominant positions to squeeze the survival space of smaller institutions. Meanwhile, small and medium-sized banks could receive specialized technical support and subsidies, encouraging them to differentiate themselves through regionalized and distinctive services, thus avoiding homogenized competition. Additionally, it is crucial to intensify oversight of potential data monopolies and traffic monopolies between large FinTech platforms and commercial banks, ensuring that technological barriers do not lead to market imbalances.
In addition, the government should promote the phased implementation of relevant policies. In the early stage, priority should be given to risk prevention, with strict control over the disorderly expansion of FinTech. During the intermediate stage, the government should encourage banks to increase their technological investment via measures such as tax incentives and special-purpose bonds. In the later stage, government intervention should be gradually minimized to allow market mechanisms to take the lead, thereby achieving natural selection in the financial sector. Simultaneously, based on the research conclusions of the threshold model, an early warning threshold for FinTech development should be established. When a region’s FinTech index approaches 4.1691, timely policies should be implemented to guide resources toward underdeveloped areas, such as inclusive finance and green finance, thus preventing systemic risks arising from excessive competition.
7.2.2. Commercial Banks Should Facilitate Deep Integration with FinTech
Firstly, commercial banks need to accelerate the digital transformation process and enhance technological empowerment through ecological collaboration. Commercial banks should proactively embrace FinTech by increasing R&D investment to strengthen independent innovation capabilities and deepening strategic cooperation with FinTech companies to compensate for internal limitations through external technical support. By constructing an intelligent risk control system, optimizing online service processes, and deploying open banking platforms, digital technologies can be seamlessly integrated into the business chain, thereby enhancing operational efficiency, improving customer experience, and mitigating the impact of technological substitution on the traditional profit model. Additionally, large state-owned and joint-stock commercial banks should fully leverage their resources and scale advantages to take the lead in building a comprehensive financial ecosystem. This involves integrating scenario-based services, data resources, and multi-channel strategies to enhance customer retention and comprehensive service capabilities, thus enabling them to better adapt to the increasingly competitive market environment.
Secondly, commercial banks must facilitate the optimization of the business structure and foster diversified profit growth points. Commercial banks should progressively decrease their reliance on traditional interest margins from deposits and loans. By expanding into high-value-added sectors such as intermediary services, wealth management, and cross-border finance, they can steadily enhance the proportion of non-interest income. In response to intensifying competitive pressure from FinTech, banks can explore differentiated pricing strategies and innovative product designs. For instance, they can offer tailored and inclusive financial solutions for small and micro enterprises as well as individual customers. Simultaneously, they should unlock the potential of data assets and develop value-added services based on advanced data analytics to establish new profit pillars. For medium and small-sized banks, it is crucial to leverage regional characteristics and specialized fields, utilizing local service advantages to avoid direct competition with large banks and achieve a sustainable differentiated development path.
Thirdly, it is essential to understand the threshold effect in the development of FinTech and maintain a long-term strategic perspective. Empirical research indicates that once the FinTech development index surpasses a specific critical value (4.169), its negative impact on bank profitability significantly diminishes. This suggests that short-term challenges are embedded with long-term opportunities. Consequently, commercial banks should exhibit strategic patience, advancing digital transformation steadily within the regulatory framework, and refrain from curtailing necessary investments due to temporary profit fluctuations. Meanwhile, regulatory authorities could appropriately refine the evaluation mechanism, encouraging banks to balance long-term innovation and development with short-term operational stability. Additionally, standardized guidance for FinTech application scenarios should be reinforced to mitigate systemic risks potentially arising from disorderly competition.
Finally, it is essential to enhance the risk prevention and control system while strengthening the capacity to address external competition. Commercial banks should construct and refine a digital risk management framework, leveraging cutting-edge technologies such as big data analytics and artificial intelligence to improve the precision of risk identification and early warning mechanisms. Particular emphasis should be placed on mitigating technical risks, ensuring data security and managing cross-border competitive pressures arising from FinTech innovations. Furthermore, at the industry level, FinTech alliances or collaborative sharing platforms could be established to facilitate cooperation and knowledge exchange among banks, enabling collective responses to external challenges and ensuring the stability and sustainability of the financial system.
Author Contributions
Conceptualization, X.Y., C.-H.P. and D.A.b.A.M.; methodology, X.Y.; software, X.Y.; validation, X.Y., C.-H.P.; formal analysis, X.Y.; investigation, X.Y.; resources, X.Y.; data curation, X.Y.; writing—original draft preparation, X.Y.; writing—review and editing, X.Y.; visualization, X.Y.; supervision, C.-H.P. and D.A.b.A.M.; project administration, X.Y.; funding acquisition, X.Y. All authors have read and agreed to the published version of the manuscript.
Funding
This research received no external funding.
Institutional Review Board Statement
Not applicable.
Informed Consent Statement
Not applicable.
Data Availability Statement
The data supporting the findings of this study are available from the corresponding authors.
Acknowledgments
The authors would like to extend their heartfelt gratitude to the experts and scholars who provided invaluable insights and constructive feedback that significantly enhanced the quality of this manuscript.
Conflicts of Interest
The authors declare no conflicts of interest.
Abbreviations
The following abbreviations are used in this manuscript:
| FinTech | Financial Technology |
| ROA | Return on Asset |
| ROE | Return on Equity |
| GGDP | Growth Rate of GDP |
| NIM | Net Interest Margin |
| CR4 | Concentration Ratio of China’s top 4 banks |
| CIR | Cost-to-Income Ratio |
| NIIR | Non-interest Income Ratio |
| CAR | Capital Adequacy Ratio |
| ALR | Asset/Liability Ratio |
| VIF | Variance Inflation Factor |
| POLS | Pooled Ordinary Least Squares |
| RE | Random Effects |
| FE | Fixed Effects |
| BPLM | Breusch-Pagan Lagrangian Multiplier |
References
- Ba, S. S., & Bai, H. F. (2016). The development process of financial technology and the exploration of core technology application scenarios. Tsinghua Financial Review, 28(11), 99–103. [Google Scholar]
- Baker, H., Kaddumi, T. A., Nassar, M. D., & Muqattash, R. S. (2023). Impact of financial technology on improvement of banks’ financial performance. Journal of Risk and Financial Management, 16(4), 230. [Google Scholar] [CrossRef]
- Bu, Y., & Tang, M. (2024). FinTech and commercial banks’ operational performance: A U-shaped relationship. Journal of Contemporary Finance Research, 7(11), 61–76. [Google Scholar] [CrossRef]
- Chen, M. A., Wu, Q., & Yang, B. (2019). How valuable is FinTech innovation? The Review of Financial Studies, 32(5), 2062–2106. [Google Scholar] [CrossRef]
- Chhaidar, A., Abdelhedi, M., & Abdelkafi, I. (2022). The effect of financial technology investment level on european banks’ profitability. Journal of the Knowledge Economy, 14, 2959–2981. [Google Scholar] [CrossRef] [PubMed]
- Corbet, S., Hou, Y. G., Hu, Y., Oxley, L., & Tang, M. (2023). Do financial innovations influence bank performance? Evidence from China. Studies in Economics and Finance, 41(2), 241–267. [Google Scholar] [CrossRef]
- Datta, S., Iskandar-Datta, M., & Sharma, V. (2011). Product market pricing power, industry concentration and analysts’ earnings forecasts. Journal of Banking & Finance, 35(6), 1352–1366. [Google Scholar] [CrossRef]
- Hu, D., Zhao, S., & Yang, F. (2024). Will fintech development increase commercial banks risk-taking? Evidence from China. Electronic Commerce Research, 24(1), 37–67. [Google Scholar] [CrossRef]
- Kayed, S., Alta’any, M., Meqbel, R., Khatatbeh, I. N., & Mahafzah, A. (2025). Bank FinTech and bank performance: Evidence from an emerging market. Journal of Financial Reporting and Accounting, 23(2), 518–535. [Google Scholar] [CrossRef]
- Kharrat, H., Trichilli, Y., & Abbes, B. (2024). Relationship between FinTech index and bank’s performance: A comparative study between Islamic and conventional banks in the MENA region. Journal of Islamic Accounting and Business Research, 15(1), 172–195. [Google Scholar] [CrossRef]
- Lee, C. C., Li, X., Yu, C. H., & Zhao, J. (2021). Does fintech innovation improve bank efficiency? Evidence from China’s banking industry. International Review of Economics & Finance, 74, 468–483. [Google Scholar] [CrossRef]
- Li, Z. H., Chen, H. L., & Zhang, X. D. (2022). The impact of FinTech on the profitability of commercial banks. Journal of Zhongnan University of Economics and Law, 5(254), 56–68. [Google Scholar]
- Lv, S., Du, Y., & Liu, Y. (2022). How do FinTechs impact banks’ profitability?—An empirical study based on banks in China. FinTech, 1(2), 155–163. [Google Scholar] [CrossRef]
- Ma, J. J. (2024). The development of financial technology and liquidity creation of commercial banks. Jiangsu Business Theory, 17(07), 75–79. [Google Scholar]
- Nugroho, H. H., & Sugiyanto, F. X. (2023). The impact of financial technology on banking profitability. Ikraith-Ekonomika, 6(2), 255–264. [Google Scholar] [CrossRef]
- Peress, J. (2010). Product market competition, insider trading, and stock market efficiency. The Journal of Finance, 65(1), 1–43. [Google Scholar] [CrossRef]
- Pham, T. P., Hoang, S. D., Trang, L. N. T., & Ly, H. T. M. (2023). The effect of fintech funding on bank profitability: A case of ASEAN-5. Journal of Hunan University, 50(4), 47–61. [Google Scholar] [CrossRef]
- Qi, R., Wang, J., Chang, R., & Shen, Y. (2021). The impact of financial disintermediation on the credit business of Chinese commercial banks. Open Journal of Social Sciences, 9(12), 288–298. [Google Scholar] [CrossRef]
- Shen, B., Perfilev, A. A., Bufetova, L. P., & Li, X. (2023). Bank profitability analysis in China: Stochastic frontier approach. Journal of Risk and Financial Management, 16(4), 243. [Google Scholar] [CrossRef]
- Song, X., Yu, H., & He, Z. (2023). Heterogeneous impact of Fintech on the profitability of commercial banks: Competition and spillover effects. Journal of Risk and Financial Management, 16(11), 471. [Google Scholar] [CrossRef]
- Tang, Y., Fang, Z., & Fan, Y. X. (2024). A study on effect and heterogeneity of financial technology on credit risk of commercial banks: An empirical analysis based on panel data of commercial banks. Journal of Huaihua University, 43(5), 88–95. [Google Scholar] [CrossRef]
- Tong, X., & Yang, W. (2025). Empirical analysis of the impact of financial technology on the profitability of listed banks. International Review of Economics and Finance, 98, 103788. [Google Scholar] [CrossRef]
- Wang, W., Zhang, J., & Wang, Y. (2022). Capital supervision, information disclosure and risk-taking—Evidence from rural commercial banks in China. Emerging Markets Finance and Trade, 58(8), 2273–2289. [Google Scholar] [CrossRef]
- Wang, Y., Yu, X., Yao, Q., Lu, Y., Che, W., Jiang, J., & Chen, S. C.-I. (2024). Assessing the impact of financial technology innovations on the sustainable profitability of listed commercial banks in China. FinTech, 3(3), 337–348. [Google Scholar] [CrossRef]
- Wei, H. L., & Yang, Q. (2024). Research on the impact of financial technology on the financial performance of commercial banks-Empirical analysis based on 42 commercial banks. Industrial Innovation Research, (03), 107–112. [Google Scholar]
- Wu, H., Yang, J., Wu, W., & Chen, Y. (2023). Interest rate liberalization and bank efficiency: A DEA analysis of Chinese commercial banks. Central European Journal of Operations Research, 31(2), 467–498. [Google Scholar] [CrossRef]
- Xiong, J., Zhang, Y., & Dong, X. L. (2021). The impact of financial technology on the operational efficiency of commercial banks: Crowding out effect or technological spillover effect? Economic Review, 6(03), 89–104. [Google Scholar]
- Yin, K. X., & Peng, N. (2024). An empirical study on the impact of Fintech on profitability of listed commercial banks in China. Trade Fair Economy, (19), 100–103. [Google Scholar] [CrossRef]
- Yu, F. Q., & Yu, Q. H. (2021). An analysis is conducted on the mechanism by which financial technology influences the profitability of commercial banks. Journal of Finance and Economics, (02), 45–52+62. [Google Scholar]
- Yu, L. X., & Li, Z. H. (2023). Research on the impact of FinTech on commercial banks’ profitability and risk: Empirical testing based on text mining. Financial Regulation Research, 6(4), 62–79. [Google Scholar] [CrossRef]
- Yudaruddin, R. (2023). Financial technology and performance in Islamic and conventional banks. Journal of Islamic Accounting and Business Research, 14(1), 100–116. [Google Scholar] [CrossRef]
- Zhang, H. (2023). Analysis of Internet third-party payment based on alipay mobile payment business. Frontiers in Business, Economics and Management, 11(2), 212–219. [Google Scholar] [CrossRef]
- Zhang, J., Bi, Z., Hu, M., & Meng, Q. (2023). Shadow banking and commercial bank: Evidence from China. Applied Economics, 55(1), 72–89. [Google Scholar] [CrossRef]
- Zhao, J., Li, X., Yu, C. H., Chen, S., & Lee, C. C. (2022). Riding the FinTech innovation wave: FinTech, patents and bank performance. Journal of International Money and Finance, 122, 102552. [Google Scholar] [CrossRef]
Disclaimer/Publisher’s Note: The statements, opinions and data contained in all publications are solely those of the individual author(s) and contributor(s) and not of MDPI and/or the editor(s). MDPI and/or the editor(s) disclaim responsibility for any injury to people or property resulting from any ideas, methods, instructions or products referred to in the content. |
© 2025 by the authors. Licensee MDPI, Basel, Switzerland. This article is an open access article distributed under the terms and conditions of the Creative Commons Attribution (CC BY) license (https://creativecommons.org/licenses/by/4.0/).