Article

The Impact of ESG Performance on Corporate Investment Efficiency: Evidence from Chinese Listed Companies

1
Faculty of Applied Economics, University of Chinese Academy of Social Sciences, Beijing 102488, China
2
School of Software & Microelectronics, Peking University, Beijing 100871, China
*
Author to whom correspondence should be addressed.
J. Risk Financial Manag. 2025, 18(8), 427; https://doi.org/10.3390/jrfm18080427 (registering DOI)
Submission received: 15 June 2025 / Revised: 27 July 2025 / Accepted: 28 July 2025 / Published: 1 August 2025
(This article belongs to the Section Business and Entrepreneurship)

Abstract

Recent theoretical and empirical studies highlight that information asymmetry and owner–manager conflict of interest can distort corporate investment decisions. Building on this premise, we hypothesize that superior environmental, social, and governance (ESG) performance mitigates these frictions by (H1) alleviating financing constraints and (H2) intensifying external analyst scrutiny. To test these hypotheses, we examine all Shanghai and Shenzhen A-share non-financial firms from 2009 to 2023. Using panel fixed-effects and two-stage least squares with an industry–province–year instrument, we find that higher ESG performance significantly reduces investment inefficiency; the effect operates through both lower financing constraints and greater analyst coverage. Heterogeneity analyses reveal that the improvement is pronounced in small non-state-owned, non-high-carbon firms but absent in large state-owned high-carbon emitters. These findings enrich the literature on ESG and corporate performance and offer actionable insights for regulators and investors seeking high-quality development.

1. Introduction

The concept of ESG was initially proposed to guide enterprises to incorporate environmental governance, social governance, and corporate governance into their business goals while pursuing their own development, so as to achieve a harmonious coexistence of the economy, society, and environment. In 2015, in order to overcome numerous obstacles in economic, social, and environmental development and promote the global sustainable development process, the United Nations Sustainable Development Summit established seventeen specific goals, which pushed ESG to a new height internationally. ESG not only focuses on the financial performance of enterprises, but also covers their impact on the environment, the fulfillment of social responsibilities, and the soundness of corporate governance, providing investors and other stakeholders with a comprehensive framework for assessing the sustainability of an enterprise’s development momentum and the fulfillment of social responsibilities. At the corporate level, an increasing number of listed companies have begun to recognize the significance of ESG, independently compiling ESG reports and publicly releasing them, which demonstrates their commitment to environmental protection and social responsibility. It is of great significance for enterprises to enhance their ESG performance, achieve the common realization and harmonious unity of social and economic values, and improve their sustainable development capabilities. Enterprise investment is an important link in the production and operation of an enterprise, determining whether the enterprise can continuously expand reproduction (On the basis of the original production scale, enterprises can achieve continuous growth in production capacity, output, and capital stock through means such as new fixed asset investment, technological transformation or mergers and acquisitions, thereby promoting the long-term expansion of enterprises and the sustained growth of the macroeconomy). In recent years, agency conflict arising from the misalignment of objectives between owners and managers has become increasingly prominent (Yuan et al., 2021). Enterprise investment decisions are subject to adverse selections and moral hazards caused by information asymmetry. High-quality enterprises are confronted with insufficient investment under financing constraints, while inefficient enterprises may encounter the problem of excessive investment. Although financial statements can partially alleviate information asymmetry (Bushman & Smith, 2001), the intensification of agency conflicts and the frequent occurrence of financial fraud have weakened their credibility, prompting investors to rely more on non-financial information to assess the true value of enterprises (Dhaliwal et al., 2014). Such information, by enhancing transparency and governance visibility and optimizing the efficiency of capital allocation, has become a new approach to solving the problem of inefficient investment. As a very important non-financial indicator, ESG itself can reflect information of a company’s long-term operational capabilities such as internal governance. Moreover, through the disclosure of ESG information, it enhances the transparency of the enterprise and alleviates adverse selection and moral hazard issues, thus attracting increasing attention from investors.
Can ESG performance influence investors’ decisions and have an impact on the investment efficiency of enterprises? The existing literature generally only studies the relationship between the ESG performance of enterprises and enterprise value indicators (Ihsani et al., 2023), and it rarely touches upon the decision-making of enterprises. At present, in-depth research on the relationship between ESG performance and enterprise investment efficiency is still insufficient, especially in terms of how ESG performance affects enterprise investment efficiency through specific transmission mechanisms, and a systematic and comprehensive theoretical framework has not yet been formed. Through the review of literature and practical observation, this paper proposes three research hypotheses, indicating the positive effect of ESG performance on enterprises’ improvement of investment efficiency. Moreover, this effect is achieved through the alleviation of financing constraints and the increase in analysts’ attention.
Based on the above, this study investigates the impact of ESG on corporate investment efficiency using data from A-share listed companies in Shanghai and Shenzhen from 2009 to 2023, and explores the mechanisms and heterogeneity of this impact. The data in this article mainly covers the relevant information of China’s A-share listed companies. Considering the availability and comparability of ESG performance rating data, the study selected the period from 2009 to 2023 as the observation window. Chinese listed firms, though few, generate 60 percent of national revenue, 70 percent of profits, and over 50 percent of fixed-asset investment, and mirror overall Chinese investment via full industry coverage and standardized disclosure. Their pivotal role in global value chains means their investment efficiency affects worldwide resource allocation and sustainable governance, lending the findings cross-border relevance.
The results show that ESG performance promotes the improvement of enterprise investment efficiency, and this conclusion has passed a series of robustness tests. The results of the mechanism test indicate that this influence effect is achieved by alleviating financing constraints and increasing analysts’ attention.
The marginal contributions of this study are as follows: Firstly, the relevant literature on the impact of ESG on enterprises has been expanded, and the existing literature on the economic effects of ESG has focused more on the impact of ESG on the operational performance, and enterprise innovation capability and other aspects (Ihsani et al., 2023; Wu et al., 2024). This article focuses on the impact of ESG on corporate investment efficiency, enriching existing research on the impact of ESG on businesses. Secondly, relevant literature on factors affecting corporate investment efficiency has been supplemented. Previous studies have explored the impact of factors such as internal accounting information quality, market competition, and industry cycles on corporate investment efficiency (Elaoud & Jarboui, 2017; Stoughton et al., 2017; Ahmed et al., 2021). This article explores the impact of ESG, the latest practice, on corporate investment efficiency, providing a useful supplement to existing research. Thirdly, this article provides new empirical evidence for the impact of ESG on corporate investment efficiency. The mechanism and heterogeneity of this impact are systematically explored, providing decision-making references for investment decisions, strategic planning, and policy formulation of enterprises and governments.
The remaining sections of this paper are as follows. In Section 2, we review the relevant literature on corporate ESG performance and investment efficiency. In Section 3, we conduct a theoretical analysis of the research and put forward hypotheses. In Section 4, we introduced the measurement methods used in this study and provided the variable explanations and data sources. In Section 5, we present the results obtained from the empirical analysis. In Section 6, we conduct further analyses, including robustness tests, endogeneity analyses and heterogeneity analyses. Then, we present the results obtained from the empirical analysis. Finally, Section 7 summarizes the full text.

2. Literature Review

2.1. Environmental, Social, and Corporate Governance

The ESG concept, originating from a comprehensive evaluation system covering environmental, social, and governance dimensions, represents a sustainable investment paradigm that integrates non-financial performance into capital allocation decisions. Unlike traditional Socially Responsible Investment (SRI), ESG includes ecological protection, stakeholder relationships, and corporate decision-making mechanisms, providing a systematic assessment of long-term value creation. Proposed to highlight the importance of environmental, social, and governance factors in investment value, ESG encourages firms to embed these metrics into core performance systems to mitigate risks and enhance sustainable development.
At present, scholars from various countries have conducted numerous studies on the economic consequences of ESG information disclosure. The research results of Chytis et al. (2024) indicate that the publication and citation trends of ESG have been on the rise over time (Chytis et al., 2024). This study mainly involves contents such as company value, enterprise performance and enterprise innovation. In terms of enterprise value, multiple studies have shown that improved ESG performance will enhance the valuation of enterprises. Miralles-Quirós et al. (2018) mainly study the ESG performance of listed companies in Brazil. Improving the ESG governance level of enterprises is beneficial to reducing the cost of capital acquisition and increasing the enterprise valuation. Among them, the dimensions of environmental responsibility fulfillment (E) and governance structure improvement (G) have a stronger promoting effect. Aydoğmuş et al. (2022) found that the higher the comprehensive ESG score, the higher the enterprise value. Fatemi found that companies with better ESG performance tend to have higher enterprise value than those with poorer ESG performance (Fatemi et al., 2018). Das Gupta’s research suggests that companies with poor financial performance often have a stronger motivation to improve their ESG performance (Duque-Grisales & Aguilera-Caracuel, 2021). After the improvement in ESG performance, both the book value and market value of enterprises have improved, financing costs have decreased, and market attention has increased (B. Wang & Yang, 2022). There are also studies showing that ESG can have an impact on stock returns and volatility, based on the data of the US stock market (Escobar-Saldívar et al., 2025).
In terms of enterprise performance, Duque-Grisales & Aguilera-Caracuel (2021) studied the data of multinational companies in multiple countries in Latin America and found that there was a significant negative correlation between the ESG scores of enterprises and their financial performance. Velte’s empirical research on Germany found that there is a significant positive correlation between ESG scores and the return on total assets (ROA) of enterprises (Velte, 2017). The research by Chairani and Siregar indicates that ESG scores have a significant positive impact on the financial performance of large companies and those with high operational risks (Chairani & Siregar, 2021). Li’s research suggests that comprehensive ESG performance and performance in all three dimensions of a company can significantly improve its financial performance. For companies with lower levels of financial performance, this promoting effect is even more significant (J. Li et al., 2021). From the perspective of the three dimensions of ESG, R. Wang et al. (2021)’s research indicates that increasing the intensity of environmental protection investment will reduce the efficiency of traditional investment in the short term, but in the long run, technological progress and scale effects can significantly enhance the efficiency of enterprises’ environmental protection investment (R. Wang et al., 2021); Cook et al. (2019) demonstrated that CSR alleviated the conflicts between management and external investors, thereby enhancing the investment efficiency of enterprises (Cook et al., 2019). Research by Lei and Chen (2018) demonstrated that good corporate governance significantly enhances investment efficiency by reducing financing frictions caused by debt constraints (Lei & Chen, 2018).

2.2. Enterprise Investment Efficiency

Enterprise investment efficiency refers to the rationality and effectiveness of resource allocation in the process of enterprise investment decision-making. Efficient resource allocation can enhance an enterprises’ competitiveness and profitability, while inefficient investment may lead to resource waste and financial difficulties. According to the research of Salehi et al. (2022), the investment efficiency of enterprises has a significant impact on the value of enterprises. The key to studying the investment efficiency of enterprises lies in the fact that it directly determines whether scarce capital can flow to projects with a positive net present value, thereby enhancing the company’s value, optimizing macro resource allocation, and reducing efficiency losses caused by agency conflicts and financing constraints. Therefore, it has become a core topic in the research of corporate governance and financial development.
The internal factors affecting investment efficiency include accounting information quality, internal control quality, financing constraints, and agency costs. First, high-quality accounting information enhances corporate transparency and external trust, thereby improving investment efficiency (Bushman et al., 2004; Biddle & Hilary, 2006). For example, Elaoud et al. found that improved accounting information quality helps reduce overinvestment in Tunisian listed companies (Elaoud & Jarboui, 2017). Second, internal control quality plays a crucial role. Lai et al. showed that weak internal controls lead to inefficient investments, especially when related to capital expenditures and fixed assets (Lai et al., 2020). Cheng et al. also found that disclosing internal control deficiencies can significantly boost investment efficiency (Cheng et al., 2013). Third, financing constraints limit firms’ ability to obtain external funds, leading to underinvestment. Naeem and Li highlighted the significant impact of financing constraints on investment efficiency in OECD listed firms, noting that financial industry development can alleviate these constraints and enhance efficiency (Naeem & Li, 2019). Islam’s research on Canadian real estate firms indicated that while equity financing can temporarily improve cash flow and investment efficiency, it is not a stable long-term solution (Islam & Luo, 2018). Finally, agency costs arise from the separation of ownership and control. Reducing these costs is beneficial for improving investment efficiency and supporting long-term corporate development.
The external factors that affect investment efficiency mainly include market competition, policy factors, analyst attention, industry cycles and other factors. First, we cover market competition. According to the theory of neoclassical economics, fierce market competition will prompt enterprises to constantly adjust resource allocation and investment strategies to enhance their competitiveness. Stoughton et al. believe that the increase in the degree of market competition is conducive to improving the efficiency of investment (Stoughton et al., 2017). Stoughton also believes that maintaining a certain degree of industry concentration is moderately beneficial for the improvement of economic efficiency. Second, we explore policy factors. From the fundamental differences in policy goals, target groups, and transmission mechanisms, policies can be classified into macro policies, including fiscal, monetary and industrial policies, and regulatory policies, such as access policies, anti-monopoly policies, etc. Furthermore, the frequent changes in economic policies will also lead to a greater degree of instability in the market. These will obviously reduce the investment efficiency of enterprises. Third, we look at analyst attention. Empirical studies have proved that analysts’ attention can significantly curb inefficient investment behavior of publicly listed companies (Dai & Qin, 2019). Chen et al. further found that the higher the analytical level of analysts, the more obvious the improvement in the investment efficiency of the analyzed enterprises (Chen et al., 2017). Fourth, we discuss industry cycle. Ahmed et al. found after studying non-financial listed companies in Pakistan that during the introduction period and the decline period, the investment efficiency of enterprises was relatively low (Ahmed et al., 2021). It is relatively high during the growth period and the mature period. After studying the data of non-financial companies in the United States, Abuhommous found that enterprises are more likely to face the problem of low investment efficiency during the introduction period and the growth period (Abuhommous, 2025)
ESG and corporate investment efficiency are both cutting-edge topics in current corporate finance research. The former concerns the institutional basis for sustainable value creation, while the latter determines the allocation efficiency of scarce capital. However, most of the existing literature examines the two separately, and there is still a lack of mechanism and empirical evidence on how ESG affects investment efficiency through information governance and financing constraint mitigation mechanisms. Therefore, this paper attempts to bridge this gap and conduct a systematic analysis.

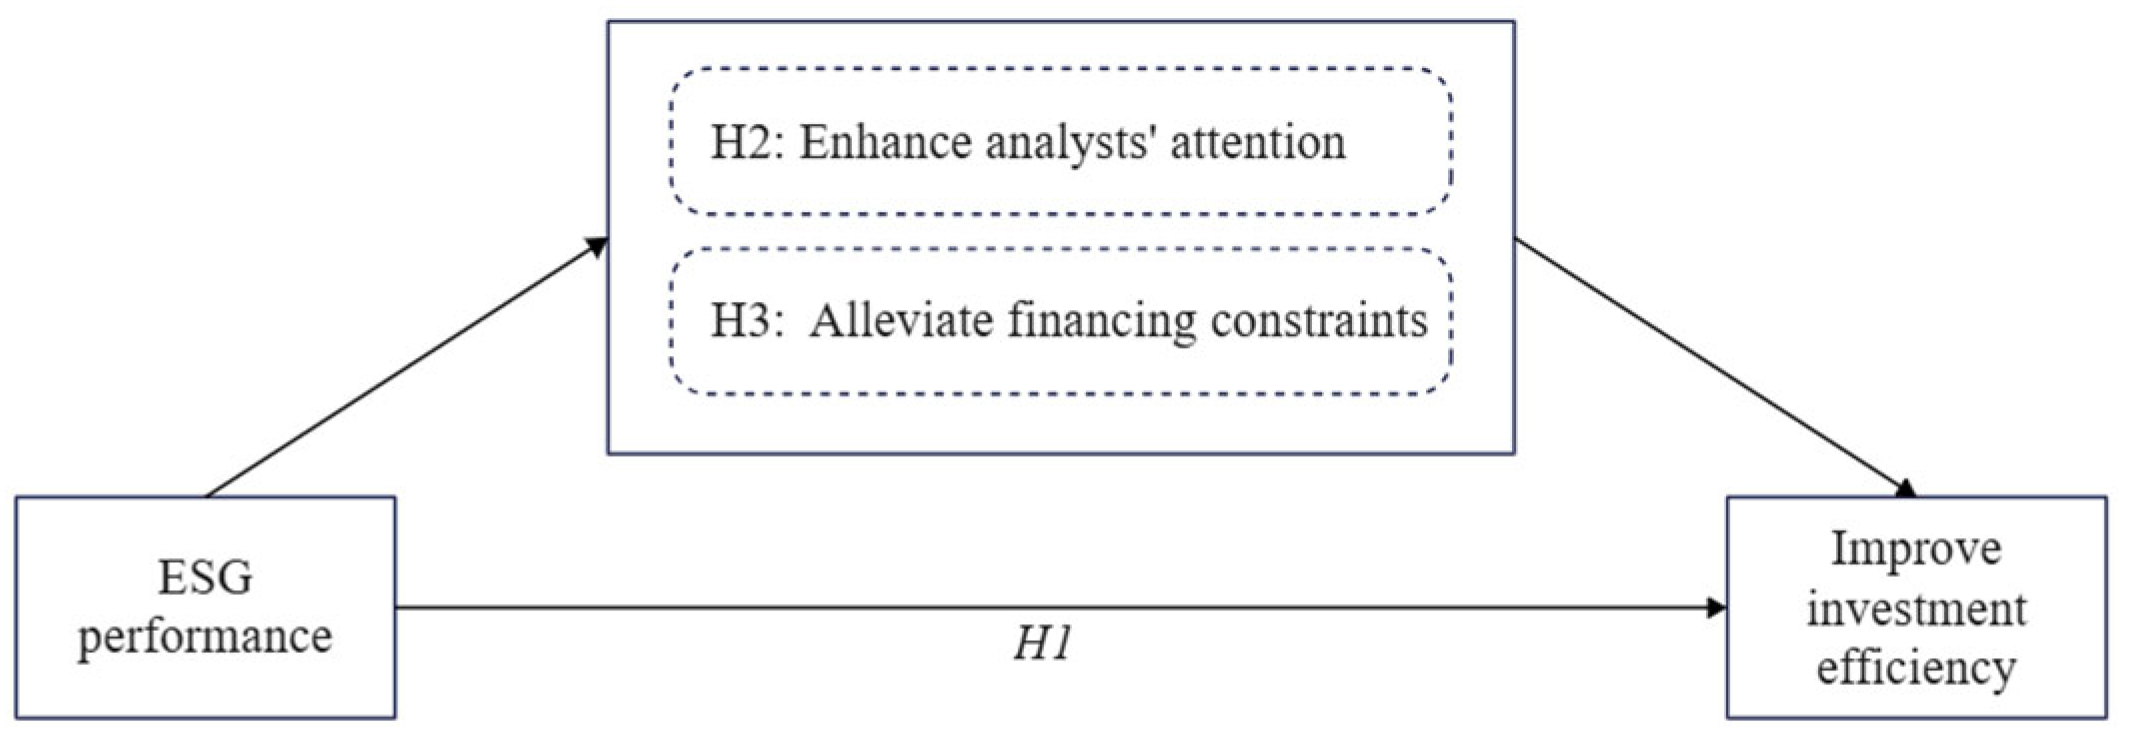
3. Theoretical Analysis and Research Hypothesis

3.1. Direct Impact of ESG Performance on Corporate Investment Efficiency

The disclosure of an enterprise’s ESG information is a process of transmitting signals to stakeholders and thereby breaking down information barriers. There is sufficient theoretical evidence to prove that ESG information disclosure can promote the improvement of enterprise investment efficiency. For instance, according to the theory of information asymmetry and signal theory, ESG information disclosure is a process of showcasing an enterprise’s environmental protection capabilities, fulfillment of social responsibilities, and internal governance effectiveness to the outside world. When stakeholders can obtain sufficient information through ESG information disclosure, the difficulty for enterprises to obtain external funds will be reduced and the investment efficiency will be improved. When enterprises disclose their ESG performance, they also demonstrate to the outside world their advantages in ecological construction, social responsibility commitment, and internal governance, which helps them gain reputation. This is equivalent to the unique resources of the enterprise itself. This kind of reputation resource can enhance the credit level of enterprises in the capital market and reduce the risks of external investors. Such prestigious resources can also attract more support from stakeholders, including financial, technological, talent, and policy support, etc., helping enterprises better seize market opportunities, improve market performance, and enhance investment efficiency.
According to the principal-agent theory, the improvement of ESG performance, especially the improvement of corporate governance performance, indicates that the governance structure of the enterprise is sound, which can effectively restrain and supervise the behavior of the management, and effectively reduce the agency problems between the owners and the management (Madyan & Widuri, 2023). Enterprises with good ESG performance are also more motivated to proactively disclose their own ESG information, reduce agency costs, and maintain the authenticity and reliability of information to curb the irrational behavior of management. According to Bhandari and Javakhadze’s research findings, the disclosure of corporate social responsibility has significantly improved the efficiency of capital allocation in the long term (Bhandari & Javakhadze, 2017). Moreover, if the management of an enterprise has very high requirements for ESG, it will instead reduce behaviors that harm the interests of the owners, enhance employee welfare and professional development, reduce agency conflicts, lower investment risks, and improve the efficiency of capital allocation for long-term considerations. From this perspective, this article holds that ESG performance has a positive incentive effect on the investment efficiency of enterprises. Based on the above analysis, this study proposes the main effect Hypothesis 1:
H1. 
ESG performance of enterprises has a promoting effect on Corporate Investment Efficiency.

3.2. The Influence Mechanism of ESG Performance on Corporate Investment Efficiency

Enterprises’ participation in ESG performance ratings helps to reduce the overall difficulty of financing. By obtaining ESG performance rating information reported by third-party rating agencies, enterprises can bridge the information gap, establish a good corporate image, enhance investors and other stakeholders’ understanding of the enterprise and recognition of its governance advantages, and thus provide financial support to the enterprise with confidence, alleviating financing constraints. This process is naturally accompanied by an increase in regulatory intensity, and an increase in regulatory intensity can promote enterprises to improve the accuracy of information provision and enhance their own performance (El Ghoul et al., 2017). This information can help investment institutions gain a deeper understanding of the content of the enterprises. Enterprises can also obtain higher credit scores by means of information disclosure. Some studies have also shown that when enterprises better fulfill their duties and obligations, such as environmental protection, it can significantly increase creditors’ willingness to provide long-term and low-cost financing, effectively alleviating the problem of insufficient investment by enterprises. The research of El Ghoul et al. shows that investment in improving responsible employee relations, environmental policies, and product strategies is of great help in reducing the cost of equity of companies (El Ghoul et al., 2011). In conclusion, high-quality enterprises are more inclined to disclose their good ESG performance in order to solve the problem of difficult financing. Based on the above analysis, this study proposes Hypothesis 2:
H2. 
The improvement of an enterprise’s ESG performance enhances its investment efficiency by alleviating financing constraints.
The ESG performance of enterprises improves investment efficiency by attracting the attention of analysts. Existing studies have shown that enterprises with outstanding ESG performance are more likely to attract analysts’ attention. On the one hand, ESG practices provide analysts with additional information by improving the quality of non-financial information disclosure (such as carbon emission data), reducing their costs of information collection and verification (Dhaliwal et al., 2014). On the other hand, enterprises with higher ESG performance ratings often have stronger risk resistance capabilities and long-term development potential, which aligns with the professional demands of analysts to explore investment hotspots (Chmielewska & Kluza, 2024). The improvement mechanism of investment efficiency by analysts’ attention mainly lies in two aspects: First, according to the signal theory, analysts can deeply interpret ESG information, transform difficult-to-quantify content into observable market signals, and send them out for enterprises, thereby alleviating the information gap between investors and enterprises. Secondly, the supervisory and restrictive effect. Continuous analyst tracking creates external supervisory pressure, forcing enterprises to optimize the investment decision-making process. Based on the above analysis, this study proposes Hypothesis 3:
H3. 
The improvement of an enterprise’s ESG performance enhances its investment efficiency by increasing analysts’ attention.
In order to better demonstrate the relationship between research hypotheses, this article has drawn logical diagrams of three hypotheses (Figure 1).

4. Research Methods and Data Sources

4.1. Methods

To verify these hypotheses, this study uses Model (1) to conduct the test. Specifically, Misinv, as the explained variable, adopts the aforementioned method to estimate the investment efficiency of enterprises to ensure the scientificity and accuracy of the assessment. ESG, as an explanatory variable, corresponds to the ESG performance rating of enterprises, environmental information rating, social information rating, and corporate governance rating, reflecting the ESG performance of enterprises from different perspectives. Furthermore, to control the endogeneity problem and enhance the reliability of the research, in this study, the explanatory variables were treated with a lag of one period during the regression analysis. We used the fixed effects of years and industries. The industry is controlled based on the 2012 version of the industry classification of the China Securities Regulatory Commission. Specifically, 21 industry dummy variables are included in all regressions to ensure the transparency and replicability of the model.
M i s i n v i t = α 0 + β 1 E S G i ( t 1 ) + β m C o n t r o l s + Σ Y e a r + Σ I n d u s t r y + μ i t
In Model (1), the explained variable is the investment efficiency (Misinv) of enterprise i in period t, and the explanatory variable is the ESG performance (ESG) of enterprise i in period T − 1. If the ESG coefficient β1 is significantly negative, it indicates that the higher the ESG performance level, the higher the investment efficiency of enterprises (the smaller the investment deviation Misinv). Conversely, it will lead to the deterioration of the investment efficiency of enterprises.

4.2. Variables

4.2.1. Dependent Variable

This paper uses the Richardson model to construct the index of inefficient investment level to measure the investment efficiency of enterprises (Richardson, 2006). This model defines the degree of overinvestment as the portion where the actual investment expenditure exceeds the planned investment expenditure; conversely, it is considered underinvestment. This model is highly favored by the academic community because it can reflect the level of inefficient investment of enterprises in a specific period and has been applied in research in multiple fields. Because the Richard model has strong applicability, and its applicability has been verified in the research on the A-share market in China. Therefore, the following model is constructed in this paper:
I N V i t = α 0 + β 1 × T o b i n q i t 1 + β 2 × L e v i t 1 + β 3 × C a s h i t 1 + β 4 × A g e i t 1 + β 5 × S i z e i t 1 + β 6 × R e t i t 1 + β 7 × I N V i t 1 + Σ I n d u s t r y + Σ Y e a r + μ i t .
Among them, INVit represents the amount of capital investment of the enterprise in year t, specifically the total amount of cash paid for the purchase and construction of fixed assets, intangible assets and other long-term assets divided by the total assets. Tobinqi(t−1) represents the growth opportunity of enterprise i in the t − 1 year and is measured by the Tobin Q value. Levi(t−1) represents the asset–liability ratio (total liabilities/total assets) of enterprise i in the t − 1 period. Cashi(t−1) represents the cash holdings of enterprise i in the t − 1 period, usually measured in the form of the ratio of “cash and cash equivalents/total assets”. Agei(t−1) represents the age of enterprise i at t − 1 year. Sizei(t−1) represents the scale of the enterprise in the t − 1 year, expressed as the natural logarithm of total assets. Reti(t−1) represents the stock return rate of company i considering dividend reinvestment in t − 1 year. INVi(t−1) represents the amount of capital investment of enterprise i in the year t − 1. Finally, the model also incorporates the Industry variable “industry” to measure the industry effect and the annual variable “Year” to measure the annual effect. The absolute value of the residual obtained according to Equation (2) is the inefficiency level of the enterprise, which is represented by the variable Misinv. The higher the Misinv value is, the higher the degree of inefficient investment of the enterprise is and the lower the investment efficiency is.

4.2.2. Independent Variable

According to the common practice in both academia and industry, ESG mainly involves dividing the three major categories (environment E, Society S, and corporate governance G) into multiple indicators, comprehensively scoring all these indicators, and ultimately summarizing them into an overall ESG performance rating. The rating system adopts a nine-tier rating system. The update cycle is quarterly or monthly, as the data is comprehensive and complete, and the indicator construction is relatively reasonable, which can systematically reflect the ESG performance of the enterprise.

4.2.3. Mechanism Variables

  • Financing constraints.
Referring to the research of Kaplan and Zingales et al., the KZ index was selected to measure the strength of the financing constraints of enterprises (Kaplan & Zingales, 1997). This paper constructs the following model to calculate the KZ index of enterprises:
K Z i , t = α 1 C F i , t A s s e t i , t 1 + α 2 D I V i , t A s s e t i , t 1 + α 3 C a s h i , t A s s e t i , t 1 + α 4 L e v i , t + α 5 Q i , t + ε i , t .
Among them, i represents the listed company, t represents the year, CFit/Ai(t−1) indicates the net cash flow from operating activities divided by the total assets at the end of the previous period, and DIVit/Asseti(t−1) indicates the cash dividend divided by the total assets at the end of the previous period. Cashit/Asseti(t−1) represents the cash holdings divided by the total assets at the end of the previous period, LEVit represents the asset–liability ratio, and Qi,t represents the tobin Q. In this paper, the fitted values of this model are used to measure the financing constraints of enterprises. For the convenience of recording, it is still recorded as KZ.
  • Analyst attention.
Analyst attention is mainly measured by the natural logarithm of the number of analysts who have tracked the enterprise in the past year.

4.2.4. Control Variables

This article selects the enterprise Size (Size), enterprise Age (Age), Tobin Q value (Tobinq), stock return rate (Ret), asset–liability ratio (Lev), Cash level (Cash), return on total assets (ROA), shareholding ratio of the controlling shareholder (Ctrlshare), size of the supervisory board (Supervs), and directors. The meeting size (Dirsize) is used as the control variable. The detailed calculation methods for each variable are shown in Table 1.

4.3. Data Sources

The financial indicators required for investment efficiency are taken from CSMAR and WIND, both of which are among the most authoritative and comprehensive commercial databases in China’s capital market, covering all annual reports of listed companies and high-frequency trading data, and have undergone multiple cross-verifications.” The ESG performance is based on the Huazheng ESG Social Responsibility Score, which is jointly compiled by Sino-Securities IndexInformation Service (Shanghai) Co., Ltd. and A third-party professional institution in China. It is quantitatively scored based on over 200 underlying indicators such as public annual reports, regulatory disclosures, and news public opinions. It is currently the most widely cited and timely updated localized ESG rating source in the research of A-shares in China’s capital market. For the industries of the listed companies, this paper adopts the 2012 edition of the Industry Classification of the China Securities Regulatory Commission as the industry classification standard for listed companies. Specifically, the manufacturing industry retains the classification of secondary industry categories, while the rest are merged into primary categories. This paper treats the research samples as follows: (1) Considering that the financial structure of financial companies (including banking, insurance, securities, trust, future funds, and other financial sub-sectors) is unique and is significantly different from that of general listed companies, with a relatively high risk of heterogeneity, these companies will be excluded in the research of this paper. (2) Eliminate companies with missing financial data. (3) Exclude ST (Special Treatment, reminding investors to pay attention to the company’s risks) and * ST (Delisting Risk Warning, once a company listed on * ST meets the relevant delisting criteria, it will be delisted directly) companies. (4) Delete companies that have been listed for less than one year because their data are not representative. Ultimately, this paper obtained a sample of 33,304 companies. The continuous variables used in the text are truncated by 1% above and below. The descriptive statistics are shown in Table 2.

5. Results

5.1. Baseline Regression Results

In Hypothesis 1, we suggest that ESG performance can enhance the efficiency of corporate investment, that is, reduce the level of inefficient investment. This paper uses the Pearson correlation coefficient to conduct a correlation analysis of the variables. The results (Table A1) show that the absolute values of the correlation coefficients between the variables are relatively low, reflecting that the direct linear relationship between the variables is relatively weak, generally below the recognized limit of 0.6, indicating that there is no multicollinearity among the variables in this study. The selection of variables in this paper is reasonable and has value for regression analysis. It can be seen from the table that the correlation between ESG performance and inefficient investment is negative, indicating that ESG performance significantly inhibits the inefficient investment behavior of enterprises, which is preliminarily consistent with Hypothesis 1.
Subsequently, we conducted a regression analysis. It can be seen from the regression results (Table 3) that ESG performance has a significant negative impact on the dependent variable, the level of inefficient investment Misinv. This indicates that improving ESG performance by enterprises can indeed enhance investment efficiency. In terms of control variables, ROA, Size, MB, and Tobinq were significantly positively correlated with the level of inefficient investment in enterprises, while Age was significantly negatively correlated with the level of inefficient investment in enterprises. These are basically consistent with previous studies. Overall, Hypothesis 1 of this paper has been fully verified.
The overall ESG performance of an enterprise is positively correlated with the investment efficiency of the enterprise. Firstly, from the perspective of information channels, high-quality ESG disclosure reduces the information asymmetry between enterprises and external investors, alleviates financing constraints, and enables enterprises to more accurately allocate capital to projects with a positive net present value. Secondly, from the perspective of governance channels, companies with higher ESG scores tend to have more complete internal controls, and the short-sighted behavior of management is curbed, reducing excessive investment caused by the abuse of “free cash flow”. Secondly, from the perspective of risk channels, good ESG practices can reduce the sudden risks brought about by environmental violations, social responsibility incidents, and governance scandals, thereby lowering capital costs and improving the implementation efficiency of investment projects. Finally, policy incentives should not be overlooked: differentiated regulatory measures such as green credit and carbon emission reduction support tools give ESG leading enterprises a natural advantage in obtaining low-cost funds, further strengthening the positive effect on investment efficiency. In conclusion, enhancing ESG performance is not only a need for enterprises to fulfill their social responsibilities, but also an important approach to improving the efficiency of capital allocation and achieving long-term value creation.

5.2. Mechanism Analysis

5.2.1. Financing Constraint

In Hypothesis 2, we infer that financing constraints are one of the key obstacles to enterprise investment. Based on the theoretical analysis in the previous text, a good ESG performance can enhance investors’ confidence in the enterprise, reduce the financing constraints on the enterprise, lower the difficulty of enterprise investment, and improve the investment efficiency of the enterprise. Lian and Su found that financing constraints led to the average investment expenditure of Chinese listed companies being more than 20% lower than the average optimal level, and the average investment efficiency was only 72% (Lian & Su, 2009). Based on Jiang T.’s research method (Jiang, 2022), this study first conducts a regression analysis of the mediating variable KZ of ESG and financing constraints. The empirical results (Table 4) show that ESG performance and the KZ variable are significant at the 10% level. A negative coefficient indicates that the improvement of an enterprise’s ESG performance will reduce financing constraints.
The above research results support the establishment of Hypothesis 2. This may be due to companies breaking information asymmetry after disclosing ESG information, establishing a good image of themselves, increasing investors and other stakeholders’ awareness of the company and recognition of its governance advantages, thereby alleviating financing constraints.

5.2.2. Analyst Attention

Analysts’ attention is similar to financing constraints and also reflects the external environment of enterprises. The increase in analysts’ attention can significantly enhance the efficiency of information transmission for enterprises, showcase their own advantages, gain the understanding and trust of enterprises, and facilitate cooperation and financing. Therefore, Hypothesis 3 holds that analyst attention is also a mechanism by which ESG performance affects the investment efficiency of enterprises. Through the regression results (Table 4), it is not difficult to see that the improvement of the ESG performance of enterprises will significantly increase the attention of analysts. So, it is assumed that Hypothesis 3 holds.
This can also reflect that stakeholders attach great importance to the ESG performance of enterprises. Regarding the impact of analysts’ attention on the investment efficiency of enterprises, Dai’s research (2019) on the data of A-share listed companies in Shanghai and Shenzhen, China, found that analysts’ attention can significantly enhance the investment efficiency of enterprises (Dai & Qin, 2019). Some studies also suggest that analysts focus on reducing information asymmetry, minimizing enterprises’ excessive reliance on internal cash flow for investment, and curbing inefficient investment. To sum up, the mechanism of analysts’ attention has proved to be robust.

6. Further Research

6.1. Robustness Test

6.1.1. Replace the Explanatory Variable

For conducting cross-data source conformance testing, this article intends to replace the core explanatory variable with the Bloomberg ESG_Disclosure score. The ESG_Disclosure Score does not measure the actual ESG impact or performance of a company; it solely reflects the extent and transparency of disclosures. Since this rating itself has also gained wider recognition in the international community and, this paper holds that if the conclusion still holds after the core explanatory variable is replaced with Bloomberg ESG_Disclosure score, the results remained significant after Disclosure, indicating that a higher level of ESG disclosure transparency can enhance corporate investment efficiency by reducing information asymmetry and alleviating financing constraints., thereby enhancing the rigor and accuracy of the research results. The regression results are shown in Table 5. It is not difficult to see that even if the core explanatory variables are changed, the regression results are still significant, and the null hypothesis H1 is robust.

6.1.2. Replace the Explained Variable

In addition to using the Richardson model, a new model can also be constructed by referring to Biddle to explain the investment efficiency of enterprises (Biddle & Hilary, 2006). The residuals obtained by industry and year regression through Model (4) measure the level of inefficient investment of enterprises:
I N V i t = α 0 + β 1 × S a l e s G r o w t h i ( t 1 ) + β m C o n t r o l s + Σ Y e a r + Σ I n d u s t r y + μ i t .
Among them, the definition of INV is the same as above, and Sales Growth is defined as the revenue growth rate. μ is the residual after the regression of Model (4), and its absolute value, Misinv, is used to measure the level of inefficient investment of the company. The larger the value of Misinv is, the higher the degree of inefficient investment of the enterprise will be, and vice versa. The regression results of Model (4) are shown in Table 5. It is not difficult to see that even if the explained variable is replaced, the regression effect is still significant, further demonstrating that the null hypothesis still holds.

6.1.3. Adjust the Sample Period

As both the Shanghai Stock Exchange and the Shenzhen Stock Exchange in China joined the relevant initiatives launched by the United Nations Sustainable Stock Exchange in 2017, it may lead to a significant improvement in the ESG performance of enterprises in 2018. Moreover, the three-year pandemic has greatly disrupted economic data, affecting the robustness of the results. This paper eliminates the data of years after 2018 and re-conducts the basic regression to verify the robustness of the benchmark results. The empirical results are shown in Table 5. The results show that even after excluding the significant impacts of the policy environment and the epidemic, the estimated coefficients of the ESG performance of enterprises and the investment efficiency of enterprises remain significant, and the null hypothesis still holds.

6.2. Endogeneity Analysis

6.2.1. Instrumental Variable Method

Alleviating endogeneity is an important issue in this study. To deal with endogeneity caused by reverse causality, this paper uses the two-stage least square method to solve the endogeneity problem of the model. This study selects the average ESG performance of other listed companies in the same industry and province for each enterprise (ESG_IV) As an instrumental variable. There is a significant regional agglomeration effect in the ESG performance of enterprises. The ESG score of a certain enterprise in a specific industry is often highly correlated with the ESG scores of other enterprises in the same industry in the province where it is located (Gao et al., 2021). However, the ESG performance of enterprises in the same province and industry has no significant impact on the investment efficiency of the target enterprise. This feature makes the ESG performance of IV an ideal instrumental variable, which not only meets the requirements of correlation but also has exogenous conditions. From the regression results (Table 6), it can be seen that the instrumental variables still have a significant relationship with the level of inefficient investment, which indicates that the benchmark regression has withstood the endogeneity test.

6.2.2. GMM Dynamic Panel Analysis

GMM constructs the moment condition by introducing instrumental variables to solve the endogeneity problem in the dynamic panel model: Firstly, it uses lagging variables as instrumental variables to capture the correlation between the lagging term and the error term of the explained variables and eliminate the individual fixed effect. Secondly, the Hansen test is used to verify the exogeneity of the instrumental variable (for example, a p value > 0.05 indicates the effectiveness of the tool), and the AR1 and AR2 tests are combined to ensure that there is only first-order autocorrelation in the residual after difference (AR1 is significant while AR2 is not significant). Thus, while controlling bidirectional causal and omitted variable biases, the consistency and unbias of parameter estimation are achieved. This section uses the instrumental variables from the previous section for the GMM dynamic panel analysis. The statistics listed in Table 6 (3) show that AR1 is 0.000 and AR2 is 0.194. These indicate that there is no autocorrelation in the perturbation term. The p value of the Hansen test variable is 0.127, indicating that the instrumental variable is valid. The coefficient of ESG is significantly negative at the 1% level in the regression, indicating that the promoting effect of an enterprise’s ESG performance on investment efficiency is a fact, and the conclusion in the previous text is robust.

6.3. Heterogeneity Analysis

Referred, respectively, to the studies of Shu and Tan (2023), and Zhai et al. (2022), this paper will conduct heterogeneity analyses, respectively, in their domains: property rights nature, carbon element emission intensity, and the scale of the enterprise, to discuss the impact of ESG performance on the investment efficiency of enterprises, in order to obtain more comprehensive research conclusions. The results are presented in Table 7.

6.3.1. Property Rights Nature

In China, state-owned enterprises and non-state-owned enterprises have long coexisted in the same market, but there are significant differences in the institutional environments they are in. State-owned enterprises are directly controlled or indirectly held by the government. On the one hand, they enjoy resource preferences such as credit, land and subsidies; on the other hand, they undertake policy tasks such as employment and social stability. Non-state-owned enterprises, on the other hand, rely more on market financing and commercial credit, and are subject to tougher budget constraints. Due to the differences in the owner’s objective function, financing channels and regulatory intensity, the governance effects of ESG information in the two types of enterprises may vary. Therefore, grouping the samples by the nature of property rights can help clarify the transmission path of ESG in enhancing investment efficiency under different ownership scenarios.
Empirical studies have shown that the investment efficiency of state-owned enterprises may exhibit different performance compared to non-state-owned enterprises after changes in external conditions (Y. Li et al., 2015). Based on the differences in the property rights nature of different listed companies, this paper classifies all sample enterprises into two categories according to whether they are state-owned enterprises, and conducts model regression, respectively, to re-evaluate the basic model. The results are shown in columns (1)–(2) of Table 7. Obviously, the impact of ESG performance on inefficient investment in state-owned enterprises is not as significant as that in non-state-owned enterprises. This is in line with the actual situation of Chinese state-owned enterprises and the research results of predecessors. This may be because non-state-owned enterprises often face stronger market competition pressure and stricter financing constraints, and the improvement of ESG performance can more effectively enhance investor confidence and significantly improve their investment efficiency.

6.3.2. Carbon Element Emission Intensity

As the “Carbon Peaking and Carbon Neutrality Goals” strategy has been elevated to a long-term binding national target in China, the regulatory pressure and transformation incentives faced by high-carbon industries and low-carbon industries are completely different. High-emission industries have been incorporated into China’s carbon market, dual control of energy consumption and tiered electricity pricing and other policy frameworks, and enterprises’ investment behaviors are subject to stricter environmental compliance constraints. The low-carbon industry, on the other hand, enjoys incentives such as green credit, green bonds, and carbon reduction support tools. The impact of ESG performance on investment efficiency may vary depending on the carbon intensity of the industry.
ESG clearly examines the fulfillment of an enterprise’s environmental protection obligations. Naturally, enterprises with high carbon emissions often need to shoulder more environmental protection responsibilities. Thus, in this paper, all enterprises can be classified into high-carbon enterprises and non-high-carbon enterprises according to industry attributes, and the basic model can be re-evaluated. The empirical results obtained are columns (3)–(4) of Table 7. This paper finds that the coefficient of high-carbon enterprises is higher, but it is not as significant as that of enterprises with lower carbon emissions. This result indicates that the role of ESG in improving investment efficiency is more significant in high carbon enterprises. This is usually because high carbon enterprises are facing increasingly strict environmental regulatory pressure and higher transformation costs. The improvement of ESG performance helps them better cope with policy risks, obtain green financial support, and significantly improve investment efficiency.

6.3.3. The Scale of the Enterprise

There are structural differences in the availability of financing and external governance mechanisms provided by China’s multi-level capital market for enterprises of different scales. Large enterprises often have political connections, sufficient collateral, high information transparency, and can obtain bank credit and equity financing at low cost. Small and medium-sized enterprises are confronted with problems such as “difficult and expensive financing” and lack of information transparency. Scale differences lead to different signaling roles of ESG information in the capital market. Based on this, grouping enterprises by scale can reveal whether ESG performance shows gradient differences in enterprise scale.
This paper divides the samples into two groups. Enterprises ranked in the bottom 50% in terms of asset size are defined as small enterprises, and the remaining enterprises are defined as large enterprises. From the empirical results (columns (5)–(6) of Table 7), the regression coefficient of small enterprises is −0.206, and it is significant at the 1% level. It indicates that the investment of small enterprises in ESG can significantly promote the improvement of their investment efficiency. However, the regression coefficient of large enterprises is only −0.0611, and it is not significant. This indicates that the improvement of ESG performance has a more obvious improvement effect on the investment efficiency of small enterprises. Generally speaking, small-scale enterprises often have limited resources and weak risk resistance. ESG practices can help them better attract external funds, optimize resource allocation, and significantly improve investment efficiency.

7. Conclusions and Implications

7.1. Conclusions

This article focuses on the impact of an enterprise’s ESG performance on its investment efficiency and deeply explores its mechanism of action as well as the performance differences under different enterprise characteristics. The results show that the improvement of ESG performance has a significant promoting effect on the investment efficiency of enterprises. The outstanding performance of enterprises in environmental, social, and corporate governance can optimize resource allocation, enhance the quality of decision-making and trigger a structural and systematic improvement in investment efficiency. In terms of mechanism testing, this paper verifies two mechanisms: the mechanism for alleviating financing constraints, and the mechanism for increasing analysts’ attention. Overall, high-quality ESG information helps investors assess the value of enterprises more accurately, thereby promoting enterprises to obtain reasonable allocation of market resources. All these verify the positive impact of ESG performance on investment efficiency. This study also examines the heterogeneity under different corporate characteristics. The heterogeneity results show that the investment efficiency of non-state-owned enterprises, non-high carbon enterprises, and small enterprises is more significantly affected by ESG performance. This study conducted endogeneity analysis through methods including instrumental variable method and GMM dynamic panel analysis. In addition, robustness tests such as replacing the core explanatory variable, replacing the explained variable, and extracting some samples were carried out. The results of multiple tests all indicate that the promoting effect of an enterprise’s ESG performance on investment efficiency is robust.

7.2. Implications

7.2.1. Government

The construction of ESG-related systems in various countries still has a long way to go. The research results provide evidence for regulatory authorities to assess the effectiveness of the current ESG performance system and can also offer an experience benchmark for the subsequent formulation of industry-specific, phased, and differentiated mandatory disclosure lists and incentive compatible policies. The government needs to take the lead in establishing an ESG information disclosure system and promote the allocation of resources towards high-quality non-state-owned enterprises. The standards should cover three aspects: environment, society, and corporate governance, and clearly define the indicators, calculation methods, and disclosure frequencies, and take into account the characteristics of the industry to allow for differentiated supplementation, ensuring the comparability and practicality of the data. The government needs to improve the mandatory disclosure system, unify the disclosure format and scope, severely punish false disclosure through a dynamic review mechanism, and build a national-level ESG information platform to achieve data openness and transparency.

7.2.2. Enterprises

Enterprises need to enhance their own ESG construction. Against the backdrop of the current global economy’s transformation towards sustainable development, enterprises should proactively strengthen their ESG construction to gain their long-term competitive advantages. There are three specific points that enterprises need to strengthen their own ESG construction. First, enhance the transparency of information disclosure, reduce information asymmetry between investors and enterprises, alleviate financing constraints and optimize the efficiency of capital allocation. Second, shape a responsible corporate image, enhance the trust of stakeholders, and reduce financing costs through reputation premium. Third, optimize the internal governance structure (such as improving the independent director system, internal control system and ESG decision embedding mechanism), curb the short-sighted behavior of management, and ensure that funds are invested in long-term value projects.

7.3. Research Limitations

During the analysis process, due to the use of standardized variable results for correlation and regression analysis, it may have affected the analysis of the results. We look forward to more related studies focusing on such issues in the future, thereby providing more empirical evidence. Due to the limited overall space, some detailed studies have not been carried out. The sample used in this study is limited to listed companies, so the conclusions of this study may not provide targeted guidance for ESG and investment practices of small and medium-sized enterprises. Looking forward to better understanding the data of non-listed companies in future research, in order to conduct more comprehensive analysis. In addition, the scope of analysis in this article is limited to China, so the conclusions drawn may not be directly applicable to other countries. Future research can expand this research direction to countries with different economic backgrounds.

Author Contributions

Conceptualization, L.H.; methodology, L.H.; software, Z.T.; validation, Z.L. and Y.M.; writing—original draft preparation, Z.T.; writing—review and editing, Z.L. and Y.M.; visualization, Z.L. and Y.M.; supervision, Z.L. All authors have read and agreed to the published version of the manuscript.

Funding

This research received no external funding.

Institutional Review Board Statement

Not applicable.

Informed Consent Statement

Not applicable.

Data Availability Statement

The data in this study comes from the CSMAR database and the WIND database.

Conflicts of Interest

The authors declare no conflicts of interest.

Appendix A

Table A1. Variable correlation analysis.
MisinvESGAgeSizeROARetMBCashCtrlshareSupervisorsDirsizeTobinq
MISINV1.000
ESG−0.072 ***1.000
Size−0.127 ***0.215 ***1.000
Age−0.164 ***−0.054 ***0.395 ***1.000
Tobinq0.125 ***−0.058 ***−0.380 ***−0.079 ***1.000
Ret0.015 ***−0.012 **−0.076 ***−0.029 ***0.316 ***1.000
MB0.061 ***−0.123 ***−0.041 ***0.107 ***0.583 ***0.243 ***1.000
Cash0.0050.117 ***−0.200 ***−0.164 ***0.194 ***0.024 ***−0.061 ***1.000
ROA0.070 ***0.180 ***0.022 ***−0.151 ***0.204 ***0.124 ***−0.095 ***0.240 ***1.000
Ctrlshare0.0000.089 ***0.134 ***−0.153 ***−0.078 ***0.009 *−0.057 ***0.049 ***0.157 ***1.000
Supervisors−0.052 ***0.028 ***0.248 ***0.246 ***−0.115 ***0.010 *0.027 ***−0.054 ***−0.016 ***0.079 ***1.000
Dirsize−0.028 ***0.012 **0.214 ***0.138 ***−0.102 ***0.012 **−0.007−0.029 ***0.041 ***−0.0080.286 ***1.000
Note: ***, **, and * are significant at 1%, 5%, and 10% levels, respectively.

References

  1. Abuhommous, A. A. A. (2025). Does the firm’s life cycle matter in the relationship between short-term debt and investment efficiency? International Journal of Finance & Economics, 30(2), 1429–1449. [Google Scholar] [CrossRef]
  2. Ahmed, B., Akbar, M., Sabahat, T., Ali, S., Hussain, A., Akbar, A., & Hongming, X. (2021). Does Firm Life Cycle Impact Corporate Investment Efficiency? Sustainability, 13(1), 197. [Google Scholar] [CrossRef]
  3. Aydoğmuş, M., Gülay, G., & Ergun, K. (2022). Impact of ESG performance on firm value and profitability. Borsa Istanbul Review, 22, S119–S127. [Google Scholar] [CrossRef]
  4. Bhandari, A., & Javakhadze, D. (2017). Corporate social responsibility and capital allocation efficiency. Journal of Corporate Finance, 43, 354–377. [Google Scholar] [CrossRef]
  5. Biddle, G. C., & Hilary, G. (2006). Accounting Quality and Firm-Level Capital Investment. The Accounting Review, 81(5), 963–982. [Google Scholar] [CrossRef]
  6. Bushman, R. M., Piotroski, J. D., & Smith, A. J. (2004). What Determines Corporate Transparency? Journal of Accounting Research, 42, 207–252. [Google Scholar] [CrossRef]
  7. Bushman, R. M., & Smith, A. J. (2001). Financial accounting information and corporate governance. Journal of Accounting and Economics, 32(1), 237–333. [Google Scholar] [CrossRef]
  8. Chairani, C., & Siregar, S. V. (2021). The effect of enterprise risk management on financial performance and firm value: The role of environmental, social and governance performance. Meditari Accountancy Research, 29(3), 647–670. [Google Scholar] [CrossRef]
  9. Chen, T., Xie, L., & Zhang, Y. (2017). How does analysts’ forecast quality relate to corporate investment efficiency? Journal of Corporate Finance, 43, 217–240. [Google Scholar] [CrossRef]
  10. Cheng, M., Dhaliwal, D., & Zhang, Y. (2013). Does investment efficiency improve after the disclosure of material weaknesses in internal control over financial reporting? Journal of Accounting and Economics, 56(1), 1–18. [Google Scholar] [CrossRef]
  11. Chmielewska, A., & Kluza, K. (2024). Esg risk rating and company valuation: The case of the Warsaw stock exchange. Ruch Prawniczy, Ekonomiczny i Socjologiczny, 86(1), 179–197. [Google Scholar] [CrossRef]
  12. Chytis, E., Eriotis, N., & Mitroulia, M. (2024). ESG in Business Research: A Bibliometric Analysis. Journal of Risk and Financial Management, 17(10), 460. [Google Scholar] [CrossRef]
  13. Cook, K. A., Romi, A. M., Sánchez, D., & Sánchez, J. M. (2019). The influence of corporate social responsibility on investment efficiency and innovation. Journal of Business Finance & Accounting, 46(3–4), 494–537. [Google Scholar] [CrossRef]
  14. Dai, S., & Qin, Y. (2019). Management power, analyst attention, and investment efficiency. Accounting Friend, (12), 80–88. [Google Scholar] [CrossRef]
  15. Dhaliwal, D., Li, O. Z., Tsang, A., & Yang, Y. G. (2014). Corporate social responsibility disclosure and the cost of equity capital: The roles of stakeholder orientation and financial transparency. Journal of Accounting and Public Policy, 33(4), 328–355. [Google Scholar] [CrossRef]
  16. Duque-Grisales, E., & Aguilera-Caracuel, J. (2021). Environmental, Social and Governance (ESG) scores and financial performance of multilatinas: Moderating effects of geographic international diversification and financial slack. Journal of Business Ethics, 168(2), 315–334. [Google Scholar] [CrossRef]
  17. Elaoud, A., & Jarboui, A. (2017). Auditor specialization, accounting information quality and investment efficiency. Research in International Business and Finance, 42, 616–629. [Google Scholar] [CrossRef]
  18. El Ghoul, S., Guedhami, O., & Kim, Y. (2017). Country-level institutions, firm value, and the role of corporate social responsibility initiatives. Journal of International Business Studies, 48(3), 360–385. [Google Scholar] [CrossRef]
  19. El Ghoul, S., Guedhami, O., Kwok, C. C. Y., & Mishra, D. R. (2011). Does corporate social responsibility affect the cost of capital? Journal of Banking & Finance, 35(9), 2388–2406. [Google Scholar] [CrossRef]
  20. Escobar-Saldívar, L. J., Villarreal-Samaniego, D., & Santillán-Salgado, R. J. (2025). The effects of ESG scores and ESG momentum on stock returns and volatility: Evidence from U.S. markets. Journal of Risk and Financial Management, 18(7), 367. [Google Scholar] [CrossRef]
  21. Fatemi, A., Glaum, M., & Kaiser, S. (2018). ESG performance and firm value: The moderating role of disclosure. Global Finance Journal, 38, 45–64. [Google Scholar] [CrossRef]
  22. Gao, J., Chu, D., Lian, Y., & Zheng, J. (2021). Can ESG performance improve corporate investment efficiency? Securities Market Herald, (11), 24–34+72. [Google Scholar]
  23. Ihsani, A. N., Nidar, S. R., & Kurniawan, M. (2023). Does ESG performance affect financial performance? Evidence from Indonesia. Wiga: Jurnal Penelitian Ilmu Ekonomi, 13(1), 46–61. [Google Scholar] [CrossRef]
  24. Islam, A. R. M., & Luo, R. H. (2018). Financing constraints and investment efficiency: Evidence from a panel of Canadian forest firms. Applied Economics, 50(48), 5142–5154. [Google Scholar] [CrossRef]
  25. Jiang, T. (2022). Mediating and moderating effects in empirical studies of causal inference. China Industrial Economy, 100–120. [Google Scholar] [CrossRef]
  26. Kaplan, S. N., & Zingales, L. (1997). Do investment-cash flow sensitivities provide useful measures of financing constraints?*. The Quarterly Journal of Economics, 112(1), 169–215. [Google Scholar] [CrossRef]
  27. Lai, S.-M., Liu, C.-L., & Chen, S.-S. (2020). Internal Control Quality and Investment Efficiency. Accounting Horizons, 34(2), 125–145. [Google Scholar] [CrossRef]
  28. Lei, Q., & Chen, H. (2018). Corporate governance boundary, debt constraint, and investment efficiency. Emerging Markets Finance and Trade, 55(5), 1091–1108. [Google Scholar] [CrossRef]
  29. Li, J., Yang, Z., Chen, J., & Cui, W. (2021). How does ESG promote corporate performance? Evidence from corporate innovation. Journal of Science and Technology Management, 42(9), 71–89. [Google Scholar]
  30. Li, Y., Zeng, W., Ma, Z., & Chen, K. (2015). External governance environment, ownership and efficiency of listed companies’ investment. Nankai Business Review, 18(1), 25–36. [Google Scholar] [CrossRef]
  31. Lian, Y., & Su, Z. (2009). Financing constraints, uncertainty, and investment efficiency of listed companies. Management Review, 21(1), 19–26. [Google Scholar]
  32. Madyan, M., & Widuri, S. K. (2023). Environmental, Social, Governance (ESG) performance and capital structure: The role of good corporate governance. Journal of Theoretical and Applied Management, 16(3), 560–570. [Google Scholar] [CrossRef]
  33. Miralles-Quirós, M. M., Miralles-Quirós, J. L., & Valente Gonçalves, L. M. (2018). The value relevance of environmental, social, and governance performance: The Brazilian case. Sustainability, 10(3), 574. [Google Scholar] [CrossRef]
  34. Naeem, K., & Li, M. C. (2019). Corporate investment efficiency: The role of financial development in firms with financing constraints and agency issues in OECD non-financial firms. International Review of Financial Analysis, 62, 53–68. [Google Scholar] [CrossRef]
  35. Richardson, S. (2006). Over-investment of free cash flow. Review of Accounting Studies, 11(2), 159–189. [Google Scholar] [CrossRef]
  36. Salehi, M., Zimon, G., Arianpoor, A., & Gholezoo, F. E. (2022). The Impact of Investment Efficiency on Firm Value and Moderating Role of Institutional Ownership and Board Independence. Journal of Risk and Financial Management, 15(4), 170. [Google Scholar] [CrossRef]
  37. Shu, H., & Tan, W. (2023). Does carbon control policy risk affect corporate ESG performance? Economic Modelling, 120, 106148. [Google Scholar] [CrossRef]
  38. Stoughton, N. M., Wong, K. P., & Yi, L. (2017). Investment efficiency and product market competition. Journal of Financial and Quantitative Analysis, 52(6), 2611–2642. [Google Scholar] [CrossRef]
  39. Velte, P. (2017). Does ESG performance have an impact on financial performance? Evidence from Germany. Journal of Global Responsibility, 8, 169–178. [Google Scholar] [CrossRef]
  40. Wang, B., & Yang, M. (2022). The impact mechanism of ESG performance on corporate value: Evidence from A-share listed companies in China. Soft Science, 36(6), 78–84. [Google Scholar]
  41. Wang, R., He, X., & Diao, X. (2021). Input-output efficiency of environmental protection enterprises and its influencing factors: An empirical analysis of 279 listed enterprises in China. Journal of Cleaner Production, 279, 123652. [Google Scholar] [CrossRef]
  42. Wu, R., Li, J., Dai, Y., Shen, X., & Hossain, M. A. (2024). Impact of environmental, social, and governance on innovation in Chinese listed firms. Sustainability, 16(17), 7482. [Google Scholar] [CrossRef]
  43. Yuan, L., Tao, X., Ramsey, T. S., & Degefu, D. M. (2021). Simulating the principal-agent relationship between enterprise owners and professional managers using evolutionary game theory and system dynamics. Complexity, 2021(1), 3881254. [Google Scholar] [CrossRef]
  44. Zhai, L., Feng, Y., Li, F., & Zhai, L. (2022). Tax preference, financing constraints and enterprise investment efficiency-Experience, of China’s enterprises investment. PLoS ONE, 17(9), e0274336. [Google Scholar] [CrossRef] [PubMed]
Figure 1. Theoretical Path Diagram of ESG’s Impact on Investment Efficiency.
Jrfm 18 00427 g001
Table 1. Variable calculation method.
VariableCalculation Method
MisinvThe absolute value of the residual calculated based on the model (for the convenience of showing the coefficient, proportionally expand the value by 100 times)
ESGHuazheng ESG Performance Ratings are assigned values ranging from 1 to 9 from low to high
KZThe fitted value calculated based on the model
ACOPay other cash/operating income related to business activities
AnaAThe natural logarithm of the number of analysts who have tracked the enterprise in the past year
SizeThe natural logarithm of total assets at the end of the year
AgeThe natural logarithm of the difference between the current year and the year of listing plus 1
RetConsider the annual individual stock return rate after reinvesting cash dividends
MBThe ratio of the book value to the market value of an enterprise’s assets
CashThe ratio of monetary funds to total assets
ROAThe ratio of net profit to the average balance of total assets
CtrlshareThe shareholding ratio of the controlling shareholder
SupervisorsThe number of supervisors on the supervisory board is taken as the logarithm
DirsizeTake the logarithm of the number of directors on the board of directors
TobinqThe ratio of a company’s stock market value to the replacement cost of the assets represented by the stock
Table 2. Descriptive statistics.
VariableObsMeanStd.MinMax
Misinv33,3043.6224.024−2.27930.477
ESG33,3044.1810.9871.0008.000
Size33,30422.3251.26419.90026.330
Age33,3042.2440.7280.6933.367
Tobinq33,3041.9321.0800.2638.391
Ret33,3040.1200.492−0.9412.428
MB33,3043.7572.2091.23320.744
Cash33,3040.1540.1090.0100.586
ROA33,3040.0360.058−0.2310.197
Ctrlshare33,3040.3600.1480.0750.748
Supervisors33,3041.2270.2361.0991.946
Dirsize33,3041.1360.0620.9591.292
Table 3. Baseline regression results.
Variables(1)(2)(3)
ESG−0.182 ***−0.163 ***−0.125 ***
(−5.90)(−5.47)(−4.22)
Size 0.369 ***0.312 ***
(4.71)(3.81)
Age −2.038 ***−1.454 ***
(−18.40)(−8.80)
Tobinq 0.459 ***0.260 ***
(7.87)(4.43)
Ret −0.488 ***−0.251 ***
(−8.49)(−3.54)
MB 0.0746 ***0.0739 ***
(3.16)(3.14)
Cash −0.1390.200
(−0.38)(0.54)
ROA 4.958 ***4.852 ***
(9.00)(8.83)
Ctrlshare 0.05880.221
(0.13)(0.50)
Supervisors −0.270−0.327
(−1.02)(−1.23)
Dirsize 0.5760.852
(0.73)(1.10)
Constant4.384 ***−0.9680.168
(33.96)(−0.53)(0.08)
Industry fixed effectNoNoYes
Year fixed effectNoNoYes
Observation33,30433,30433,304
R20.0010.0570.073
Note: ***, **, and * are significant at 1%, 5%, and 10% levels, respectively, and the t value is in parentheses.
Table 4. Results of mechanism validation.
VariablesFinancing ConstraintAnalyst Attention
(1)(2)(3)(4)
KZKZAnaAAnaA
ESG−0.159 ***−0.020 *0.040 ***0.025 ***
(−10.87)(−2.07)(8.13)(5.38)
Age 0.070 * 0.247 ***
(2.57) (18.58)
Size 0.206 *** −0.131 ***
(4.25) (−5.91)
ROA 0.140 *** 0.138 ***
(6.74) (16.52)
Ret −0.118 *** −0.059 ***
(−5.67) (−7.13)
MB 0.237 *** 0.010 **
(24.53) (3.05)
Cash −9.049 *** 0.199 ***
(−67.03) (3.86)
Ctrlshare −10.430 *** 1.791 ***
(−41.58) (21.83)
Supervisors 0.092 −0.103
(0.63) (−1.43)
Dirsize 0.064 −0.026
(0.70) (−0.55)
Tobinq −0.283 0.261 *
(−1.17) (2.21)
Constant2.794 ***0.8261.639 ***−3.963 ***
(6.31)(1.23)(17.48)(−12.47)
Industry fixed effectYesYesYesYes
Year fixed effectYesYesYesYes
Observation33,30433,30433,30433,304
R20.1170.5500.0400.134
Note: ***, **, and * are significant at 1%, 5%, and 10% levels, respectively, and the t value is in parentheses.
Table 5. Results of the robustness test.
VariablesRe-Examination of ESG Disclosure TransparencyReplace the Explained VariableAdjust the Sample Period
(1)(2)(3)
MisinvMisinvMisinv
ESG −0.007 ***−0.101 **
(0.001)(0.046)
ESG_Disclosure−8.440 ***
(1.418)
ControlsYesYesYes
Constant2.0626.365 ***−5.347
(2.224)(0.073)(3.442)
Industry fixed effectYesYesYes
Year fixed effectYesYesYes
Observation33,30433,30417,318
R20.0740.9850.055
Note: ***, **, and * are significant at 1%, 5%, and 10% levels, respectively, and the t value is in parentheses.
Table 6. Results of endogeneity analysis.
VariablesInstrumental Variable MethodGMM Dynamic Panel Analysis
(1)(2)(3)
ESGMisinvMisinv
ESG_IV−0.622 ***
(−5.31)
ESG_actual −1.692 ***
(−3.72)
L.Misinv 0.151 ***
(8.29)
ESG −1.152 ***
(−3.07)
ControlsYesYesYes
Industry fixed effectYesYesYes
Year fixed effectYesYesYes
Observation33,27633,27627,679
R20.0450.073-
AR1--0
AR2--0.194
Hansen--0.127
Note: ***, **, and * are significant at 1%, 5%, and 10% levels, respectively, and the t value is in parentheses.
Table 7. Results of heterogeneity analysis.
VariablesProperty Rights Nature HeterogeneityCarbon Emission HeterogeneityEnterprise Scale Heterogeneity
(1)(2)(3)(4)(5)(6)
State-OwnedNon-State-OwnedHigh-CarbonNon-High-CarbonSmallLarge
ESG−0.028−0.210 ***−0.021−0.149 ***−0.206 ***−0.061
(−0.75)(−4.86)(−0.32)(−4.48)(−4.33)(−1.62)
ControlsYesYesYesYesYesYes
Industry fixed effectYesYesYesYesYesYes
Year fixed effectYesYesYesYesYesYes
Observation12,75620,127593927,36516,23417,070
R20.0620.0790.0500.0800.0810.073
Note: ***, **, and * are significant at 1%, 5%, and 10% levels, respectively, and the t value is in parentheses.
Disclaimer/Publisher’s Note: The statements, opinions and data contained in all publications are solely those of the individual author(s) and contributor(s) and not of MDPI and/or the editor(s). MDPI and/or the editor(s) disclaim responsibility for any injury to people or property resulting from any ideas, methods, instructions or products referred to in the content.

