1. Introduction
Determining whether to invest in a startup about to conduct its initial public offering (IPO) presents unique challenges for potential investors. These firms have limited operating histories and less available information than publicly traded companies (e.g.,
Cohen & Dean, 2005;
Lewis-Western, 2008) and generally reach the IPO having yet to reach profitability (
Allen et al., 2023). In addition, accounting and finance studies contend that pre-IPO financial disclosures are less reliable than those of more mature firms (e.g.,
Kim & Ritter, 1999;
Chen et al., 2013). This means that investors must determine the firms’ prospects at a time of high uncertainty with limited information.
This paper examines the information conveyed by IPO firms’ accounting choices with regard to one specific account—the deferred tax valuation allowance. The valuation allowance is a negative accrual that reduces any deferred tax assets (DTAs) to the amount the firm expects it will “more likely than not” realize in the future. For the IPO firms in my sample, the most significant DTA is the benefit provided by their net operating loss (NOL) carryforward. Because this benefit represents a future deduction, the determination to record the allowance stems from whether the firm expects to generate sufficient taxable income to use it. Therefore, if firms record the allowance in a manner consistent with those expectations, its establishment, or lack thereof, should send a strong signal about future performance. However, some valuation allowance decisions may reflect legal restrictions on the use of deferred tax assets rather than a negative assessment of future performance. In particular, the Section 382 ownership change limitation restricts the use of NOLs following changes in ownership structure, which may prompt allowance recognition even when firms expect to be profitable. As such, taking these dynamics into account is important when disentangling the information conveyed by the allowance.
The literature on the valuation allowance choices of non-IPO firms (e.g.,
Miller & Skinner, 1998;
Dhaliwal et al., 2013) shows that the establishment of the allowance relates positively to the size of the past losses and negatively to future income. However, the results from non-IPO firms may not apply to IPO firms. First, the more limited information environment surrounding IPOs gives firm managers more latitude to manage earnings (e.g.,
Teoh et al., 1998a,
1998b). The valuation allowance may be particularly susceptible to this earnings management because the accounting standard specifically allows for managers’ current expectations about future profitability to be considered when determining whether to record the allowance (
Miller & Skinner, 1998). These expectations are inherently hard to verify, creating more room for discretion than with other accruals. As a result, if the IPO increases the opportunity for earnings management, the increased discretion can make the valuation allowance susceptible to bias.
1 In this case, any information content diminishes, and the usefulness of the accrual for investors decreases.
Alternatively, other research proposes that the increased monitoring surrounding IPOs causes firms to report more conservatively (e.g.,
Ball & Shivakumar, 2008;
Cecchini et al., 2012;
Venkataraman et al., 2008;
Armstrong et al., 2015). In this case, auditors might discount managers’ expectations of future profits when deciding to record the allowance (
Bauman & Das, 2004). While this reduces the opportunity for earnings management, it also reduces the potential signal value. If the firm’s prospects change substantially after the offering, then ignoring managers’ expectations could lead to an over-provision of the allowance. This would require a reversal in future periods, again reducing the information conveyed by the account. In this case, investors could have an inappropriately negative view of the firm in the pre-IPO period.
To investigate the effect of these competing dynamics, I examine a sample of 794 firms that received venture capital (VC) financing, reported an NOL carryforward, and conducted their IPO between 1997 and 2008. I first find that the NOLs are substantial, with the deferred benefit equal to 50 percent of the total assets of the average firm. Given the magnitude of the accumulated losses, I further find that, unsurprisingly, most firms record a valuation allowance. Notably, the decision for these firms is not merely whether to record any allowance, but whether to establish a full allowance, eliminating any deferred tax benefits. Of the sample firms, 82% record a full allowance, which is particularly striking because, if recorded correctly, this allowance signals that these firms conduct the IPO with a greater than 50% likelihood that they will generate no taxable income for the foreseeable future. This contrasts with the presumed incentive of IPO managers to depict their firm as positively as possible to potential investors (
Brau & Fawcett, 2006).
I next conduct several tests to ascertain the information conveyed by the allowance. First, I test the extent to which firms’ valuation allowances reflect the requirements of the accounting standards. The standards require that the allowance reflects a firm’s concerns over the generation of sufficient taxable income to use its deferred tax benefits. Therefore, the more the allowance reflects these concerns, the more information it will convey about a firm’s underlying financial condition. Alternatively, if the firms are too conservative or their managers use the allowance to opportunistically report income, then its magnitude should have a weaker relationship with those factors. Consistent with firms recording the allowance in a manner consistent with the accounting standard, I find that the lower the expected future taxable income and the larger the accumulated NOL, the larger the allowance.
Second, I examine whether the valuation allowance predicts book earnings. The lack of a valuation allowance implies the belief that the firm will generate the taxable income needed to use all of its deferred tax benefits. In general, firm expectations about taxable income should mirror expectations of book income. Therefore, if the allowance is recorded correctly, its establishment should send a negative signal about the firm’s future book earnings. I find that the magnitude of the valuation allowance does relate negatively to IPO firms’ accumulated earnings over the subsequent three years. This supports the hypothesis that the full allowance contains information about the IPO firm’s economic fundamentals.
Third, I propose a new explanation for the magnitude of a valuation allowance: a statutory restriction on the deductibility of the NOL generated by substantial changes in ownership. If a firm undergoes a change in ownership of over 50 percent, the law limits the amount of the NOL carryforward it can use, regardless of its level of future taxable income. This limitation is unique because it can cause a firm to record a negative accrual—the valuation allowance—that may not reflect its actual economic situation. Specifically, it may cause the firm to record a valuation allowance even when it expects future profits. I show that the ownership structures of my sample IPO firms, particularly the percentage owned by VCs, make it likely that they will be subject to the ownership change limitation. Furthermore, I find that the expectation of the limitation relates positively to the magnitude of the valuation allowance, incremental to previously proposed factors. I also show that the allowance relates less negatively to future income for firms predicted to be subject to this limitation. This supports the contention that firms record the allowance in anticipation of the limitation, even as some of them anticipate higher income.
This study contributes to the literature in several ways. First, I show that the deferred tax valuation allowance contains significant incremental information for the future operating performance of VC-backed IPO firms. Indeed, my results suggest the allowance is a significant predictor of the performance available to investors in the pre-IPO period. The fact that the choice to record it provides a negative signal for future performance also suggests that, even though the IPO will substantially change firms’ operations, their pre-IPO fundamentals, at least with regard to operating losses, persist.
Second, it contributes to the more general literature regarding the deferred tax valuation allowance. My sample is composed of IPO firms, a group that research into this accrual has ignored. I show that, despite the confounding incentives surrounding the IPO, the firms appear to record the allowance in a manner that reflects their true fundamentals, indicating that income tax disclosures can provide information about loss firms’ future performance (
Dhaliwal et al., 2013). The results also support the literature that finds minimal evidence of the allowance’s use as a tool of future earnings management (e.g.,
Christensen et al., 2008), suggesting that managers may have less discretion when recording the allowance than has been proposed.
Finally, by showing that the establishment of the allowance is consistent with managers considering the ownership change limitation, I demonstrate the importance of considering statutory requirements when evaluating firms’ income tax disclosures. Unlike other accounts, these disclosures are affected by rules determined independently of GAAP. As a result, investors may misinterpret the reported information if the firm does not explicitly disclose the reason for a particular accounting treatment. Considering these laws can enhance the information content of firms’ disclosures and potentially help explain accounting choices that, on the surface, appear surprising.
The paper proceeds as follows:
Section 2 documents the background and the literature regarding IPO firm accounting and the deferred tax valuation allowance.
Section 3 documents the research design, and
Section 4 the data and sample construction.
Section 5 explains the testing and results, and
Section 6 concludes the paper.
3. Hypothesis Development
3.1. Determinants of the Valuation Allowance
Several papers attempt to explain why non-IPO firms record a valuation allowance.
Miller and Skinner (
1998) initiate this literature with their examination of a sample of firms with relatively large deferred tax assets. They model the size of and changes in the valuation allowance as a function of past performance, proxies for expected taxable income and the size of the NOL. They find that the significant predictors for the magnitude of the valuation allowance are the size of the NOL, relative size of the deferred tax liability (DTL) to the DTA, recent past operating performance, and realized future operating performance (though this relation is weak). They interpret the results as indicating that, consistent with the accounting standard, a firm’s biggest concern when recording an allowance is whether it will generate sufficient taxable income to use its NOL carryforward.
Other researchers also examine this question, and their results are generally consistent. For example,
Behn et al. (
1998) find that the size of a firm’s deferred tax liability and recent operating performance relate negatively to the level of the valuation allowance.
Frank and Rego (
2006) find that changes in the allowance relate negatively to changes in deferred tax liabilities and historical financial performance and positively to the size of the NOL.
Christensen et al. (
2008) find similar results, though they do not examine the size of the NOL. More recently,
Goldman et al. (
2024) find that the magnitude of the allowance relates to the accumulated prior losses, the carryback of any NOLs, and taxable temporary differences. In general, research consistently finds that the higher a firm’s deferred tax liability or past and future earnings, the lower the valuation allowance. Conversely, the higher the NOL, the larger the allowance.
Like this literature, I examine the predictive ability of the magnitude of the NOL and firm expectations about taxable income for the magnitude of the IPO firms’ valuation allowances. If a substantial portion of the allowance is recorded in accordance with the requirements of ASC 740, then I would expect firms with larger NOLs and lower expectations of future taxable income to record larger allowances. Alternatively, if the allowance reflects opportunistic managerial reporting or conservatism, I expect these fundamental factors to have a minimal relation to the size of the allowance.
H1A. The magnitude of the deferred tax valuation allowance will be a function of the size of a firm’s NOL carryforward and its ability to generate sufficient taxable income to use the deduction.
Even though this hypothesis resembles those in prior research, those papers have several gaps that this paper helps to address. First, those studies do not include IPO firms. As such, my results help to determine how well the prior findings generalize to these unique firms. Second, as
Hanlon and Heitzman (
2010) point out, most tax research excludes loss firms. As venture-capital-backed IPO firms overwhelmingly generate losses for both book and tax purposes, providing information about the information contained in their valuation allowances will help to determine the information content of tax accruals for loss firms. Finally, prior research does not test for whether firms consider the ownership change limitation when recording the valuation allowance. I discuss the details of the limitation in the subsequent section.
3.2. Section 382 Ownership Change Limitation4
The ability to deduct an NOL will be limited by two factors: (1) the expiration of the unused deduction due to a lack of future taxable income in the statutorily allowed period and (2) a qualifying ownership change in the firm. Section 382 of the Internal Revenue Code defines the rules for the second restriction. The justification for the deduction limitation is to prevent loss trafficking, that is, profitable taxpayers acquiring companies with NOL carryforwards for the sole purpose of utilizing the tax losses against other taxable income.
A qualifying change occurs when, after any change in the company’s equity structure, (1) the corporation undergoes a reorganization as per IRC Section 368 (with some exceptions), including most mergers and acquisitions, and (2) the percentage stock of the corporation with the NOL carryforward (loss corporation) owned by one or more 5-percent shareholders has increased by more than 50 percentage points during the three-year testing period.
The first class of change is relatively straightforward. If a company undergoes a substantial reorganization or is acquired, it will generally be considered to have undergone a qualifying change, and the ability to deduct the NOL going forward will be limited. In contrast, a variety of transactions can trigger the second class of change. These include the issuance of a new class of stock, the conversion of debt to equity, or the liquidation of holdings by shareholders.
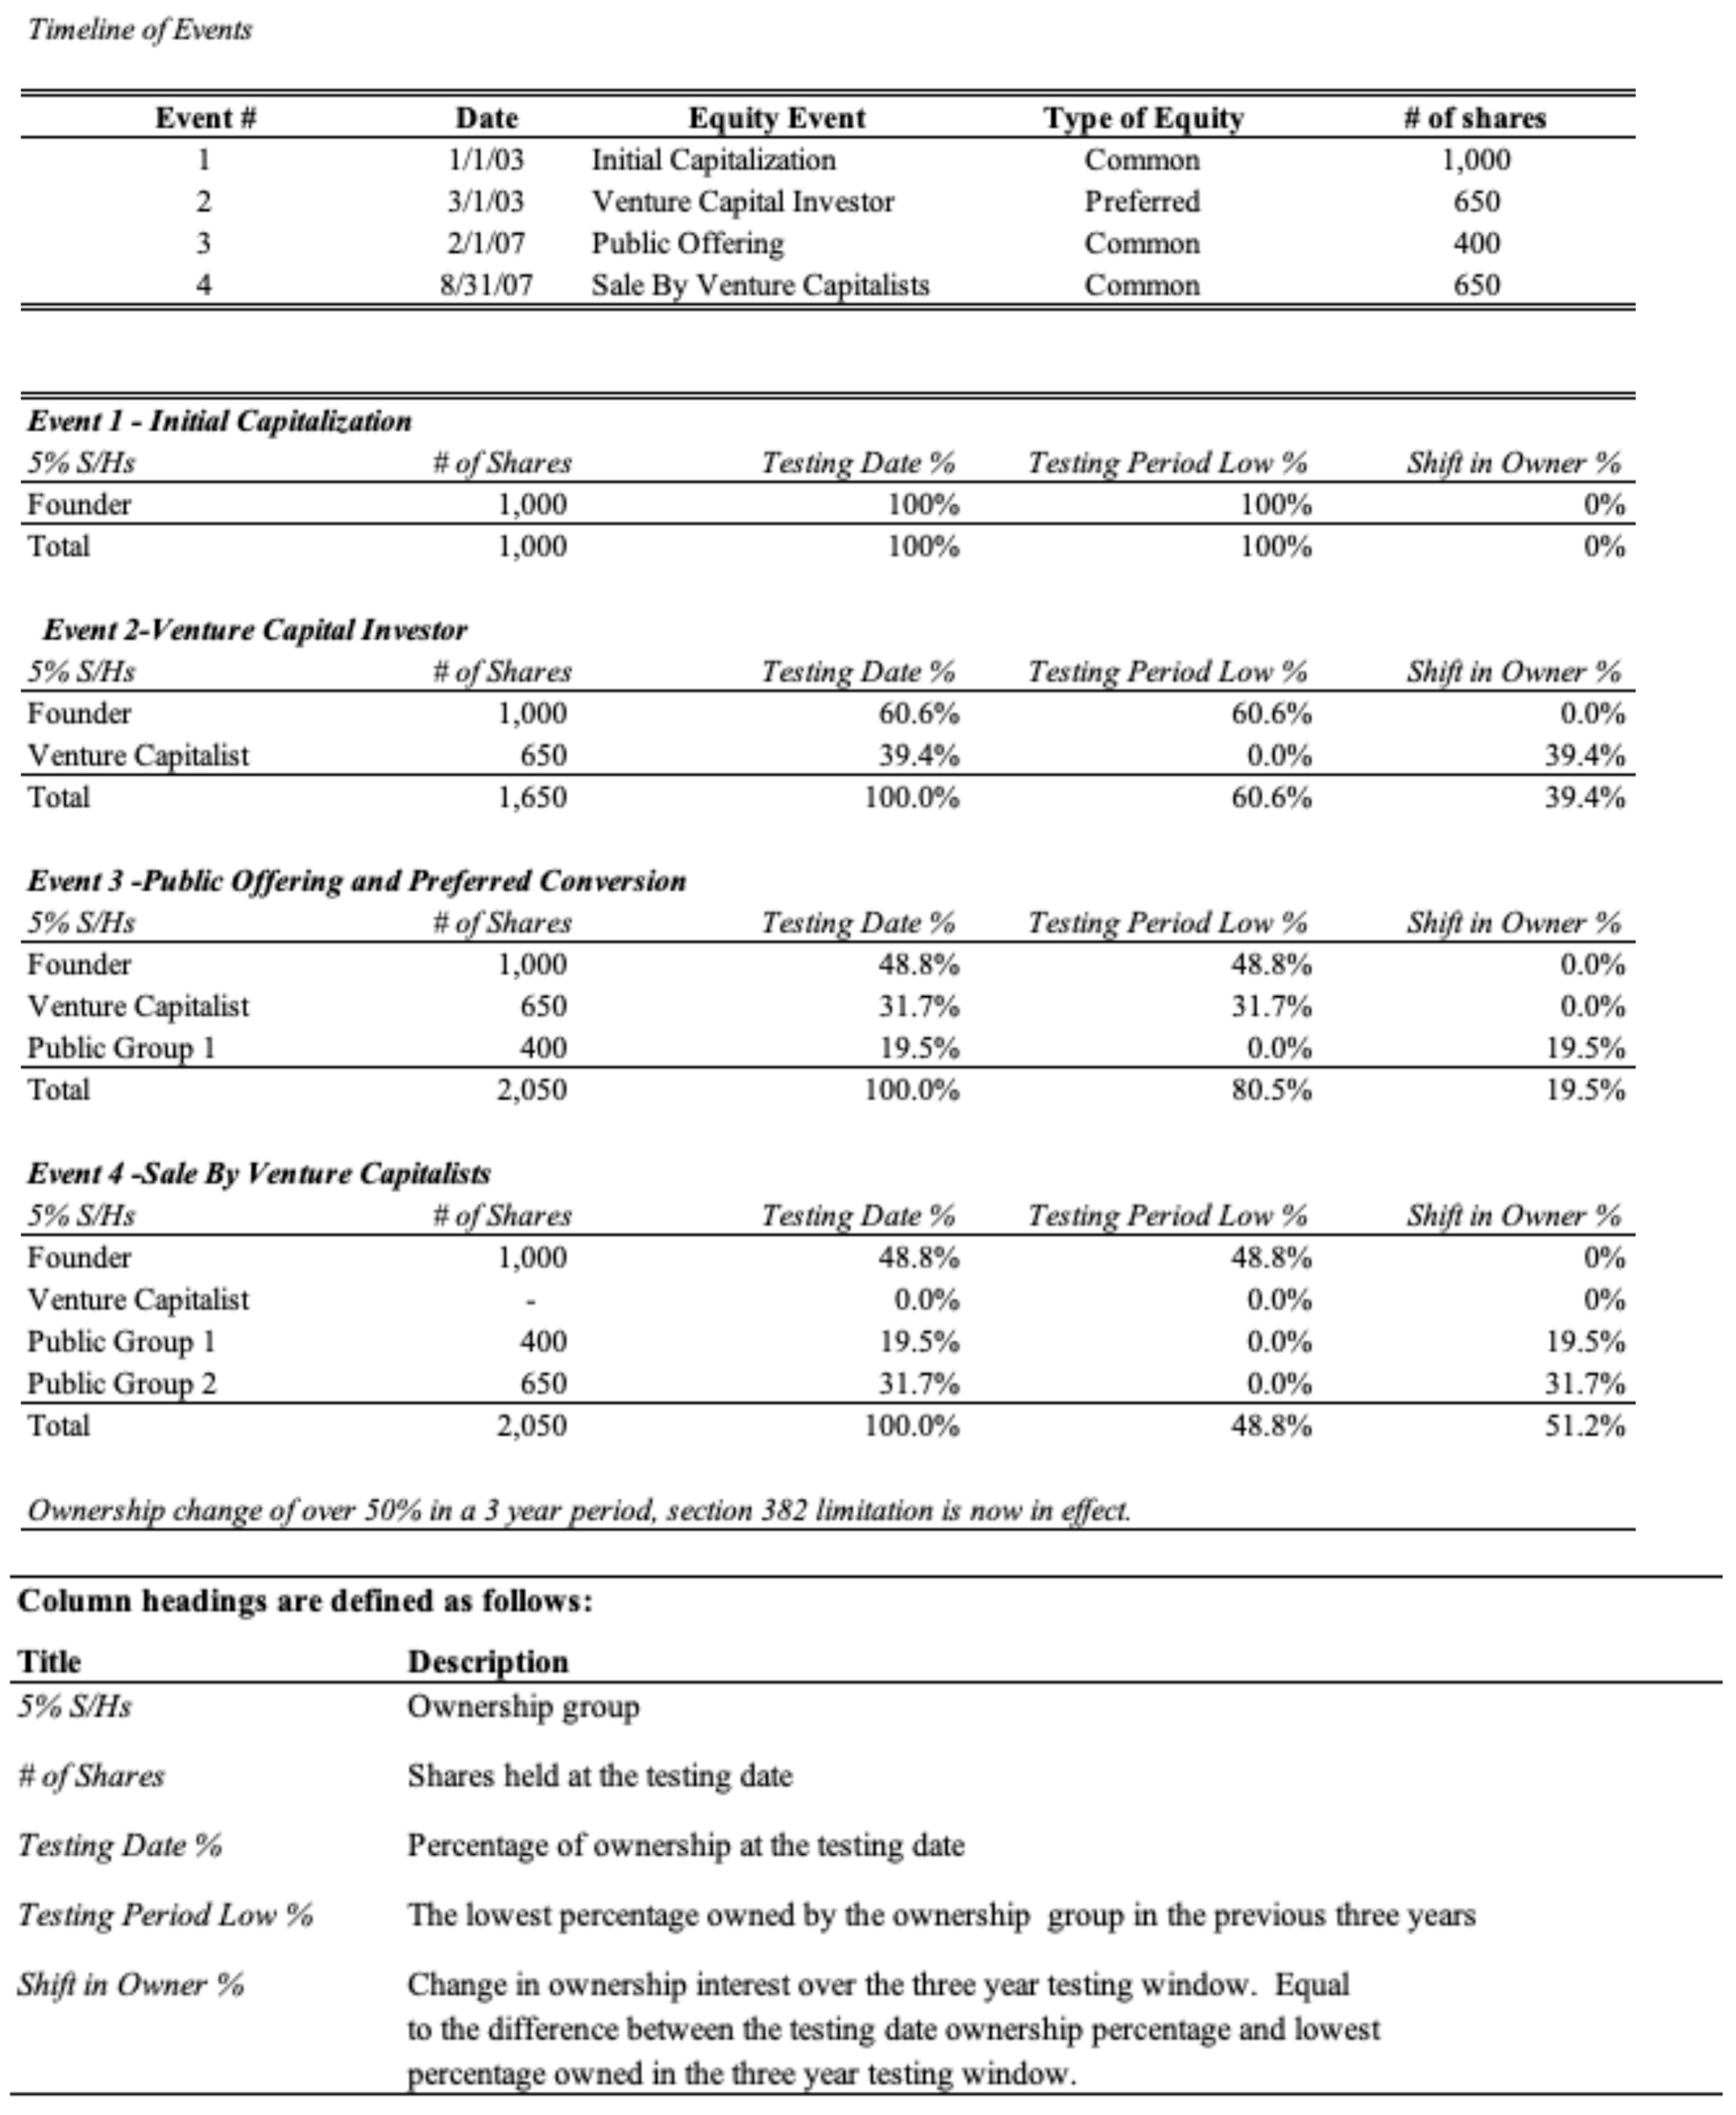
Figure 1 shows an example of a hypothetical IPO firm. First, the firm sells 39.4 percent of its shares to a venture capitalist two months after formation and then another 19.5 percent in an IPO four years later. Even though there has been an increase of over 50% by one or more 5% shareholders (the VC and IPO shareholders go from 0 to a total of 51.2%), this does not trigger the ownership change since the VC investment occurred prior to the start of the three-year testing window. However, once the venture capitalist liquidates his or her shares on the open market six months later, the shift in ownership exceeds 50 percent for the testing period, as the total increase in ownership of the public shareholder groups has gone from 0 to 51.2% in a three-year period.
5 The deductibility of the firm’s NOLs, accumulated immediately prior to the change, is now subject to the Section 382 limitation.
IRC Section 382(a)(1) states the rules determining the amount of the limitation:
The Section 382 limitation for any post-change year is an amount equal to:
- (A)
The value of the old loss corporation, multiplied by
- (B)
The long-term tax-exempt rate.
6
IRC Section 382(e)(1) states that the value of the loss corporation is the value of its stock immediately prior to the ownership change (with some exceptions). In practice, a company will multiply its fair market value preceding the ownership change by the appropriate long-term rate. For example, if a firm has a market value of USD 200 million immediately prior to an ownership change—and the applicable rate is 8.3 percent—then the annual limitation on the deductibility of the NOLs accumulated prior to the change is USD 16.3 million. If the firm does not generate enough income in a given year to use the allowed deduction, the unused portion accrues and carries forward to increase the allowable deduction in the subsequent year.
7This discussion reinforces the idea that the deferred benefit from the NOL carryforward will most likely be limited—but not lost—if a qualifying ownership change occurs. If the firm anticipates this limitation, then the likelihood it will record a valuation allowance will increase. Therefore, controlling for this expectation should help predict the allowance’s magnitude.
H1B. A firm is more likely to record a valuation allowance if it is predicted to be subject to the ownership change limitation.
3.3. Deferred Tax Valuation Allowance as a Signal of Future Performance
Research of non-IPO firms generally finds that the allowance sends a negative signal for future performance. For example,
Jung and Pulliam (
2006) examine whether changes in the magnitude of the valuation allowance predict earnings and cash flows.
Bakke et al. (
2023) find that the allowance is positively associated with auditor’s going concern opinions and the probability of a firm declaring bankruptcy.
Dhaliwal et al. (
2013) perform the first large-sample test of the information in the tax disclosures of non-IPO loss firms. They classify firms into good and bad news categories based on whether a firm has taxable income or an NOL or if it discloses a change in its valuation allowance. Given the high cost involved with hand-collecting the changes in the valuation allowance from the balance sheet, the authors use changes in the deferred tax expense account as a proxy.
8 They find that, if a firm records a valuation allowance, it has information about loss-persistence for up to three years. More recent research confirms the relationship between the valuation allowance and future performance (
Axelton et al., 2025;
Bakke et al., 2023;
Edwards, 2018;
Finley & Ribal, 2019;
Goldman et al., 2024) and suggests that investors react to that information (
Bauman & Das, 2004;
Amir & Sougiannis, 1999;
Kumar & Visvanathan, 2003), though not always promptly.
Consistent with this research, I predict that the magnitude of the valuation allowance will relate negatively to future income for the average firm in my sample. In addition, as discussed later, since the IPO firms overwhelmingly book either a full valuation allowance or a minimal one, it should be a particularly strong signal of future profitability.
H2A. The larger the deferred tax valuation allowance, the more likely it is to be associated with lower future book earnings it sends for future book earnings.
I next consider whether controlling for the anticipation of the ownership change limitation can enhance the predictive ability of the valuation allowance for future income. A key feature of this limitation is that its anticipation could cause managers to record a valuation allowance, regardless of their expectations of profitability. If financial statement users or researchers do not consider this possibility—and the firm exhibits higher income after recording the allowance—then the previously documented negative relation between the allowance and future income weakens. Therefore, after controlling for firms subject to the ownership change limitation, the negative signal conveyed by the allowance for the non-ownership-change firms should strengthen.
H2B. The relation between the valuation allowance and future book earnings weakens for firms subject to the ownership change limitation.
4. Data and Sample Selection
Table 1 documents the construction of the sample. From the Thomson Financial Services Database (i.e., Securities Data Company or SDC), I collect a listing of all firms that received venture capital financing and conducted an IPO in the United States between 1996 and 2008. This results in the identification of 1420 firms. I focus on these firms for several reasons. First, VC-backed IPO firms are likely to be more successful than non-VC-backed IPO firms (
Puri & Zarutski, 2012;
Morse & Allen 2016), and, as such, they hold greater interest for potential investors. Second, they have better accounting (
Morsfield & Tan, 2006). This means that, if their financial disclosures are uninformative, it is likely that the disclosures of presumably lower-quality, non-VC-backed startups will be even less informative. Third, they typically generate losses (
Allen et al., 2023), which means they are highly likely to have to determine whether to record a valuation allowance. Finally, the presence of VCs is a key component of my testing for the ownership change limitation (discussed in detail later).
I begin the sample period in 1996, due to the limited availability of electronically filed prospectuses in the EDGAR database prior to that year, and end it in 2008, due to the fact that most of the key variables of interest have to be hand-collected. From the SDC database, I obtain each firm’s name, CUSIP, and stock issue date. I use the CUSIP to match firms with their financial records in the 2011 version of the Compustat fundamental annuals database.
9 I eliminate all firms that do not have their prospectus available on EDGAR. For the remaining firms, I review the prospectus and hand-collect the gross deferred tax asset, the gross deferred tax liability, the amount of the deferred tax asset associated with the NOL, the magnitude of the valuation allowance, and the net deferred tax asset (liability) for the last audited fiscal year prior to the IPO. I eliminate firms that do not report an NOL, foreign issuers, and firms with insufficient deferred tax details. For final inclusion in the sample, I also require that a firm have the required financial information identified in Compustat to perform my tests, as well as sufficient information in the prospectus to calculate my proxy for the ownership change limitation. This leaves 794 observations for testing.
While the focus on this sub-sample of venture-capital-backed IPO firms between 1997 and 2008 introduces limitations regarding generalizability, this approach is necessary due to the extensive hand-collection required to identify the valuation allowance and the Section 382 ownership change limitation from IPO prospectuses. Despite these constraints, the core dynamics observed in this sample remain highly relevant. VC-backed firms continue to be technologically intensive, likely to generate NOLs (e.g.,
Allen et al., 2023), and have concentrated ownership structures, making them the ideal setting to study the effects of the Section 382 limitation. In addition, while recent regulatory changes like the TCJA have changed the details regarding the NOL rules, the basic framework is still the same as in my sample period. Therefore, while the economic and regulatory environment has evolved, the fundamental issues explored in this paper persist. Nevertheless, given this limited sample period, the generalizability of the findings should be interpreted with caution.
5. Research Design
5.1. H1 Testing: Determinants of the Valuation Allowance
To test Hypothesis 1A, I use the following model:
where
Magallowdtat = [Magnitude of the deferred tax valuation allowance at time t]/[
DTAt −
DTLt]
10;
DTLt = the firm’s deferred tax liability scaled by gross deferred tax assets at time t;
NOLDTAt = the portion of the deferred tax asset associated with the NOL scaled by the gross deferred tax asset at time t;
FUTINC =
, where
INCt+k = net income at time t + k (Compustat item NI)/assets in t + k (item AT)
11;
INDUST = industry dummy by one-digit SIC code;
YEAR = year controls for the evaluation year—the last audited fiscal year prior to the IPO.
Following prior research, I include
DTLt as a proxy for management’s expectation of taxable income. If a firm has temporary differences that result in financial statement income being higher than taxable income for a given period, it must record a deferred tax liability (
DTL) that reflects the estimated future taxes due. As noted by
Behn et al. (
1998), since the
DTA represents future tax deductions and the
DTL represents future taxable income, the larger the
DTL in relation to the
DTA, the greater the likelihood that the firm should be able to generate sufficient taxable income to use the
DTAs. Therefore, I expect that as
DTLt increases, the magnitude of a firm’s valuation allowance decreases.
My second proxy for management’s expectations of taxable income is the sum of the actual realized book income for the next three years—
FUTINC. I note that
FUTINC, which captures realized book income, is only an imperfect proxy for the future taxable income relevant to valuation allowance decisions. IPO firms often undergo significant operational and structural changes after issuance, and auditors may discount managerial expectations when evaluating the realizability of deferred tax assets. Accordingly, the economic magnitude of FUTINC’s association with allowance magnitude is expected to be limited. But as
Miller and Skinner (
1998) show, it predicts whether a firm records a valuation allowance. As with
DTLt, I expect that the larger the realized future income, the less likely the firm will be to record a full allowance.
The final predictive variable I include from the literature is
NOLDTAt. This is the portion of the deferred tax asset generated by the NOL carryforward, scaled by the total DTA. As shown elsewhere (e.g.,
Miller & Skinner, 1998), the size of the NOL is a prime determinant for whether a firm records a valuation allowance. The greater the NOL, the higher the uncertainty over the firm’s ability to use the deduction. Therefore, I predict that the larger
NOLDTAt, the more likely a firm will be to record a valuation allowance.
The one common predictor from the literature that I do not include in this model is recent past earnings. Since my evaluation period is the last audited fiscal year prior to IPO, Compustat does not consistently provide income information for previous years. As a result, inclusion of that variable would significantly limit the size of the sample available for testing. However, the other variables should serve as a reasonable proxy for this information. NOLDTAt, in particular, should be highly correlated, as it is a proxy for the magnitude of accumulated past tax losses.
To test Hypothesis 1B, I use the following model:
where
I include an indicator variable (Ownlimit) equal to 1 if a firm’s ownership structure predicts that it will undergo a qualifying ownership change. For the purposes of Section 382, I consider the IPO as the beginning of the three-year testing period. Over the next three years, if there is a qualifying ownership change, the firms will be subject to the limitation on the NOLs accumulated to that point. I make this distinction based on information about the firms’ ownership structures disclosed in their financial disclosures made immediately prior to their public offerings (discussed below). If my hypothesis is correct and firms consider the limitation when recording the allowance, then I would expect the indicator variable to relate positively to the magnitude of the valuation allowance.
5.2. H2 Testing: Deferred Tax Valuation Allowance as a Signal of Future Performance
To test Hypothesis 2A, I examine the relationship between the magnitude of the valuation allowance and future earnings. Since the net operating loss can be used over many subsequent years, the signal conveyed by the valuation allowance should extend over multiple periods.
Jung and Pulliam (
2006) find that an increase in the valuation allowance has a negative relationship with income for up to two years.
Dhaliwal et al. (
2013) find that their proxy of a loss firm’s non-increase of the allowance after the incurrence of an NOL has a positive relationship with income for up to five years. As such, I examine the relation between the magnitude of the valuation allowance at the year prior to issuance and income for the subsequent three years.
12The test is performed using the following model:
The variables are defined as above.
I use
FUTINC as the dependent variable since the accumulation of future earnings should better depict the overall long-term effect than annual regressions. This approach resembles that of
Hayn (
1995), where the use of aggregate earnings reduces some of the noise in year-by-year regressions.
13 In addition, the use of net income is important because it will capture any future reversals of the allowance. As discussed previously, if firms use the account to manage earnings, then the reversals will be biased against me finding the predicted result.
I scale by total end-of-the-year, rather than average or beginning-of-the-year assets, since, as mentioned earlier, for the majority of my sample, Compustat does not consistently provide data for year t − 1 (the fiscal year prior to the fiscal year prior to IPO). This lack of data is also the reason I include only two variables in the model. Hypothesis 2A predicts that the coefficient on Magallowdtat is negative and significant.
To test Hypothesis 2B, I run the following regression—which adds the interaction term for the ownership change group:
The variables are defined as above.
If Hypothesis 2B is correct and managers anticipate the qualifying ownership change and record a valuation allowance, even when anticipating higher future income (or lower loss persistence), then I would expect β3 to be positive and significant.
5.3. Construction of the Ex Ante Measure of Qualifying Ownership Change
To determine whether managers establish a valuation allowance in anticipation of the Section 382 limitation, I create an ex ante measure of a qualifying ownership change. Since, by design, all of the sample firms receive VC financing, I have an obvious starting point. VCs are subject to lockup provisions that typically last 180 days. These prohibit them from selling shares prior to the agreement’s expiration. Research, including that of
Field and Hanka (
2001) and
Bradley et al. (
2001), has shown that venture-backed IPO firms exhibit negative abnormal returns at the expiration of the provisions. This is consistent with VC shareholders selling much of their holdings at that time. When these findings are combined with the fact that VC investors will not typically realize income until they liquidate their holdings, it is reasonable to assume that the sample firms’ VC shareholders will generally sell their holdings within three years of the IPO date. Additionally, if the VC shareholders bought into the firm less than three years prior to the IPO, then the IPO itself could trigger the limitation.
The sample firms also have other institutional owners who control more than 5 percent of their shares after the completion of the IPO. This group is predominantly composed of public equity firms, other publicly traded companies, governmental entities, or trusts. If these shareholders also liquidate their holdings soon after IPO, their presence could increase the likelihood of a firm being subject to the ownership change limitation. To obtain an idea of the liquidation behavior of the other institutional shareholders and to confirm the conjecture that VC shareholders quickly dispose of their holdings, I examine the liquidation behavior of all 5-percent shareholders for 40 randomly selected sample firms. Of these firms, 39 have at least one VC as a 5-percent owner, and 13 have at least one other institutional 5-percent owner. This is a proportion consistent with the sample as a whole, where 792 firms have at least one 5-percent VC owner and 332 have at least one other institutional 5-percent owner. For these firms, I review the statement of beneficial ownership from their proxy statements for the subsequent three years to determine the actual change in ownership.
14From this analysis, I observe that, consistent with prior theory, the median (mean) VC shareholder liquidated 100 percent (73 percent) of its holdings in the three years after the IPO. Additionally, the median (mean) other institutional owner sold 100 percent (91 percent) of its holdings in that period. This indicates that these other institutional owners will also likely liquidate most of their holdings in the testing period.
The final confirmation I require before the construction of the measure is evidence that the IPO firms are aware of the possibility of a qualifying change in ownership. A review of the tax disclosures indicates this is the case. Six hundred and thirty firms include verbiage in the deferred tax note indicating the possibility of a qualifying ownership change.
I obtain the following information from the firms’ prospectuses:
- (i)
The percentage of shares sold at the IPO.
- (ii)
The total percentage of the firm’s shares to be owned by VCs and other institutional 5-percent owners after the offering. This information is reported in the statement of principal stockholders.
15
If the sum of the two amounts exceeds the threshold amount, I classify the firm as anticipating a Section 382 ownership change. I use three thresholds to test the hypothesis: 50, 60, and 70 percent. The more concentrated a firm’s ownership, the higher the likelihood that it will be subject to a qualifying ownership change (as the liquidation of a single shareholder would increase the chance of it triggering the change). As a result, I would expect the strength of the relationship between the variable and the magnitude of the allowance to increase as the threshold increases.
Note that this is a noisy measure of a firm’s expectation of a qualifying ownership change and, as such, will bias against finding the predicted result. Even if firms are considering this limitation when recording the allowance, the liquidations of the various 5-percent shareholders will still vary. In addition, the firms are likely to have better information about the possible actions of specific shareholders when they record the allowance, including whether they are subject to lock-up provisions that extend beyond three years. Since I cannot take this information into account, my measure will not completely reflect the managers’ actual expectations regarding the ownership change. However, given the previously documented behavior of VCs and the observed behavior of the other 5-percent investors in my random draw, I believe that, on average, this measure captures the likelihood of a firm being subject to the limitation.
6. Results
6.1. Descriptive Statistics and Correlations
Table 2 presents the descriptive statistics for the entire sample. Panel A reflects the industry breakdown by two-digit SIC codes.
16 Most (56 percent) of the sample firms cluster in two industries—business services/software and chemical and allied products. These are technologically intensive industries that often require significant upfront expenditures for R&D. This is confirmed in Panel B, where 81 percent of the sample (
RDPres) report R&D expenditures greater than zero in the evaluation year. These expenditures are also material—on average, 33 percent of total assets (
RDItent). The significant R&D expenditures contribute to the prevalence of the current ((
INCt) of (0.50)) and future ((
FUTINC) of (0.95)) losses in the sample.
Panel C presents the deferred tax information for the sample firms. These firms generate significant deferred tax assets (DTAt of 0.63), which are predominantly composed of the deferred benefit from accumulated NOLs (NOLDTAt of 0.73). This ratio is important because it illustrates that, if firms are properly recording the allowance, they are doing so primarily in anticipation of a lack of deductibility of the NOL and not for other temporary differences. In addition, the lower the proportion of the NOL to the total asset, the less likely the allowance is attributable to concerns about the ownership change limitation.
Eighty-two percent of sample firms record a valuation allowance fully valuing out the deferred tax asset (
Fullallowt). The magnitude of the allowance is significant, 61 percent of total firm assets (
Magallowassetst) on average, and illustrates the strong effect its establishment has on a firm’s reported income. Note, too, that the magnitudes of these deferred tax accounts are substantially higher than the literature has found. For example,
Miller and Skinner (
1998) show that the DTA is on average 10 percent of the total assets, and the NOL is 14 percent of the gross DTA. This demonstrates that IPO firms, on average, generate significantly larger NOLs than more mature firms and reinforces how examining these firms should provide new information for research into the determinants of the valuation allowance.
Panel D shows the relevant ownership information. Depending on the threshold, the number of firms with ownership structures that predict they will be subject to the ownership change limitation ranges from 73.0 percent (Ownlimit50) to 37.0 percent (Ownlimit70). Even with the most restrictive threshold (Ownlimit70), the number of firms predicted to be subject to the limitation is substantial, reflecting the fact that most of the sample firms have concentrated ownership structures. VCs (FiveperVC) own 30.9 percent of the mean firm, and their anticipated liquidations after IPOs drive the likelihood of the ownership change. The other institutional owners (FiveperOther) are not as prevalent, owning on average 7.3 percent of the sample firms.
Panel E documents the survival outcomes for the sample firms based on the CRSP delisting codes as of 31 December 2011. Only 33.5 percent of the sample is still active on that date, with most of the firms having been subject to a merger (43.5 percent). This is unsurprising, given the high level of current and future losses exhibited by the sample firms. Merging may be the only way they can maintain operations. In addition, only 21.4 percent of the sample delist for performance-related reasons, including bankruptcy. When compared to the percentage of the sample that records a full allowance (82 percent), this suggests that the recording of the allowance might be conservative for some firms.
Table 3 partitions the sample based on whether a firm records a full valuation allowance.
17 It reports the mean values for each of the relevant variables. Panel A documents that firms recording a full allowance are significantly more likely to operate in the business service/software and chemicals and allied products industries. As previously mentioned, these industries require substantial investments in R&D. This is confirmed in Panel B. The firms that record a full allowance are both more likely to report R&D expenses (
RDPres of 0.87 versus 0.53) and to spend at a higher intensity (
RDIntent of 0.38 versus 0.11). The full-allowance firms are also smaller (
Assetst of USD 33.13 million versus USD 214.30) and report poorer performance in both current (
INCt of (0.60) versus (0.05)) and future periods (
FUTINC of (1.13) versus (0.11)). There is no significant difference between the groups in the use of a Big Five auditor (
Big5),
18 reflecting the uniformity of this treatment across audit firms.
19 Panel C reports the mean values of the deferred tax variables for the two groups. Predictably, the full-allowance firms have significantly larger DTAs and NOLs, both as a percentage of total assets (NOLAssetst of 0.58 versus 0.14) and gross DTA (NOLDTAt of 0.77 versus 0.57). They also have significantly smaller deferred tax liabilities (DTLt of 0.03 versus 0.50). This information is consistent with Hypothesis 1A, which predicts that the larger a firm’s NOL and the smaller its expectations of future taxable income, the larger the magnitude of its valuation allowance.
Panel D presents the ownership variables. There is no significant difference between the two groups in the number of firms predicted to be subject to the ownership change limitation, regardless of threshold. There is also no significant difference in the ownership percentage of venture capital and other institutional shareholders (though there is a slight difference in the amount sold at IPO).
Finally, Panel E documents the difference in survival outcomes between the two groups. Consistent with their superior reported performance, firms that do not record a full allowance are significantly more likely to remain active at the evaluation date (44.6 versus 31.1 percent). Conversely, the full-allowance firms are more likely to delist for reasons of performance (22.9 versus 13.7 percent). Even though the full-allowance firms are more likely to fail, the percentage that cease operation is still substantially less than the number that record a full allowance implies.
In untabulated results, I also compare the mean values of the variables for the sample partitioned based on whether a firm is predicted to be subject to an ownership change. Regardless of the threshold used, the differences in size and current period income are insignificant for the two groups. The rate at which they record a full allowance (as well as the size of the allowance) also differs only marginally. In addition, differences in the size of the gross deferred tax asset, its components, and the allowance itself are minor. This indicates that, after the partition, the firms all start at a similar point at time t. However, the group categorized as recording an allowance due to anticipation of the ownership change limitation exhibits higher future income. This difference is significant and supports the idea that some of these firms may be recording an allowance even though they anticipate a rise in earnings.
Table 4 presents the correlation matrix for the variables under analysis. In the interest of parsimony, I only report the correlations for total assets and the variables used in the regression analysis. I also only report the correlations with one of the ownership change variables—
Ownlimit50. The correlations with the other ownership change thresholds are similar. Current period income (
INCt) relates positively to future income (
FUTINC), and, consistent with expectations, the valuation allowance (
Magallowdtat) relates negatively to income in all periods. The magnitude of the valuation allowance is positively related to the size of the NOL (
NOLDTAt) and negatively to the relative size of the deferred tax liability (
DTLt) and future income (
FUTINC). The allowance does not correlate significantly with whether a firm is predicted to be subject to a qualifying ownership change (
Ownlimit50).
6.2. Prediction of the Magnitude of the Valuation Allowance
Table 5 presents the results of the accrual prediction testing. The standard errors are reported in parentheses below the coefficient estimates. Columns 1–3 show the results of the testing of Hypothesis 1A. The magnitude of the valuation allowance is strongly negatively related to the size of the deferred tax liability and realized future income and positively to the size of the NOL. The results are economically and statistically significant and are consistent with the hypothesis that this accrual is driven by concerns regarding firms’ ability to generate future taxable income.
The relatively low economic significance of FUTINC (−0.03) in predicting the allowance is consistent with several dynamics: post-IPO firms experience substantial operational changes, auditors may limit reliance on subjective forecasts, and book income is an imperfect proxy for taxable income. When compared to the greater predictive strength of DTLt (−0.32) and NOLDTAt (0.31), it may also suggest that, when deciding to record an allowance, auditors are relying more on currently available evidence (in particular a recent history of losses) as opposed to any expectations of taxable income.
Columns 4–6 present the results of the tests of Hypothesis 1B. The coefficients on
Ownlimit are all as predicted, and the significance increases as the cutoff threshold increases (
p-value of 20 percent for the 50-percent threshold versus less than 5 percent for the 60- and 70-percent thresholds).
20 Note that the ownership change limitation has relatively low economic significance when it comes to predicting the magnitude of the allowance (coefficient of 0.04 for the 60- and 70-percent thresholds). This result is expected, given the high frequency of the full allowance in the sample. As mentioned earlier, if a firm is subject to an ownership change, it will only limit the amount of the deduction, not eliminate it. Therefore, if a firm anticipates it will be subject to limitation but will generate future taxable income, it should only record, at most, a partial allowance.
Given this dynamic, the results indicate that, in effect, the anticipation of a qualifying ownership change is one more piece of negative evidence that is being taken into account by these firms, incremental to the other explanations. While conservatism may contribute to this tendency to record a full allowance, the requirements of the accounting standard appear to explain the majority of the allowance’s magnitude.
6.3. Income Signal Tests
Table 6 presents the test results of the relationship between the magnitude of the valuation allowance and future income. Regression 1 shows the full sample results. As predicted by Hypothesis 2A and consistent with the previous results, the magnitude of the valuation allowance relates significantly negatively to accumulated future income over the next three years. The coefficient of
Magallowdtat is −0.75, which supports the idea that the valuation allowance sends a negative signal for future income. This is consistent with the prior finding that managers are recording the allowance due to concerns over the future deductibility of the NOL.
Regressions 2–4 show the results after controlling for the allowance’s signal after partitioning on whether the firm will be subject to the ownership change limitation. As predicted, the coefficient on the interaction term is economically and statistically significant. It indicates that firms that record a valuation allowance while also anticipating a qualified ownership change will have higher future income (by a factor of 0.24 for the 70-percent threshold) than those that do not anticipate a change. In addition, the coefficient of Magallowdtat becomes significantly more negative (−0.75 to −0.95 for the 60-percent threshold) after controlling for this effect. Taken together, these results suggest that some firms record a valuation allowance in anticipation of the qualified ownership change, despite anticipating higher future income. After accounting for these firms, the negative relationship between the valuation allowance and future earnings intensifies.
6.4. Robustness Checks
To determine the robustness of my findings, I perform a series of additional tests. First, I determine whether alternative specifications affect the findings. Second, I use an alternate measure of ownership change.
6.4.1. Ex Ante Prediction of the Magnitude of the Allowance
I first evaluate how the accrual prediction results hold if I use only ex ante predictors of the magnitude. Given FUTINC’s limited explanatory power, I also re-estimate the model excluding it from the set of predictors. As expected, the results for other variables persist. This further reinforces the interpretation that auditors emphasize currently observable evidence, such as accumulated losses, over forward-looking projections when assessing allowance magnitude.
6.4.2. Removal of Firms That Fail
The sample is composed of many firms that cease operations. Their presence could affect the results in two ways. First, they may be muting the significance of the ownership change variables. If a firm’s managers anticipate failure, then they should give no consideration to the ownership change limitation. (The NOL will be lost, regardless of whether a change occurs.) Second, these abnormally poor performers may drive the income signal results, as they amplify the observed negative relationship between the valuation allowance and realized future income.
I re-run all tests after removing firms that are classified as having delisted for performance reasons (survival outcome coded as Performance). The results are consistent with the prior tests. More interestingly, the economic and statistical significance of Ownlimit increases across all thresholds—though it is still a marginal predictor. The increase in significance of Ownlimit in this specification indicates that some managers may be entering the market expecting there to be a greater than 50-percent chance that their firm will cease operations and so record the allowance without consideration of the ownership change limitation. The income signal results are also unaffected by the removal of these firms. As a result, I conclude that these poor performers are not driving the relationship between the magnitude of the valuation allowance and future income.
6.4.3. Ex Post Measure of the Ownership Change
I re-run the tests using an ex post measure of the ownership change limitation—whether a firm merges. Given that the overwhelming majority of firms at IPO are generating significant losses, they may anticipate being acquired to maintain their future operations. If so, they should record an allowance anticipating the future ownership change limitation.
The results for the main predictive variables endure, and the ex post measure of the change relates positively to whether they record a valuation allowance. The results of the income signal testing using the new measure are also consistent with the previous results. As before, firms that are subject to the ownership change and increase their valuation allowance have higher future income than the corresponding firms not subject to a change. Both of these results seem to indicate that some firms are recording the allowance, at least partially, in anticipation of mergers. When this is combined with the earlier results for the removal of the failed firms, it indicates that how a firm records a valuation allowance might help predict IPO firm survival outcomes. Future research should focus on obtaining a clearer picture of this relationship.
7. Conclusions
I examine the information conveyed by the deferred tax valuation allowance for a sample of VC-backed IPO firms. These firms overwhelmingly record a full valuation allowance, which is often the largest single accrual on their balance sheets. The full allowance implies that there is a greater than 50% expectation that the firm will not generate any future taxable income. The findings suggest this expectation is largely justified, as firms with a full allowance are significantly more likely to exhibit lower future operating performance. The results suggest that the accounting treatment generally reflects the fundamentals of the IPO firms.
These results make several contributions to research on IPO firm accounting. First, the prevalence of the full allowance is inconsistent with research suggesting that IPO firm managers exploit the increased information asymmetry of the IPO to manage upward their firms’ earnings prior to IPO. Second, the negative signal sent by the full allowance suggests that the accounting system and increased scrutiny surrounding the IPO cause the firms to report the accrual correctly. This is consistent with research suggesting that the litigation risk surrounding the IPO causes managers to ignore the incentive to manage earnings (e.g.,
Ball & Shivakumar, 2008) and increases the information content of the valuation allowance.
This study also contributes to the more general research into the valuation allowance by examining the accounting of a group of firms generally ignored in the literature—IPO firms. The results suggest that the allowance reflects information about these firms’ fundamentals and that the managers do not exploit its discretion to manage future earnings. They also support the literature contending that income tax disclosures can provide information about the future operations of loss firms (e.g.,
Dhaliwal et al., 2013).
This is also the first paper to consider the Section 382 ownership change limitation as an explanation for the valuation allowance. The results of this study indicate that VC-backed IPO firms appear to consider the limitation when recording the accrual and that taking it into account enhances the information it conveys. Future research should focus on other potential tax laws that could similarly affect financial reporting. This could help investors disentangle the information conveyed in the tax accounts and potentially enhance the results from prior research.
Finally, I acknowledge that the sample ends in 2008 and predates key regulatory changes, such as FIN 48 and the Tax Cuts and Jobs Act. While the sample design was necessary due to hand-collection constraints, these results should be interpreted in light of that limitation. Future research should focus on other potential tax laws that could similarly affect financial reporting. This could help investors disentangle the information conveyed in the tax accounts and potentially enhance the results from prior research.


