1. Introduction
A loan is classified as non-performing when the borrowers do not pay the interest or principal for 90 days or longer (
Monokroussos & Gortsos, 2017). Banks are experiencing significant consequences due to the lack of profitability of these loans, which requires the creation of higher reserves to address it. The accumulation of non-performing loans (NPLs) increases a bank’s credit risk, which results in heightened regulatory examination and sanctions (
Lawrence et al., 2024). Management’s inability to minimize the accumulation of NPLs also reduces a shareholder’s trust in the bank, potentially damaging a bank’s reputation. As a result, it decreases a bank’s general competitiveness, and they face difficulties adapting to shifts in the financial landscape. To ensure financial stability and sustained growth in a fast-changing industry, banks should adopt efficient mechanisms for managing NPLs.
Establishing investor confidence is paramount for banks since it immediately impacts their capacity to generate funds and sustain a robust financial foundation (
Siegel, 2021). An elevated degree of investor confidence increases the likelihood of banks being able to secure loans at advantageous conditions, issue shares, and attract investments (
Heffernan, 2005). Banks rely on investor confidence to maintain operations, especially in times of economic adversity. If market confidence declines, a bank may encounter challenges in acquiring capital, increased borrowing expenses, and diminished stock values (
Thakur, 2024). An essential factor for the long-term sustainability of a bank is its ability to sustain investor trust, enabling it to allocate resources towards innovation, take advantage of growth prospects, and withstand economic slumps with enhanced resilience.
High levels of NPLs undermine investor trust. Investors view banks with elevated credit risk as unstable, as NPLs threaten both long-term viability and short-term profitability (
Mohan & Ray, 2022). Increased NPLs lead to a reduced market value, greater volatility, and sharp declines in stock prices, discouraging investment. As trust erodes, banks may struggle to raise capital through debt or equity markets, deepening their financial difficulties (
Kidwell et al., 2016). Moreover, heightened NPLs can trigger shareholder activism, with investors demanding changes in management or strategy to address performance issues.
Despite the considerable study undertaken on NPLs and their influence on a bank’s profitability, there is a significant lack of understanding regarding the effect of NPLs on investor confidence. Past research has concentrated on regulatory implications associated with NPLs and the impact of NPLs on the financial performance of banks (
Ozili, 2019;
Osei-Assibey & Asenso, 2015). However, there is limited understanding of the effect of NPLs on investor confidence and bank trust, creating a significant knowledge gap in the literature. Additionally, there is a limited understanding of how a bank’s age influences the relationship between NPLs and investor confidence. Addressing this gap is vital, as investor confidence plays a crucial role in a bank’s capacity to acquire capital and maintain its market worth (
Stowell, 2010). This gap can help investors and other stakeholders to comprehensively grasp the consequences of NPLs on the stability and growth of banks.
This study addresses gaps in the literature by examining the impact of NPLs on investor confidence, using signaling theory as the conceptual framework. According to signaling theory, developed by
Spence (
1973), in situations of information asymmetry, one party sends signals to reduce uncertainty and guide the other party’s decisions. In this context, the level of NPLs serves as a signal that investors interpret to assess a bank’s risk profile, management effectiveness, and financial health. By applying this theoretical lens, this study explains how information about NPLs shapes investor perceptions and decision-making. The findings aim to provide empirical insights that enhance understanding of banking performance, investor behavior, and market signaling mechanisms.
This study addresses the critical need to understand how strategic financial outcomes are influenced during periods of financial adversity, with a particular focus on NPLs and their effect on investor confidence and trust. It seeks to generate insights that inform both academic research and practical banking strategies, offering guidance on navigating financial volatility, sustaining investor trust, and promoting long-term stability. The findings are expected to support more effective strategic planning, resilience building, and financial management, enabling banks to make informed decisions regarding NPL management and overall performance.
The study contributes to the literature by examining the influence of NPLs on investor confidence—an essential factor in shaping market valuations, guiding capital allocation, and supporting financial stability. Understanding this relationship helps banks manage reputational risks, informs regulatory policy, and reinforces investor trust during times of financial stress.
Additionally, the research explores the moderating role of a bank’s age in the relationship between NPLs and investor confidence. By analyzing whether an established reputation and historical performance buffers or amplifies the negative effects of NPLs, this study offers valuable insights for strategic communication and decision-making aimed at preserving investor trust during financial downturns.
The remainder of this study is organized as follows: literature review, methodology, data analysis and interpretation, discussion of findings, conclusion, theoretical implications, managerial implications, practical implications and recommendations, limitations, and directions for future research.
2. The Literature Review
2.1. Theoretical Background of the Study
The impact of NPLs on investor confidence can be understood through three complementary theoretical lenses: signaling theory, agency theory, and market discipline. While all address the effects of financial distress on investor perceptions, each offers a distinct perspective on investor behavior.
Signaling theory posits that NPLs serve as observable indicators of a bank’s financial health (
Leventis et al., 2012). An increase in NPLs signals declining asset quality, prompting investors to reassess risk, reduce investment, or lower valuations (
Arnone et al., 2024). This theory focuses on information asymmetry, emphasizing how NPL disclosures reduce uncertainty and influence investor decisions.
Agency theory highlights the conflict between shareholders and management (
Mensah & Bein, 2023). High NPL levels may signal managerial inefficiency or the concealment of financial distress. Investors may view this as a breach of trust, especially if management appears to prioritize short-term gains over transparency, thereby eroding investor confidence (
Hancock, 2004).
Market discipline theory emphasizes an investor’s role in enforcing financial accountability (
Bliss, 2003). In response to rising NPLs, investors may sell shares or demand higher returns, pressuring banks to improve risk management practices. This theory frames investor behavior as a corrective force in financial markets.
Together, these theories offer a holistic understanding: signaling theory focuses on information transmission, agency theory on governance and trust, and market discipline on investor-led accountability.
Among these, the signaling theory is the most appropriate framework for this study as it directly explains how NPLs shape investor confidence. It provides a clear mechanism by which financial metrics—such as NPLs—are interpreted as signals of risk and stability. Despite its relevance, signaling theory has been underutilized in empirical studies on investor behavior in the banking sector, which often emphasize broader governance or market dynamics. By centering on the signaling theory, this study addresses a critical gap, offering nuanced insights into how NPLs influence investor sentiment through information flow, thereby enhancing both theoretical and practical understanding in banking finance.
A bank’s disclosure of high NPLs indicates to investors that many of its loans are not functioning as intended (
Ozili, 2018). This raises apprehensions regarding the bank’s credit risk and fundamental financial solvency. Investors may interpret these signs as indicators of more severe problems, such as insufficient risk management or lenient loan underwriting standards. Consequently, the bank’s perceived risk has escalated.
Investors react to the heightened impression of risk in several ways. For example, they may divest their shares, request greater returns on their investments to offset the perceived risk, or have a more negative outlook on the bank’s future business prospects. This decline in investor confidence may negatively impact the bank’s ability to raise capital and its stock price.
Signaling theory explains how high levels of NPLs impact investor confidence (
Sidi & Wijayanti, 2024). This theory highlights the possible influence of negative financial indicators on investor sentiments and choices, which can interfere with the bank’s ability to generate funds and function efficiently in the market. By analyzing NPLs, this theory illuminates how financial crisis signals impact investor confidence and behavior.
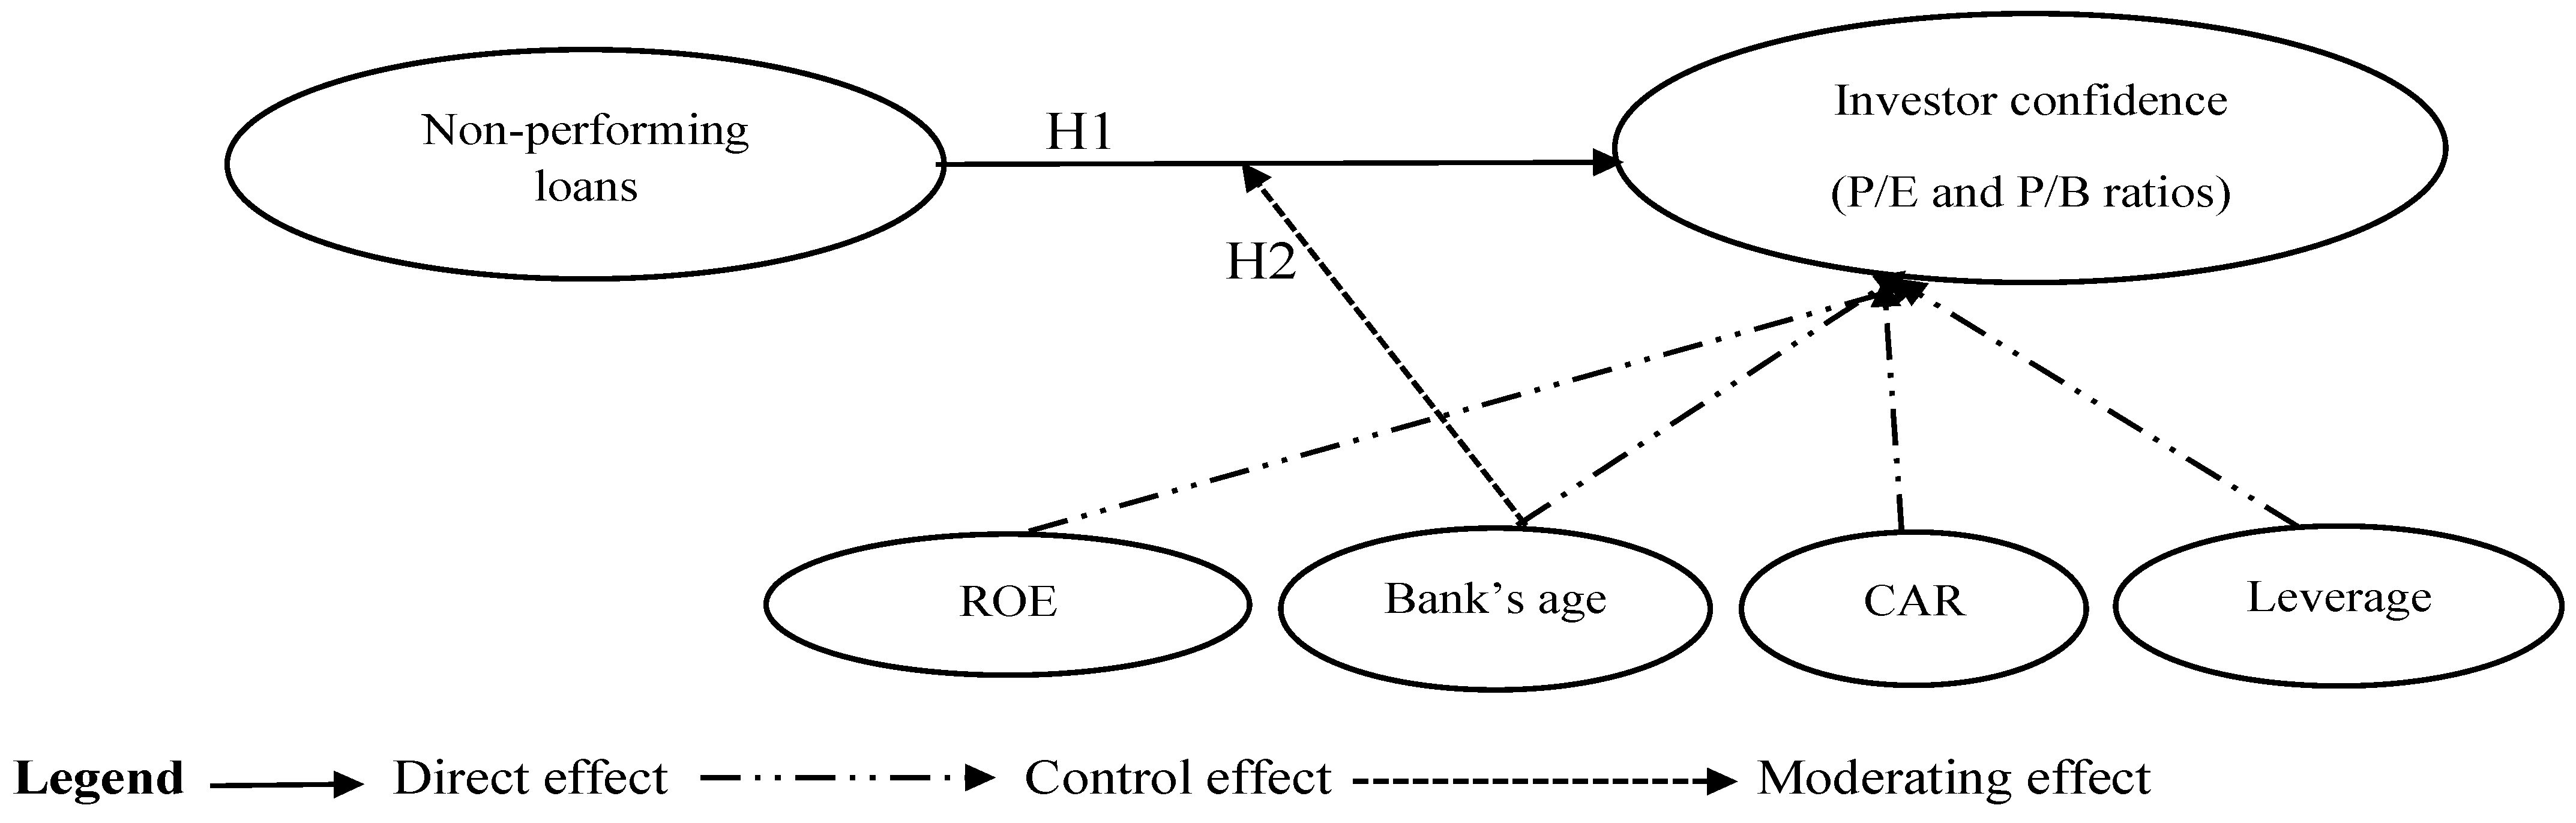
2.2. Hypothesis Development
The conceptual framework of this study is visually illustrated in
Figure 1, providing a clear representation of the proposed relationships. The corresponding hypotheses are articulated in
Section 2.2.1 and
Section 2.2.2, aligning with the theoretical foundation and guiding the empirical analysis.
2.2.1. The Influence of NPLs on Investor Confidence
Investors often question a bank’s efficiency and stability when NPL levels are high as this signals deteriorating asset quality and increased financial risk (
Nwogugu, 2015). Empirical evidence supports this view, showing that higher NPL ratios are associated with a greater perceived risk. For instance,
Ghosh (
2015) found that banks with elevated NPLs face significantly higher capital costs, reflecting reduced investor confidence. As perceived risk rises, investors demand higher returns, increasing the bank’s cost of equity and signaling declining trust in its financial health and long-term viability (
Admati et al., 2013).
Due to the negative effect of higher loan loss provisions on capital reserves and profitability, NPLs can significantly limit a bank’s financial resources (
Riahi, 2019). Investors may start to doubt the bank’s capacity to ensure sustained profitability in the long run.
Pancotto et al. (
2024) discovered that the financial burden resulting from elevated levels of NPLs often results in a decline in market valuations and a rise in investor skepticism of future performance. Since larger provisions are required, as they reduce the bank’s capital cushion and profit margins, investors are concerned about its long-term viability and ability to deliver consistent returns.
Regulatory reactions to high levels of NPLs impact investor confidence. Banks burdened with significant NPLs may face stricter regulatory supervision, increasing compliance costs and operational limitations (
Pancotto et al., 2024).
Kokkinis and Miglionico (
2020) discovered that regulatory measures to reduce the risks linked to NPLs impact investor confidence. Investors interpret these activities as an indication that the bank is facing considerable difficulties, therefore subjecting the bank to considerable financial strain. The heightened regulatory supervision can erode investor trust since worries about the bank’s stability and future performance are intensified.
According to signaling theory, financial indicators such as NPLs act as key signals that investors use to evaluate a bank’s health and stability. An increase in NPLs signals deteriorating asset quality, weak risk management, and rising financial distress (
Atichasari et al., 2023). Investors interpret these signals as warnings of potential losses or reduced profitability, which can undermine trust in the bank’s stability and credibility. As a result, they may respond with caution, lowering valuations, reducing investment, or divesting to minimize financial risk. Based on this discussion, we hypothesized the following:
Hypothesis 1 (H1). Investor confidence is negatively and significantly impacted by NPLs.
2.2.2. The Moderating Role of Bank Age in the Relationship Between NPLs and Investor Confidence
A bank’s age affects the relationship between investor confidence and NPLs. Established banks may offset the negative impact of rising NPLs on investor sentiment by utilizing their reputable standing, considerable operational acumen, and financial performance (
Perwej, 2020). Investors may view established institutions as more robust owing to their expertise in navigating economic cycles and recovering from financial disasters. Due to their prior performance, stakeholders may perceive that these companies have the requisite instruments and expertise to manage credit risk effectively, thus alleviating the adverse effects of NPLs on investor confidence (
Naili & Lahrichi, 2022).
Conversely, inexperience and insufficient financial stability may hinder junior banks from sustaining investor confidence amid rising NPLs (
Festic & Kavkler, 2012). Investors generally evaluate the risk management competencies of banks when deciding where to invest. Nevertheless, newer banks may lack the same degree of developed risk management procedures as their more seasoned competitors. Market participants may view these banks as more susceptible to financial instability, liquidity issues, or regulatory oversight due to rising NPL levels, potentially eroding investor confidence (
Arnone et al., 2024).
Furthermore, the adverse effect of NPLs on investor confidence is alleviated by an established bank’s capacity to use their existing contacts with regulatory bodies, credit rating agencies, and other financial institutions (
Campbell, 2007). Investors are comforted by the enhanced availability of established banks to external support mechanisms, such as government bailouts, central bank initiatives, and favorable refinancing options, even in adverse financial conditions. Without these benefits, junior banks may find it more challenging to reassure stakeholders as loan portfolios diminish, further undermining investor confidence (
Tomasic & Akinbami, 2011).
Notwithstanding these variations, the ability of both established and newly established banks to articulate their NPL management policies effectively ultimately influences investor confidence (
Bastan et al., 2024). Although established banks possess a more esteemed reputation, investor confidence may be compromised by insufficient transparency or inadequate responses to the rising incidence of NPLs (
Atichasari et al., 2023). Emerging banks may limit the adverse impacts of NPLs on investor confidence by proactively implementing robust risk management frameworks, improving transparency, and maintaining stringent corporate governance standards. Thus, investor perceptions are shaped by the institution’s strategic actions and overall financial condition, notwithstanding the mitigating effects of the bank’s age (
Srivastav & Hagendorff, 2016).
Bank age reflects their reputation and resilience, as older banks often have established credibility, strong customer relationships, and a history of managing financial challenges. Investors may view them as more capable of withstanding distress, even with rising NPLs. This trust can reduce the negative impact of NPLs on investor confidence and help maintain market support during difficult periods (
Cubillas et al., 2021). Based on this discussion, we hypothesized the following:
Hypothesis 2 (H2). Bank age positively and significantly moderates the relationship between NPLs and investor confidence.
3. Materials and Methods
3.1. Sample and Data
The United States (U.S.) was chosen as the study’s location due to its highly developed and thoroughly regulated financial markets, overseen by the U.S. Securities and Exchange Commission (SEC) (
Naiknaware, 2022). The U.S. is a beacon of investor protection regulations that demand transparency, making it the ideal backdrop for this study of global financial markets.
The choice of U.S. banks for this study was based on their significant influence on global financial markets. Both local and foreign investors regularly watch these banks’ financial performance, making them attractive for this study. The provided background offers a strong foundation for comprehending the influence of financial challenges on investor confidence within a heavily regulated and transparent market.
The data used in this study were obtained from Thomson Reuters Eikon DataStream, a well-known provider of high-quality and extensive financial databases. The selection of the U.S. banks listed on the New York Stock Exchange for this study was based on inclusions and exclusions, ensuring the right banks that possess the required information contributing to the study’s significance were selected. The inclusion criteria required banks to possess complete datasets from 2006 to 2023 without gaps in the years and to maintain ongoing operations within the United States. Financial entities such as hedge companies, insurance companies, and pension funds were also excluded from this study since most did not give loans to their customers and business organizations in larger amounts. Purposive sampling was employed to select 253 banks from 2006 to 2023 that met specific study criteria, following prior studies by
Amin and Cek (
2023) and
Koroma and Bein (
2024). This approach ensured the inclusion of institutions with complete and reliable data, aligning directly with the research objectives. Banks with incomplete or inconsistent records were excluded to enhance internal validity and reduce bias, ensuring more accurate findings. The use of balanced data over imbalanced data further improved the precision and reliability of the analysis, enabling a clearer understanding of the impact of NPLs on bank operations.
3.2. Dependent and Independent Variables
Detailed information as to the definition of the variables, their abbreviations, and operationalization are presented in
Table 1.
3.2.1. Dependent Variables
The main metrics used to evaluate investor confidence were the price-to-earnings (P/E) ratio and the price-to-book value (P/B) ratio. The P/E ratio is used to assess the present share price of a bank and its earnings expressed per share (
Dayag & Trinidad, 2019). A higher P/E ratio often suggests that investors are prepared to pay a premium for the bank’s shares, expecting the company to sustain its profitability in the following years (
Anderson, 2012). This implies that investors now hold a positive outlook on the bank’s financial condition and its prospects for future growth. Nevertheless, a reduced P/E ratio indicates a decline in investor trust, stemming from apprehensions about future profitability or financial solvency, which are influenced by elevated levels of NPLs (
Grier, 2007).
The P/B value ratio compares a bank’s market value per share with its book value per share (
Gounder & Venkateshwarlu, 2017). A high P/B ratio signifies robust investor confidence since it suggests that investors assign a significant rating to the bank’s assets and prospects for growth (
Martínez et al., 2024). This suggests that investors expect significant financial gains and the efficient management of assets from the credit institution. Conversely, a low P/B ratio could indicate a decline in investor trust, partly because of worries about the bank’s capacity to handle its assets and financial difficulties, such as high NPL levels (
Luo et al., 2019).
3.2.2. Independent Variable
NPLs, the primary independent variable, wield significant influence over investor perceptions and reactions towards a bank’s financial solvency (
Nie et al., 2023). Elevated NPLs, indicative of heightened credit risk and unstable finances, can erode investor confidence and impact stock prices (
Arnone et al., 2024). This metric enables the estimation of the potential influence of financial strain on investor confidence and perceptions of a bank’s stability and future outlook
3.2.3. Control Variables
The ROE assesses a bank’s profitability concerning the total equity owned by its shareholders. It illustrates how a bank utilizes equity capital to produce profit. An elevated ROE reflects the bank’s capacity to provide appealing cash flows despite its high levels of NPLs (
Singh et al., 2021). This boosts investor confidence by showcasing its efficient equity utilization and strong financial performance. In contrast, a lower ROE indicates that the company is underperforming and that the money is being utilized inefficiently (
Kabaciński et al., 2020). This may lead to a loss of investor trust due to possible challenges in effectively managing shareholder equity and profitability.
Bank age is the years a bank has been incorporated in the stock market, which profoundly impacts investor confidence (
Zingales & Rajan, 2003). With their long-standing reputations and extensive operational histories, older banks generally demonstrate higher stability and investor confidence (
Rosenbaum & Pearl, 2021). Their proven record of performance and proficiency in handling financial difficulties, such as high levels of NPLs, underscores their reliability and resilience. In contrast, younger banks may not possess the same degree of experience or reputation, which can increase investor concerns about their capacity to handle financial risks (
Brooks et al., 2018). Using bank age as a control variable provides valuable insight into how the operating history of a bank influences the correlation between NPLs and investor confidence.
The Capital Adequacy Ratio (CAR) measures a bank’s capital in relation to its risk-weighted assets, indicating its ability to absorb potential losses (
El-Ansary et al., 2019). It is calculated by dividing Tier 1 and Tier 2 capital by risk-weighted assets. As a key regulatory indicator, CAR reflects a bank’s financial strength and stability. Including CAR as a control variable helps isolate the impact of NPLs on investor confidence, as well-capitalized banks are more likely to retain investor trust.
Leverage indicates the extent to which a bank uses debt to finance its assets, highlighting its financial risk (
Arhinful & Radmehr, 2023). A higher leverage reflects a greater dependence on borrowed funds, which can magnify both gains and losses. It is measured by the debt-to-equity ratio, calculated as total debt divided by total equity. Including leverage as a control variable allows for a clearer assessment of the NPLs’ effect on investor confidence, independent of overall financial risk.
3.3. The Choice of Estimation Methods
In order to choose the most effective estimation methods, a cross-sectional test was conducted. This preliminary step was essential to ascertain the presence of cross-sectional dependence or independence in the panel data. This occurs when banks in the sample are affected by common economic, regulatory, or market shocks, leading to interdependence among them (
Arhinful et al., 2025a). Ignoring it can create biased results. In order to ascertain whether to reject the null hypothesis of cross-sectional independence in favor of the hypothesis suggesting dependence, the Friedman, Pesaran, and Frees tests were utilized. As shown in
Table 2, the results of the three tests show that the data exhibit cross-sectional dependence. The results support the evidence that the impact of NPLs on investor confidence is mutually dependent among banks.
The second step involved using the Pesaran–Yamagata test to evaluate the homogeneity or heterogeneity of the panel datasets. Contrary to the null hypothesis, which assumed homogeneity, the alternative hypothesis proposed heterogeneity. The results from
Table 2 indicate that the data exhibits heterogeneity, implying that the influence of different banks on investor confidence differs widely.
The chosen appropriate estimation technique was based on the results showing that the datasets are heterogeneous and cross-sectionally dependent. The Common Correlated Effects Mean Group (CCEMG) estimator was selected because of its remarkable ability to tackle these concerns (
Chudik & Pesaran, 2015). The CCEMG estimator was chosen over Fixed Effects (FE) because FE oversimplifies intricate cross-sectional interactions and produces imprecise findings. When cross-sectional dependence occurs, the assumption of panel independence may not hold for the Random Effects (RE) model. The necessity for robustness in handling inter-panel connections makes Ordinary Least Squares (OLS) less appropriate for this study.
CCEMG excels in the methodical consideration of cross-sectional dependence among panels. Utilizing common variables containing interactions between different units allows for adjustments that accurately represent these interdependencies (
Atilgan et al., 2024). The CCEMG estimator guarantees the exact modeling of panel correlations, enhancing the results’ precision and reliability. In contrast to FE, RE, or OLS, this method yields more reliable outcomes by considering the complexities and interrelationships of the data, therefore facilitating a more thorough understanding of the influence of NPLs on investor confidence. The CCEMG estimator model is presented as follows:
where “
is the dependent variable for unit i at time t;
is the independent variable(s) for unit I and at time t;
is the individual-specific factor;
is the coefficient for the independent variable(s) for unit I;
represents the unobserved common factors that affect all units in the panel;
is the factor loading for unit i;
is the error term.
The final step was ascertaining whether the independent variables were endogenous or exogenous. Endogeneity arises when explanatory variables are correlated with the error term, typically due to omitted variables, measurement error, or reverse causality, resulting in biased estimates (
Arhinful et al., 2025b,
2025c). The Wu–Hausman and Durbin–Wu–Hausman (DWH) tests were used to evaluate this. The null hypothesis indicated the presence of homogeneity, whereas the alternative hypothesis proposed the presence of endogeneity. The statistical analysis in
Table 2 revealed the presence of endogeneity in the independent variables, namely the correlation between the regressors (NPLs, ROE, and the bank’s age) and the error term.
The Generalized Method of Movement (GMM) model was selected to address the endogeneity in the datasets. It enables the resolution of these issues by employing both internal and external instruments as a corrective measure to address endogenous regressor bias (
Arhinful et al., 2025d;
Mensah et al., 2025). This method facilitates a more accurate estimation, guaranteeing a precise evaluation of the relationship between investor confidence and NPLs. The GMM model is presented as follows:
where
GMM is the Two-Step GMM estimator of the parameter vector θ;
W is the weighting matrix that optimizes the efficiency of the estimator.
3.4. Model Specification
The study used two models to examine how NPLs influence investor confidence. Model 1 provides results regarding the direct influence of NPLs on investor confidence, while Model 2 provides results on how a bank’s age moderates the relationship.
NB:
Table 1 presents the definition of the abbreviation in the model: “n” stands for the years of the data, “B” for the bank’s sample, and “U” for the error term.
4. Results and Interpretation
4.1. Descriptive Analysis
Table 3 of this study presents the descriptive analysis of the variables employed in this study. The average P/E ratio indicates that investors are typically inclined to pay a premium for earnings, reflecting optimistic market projections concerning the bank’s future growth potential. Banks should prioritize improving profitability to maintain or increase this ratio. The average P/B ratio suggests the market values of the bank’s book value. This indicates investor confidence in the bank’s growth prospects and asset quality. To attract extra capital, banks should leverage this by clearly communicating their advantages and future goals.
Although banks are proficiently managing their NPLs, as the average NPLs indicate, there is potential to improve asset quality and bolster financial stability. A decrease in NPL leads to an improvement in overall performance indicators. The average ROE indicates that banks manage their equity proficiently and generate fair shareholder returns. Banks should optimize their operational efficiency and capital frameworks to improve ROE further. The average age of the banks suggests they have operated for an extended duration, indicating their proficiency in managing market volatility and ensuring stability. This enables banks to gain a competitive edge by facilitating innovation and expanding their expertise.
The average CAR suggests that banks maintain moderate capital buffers, indicating resilience to losses and compliance with regulatory requirements. This supports financial stability and strengthens investor and regulatory confidence. Similarly, the average leverage shows a moderate reliance on debt financing, reflecting balanced risk-taking. While this signals operational confidence, it requires careful management to prevent excessive financial risk that could undermine investor trust.
Variance Inflation Factor (VIF) measurements evaluate multicollinearity among the independent and control variables (NPLs, ROE, and bank age). The results indicate that the relationship between the NPLs, ROE, and bank age does not display significant multicollinearity since their VIF is less than 5 (
Arhinful et al., 2025a). These findings suggest that the independent variables can be used in studies without the risk of inflated standard errors.
4.2. Correlation Matrix Analysis
The correlation matrix analysis was utilized to assess the independent variables’ multicollinearity, and the results are displayed in
Table 4. A correlation coefficient between two independent variables in the matrix greater than 0.70 indicates potential multicollinearity (
Mensah et al., 2024). All coefficients were found to be beneath this level, indicating that multicollinearity was not an issue. This outcome verifies that the independent variables do not display excessive correlation, affirming the VIF findings reported in
Table 3.
4.3. Panel Unit Root Analysis
The unit root test was conducted using the cross-sectional augmented Dickey–Fuller (CADF) and cross-sectional augmented IPS (CIPS) tests, and the results are shown in
Table 5. These tests are used because the panel data exhibit cross-sectional dependence, yielding more consistent findings in the presence of these issues than conventional tests (ADF, DF). The null hypothesis posits the presence of a unit root, whereas the alternative hypothesis asserts the series’ stationarity. The first difference and level tests revealed that all variables were stationary, signifying that they would produce unbiased estimations when used for the analysis.
4.4. Testing of Hypothesis
Table 6 presents the results of the CCEMG model, which shows the influence of NPLs and ROE on investor confidence. The hypothesis testing of this study was based on this result.
The study found that NPLs had a negative and significant impact on investor confidence, measured by the P/E and P/B ratios. These results support Hypothesis H1. Higher NPLs signal deteriorating asset quality and increased financial risk, leading investors to lower valuations and reassess future prospects, resulting in reduced P/E and P/B ratios.
The study also found that bank age significantly and negatively moderated the relationship between NPLs and investor confidence, supporting Hypothesis H2. Although older banks may benefit from established reputations, they can attract greater scrutiny or carry legacy risks when NPLs increase, which heightens investor concerns and amplifies the negative impact of NPLs on confidence.
4.5. Robustness Testing
Robustness testing, conducted using the AMG estimator presented in
Table 7, robustly corroborated the findings derived from the CCEMG estimate. The directional relationships—both positively and negatively significant—remained consistent across all models, indicating alignment in the signs of the coefficients. The principal distinctions noted were in the values of the coefficient estimations and the standard errors. The constancy in direction reinforces the robustness and validity of the findings, indicating that the results are not affected by the selection of the estimator.
The AMG estimator accounts for cross-sectional dependence and heterogeneity across banks, yielding more reliable long-run estimates (
Eberhardt & Bond, 2009). Its consistency with the CCEMG results in
Table 7 reinforces the robustness of the study’s conclusions, confirming that the observed relationships are stable across different estimation methods and not influenced by model-specific biases.
4.6. Dealing with Endogeneity Issues
The endogeneity tests indicated significant correlations between age, ROE, and NPLs with the error term, resulting in considerable endogeneity challenges. If these issues remain unaddressed, the integrity of the findings on the influence of NPLs on investor confidence may be compromised. An extended regression model addressed this issue by incorporating the P/E and P/B ratios as a dynamic panel. This strategy addresses the endogeneity problem.
The subsequent step involved using internal instrumental variables to combat endogeneity, which was achieved by lagging the NPLs, ROE, and age. This meticulous approach eliminated the risk of endogeneity. Furthermore, we expanded the model by introducing external instrumental variables such as inventory, accounts payable, accounts receivable, and equipment. Including these external variables was crucial in fortifying the analysis, as it facilitated the removal of endogeneity from the model, demonstrating the thoroughness of our research process.
The validity of the GMM model was rigorously established through Arellano–Bond (AR) tests. The model’s credibility was confirmed by the significant AR (1) and insignificant AR (2) results, indicating effective endogeneity management and the absence of autocorrelation as evidenced by the AR (2) (
Amin & Cek, 2023). The Sargan test further reassured us that the instrumental variables were exogenous, as the statistically insignificant results indicated. The Hansen tests were used to affirm that the instruments do not correlate with the error term, with statistically insignificant results between 0.10 and 0.30, further validating the GMM model.
The GMM results obtained for all study models (1 and 2) met all relevant GMM assessment indices (Hansen test, Sargan test, AR (1), and AR (1)), indicating the validation of the GMM findings displayed in
Table 8. The GMM findings served as robustness to the findings presented in
Table 6. This is because the results in
Table 6 are consistent with those in
Table 8 regarding the positive or negative significant direction, despite the significant changes in their standard errors and coefficient estimations.
5. Discussion of the Findings
5.1. The Effect of NPLs on the P/E Ratio
The study found that NPLs had a negative and significant influence on the P/E ratio, which supported the study’s hypothesis. The signaling hypothesis asserts that banks inform the market through financial performance and managerial choices (
Yasar et al., 2020). Increased NPLs indicate that a bank may encounter challenges regarding asset quality and risk management protocols, rendering the institution more perilous to investors. This adverse reputation often leads to a decline in the P/E ratio, indicating a diminished readiness to invest in the bank’s earnings (
Admati et al., 2013).
High levels of NPLs may raise significant apprehension about a bank’s prospective profitability. Investors perceive elevated NPLs as a sign of inadequate lending standards, heightening apprehension about the bank’s long-term viability (
Fell et al., 2021). The existence of a substantial quantity of NPLs may require the deployment of considerable resources to loan loss provisions, thus diminishing the money available for corporate reinvestment or dividend distributions. The decreased available capital adversely affects investor trust and sentiment, raising concerns about the bank’s long-term growth prospects and short-term financial adaptability (
Gennaioli & Shleifer, 2018).
The findings suggest that investors must proceed cautiously when assessing banks with significant NPLs because of the possibility of diminished investment returns linked to the related risk. Investors may require an elevated risk premium, affecting the bank’s total worth. These findings highlight the significance of proactive risk management and the necessity of fostering excellent connections with investors for bank administration. Implementing enhanced asset quality management and transparent communication concerning initiatives for improving financial health can alleviate negative perceptions and reinstate trust in the bank’s future performance (
Wapmuk, 2017).
The study discovered that ROE had a negative and significant impact on the P/E ratio, which supports the study’s hypothesis. The signaling theory asserts that investors can acquire essential information about a firm by analyzing its financial data (
Connelly et al., 2011). The bank’s profit-to-equity ratio may be suboptimal, as seen by a decreasing ROE. This may lead investors to perceive the bank as less proficient in earning returns. This viewpoint may reduce the P/E ratio, as investors are less willing to pay a premium for earnings linked to diminishing efficiency (
Anderson, 2012).
A lower return on equity may indicate that management struggles to allocate equity money, raising worries about the company’s overall strategy and operational efficiency (
Quiry et al., 2011). A prolonged low ROE may reduce the bank’s attractiveness to investors, raising apprehensions regarding stagnating growth or diminishing profitability. Investors will likely pursue alternatives with superior success if they believe the bank cannot provide adequate investment returns. This negative outlook may erode investor confidence and result in diminished market valuations, exacerbating the bank’s financial predicament and strategic alternatives (
Freixas, 2010).
These findings emphasize that investors must closely monitor ROE to indicate financial stability and prospective profitability. A negative result when comparing P/E to ROE may indicate that further analysis is necessary before investing. Bank management must enhance operational efficiency and prioritize methods that elevate ROE. Management may seek to restore trust and enhance the bank’s market value by notifying investors of these actions (
Choudhry, 2018).
The study found a positive and significant relationship between the age of the banks and the P/E ratio. According to the signaling theory, potential investors are guaranteed the stability and reliability of established enterprises (
Bae et al., 2018). An established bank generally possesses a lengthy history, indicating its prior management of market fluctuations and proven performance. Both traits can enhance investor confidence. This viewpoint may result in a heightened P/E ratio, as investors tend to pay a premium for company shares, which they regard as stable and lucrative over the long run.
Established banks possess greater market trust and brand recognition, facilitating client attraction and retention (
Adamson et al., 2003). Their established reputation fosters stability and bolsters consumer loyalty, thus increasing their attractiveness to prospective investors. Moreover, their collective proficiency in risk management and navigating market volatility offers them a competitive edge that enables the seizing of profitable chances (
Krantz & Brusberg, 2024). The amalgamation of practical operational proficiency and substantial brand equity markedly enhances investor confidence, establishing that older banks are more dependable options within the financial market.
This result highlights the importance of investors considering a bank’s age when making investment choices. An established bank with a strong P/E ratio is a more dependable investment compared to younger banks (
Rosenbaum & Pearl, 2021). Leveraging their experience and proven track record, management should underscore their stability and long-term strategies in communications with investors to sustain or improve market valuation. This can ultimately enhance the bank’s growth and success by fostering investment and trust.
The study found that the capital adequacy ratio had a positive and significant effect on the P/E ratio. According to the signaling theory, strong capital positions convey positive signals to investors by reducing information asymmetry and indicating financial stability and sound risk management. A higher capital adequacy ratio suggests a bank can absorb potential losses and poses a lower default risk, leading investors to assign them higher valuations (
Kim & Santomero, 1988). This finding supports the signaling theory, showing that robust capitalization is interpreted as a credible indicator of strong performance and future profitability. Additionally, well-capitalized banks often face less regulatory pressure, have access to better financing terms, and can pursue growth opportunities more effectively (
Arhinful et al., 2024). Thus, maintaining strong capital buffers not only ensures regulatory compliance but also enhances investor trust and market value.
The study also identified a positive and significant relationship between leverage and the P/E ratio. Under signaling theory, financial decisions communicate private information to the market. A higher leverage ratio may signal management’s confidence in the bank’s ability to generate stable cash flows and meet debt obligations, thereby reducing perceived risk (
Mason, 2007). This supports the idea that leverage, within prudent limits, can serve as a credible signal of expected performance. The positive effect may also stem from tax benefits and improved returns on equity associated with debt financing. For banks, this highlights the importance of managing debt levels strategically to strengthen investor confidence and enhance market valuation without increasing financial vulnerability.
The moderating relationship between NPLs and bank age had a negative and significant impact on the P/E ratio. Despite being depicted as reliable and stable, establishing a significant volume of NPLs might compromise a bank’s positive image. The market may view significant NPLs at established institutions as indicative of deficient credit risk management, thereby overshadowing their experiential and reputational advantages (
Golin & Delhaise, 2013). As a result, investors may attribute a lower P/E ratio to the bank, indicating apprehension regarding its future profitability.
Despite their extensive history, older banks may be regarded as possessing outdated risk management practices if they inadequately address the rising volume of NPLs (
Odonkor, 2018). This failure to adapt may prompt stakeholders to doubt their capacity to address contemporary financial difficulties. Moreover, regulators often concentrate on banks with significant NPLs, which can adversely affect the bank’s reputation and erode investor confidence (
Naili & Lahrichi, 2022). Investor apprehension may intensify as worries about operational effectiveness and regulatory compliance grow, potentially affecting the bank’s market valuation and capacity for further financing.
This result highlights the necessity of assessing a bank’s asset quality alongside its age for investors. An established bank with a high NPL ratio may pose larger risks than a newer bank with superior credit management practices (
Naili & Lahrichi, 2022). Management must prioritize the effective administration of NPLs and enhance risk assessment methods to sustain investor confidence. This strategy may enhance the P/E ratio by alleviating the adverse effects of NPLs on value and perceived stability.
5.2. The Effect of NPLs on the P/B Ratio
The study found that NPLs had a negative and significant influence on the P/B ratio, which significantly supported the study’s hypothesis. With higher NPLs, investors regard the bank as more hazardous, indicating possible asset quality concerns (
Kadioglu & Ocal, 2017). This adverse signal reduces the P/B ratio, undermining confidence in the bank’s true asset worth. Investors may be concerned that the bank’s reported valuation of tangible assets is inaccurate due to the hidden risks linked to NPLs (
Dagher et al., 2016).
The bank’s stated book value and balance sheet may be significantly impacted by considerable write-offs or provisions for credit losses resulting from consistently elevated levels of NPLs. Investors increasingly question the bank’s long-term sustainability due to a fall in asset quality, raising concerns about its operational viability (
Spence, 1973). Moreover, the bank’s financial condition may be further aggravated by heightened regulatory scrutiny, typically stemming from elevated NPL ratios. As regulatory scrutiny grows, investors may re-evaluate their investment selections and seek alternatives with more advantageous risk profiles, perhaps leading them to review the bank’s actual value (
Schoenmaker & Schramade, 2019).
These findings highlight the necessity of evaluating asset quality alongside conventional valuation metrics for investors. Investing in a bank with significant NPLs may suggest inherent financial fragility, requiring increased vigilance (
Atichasari et al., 2023). Management must proactively diminish NPLs and refine credit risk management protocols to enhance the bank’s perceived value. By resolving NPL issues, management can enhance investor trust and ultimately elevate the P/B ratio (
Tram, 2012).
The study discovered that ROE had a positive and significant impact on the P/B ratio, which supports the study’s hypothesis. As per signaling theory, a high ROE signifies efficient management and strong profitability (
Rahim et al., 2021). The positive signal enhances investors’ trust in the bank’s future earning potential and asset quality, leading to an elevated P/B ratio. Investors perceive a high ROE as being indicative of the bank’s effective use of equity capital, enhancing its asset value (
Pennacchi & Santos, 2021).
A bank’s elevated return on equity generally signifies its proficiency in generating profits from shareholder capital, reflecting a robust operational performance (
Gupta & Mahakud, 2020). The bank’s market worth generally exceeds its book value due to its outstanding performance, which draws a growing number of investors. Banks with elevated ROE are typically more proficient at allocating their earnings towards growth possibilities, augmenting their asset base and boosting future profitability. The bank’s ability to reinvest positively affects the P/B ratio, bolstering investor trust (
Anson et al., 2010). This is because stakeholders acknowledge the bank’s ability to sustain development and create long-term value.
These findings highlight the significance of ROE as a vital statistic for assessing a bank’s value for investors. A strong ROE signifies a well-managed bank poised to deliver outstanding investment returns (
Akinroluyo, 2022). The implication for management is to concentrate on measures that augment ROE, including enhancing operational efficiency and profitability. By doing so, management can augment investor trust, strengthen the bank’s market position, and facilitate a higher P/B ratio.
The study found a positive and significant relationship between the age of the banks and the P/B ratio. The signaling theory posits that individuals tend to regard older institutions as more trustworthy and stable because of their prolonged existence (
Bangerter et al., 2012). Investors exhibit an increased confidence in the bank’s future performance due to its stability, evidenced by its resilience across multiple economic cycles. The market attributes a greater value to the assets of these banks, as indicated by an elevated P/B ratio.
Due to their established reputations and enduring client relationships, older banks typically exhibit more stable income streams and diminished earnings volatility (
Flower et al., 2012). These institutions attract investors due to their reliable performance, potentially prompting a willingness to pay a premium for the perceived stability they provide. Moreover, the substantial asset base commonly held by established banks functions as a risk mitigation strategy, bolstering investor confidence (
Girling, 2022). The market valuation of established banks typically exceeds that of their newer counterparts, indicating that their operations are both secure and dependable.
These findings highlight the significance of investors considering a bank’s age when making investment choices. Older institutions offer more reliable return opportunities with reduced risk. Therefore, management has to utilize their reputation and history to convince prospective investors of their reliability and stability. This may entail prioritizing sustainable practices that meet investor expectations, effectively resolving prior challenges and highlighting long-term growth goals to enhance the P/B ratio (
Fischer et al., 2020).
The study found that the capital adequacy ratio had a positive and significant effect on the P/B ratio. Under signaling theory, firms use observable financial indicators to reduce information asymmetry. A high capital adequacy ratio signals financial strength, prudent management, and resilience to losses, lowering perceived risk and boosting investor confidence (
Jakubik & Moinescu, 2024). This leads investors to value the bank’s equity above its book value, reflected in a higher P/B ratio. The result confirms that strong capitalization serves as a credible signal of stability and growth potential. Beyond regulatory compliance, it enhances market valuation, attracts investment, and supports financial flexibility in day-to-day operations.
Similarly, the study found a positive and significant relationship between leverage and the P/B ratio. Signaling theory suggests that firms use financial structure to convey expectations of future performance. Higher leverage may indicate management’s confidence in stable earnings and debt-servicing capacity, reducing investor uncertainty and increasing equity valuation (
Arhinful et al., 2024). This supports the idea that moderate leverage signals growth prospects and efficient capital use. The positive effect may also stem from tax advantages and improved returns on equity. For banks, this underscores the strategic value of managing leverage carefully to enhance market perception and investor confidence, while avoiding excessive risks that could undermine these benefits.
The moderating relationship between NPLs and bank age discovered a negative and significant impact on the P/B ratio. Elevated NPLs undermine the stability and reliability that older banks are meant to embody. Investors may perceive significant NPLs as indicative of poor asset management, thereby overshadowing the advantages of a bank’s longevity (
Girón & Silva, 2021).
Rising NPL levels can compromise the reputation of even established banks, potentially leading investors to reassess the bank’s risk profile. Due to this change in perception, investors may be less willing to pay the bank’s book value premium, indicating a growing distrust (
Gennaioli & Shleifer, 2018). Moreover, the interaction suggests that older banks with significant NPLs may struggle to manage their risks efficiently. This perception may exacerbate investor apprehensions about the bank’s future performance and capacity to yield sufficient returns, further reducing the bank’s market valuation.
This highlights to investors the necessity of considering a bank’s asset quality alongside its age when making financial decisions. Safety is not assured in the presence of significant NPLs alongside advanced age. This indicates that bank management should prioritize enhancing asset quality, even if it requires reallocating cash from expansion efforts to risk management (
Bessis, 2011). Clear communication about strategies to address NPLs and enhance credit quality is essential to mitigate negative perceptions and restore investor confidence. This will ultimately enhance the P/B ratio.
6. Conclusions
This study was driven by the critical role of investor confidence in promoting financial stability and the long-term sustainability of banks, particularly those listed on the New York Stock Exchange. Despite its importance, there is limited understanding of how NPLs influence investor confidence and trust in banking institutions. Furthermore, the potential moderating effect of bank age on the relationship between NPLs and investor confidence remains underexplored, representing a notable gap in the literature.
To address these gaps, this study employed purposive sampling to select 253 banks from the Thomson Reuters Eikon DataStream, applying rigorous inclusion and exclusion criteria. Advanced econometric techniques, including the CCEMG and GMM models, were used to ensure robust and reliable results. The study provides important insights into how financial performance is affected by adversity and how banks can maintain investor trust and achieve sustainable growth. These findings contribute meaningfully to both academic discourse and practical strategies in the banking sector.
Empirical results revealed that NPLs had a negative and significant effect on both P/E and P/B ratios, indicating a decline in investor confidence. The return on equity (ROE) showed a negative and significant impact on the P/E ratio, but a positive and significant effect on the P/B ratio. Additionally, the interaction between NPLs and bank age had a negative and significant influence on both performance metrics, suggesting that bank age intensifies the adverse effect of NPLs on investor perceptions.
7. Theoretical Implication
The findings reinforce the relevance of the signaling theory in explaining how financial indicators shape investor perceptions, while also refining its application in the banking sector. They show that investors respond not only to signals such as asset quality but also interpret these signals differently based on contextual factors like bank age. This suggests that signaling theory must consider institutional characteristics that influence the credibility and interpretation of financial signals, moving beyond a one-size-fits-all approach.
The moderating role of bank age adds depth to the signaling theory by demonstrating that identical financial signals can carry different implications depending on a bank’s reputation and history. For older banks, negative signals may attract greater investor scrutiny due to heightened expectations for transparency and risk management. This refinement highlights the need for the signaling theory to account for the dynamic interaction between signal content and institutional context to more accurately explain investor behavior.
Overall, these insights support a more nuanced application of the signaling theory in banking research—one that incorporates both financial signals and the institutional environments in which they are interpreted. This enriched framework enhances our understanding of investor decision-making and strengthens the theory’s relevance in analyzing financial distress and confidence in the banking sector.
8. Policy Implication
High levels of NPLs indicate declining asset quality and financial instability, which can severely weaken investor confidence and disrupt market stability. To mitigate these risks, regulators must strengthen supervisory frameworks that closely monitor a bank’s asset quality and risk exposure. The early detection of rising NPLs enables timely intervention, reducing the likelihood of systemic crises and preserving trust in the banking sector.
Transparency and timely disclosure are essential regulatory tools for maintaining market stability. Regulators should require standardized and comprehensive reporting of NPLs, ensuring investors have access to accurate, up-to-date information. This reduces information asymmetry and prevents panic-driven market responses. Clear communication from regulators about the sector’s health also helps to reassure investors and sustain confidence.
Beyond monitoring and disclosure, regulators can support banks with high NPLs through targeted measures such as recapitalization programs, asset quality reviews, or the establishment of asset management companies to offload bad loans. These interventions strengthen bank balance sheets, enhance resilience, and restore investor trust. By combining robust oversight, improved transparency, and practical support, regulators can promote financial stability and foster a more resilient banking system.
9. Practical Recommendations for Bank Management
Bank management should prioritize strengthening risk assessment and loan monitoring systems to detect and address potential NPLs at an early stage. Implementing advanced credit risk models and conducting regular portfolio reviews can identify asset quality deterioration before it escalates, allowing timely interventions that protect investor confidence and support financial stability.
Enhancing transparency and communication with investors is equally crucial. Management should ensure clear, accurate, and timely disclosures of NPL levels and recovery plans. Transparent reporting reduces uncertainty, builds trust, and demonstrates the bank’s commitment to managing asset quality effectively.
In addition, banks should adopt comprehensive NPL management strategies, including asset restructuring and innovative recovery solutions. Strengthening internal controls, improving governance practices, and investing in staff training in credit risk management further enhance institutional resilience. These proactive measures help minimize losses, reinforce investor confidence, and support sustainable growth in uncertain market conditions.
10. Limitation of the Study and Future Directional Studies
This study has several limitations that warrant consideration. Data were obtained from Thomson Reuters Eikon DataStream, focusing exclusively on banks listed on the New York Stock Exchange from 2006 to 2023. After identifying an initial pool, a rigorous screening process was applied to ensure data completeness and alignment with the predefined inclusion criteria. Many banks were excluded due to incomplete records or failure to meet selection standards, resulting in a final sample of 253 banks. While this ensures a robust dataset, it limits the study’s scope to U.S.-listed banks. Future research could broaden the analysis by including banks from other stock exchanges or regions to test the consistency of findings across diverse regulatory and market contexts.
The exclusion of non-U.S. banks may introduce sample bias, restricting the diversity of banking practices and economic conditions considered. Reliance on secondary data also poses challenges, such as potential inaccuracies, reporting inconsistencies, and limited control over data quality. As a result, the generalizability of findings beyond the U.S. may be constrained by differences in regulatory frameworks and banking structures. Future studies could address these limitations by incorporating a more diverse sample and utilizing primary data sources.
Further research could also distinguish between commercial and investment banks to explore whether the effects of non-performing loans and capital structure variables on investor confidence vary by bank type. Given their distinct business models, regulatory requirements, and risk profiles, investors may interpret financial indicators differently across these segments. A comparative analysis could uncover sector-specific signaling dynamics and support the development of tailored regulatory and managerial strategies.


