Article

Sustainable Investments in the Blue Economy: Leveraging Fintech and Adoption Theories

1
University School of Business, Chandigarh University, Mohali 140413, India
2
Faculty of Economics and Social Sciences, University of Latvia, LV-1586 Riga, Latvia
3
Women Researchers Council (WRC), Azerbaijan State University of Economics (UNEC), Baku AZ1001, Azerbaijan
*
Author to whom correspondence should be addressed.
J. Risk Financial Manag. 2025, 18(7), 368; https://doi.org/10.3390/jrfm18070368
Submission received: 27 May 2025 / Revised: 24 June 2025 / Accepted: 29 June 2025 / Published: 2 July 2025
(This article belongs to the Special Issue Financial Technology (Fintech) and Sustainable Financing, 3rd Edition)

Abstract

This study investigates the attributes influencing the adoption of fintech services for sustainable investment within the blue economy. Specifically, it integrates the Diffusion of Innovations (DOI) theory and the Technology Acceptance Model (TAM) to examine how the perceived relative advantages, compatibility, complexity, trialability, and observability of fintech services influence their perceived ease of use and perceived usefulness, and it explores their impact on the intention to adopt fintech services. Finally, the study assesses how the intention to adopt fintech services affects sustainable investment decisions in the blue economy. Data were collected from 224 stakeholders in the blue economy sectors in India during the summer of 2024 and analyzed using structural equation modeling with partial least squares (SEM-PLS). The results reveal which attributes significantly influence perceived ease of use and perceived usefulness. Additionally, perceived ease of use and perceived usefulness significantly influence the intention to adopt fintech services. The intention to adopt fintech services positively impacts sustainable investment decisions in the blue economy. This study provides a comprehensive framework for advancing fintech services that support sustainable investment decisions, thereby contributing to the growth of the blue economy.

1. Introduction

The blue economy, which encompasses the sustainable utilization of ocean resources to foster economic growth, enhance livelihoods, and create jobs, has increasingly been recognized as an essential element of sustainable development. Despite this, sectors related to the ocean face considerable investment challenges due to high perceived risks, fragmented governance, financial inefficiencies, and insufficient transparency (Novaglio et al., 2024). These barriers obstruct the capacity to channel responsible investments into marine innovations, environmental stewardship, and community resilience. Addressing these constraints requires innovative financial mechanisms that can improve the flow, transparency, and accountability of investments in marine sectors.
Financial technology (fintech) provides a logical solution to these requirements. The application of digital tools such as mobile payments, blockchain, AI-driven analytics, and online lending enables fintech to improve the efficiency, traceability, and inclusiveness of financial systems (Boot et al., 2021; Bose & Srinivasan, 2024). In the realm of marine sustainability, fintech solutions play a crucial role in enhancing risk assessment, optimizing ESG compliance, and broadening access to funding—especially for smaller stakeholders and local communities (Wenhai et al., 2019). The potential of fintech in the blue economy is significant; however, its adoption is currently limited (Ha, 2024). This situation calls for a thorough examination of the factors that affect its uptake (Singh et al., 2020).
This research utilizes two theoretical frameworks to analyze these components: the Technology Acceptance Model (TAM) and the Diffusion of Innovations (DOI) theory. The TAM (Davis, 1989) highlights the significance of perceived usefulness and perceived ease of use as determinants of user adoption. The DOI theory, as articulated by Rogers in 1962 (Rogers, 1962) and revisited in 2003 (Rogers, 2003), delineates five key characteristics of innovation: relative advantage, compatibility, complexity, trialability, and observability, all of which significantly impact the adoption of new technologies. These models have been extensively applied in various technological fields, such as fintech, yet they remain insufficiently examined within the context of ESG-driven marine environments (Thottoli et al., 2024).
Earlier studies have enhanced these models by integrating factors such as trust and privacy (Tamasiga et al., 2022), or by merging them with behavioral frameworks like the Norm Activation Model (Ganjipour & Edrisi, 2023b). Nevertheless, the majority of research continues to concentrate on banking and consumer applications (Laidroo et al., 2021), neglecting the potential of ESG-oriented applications within the blue economy. This study aims to fill the identified gap by combining the DOI and TAM frameworks to analyze the impact of RA, COM, COMP, TR, and OBS on PU and PEU, which in turn affects the intention to adopt fintech services (IAFS). Additionally, we introduce the context-specific outcome variable—sustainable investment decisions in the blue economy (SIBE)—to examine whether adoption translates into responsible investment behavior aligned with the ESG principles.
India presents a compelling framework for examination, characterized by its vast coastal geography and the development of its digital infrastructure. The nation features a coastline that extends roughly 7500 km, with close to 30% of its population living in coastal areas. The contribution of ocean-based sectors, such as fisheries, marine tourism, and shipping, to the national GDP is approximately 4%, which translates to an estimated annual value of around USD 300 billion (KPMG, 2024). India encounters considerable challenges regarding marine sustainability, including overexploited fisheries, increasing coastal erosion, and pervasive plastic pollution. Strategic initiatives such as the Sagarmala Programme and the Blue Economy 2047 Vision have been introduced to tackle these challenges; however, ongoing deficiencies in systemic investment, inter-agency coordination, and environmental monitoring impede successful execution (Ministry of Shipping, GOI, Government of India, 2025). Simultaneously, India has positioned itself as a prominent player in the fintech sector, boasting an adoption rate of 87%, which significantly exceeds the global average of 67%. This trend is primarily fueled by the notable success of the Unified Payments Interface (UPI) (Capital Market, 2025).
Based on data collected in mid-2024 from 224 blue economy stakeholders in India, this study uses partial least squares structural equation modeling (PLS-SEM) to test the hypothesized relationships within the proposed model. This research contributes in three key ways. First, it applies an integrated TAM-DOI model to a novel context: sustainable fintech adoption in ocean-based investment sectors. Second, it introduces the construct of SIBE to capture ESG-driven decision-making in the blue economy. Third, it provides practical insights for fintech developers, sustainability investors, and policymakers aiming to enhance responsible capital flows in marine environments.
The remainder of this paper is organized as follows. Section 2 presents the theoretical foundations and the literature relevant to fintech adoption and sustainable investment in the blue economy. Section 3 outlines the research methodology, including the model specification, data collection, and analytical approach. Section 4 reports the empirical results based on structural equation modeling. Section 5 offers a critical discussion of the findings in light of the theoretical framework and contextual factors. Finally, Section 6 concludes the paper by summarizing the key contributions, policy implications, and directions for future research.

2. Grounding Theories and Literature Review

This section discusses the theoretical grounding of and literature on the adoption of fintech services, focusing on two key frameworks: the DOI theory and the TAM. These structures are combined to understand adoption behaviors, particularly regarding sustainable investment decisions in the blue economy.

2.1. Diffusion of Innovation Theory (DOI)

The Diffusion of Innovation (DOI) theory, formulated by Rogers (1962, 2003), offers a robust framework for analyzing the mechanisms by which new technologies and practices disseminate within a social system over time. It outlines five fundamental attributes that influence adoption behavior: relative advantage, compatibility, complexity, trialability, and observability. The relevance of these characteristics becomes apparent when examining the adoption of fintech services in intricate investment contexts like the blue economy.
Within the realm of financial technology, DOI has demonstrated its utility in elucidating user behavior and the adoption patterns of institutions (Taherdoost, 2018). Nonetheless, a significant portion of the literature utilizes the theory within general or commercial frameworks, neglecting to consider scenarios involving environmentally conscious investments. While prior studies acknowledge the importance of innovation, and attributes such as perceived benefit and ease of integration have been discussed (Jain et al., 2023), there is limited examination of these dimensions in a collective manner, or specifically within sustainability-focused domains.
Relative advantage denotes the extent to which fintech is viewed as a superior alternative to conventional systems, providing enhancements in efficiency, transparency, and cost-effectiveness (Hafner et al., 2020). Compatibility pertains to the degree to which fintech corresponds with established values, investment methodologies, and ESG requirements (Venkatesh et al., 2002). Conversely, complexity indicates the perceived challenges associated with utilizing fintech solutions, which can often hinder adoption when systems are not intuitively designed or when adequate user training is absent (Liu et al., 2024). Trialability refers to the degree to which fintech services can be evaluated on a restricted scale, aiding in the reduction in perceived risks and enhancing user familiarity (Park, 2024). Ultimately, observability relates to the clarity of advantages derived from fintech implementation, including enhanced ESG reporting or decision-making processes, which could strengthen trust and encourage adoption (Valizadeh et al., 2020).
While the model is widely applied, many current studies tend to concentrate on specific attributes, or do not adequately place them within the context of high-stakes, value-driven sectors such as sustainable investing. The limited scope of DOI restricts its ability to provide comprehensive explanations in areas that necessitate ethical, social, and environmental considerations. This study integrates all five innovation attributes to provide a thorough and contextually relevant understanding of fintech adoption within the blue economy.

2.2. Technology Acceptance Model (TAM)

The Technology Acceptance Model (TAM), introduced by Davis in 1989, is an adaptation of the Theory of Reasoned Action (TRA) formulated by Fishbein and Ajzen (1975), which aimed at providing a clearer understanding of user acceptance of technology. This model has garnered extensive empirical backing and continues to be a significant framework in information systems research, especially in analyzing the behavioral intention behind the adoption of technological innovations.
The TAM highlights two fundamental concepts: perceived usefulness (PU) and perceived ease of use (PEU). PU indicates the extent to which a user perceives that a technology will improve their performance, whereas PEU denotes the extent to which the user perceives that utilizing the technology will require minimal effort, according to Davis. Within the realm of fintech, PU is frequently linked to improved investment decision-making, increased efficiency, and better financial management (Sharma et al., 2024b). Users who recognize the utility of fintech services tend to cultivate positive attitudes and a greater likelihood of adopting these services (Shahzad et al., 2022). PEU influences the extent to which users perceive these tools as intuitive and accessible. A favorable view of ease of use can strengthen perceptions of usefulness, as users tend to concentrate on their financial goals rather than technological obstacles (Davis, 1993).
Although the TAM initially highlighted PU and PEU as key factors influencing user intention, recent studies have raised concerns about the adequacy of these two elements in fully understanding the intricacies of contemporary technology adoption. The evolution of digital technologies and the shifting expectations of users suggest that depending solely on PU and PEU could be restrictive (Venkatesh & Davis, 2000). In response, researchers have expanded the Technology Acceptance Model to include elements like trust, risk, and perceived value, especially in studies related to fintech adoption, where user behavior is shaped by both technological and contextual influences (Ganjipour & Edrisi, 2023a).
This research utilizes the Technology Acceptance Model to evaluate how perceived usefulness and perceived ease of use affect users’ intentions to adopt fintech tools for sustainable investment. By integrating the TAM with DOI, we seek to offer a more thorough understanding of user decision-making, recognizing the impact of innovation characteristics and the specific contextual variables inherent to the blue economy.

2.3. Intention to Adopt Fintech Services (IAFS)

The intention to adopt fintech services (IAFS) denotes the readiness or strategy of individuals or organizations to initiate the use of financial technologies (Lee & Shin, 2018). This factor is a key indicator of real adoption behavior and functions as a primary outcome variable in both the Technology Acceptance Model (TAM) and the Diffusion of Innovation (DOI) framework.
Innovation adoption has been a significant focus in IT and organizational studies (Gosain, 2004). Researchers often differentiate between adoption, which refers to the decision made by individuals or organizations to utilize a new technology, and diffusion, which pertains to the wider dissemination of that technology within a social system (Wejnert, 2002). While both dimensions hold significance, the existing literature frequently emphasizes adoption, especially within the realm of fintech (Mahmud et al., 2022). Certain scholars contend that overlooking usage patterns or the wider diffusion process results in an inadequate understanding of innovation acceptance (Rupeika-Apoga & Wendt, 2022).
Recent studies have started to integrate various theoretical models to overcome these limitations and offer a more comprehensive understanding of adoption. For instance, Alam et al. (2018) integrated the DOI, TAM, and the Theory of Planned Behavior (TPB) to examine mobile banking in Malaysia, whereas Ganjipour and Edrisi (2023b) utilized the Norm Activation Model (NAM) to analyze robotics adoption. In a similar vein, Jahangir and Zia-ul-Haq (2023) utilized a hybrid DOI–TAM–TPB framework in the context of digital marketplaces. These integrative approaches emphasize the importance of merging user-focused and innovation-focused viewpoints.
Nonetheless, these integrative studies have largely concentrated on traditional digital services, showing a restricted application in contexts that prioritize high-impact sustainability. The function of IAFS in facilitating sustainable investment via fintech, particularly within sectors such as the blue economy, is notably underexplored. Addressing this gap is crucial for understanding how financial technology can facilitate investment practices that prioritize environmental and social responsibility.

2.4. Sustainable Investment Decisions in the Blue Economy (SIBE)

The concept of sustainable investment decisions in the blue economy (SIBE), as outlined in this study, entails the strategic allocation of capital aimed at fostering the responsible utilization of ocean resources. This approach seeks to drive economic growth, enhance livelihoods, and maintain the integrity of ecosystems. The decisions integrate environmental, social, and governance (ESG) criteria to evaluate financial performance alongside non-financial impacts. SIBE holds significant importance in various sectors, including fisheries, renewable ocean energy, marine tourism, and marine biotechnology—fields where maintaining the ecological balance and ensuring long-term sustainability are essential.
While SIBE has not yet been fully defined in the literature, it is grounded in two well-established concepts: sustainable investment and the blue economy. Sustainable investment involves strategies that incorporate ESG factors into the selection and management of portfolios, with the objective of achieving beneficial societal results while maintaining long-term returns (Remer, 2023). The blue economy is characterized by the sustainable use of ocean resources, aimed at fostering economic development and generating employment, all while ensuring the protection of marine ecosystems (Selamoglu, 2021; Yousef, 2024).
Current research regarding the blue economy predominantly focuses on aspects of environmental safeguarding and economic robustness (Spalding, 2016), frequently emphasizing sector-specific issues like overfishing, pollution, and the enforcement of regulations. Nevertheless, there has been insufficient focus on the methods investors use to assess opportunities in this sector, as well as the technological and informational resources that could enhance the sustainability of financial decision-making. Various elements, including perceived environmental impact, policy frameworks, and sustainability risks, have been demonstrated to affect investment behavior (Narwal et al., 2024). However, the influence of technology, especially fintech, has not been thoroughly examined.
Recent studies indicate that advancements in technology have the potential to expedite sustainable transitions through enhanced data accessibility, increased transparency, and improved decision-making tools (Bharadwaj, 2021). However, there is a scarcity of research that specifically investigates the applicability of fintech adoption frameworks, such as the TAM and DOI, within sustainability-focused investment scenarios like the blue economy. Rahman et al. (2023) examined fintech diffusion with an emphasis solely on compatibility, neglecting other essential factors like observability and trialability. This limited scope restricts the capacity to extrapolate results or formulate thorough adoption strategies.
This study aims to address this gap by integrating the DOI and TAM. This analysis evaluates the interplay between the characteristics of innovation, as outlined in the Diffusion of Innovations theory, and the user perceptions derived from the Technology Acceptance Model in relation to their combined effect on the intention to adopt fintech solutions for sustainable investment.

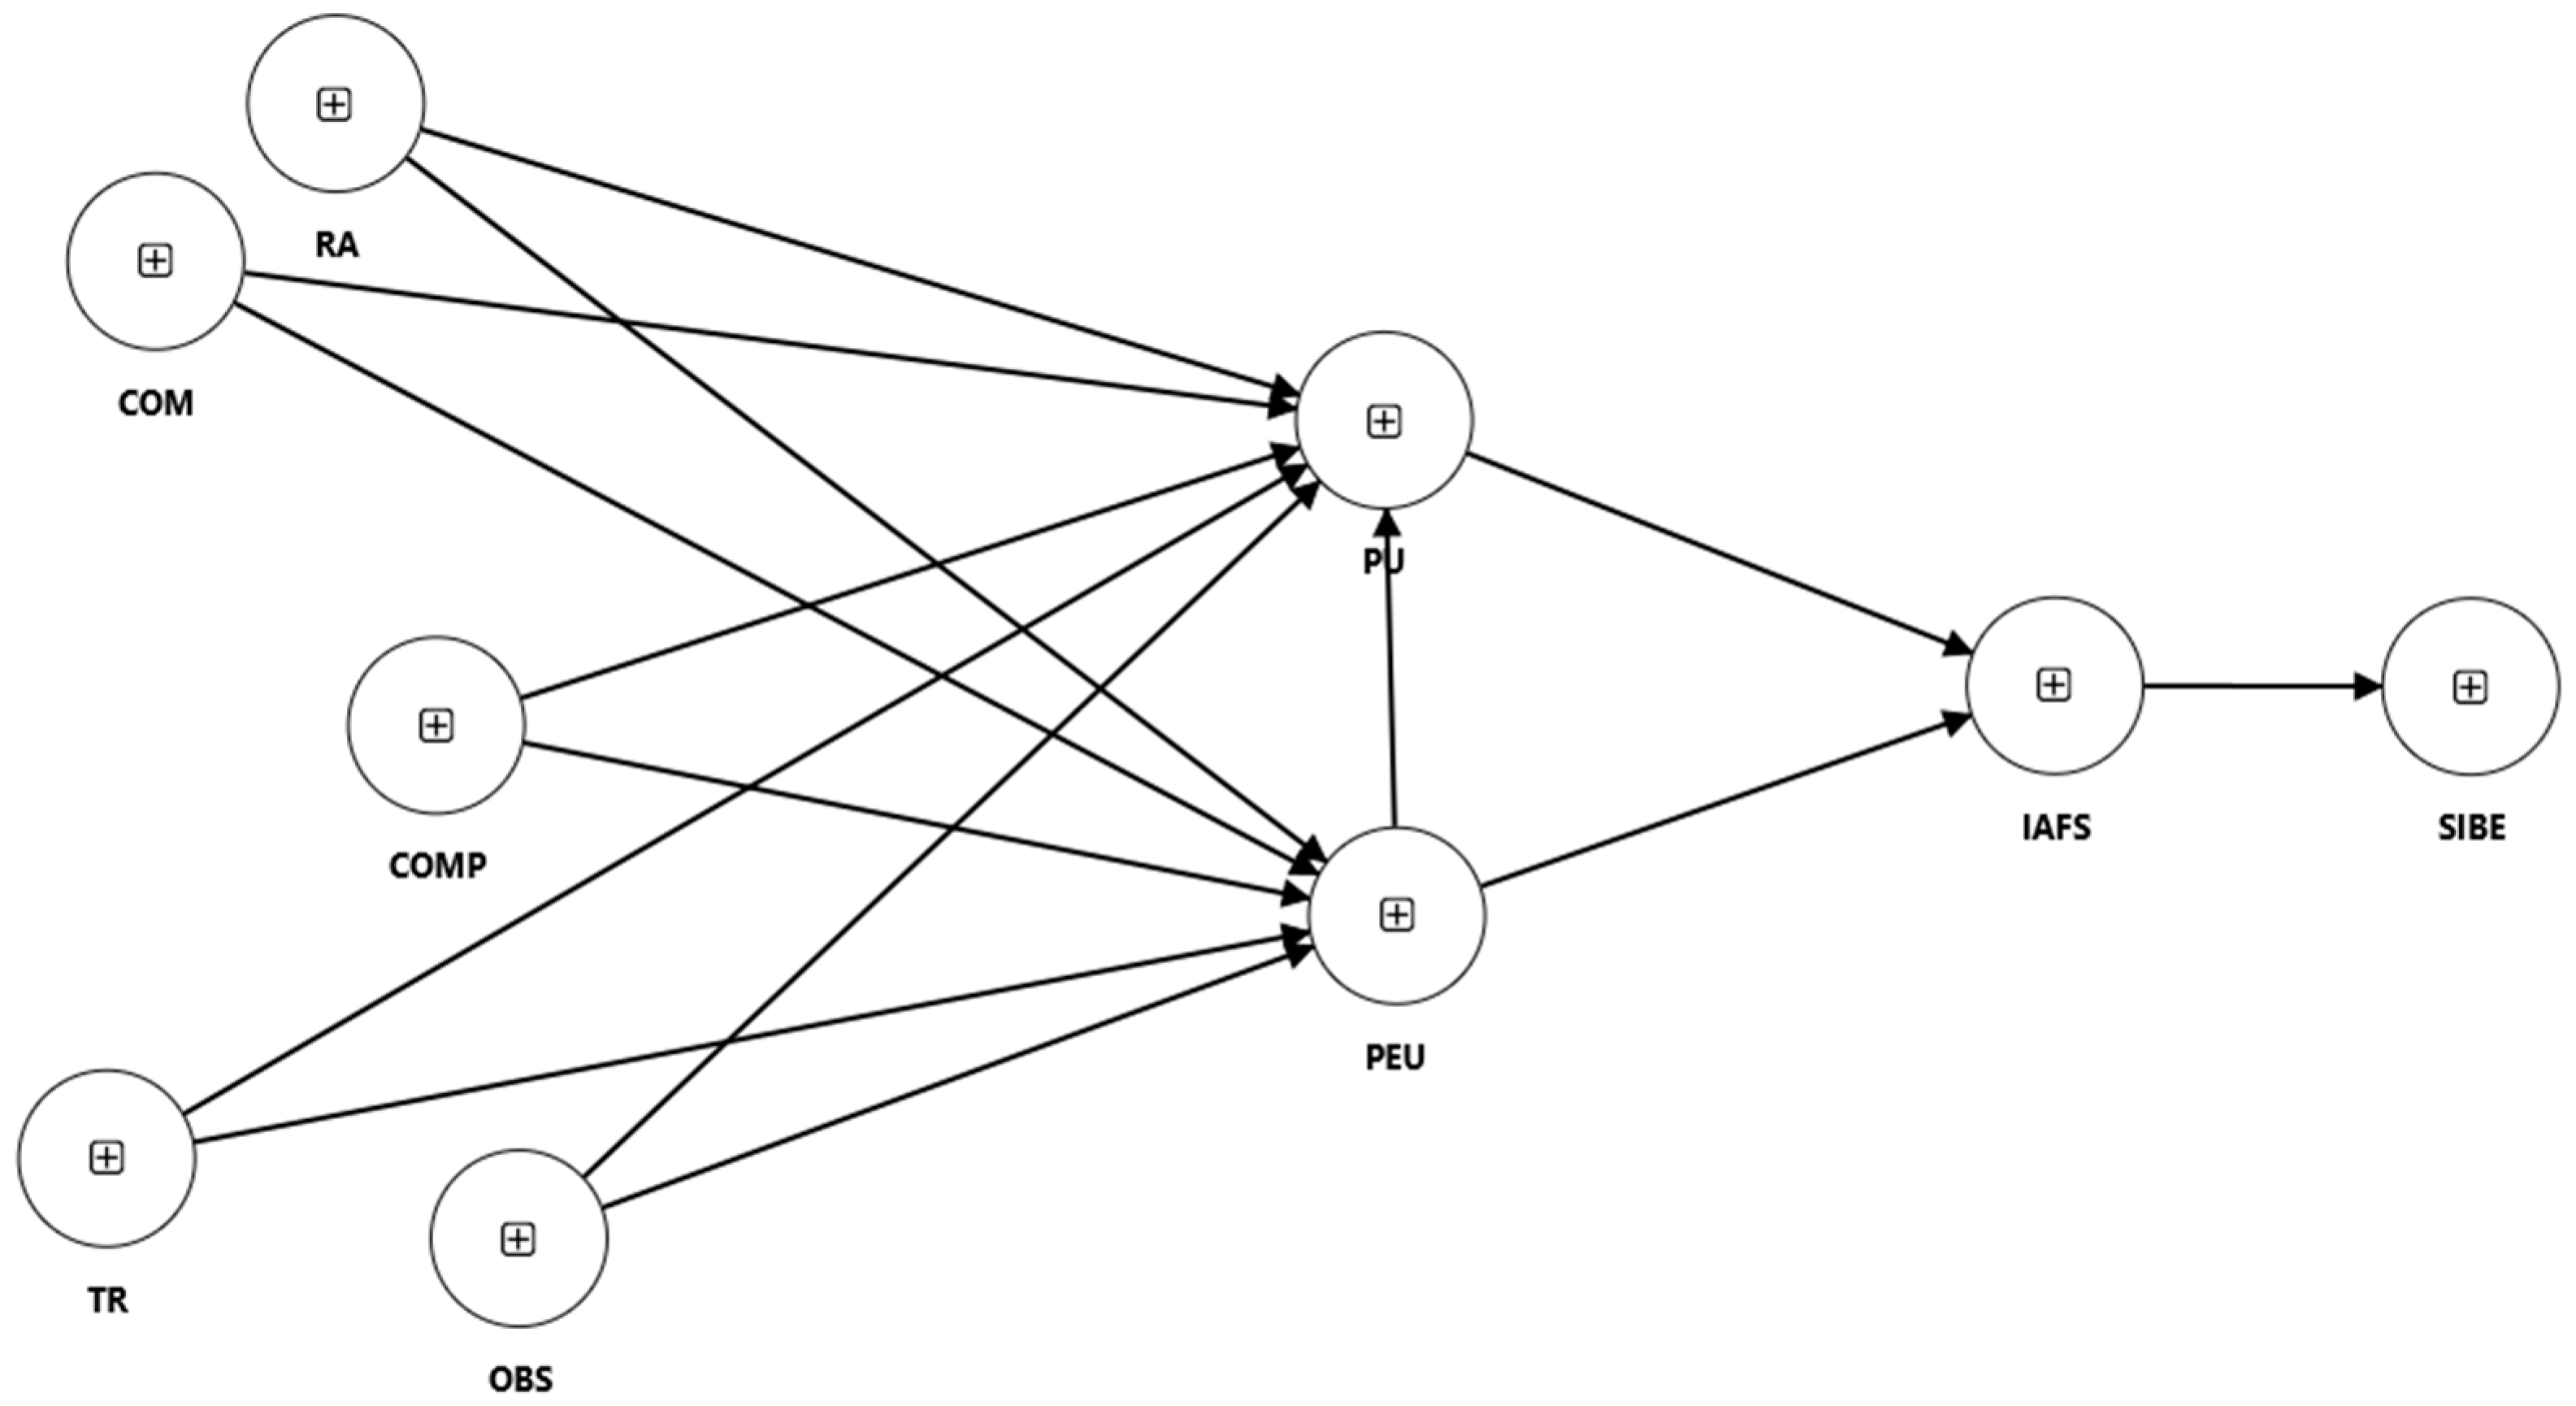
2.5. Hypothesis Development

This study examines the adoption of fintech services for sustainable investments in the blue economy. To maintain clarity and avoid redundancy, the context of “fintech services for sustainable investments in the blue economy” is established at the outset and applies to all hypotheses discussed below.
Relative advantage (RA) bears similarities to the concept of perceived usefulness (G. C. Moore & Benbasat, 1991). While RA involves comparing a new solution to past solutions, perceived usefulness (PU) concerns the extent to which a user perceives the usage of a given solution to improve their work efficiency (Yeh & Teng, 2012). When users perceive significant advantages from fintech solutions, they are likely to find these tools useful for sustainable investments (Abdul-Rahim et al., 2022). Fintech solutions that provide more efficient, cheaper, and accessible opportunities to invest in securities are likely to be used by stakeholders, especially when these solutions are sustainable. Bureshaid (2021) supports this view, highlighting that fintech solutions that provide more efficient, cheaper, and accessible opportunities are likely to be adopted by bank consumers. Therefore, we hypothesize the following:
H1. 
The perceived relative advantage (RA) is positively associated with their perceived usefulness (PU).
In addition to influencing perceived usefulness, relative advantage may also impact perceptions of ease of use. Fintech solutions that offer clear efficiency gains—such as time savings or improved accessibility—may encourage users to invest effort in learning how to use them, thereby lowering perceived difficulty (Amnas et al., 2023; Dwianto et al., 2024). Over time, familiarity gained through perceived benefit can lead users to view the technology as easier to use. As prior work notes, a high perceived value may offset initial complexity and reduce resistance to use (Jha & Dangwal, 2024). Therefore, we hypothesize the following:
H2. 
The perceived relative advantage (RA) is positively associated with their perceived ease of use (PEU).
When fintech tools are more compatible with traditional systems and existing business models, it becomes easier for investors to understand and embrace these tools. This compatibility can include integration with existing systems for environmental reporting, or frameworks aimed at sustainable finance. When fintech solutions align with traditional approaches to investment management, they offer benefits such as better decision-making, growth efficiency, and more sustainable reporting (Dadabada, 2025). Bureshaid (2021) supports this view, highlighting that compatibility with existing systems and practices enhances PU. This alignment suggests that stakeholders will view fintech as valuable and beneficial for their goals in the blue economy. Therefore, we hypothesize the following:
H3. 
The perceived compatibility (COM) is positively associated with their perceived usefulness (PU).
Enhanced compatibility with the current systems and procedures makes the system easier to implement, since there is little need for additional training or redesigning other processes (Venkatesh et al., 2002). Accordingly, fintech solutions that can be easily incorporated into today’s established best practices of blue economy investment vehicles are considered more user-friendly and hence receive more support. Fintech solutions for sustainable blue economy investments that are more compatible with existing practices are likely to be perceived as easier to use, potentially facilitating their adoption and integration into investment processes (Thiele & Gerber, 2017). Therefore, we hypothesize the following:
H4. 
The perceived compatibility (COM) is positively associated with their perceived ease of use (PEU).
When fintech solutions are perceived as overly complex, stakeholders may struggle to integrate them into existing systems or face steep learning curves, making the solutions appear burdensome rather than beneficial (Liu et al., 2024). High complexity can deter adoption by increasing the effort required to understand and apply the technology (Alamsyah et al., 2021). This perception undermines the solution’s usefulness, as inefficiencies and operational barriers outweigh potential benefits. Prior studies confirm that increased complexity is associated with lower perceived usefulness (Wischnewski, 2020). Therefore, we hypothesize the following:
H5. 
The perceived complexity (COMP) is negatively associated with their perceived usefulness (PU).
This complexity also influences perceptions of ease of use. When users encounter systems that are difficult to navigate or require substantial learning, they are less likely to consider them user-friendly (Gregor & Benbasat, 1999). The added cognitive and procedural demands lower usability, which in turn reduces adoption likelihood. Prior findings emphasize the importance of simplicity in enhancing accessibility (Aysan & Bergigui, 2021). Thus, we hypothesize the following:
H6. 
The perceived complexity (COMP) is negatively associated with their perceived ease of use (PEU).
When users have the opportunity to test fintech solutions before committing to full adoption, they gain first-hand experience with the technology’s features and benefits. This trial phase reduces perceived risk and enhances understanding of the tool’s value, particularly in improving investment efficiency, operational workflows, and sustainability reporting (Roh et al., 2024). Direct interaction helps users form a clearer perception of the solution’s practical advantages, strengthening beliefs about its utility (Abdul-Rahim et al., 2022). Therefore, we hypothesize the following:
H7. 
The perceived trialability (TR) is positively associated with their perceived usefulness (PU).
Trialability also contributes to ease of use by enabling users to explore a fintech system in a controlled or limited manner. This process allows them to understand how well the technology integrates with existing workflows and regulatory expectations in sustainable investment contexts. Exposure through experimentation reduces perceived complexity and fosters familiarity with the interface and functionality (Sanchez et al., 2020; Yoon et al., 2020). Thus, we hypothesize the following:
H8. 
The perceived trialability (TR) is positively associated with their perceived ease of use (PEU).
Perceived observability (OBS) is valuable in the adoption of new technologies, as it allows potential users to see the tangible benefits and successful outcomes of the innovation, thereby reducing uncertainty and increasing trust in the technology (Poorangi et al., 2013). The visible success of fintech solutions reassures potential users that the technology is practical and beneficial (Bakkabulindi, 2014). When the benefits of fintech solutions are easily observable, they reduce the perceived complexity, making the technology seem more accessible and less intimidating (Valizadeh et al., 2020). Therefore, we hypothesize the following:
H9. 
The perceived observability (OBS) is positively associated with their perceived usefulness (PU).
Beyond shaping perceptions of utility, observability can influence how users assess the ease of using fintech tools. When stakeholders can visibly track how fintech applications improve processes—such as enhancing efficiency or simplifying ESG compliance—they are more likely to perceive the technology as accessible and user-friendly (Park, 2024). In sustainability-oriented sectors like the blue economy, where transparency and performance visibility are essential, observability helps to demystify technological complexity (Rashidi et al., 2015; Valizadeh et al., 2020). Thus, we hypothesize the following:
H10. 
The perceived observability (OBS) is positively associated with their perceived ease of use (PEU).
When fintech solutions are easy to understand and navigate, users are more likely to feel comfortable using them, which enhances their perception of usefulness (Nizar et al., 2024). In the blue economy, where many users may lack prior exposure to sustainable finance platforms, the ease of use lowers entry barriers and reduces the cognitive load associated with complex investment decisions (Lun et al., 2024). By simplifying the user experience, fintech tools enable investors to concentrate on their financial and sustainability goals. This link between ease of use and perceived usefulness is well established in both the DOI and TAM frameworks, which emphasize that usability directly supports perceived value (Ahn & Park, 2023). Therefore, we hypothesize the following:
H11. 
The perceived ease of use (PEU) is positively associated with their perceived usefulness (PU).
Perceived usefulness is widely recognized as a key driver of behavioral intention to adopt new technologies. When users believe that fintech services improve investment performance, efficiency, or decision-making, their likelihood of adoption increases (Gupta et al., 2024). This relationship is foundational to the TAM, where usefulness has a direct effect on intention (Davis, 1989). Within the sustainability-oriented blue economy, where the stakes include both financial return and ecological outcomes, recognizing the utility of fintech solutions becomes even more critical for adoption. Thus, we hypothesize the following:
H12. 
The perceived usefulness (PU) is positively associated with the intention to adopt fintech services (IAFS).
When users perceive fintech solutions as easy to use, they are more likely to develop favorable attitudes toward their adoption—even before fully evaluating the benefits. A straightforward interface and intuitive user experience can reduce resistance and enhance trust, especially among stakeholders unfamiliar with digital investment tools. This direct effect of perceived ease of use on adoption intention is well supported in the technology acceptance literature (Davis, 1989; Shahzad et al., 2022). In the context of sustainable investing, ease of use becomes particularly important, as users must often engage with complex ESG-related data and tools (Jetzek, 2017). Therefore, we hypothesize the following:
H13. 
The perceived ease of use (PEU) is positively associated with the intention to adopt fintech services (IAFS).
Fintech services have significantly altered the financial landscape by enhancing access to information and expanding participation in investment markets. By utilizing data-driven platforms and sophisticated tools, fintech enables investors to make well-informed decisions, including those that align with sustainability objectives (Zhou et al., 2022). This heightened clarity allows for a more thorough evaluation of sustainable investment prospects. The straightforward and intuitive design of fintech platforms effectively reduces barriers to entry, thereby enhancing the accessibility of sustainable investing for a broader demographic (Gomber et al., 2017).
Alongside enhancements in processes, fintech firms provide cutting-edge financial products—like green bonds and ESG-linked instruments—that actively contribute to environmental initiatives (Lee & Shin, 2018). These tools integrate financial goals with sustainability results, especially in developing areas such as the blue economy. Additionally, fintech platforms frequently offer educational resources that improve the understanding of sustainable investment strategies (Dorfleitner et al., 2017), which particularly attracts younger investors who prioritize sustainability (Bollaert et al., 2021).
Personalization serves as a significant factor in driving outcomes. By utilizing big data and AI, fintech platforms are capable of providing customized investment recommendations that focus on both potential returns and environmental considerations (Jagtiani & Lemieux, 2019). Although previous research has examined the connection between fintech utilization and sustainable investment, there is a notable lack of focus on this interaction within the context of the blue economy.
This study investigates the extent to which the intention to adopt fintech services plays a significant role in influencing sustainable investment behavior within the blue economy. Consequently, we propose the following hypothesis:
H14. 
The intention to adopt fintech services (IAFS) is positively associated with sustainable investment decisions in the blue economy (SIBE).
The discussed theories and models are summarized in Figure 1, which illustrates the relationships between the DOI and TAM constructs and their impact on the IAFS and SIBE.

3. Research Methods

To validate the model and develop hypotheses, a comprehensive questionnaire was designed as the primary data collection instrument. This method was selected for its capability to collect a large number of responses, capturing an extensive range of variables relevant to the research (Bergmann et al., 2016). The questionnaire facilitated the systematic and purposeful collection of quantitative data, which was essential for testing the anticipated hypotheses and ensuring the credibility and accuracy of the findings. The questionnaire was meticulously developed to encompass all aspects of the study. It was divided into two sections, each addressing different facets of the research. The first section focused on the hypotheses, incorporating items designed to measure the hypotheses proposed in the study. To ensure the validity of the questions, both internal and face validity tests were conducted. Internal validity was maintained by constructing items based on theoretical assertions of the factors. This involved a thorough review of the existing literature and theoretical frameworks relevant to the study. Each item in the questionnaire was carefully planned to align with the constructs being measured, ensuring that the questions accurately reflected the theoretical concepts. Face validity was established through consultations with a board of eight experts from both academia and industry. These professionals were nominated based on their extensive familiarity with and understanding of fintech, sustainable investments, and the blue economy. The panel included the following:
  • Academic experts: four professors and researchers from leading universities in India and internationally, specializing in fintech, sustainable finance, and technology adoption models, with a focus on applications within the blue economy;
  • Industry experts: four professionals from the fintech sector, including senior executives, product managers, and consultants with practical experience in fintech solutions and their implementation in sustainable investment contexts, particularly within the blue economy.
These experts reviewed the questionnaire to ensure that the items were clear, relevant, and comprehensive. Their feedback was instrumental in refining the questions to enhance their clarity and relevance to the study’s objectives.
All items were measured using a seven-point Likert scale, ranging from 1 (strongly disagree) to 7 (strongly agree) (Jangir et al., 2022; Sharma et al., 2024a). This scale allowed for a nuanced quantitative analysis of the responses. The questionnaire included nine constructs and 45 measures, each representing a different aspect of the study’s theoretical framework. A summary of the constructs and number of items is presented in Table 1, while the full list of measurement items, along with their references, is provided in Appendix A. Each statement in the questionnaire was accompanied by a scoring system, enabling detailed quantitative analysis. The data collection process was designed to be comprehensive and systematic, ensuring that all relevant variables were captured accurately.
To ensure the relevance of the sample, a pre-screening step was implemented to confirm that the respondents were suitable for the study. Potential participants were first asked the following qualifying question:
“Do you have experience in making investment decisions related to sustainable projects within the blue economy (e.g., marine resources, ocean energy, sustainable fisheries)?”.
Only those who answered affirmatively were permitted to proceed with the full survey.
As no centralized database or official estimate exists for professionals engaged in blue economy-related investment decisions in India, the total population size remains unknown. Consequently, the study used non-probability convenience sampling, which is suitable for exploratory research involving hard-to-reach or undefined populations (Holden et al., 2015). While this limits the formal generalizability, it ensures practical relevance and access to knowledgeable participants.
The survey was distributed via a Google Form across various online professional and social platforms. Specific outreach was made to relevant LinkedIn networks, WhatsApp groups, and professional forums, targeting active individuals in sustainable finance, fintech, maritime industries, and the blue economy. While the questionnaire was distributed nationwide, particular attention was given to coastal regions such as Maharashtra, Kerala, Tamil Nadu, Gujarat, and Andhra Pradesh, where blue economy activities and fintech adoption are most prominent. Responses were also received from national-level professionals based in financial and administrative centers like Delhi and Bengaluru. The investigation link was shared during the summer of 2024 to maximize participation from professional investors engaged in sustainable investment decisions within the blue economy.
To define the least sample size required for this study, G*Power software version 3.1.9.7 (Kang, 2021) from Heinrich Heine University in Düsseldorf, Germany, was used. The calculation measured a projected effect size of 0.3 (medium), an anticipated statistical power level of 0.8, nine latent variables, a probability level of 0.05, and the number of predictors (Hu et al., 2021). This approach determined that a minimum sample size of 67 respondents was necessary to detect meaningful effects and provide reliable results. The final sample of 224 valid responses substantially exceeds this threshold, ensuring adequate statistical power for hypothesis testing.
To confirm the reliability and validity of the questionnaire, a pilot study was conducted with 35 respondents. Julious (2005) suggests a sample size of 12 per group as a rule of thumb for pilot studies; we opted for a larger sample size to improve the robustness of our findings. In social science research, pilot studies often use sample sizes ranging from 10 to 40 participants per group, depending on the study’s complexity and objectives (Viechtbauer et al., 2015). Conducting the pilot study with 35 respondents allowed us to gather more comprehensive feedback and make more informed adjustments to the questionnaire, thereby improving its clarity and comprehensiveness. The pilot study yielded reasonable results, indicating that the questionnaire was both reliable and valid. Based on the feedback and results from the pilot study, minor adjustments were made to improve the clarity and comprehensiveness.
Following the pilot study, 400 questionnaires were distributed to managers and executives involved in sustainable investment decisions in the blue economy. Out of the 400 distributed questionnaires, we obtained the following results:
  • A total of 224 responses were accurately completed and considered valid for analysis;
  • A total of 124 responses were excluded due to incomplete or improperly completed questionnaires;
  • A total of 52 questionnaires did not receive any response and were consequently excluded from the examination.
This study employed PLS-SEM to examine the data. PLS-SEM was chosen for its strength in managing complex models and its ability to deliver reliable estimates even with smaller sample sizes (J. Hair et al., 2017). This method allowed for the examination of the associations among latent variables and the testing of the proposed hypotheses. The analysis included several key steps:
  • Factor analysis was conducted to validate the constructs and ensure that the items were loaded appropriately onto their respective factors. Factor analysis helped to confirm that the questionnaire items accurately represented the underlying theoretical constructs;
  • Reliability analysis was completed to assess the internal consistency of the constructs. This analysis ensured that the items within each construct reliably measured the same fundamental concept, typically evaluated using Cronbach’s alpha;
  • Regression analysis was used to test the associations between the latent variables and validate the hypothetical model. This step involved inspecting the direct and indirect effects of the constructs on each other, thereby providing insights into the merits and direction of these relationships.
The additional section of the questionnaire aimed to gather demographic data about the respondents. This section comprised queries about the respondent’s gender, age, income, organizational affiliation, and geographic region. Gathering demographic statistics was vital for understanding the background of the contributors.

4. Results

Authors should discuss the results and how they can be interpreted from the perspectives of previous studies and working hypotheses. The findings and their implications should be discussed in the broadest context possible. Future research directions may also be highlighted.

4.1. Sample Demographics

The demographic data collected in this study offers a comprehensive overview of the respondents’ characteristics, which is crucial for understanding the context of the subsequent analyses. The data includes information on gender, age, and annual income, as summarized in Table 2.
The majority of respondents are male, accounting for 84.82% (190 respondents). Female respondents make up 15.18% (34 respondents). The age group with the maximum representation is 35–39 years, comprising 31.70% (71 respondents). The next largest age groups are 30–34 years (28.57%, 64 respondents) and 25–29 years (11.16%, 25 respondents). Respondents above 40 years make up 19.64% (44 respondents). The smallest age group is 20–24 years, constituting 8.93% (20 respondents). A significant majority of respondents (84.37%, 189 respondents) have an annual income of more than INR five lakhs. The remaining 15.63% (35 respondents) have an annual income of less than INR five lakhs.
The organizational affiliation of respondents spans several sectors. While respondents were not limited to blue economy organizations, all had confirmed experience with investment decisions in the context of blue economy sectors, confirmed through a pre-screening question. The largest group (34.82%, 78 respondents) worked in fintech companies, followed by those in maritime or blue economy-related firms (27.23%, 61 respondents), investment funds or asset managers (19.20%, 43 respondents), government or regulatory bodies (10.71%, 24 respondents), and consulting, NGO, or advisory firms (8.04%, 18 respondents).
Geographically, the sample includes respondents from both coastal and inland regions of India. The West Coast (Maharashtra, Goa, Gujarat) is represented by 26.79% of respondents, the East Coast (Tamil Nadu, Andhra Pradesh, Odisha) by 22.32%, and North India (Delhi, Haryana, Punjab) by 17.86%. Respondents from South India (inland) make up 14.29%, East and Northeast India 9.82%, and Central India 8.93%. This regional spread reflects the diversity of the professional investors engaged with the blue economy across India.

4.2. Structural Model and Discriminant Validity

In this section, we present the results of the SEM analysis, which tests the proposed hypotheses and examines the relationships between the constructs. The analysis includes the evaluation of R-square (R2) and adjusted R-square values to determine the explanatory power of the model for each construct (see Table 3).
Table 4 shows the predictive power of four constructs—PEU, PU, IAFS, and SIBE—in sustainable investment decisions in the blue economy. The PEU construct has the highest R-square value (0.622), explaining 62.2% of its variance, indicating that it is a primary predictor in the model. IAFS follows, with an R-square of 0.559, showing a substantial impact, with 55.9% of its variance explained. PU has an R-square of 0.524, meaning 52.4% of its variance is accounted for, suggesting a significant influence. SIBE has the lowest R-square at 0.442, with 44.2% of its variance explained, indicating a moderate effect (Yuniarti, 2022).
Table 4 shows the construct reliability and validity of various factors that impact fintech adoption and sustainable investment decisions.
The Cronbach’s alpha values are all above 0.70, indicating solid internal consistency, with particularly high values for Trialability (0.931) and Observability (0.949). Composite reliability scores also exceed the 0.70 threshold (Pokhrel & K.C., 2024), demonstrating consistent measurement across items, with Trialability and Observability again showing high reliability (0.948 and 0.961, respectively). The Average Variance Extracted (AVE) values for all constructs surpass the 0.50 threshold, indicating good convergent validity, as seen with the high AVE scores for Observability (0.830), Trialability (0.785), and Sustainable Investment Decisions in the Blue Economy (0.699). These metrics collectively confirm that the constructs are reliable and valid for evaluating sustainable investment decisions in the blue economy (Baudry et al., 2024; Cheung et al., 2024).
Table 5 shows the discriminant validity using the HTMT ratio matrix and HTMT criterion; values below 0.85 indicate good discriminant validity, ensuring that each construct measures a unique impression (Henseler, 2017).
COM and COMP have a low correlation (HTMT = 0.473), while PU and RA show a moderate association (HTMT = 0.737), both within acceptable limits. TR and OBS demonstrate a low correlation (HTMT = 0.434), indicating clear differentiation. PEU exhibits moderate correlations with RA (HTMT = 0.808) and IAFS (HTMT = 0.711), both of which are within acceptable bounds. Additionally, SIBE has moderate HTMT values with OBS (HTMT = 0.802) and IAFS (HTMT = 0.766), confirming acceptable levels of construct distinction. Overall, these HTMT values affirm the constructs’ distinctiveness, supporting the model’s discriminant validity (Montiel et al., 2021).
Table 6 shows the Fornell–Larcker criterion values, confirming discriminant validity by comparing the square basis of the AVE for each construct (crosswise) with correlations between constructs (Putra et al., 2021).
For each construct, the square root of the AVE (on-diagonal values) is compared with inter-construct correlations (off-diagonal values). Discriminant validity is confirmed if a construct’s AVE square root is higher than its correlations with other constructs (Henseler et al., 2015). For instance, RA has a diagonal value of 0.765, which exceeds its correlations with COM at 0.410 and COMP at 0.565, indicating distinctiveness. Similarly, COM has a diagonal value of 0.794, which exceeds its correlations with COMP at 0.398 and TR at 0.313. Each construct’s AVE square root surpasses all inter-construct correlations, confirming strong discriminant validity across the model.
Given the use of self-reported structured questionnaires as the primary data collection method, there is an inherent risk of common method bias (CMB), which could threaten the validity of the results. To mitigate this risk and assess the potential impact of CMB, we employed the full collinearity assessment approach proposed by Kock (2015). This approach involves evaluating the variance inflation factor (VIF) values for all latent constructs in the model. According to this method, VIF values exceeding the threshold of 3.3 may indicate problematic collinearity and potential CMB. As shown in Table 7, all latent constructs in our study had VIF values well below this critical value, ranging from 2.18 to 2.94. These results suggest that common method bias is unlikely to compromise the validity of the findings in this study.
In addition to examining path significance and R2 values, we assessed effect sizes (f2) and predictive relevance (Q2), in accordance with J. F. Hair et al. (2019). The f2 statistic evaluates the contribution of each exogenous construct to the explained variance (R2) of its corresponding endogenous construct. As per Cohen (1988), f2 values of 0.02, 0.15, and 0.35 indicate small, medium, and large effects, respectively. Notably, relative advantage had a large effect on perceived usefulness, and perceived usefulness showed a strong effect on intention to adopt fintech services. Other constructs exhibited small-to-moderate effects, reinforcing their relevance in the model.
Predictive relevance was assessed using the Q2 value generated via the blindfolding procedure. Q2 values above zero indicate that the model has predictive capability. Following J. Hair and Alamer (2022), values of 0.02, 0.15, and 0.35 reflect weak, moderate, and strong predictive power. In our model, key endogenous constructs such as PU, PEU, and SIBE recorded Q2 values substantially above 0.35, demonstrating strong predictive relevance.

4.3. Hypothesis Testing Results

Table 8 shows the results of hypothesis testing, highlighting the relationships between variables affecting the IAFS and sustainable investment decisions in the blue economy. The study highlights significant and non-significant relationships based on path coefficients (β), p-values, and statistical significance.
The study presents findings in Table 8, indicating that the perceived relative advantage has a significant positive effect on perceived usefulness (H1: β = 0.283, p = 0.004 ***). This suggests that when users perceive significant advantages from fintech solutions, they are likely to find these tools useful for sustainable investments. Furthermore, the perceived relative advantage significantly influences perceived ease of use (H2: β = 0.557, p = 0.000 ***), indicating that if fintech tools provide clear advantages in terms of efficiency and effectiveness, users may find these solutions easier to use. Similarly, compatibility has a significant positive impact on perceived usefulness (H3: β = 0.334, p = 0.000 ***), implying that when fintech solutions align well with users’ existing values and practices, they are perceived as more useful. However, compatibility does not significantly influence perceived ease of use (H4: β = −0.041, p = 0.569), suggesting that even if fintech services align with users’ needs, they may still appear complex. Regarding complexity, hypothesis H5 indicates that it does not significantly affect perceived usefulness (H5: β = −0.010, p = 0.888), but that complexity does not significantly affect perceived ease of use either (H6: β = −0.086, p = 0.091). This suggests that complexity does not have a strong impact on how easy users find fintech solutions to use. Hypotheses H7 and H8 examine the role of trialability. H7 shows that trialability does not significantly affect perceived usefulness (H7: β = 0.044, p = 0.611), indicating that the ability to try fintech solutions does not necessarily enhance their perceived usefulness. However, H8 shows the significant positive effect of trialability on perceived ease of use (H8: β = 0.153, p = 0.023 **), suggesting that the ability to experiment with fintech solutions makes them easier to use. Although observability does not significantly impact perceived usefulness (H9: β = 0.003, p = 0.974), it has a significant positive effect on perceived ease of use (H10: β = 0.367, p = 0.000 ***). This suggests that when the benefits of fintech solutions are easily observable, they are perceived as easier to use.
Further analysis in H11 demonstrates that the perceived ease of use significantly influences perceived usefulness (H11: β = 0.225, p = 0.020 **).
Similarly, perceived usefulness has a significant effect on the intention to adopt fintech services (H12: β = 0.519, p = 0.000 ***), indicating that when users find fintech solutions useful, they are more likely to adopt them. The analysis of hypothesis H13 indicates that ease of use is an important factor influencing the adoption of fintech services. Specifically, H13 shows a beta coefficient of 0.310 and a p-value of 0.000 ***. Similarly, H14 also finds a significant relationship (H14: β = 0.665, p = 0.000 ***). This indicates that IAFS plays an important role in leading to sustainable investment decisions in the blue economy.
Figure 2 shows the structural model showcasing the relationships among various constructs influencing fintech adoption and sustainable investment decisions in the blue economy.

5. Discussion

This study provides important insights into the factors influencing fintech adoption for sustainable investment within India’s blue economy. By integrating constructs from the Diffusion of Innovations (DOI) theory and the Technology Acceptance Model (TAM), we analyze how specific characteristics shape user behavior in a context marked by resource constraints, limited digital literacy, and localized investment cultures.
Relative advantage significantly influences both perceived usefulness (PU) and perceived ease of use (PEU). The DOI theory posits that when users perceive a new technology as offering substantial benefits over the existing solutions, adoption becomes more likely. In our study, participants included coastal entrepreneurs, small-scale fishers, and sustainable investors—groups often underserved by traditional finance. For them, fintech platforms represent tangible improvements: easier access to credit, better data analytics for marine resource management, and streamlined payment systems. These direct, practical benefits not only reinforce fintech’s usefulness, but also make it appear more approachable. This supports prior work (e.g., M. Moore et al., 2016; Yeh & Teng, 2012) and aligns with Abdul-Rahim et al. (2022), who emphasize efficiency and accessibility as key adoption drivers. However, in our sample, the significant impact on the PEU may be uniquely strong due to low baseline digital expectations; even modestly intuitive platforms may be viewed as “easy to use” in contrast to previous informal or manual systems.
Compatibility significantly impacts PU, but not the PEU. The DOI theory suggests that innovations congruent with existing values and practices are perceived as more beneficial. Our participants often rely on traditional community-led financial systems and sustainability-oriented goals. Fintech solutions that support cooperative lending, integrate ESG metrics, or provide transparent reporting are seen as aligning well with their existing financial philosophies; hence, they are perceived as useful. Yet, compatibility does not significantly influence ease of use, contrasting with Bureshaid (2021). This discrepancy may stem from a contextual disconnect: while users appreciate the alignment with their values, many still face infrastructural or educational barriers that limit ease of use. This nuance underscores the importance of considering external variables in the TAM—even compatible tools may seem difficult without appropriate training or support structures.
Complexity does not significantly affect PU or the PEU. This diverges from studies such as Grover et al. (2019) and Liu et al. (2024), which argue that complexity hinders both perceptions. However, our sample reveals a different reality. For stakeholders in India’s blue economy, especially those managing environmental risks and financial exclusion, functionality outweighs interface simplicity. In line with task-technology fit theory, users may overlook technological difficulty if the system delivers critical outcomes—such as mobile loan access or traceable investment for sustainable aquaculture. Moreover, being mostly “late adopters” per the DOI categories, our participants may judge complexity not in absolute terms, but relative to traditional alternatives, which are often slower or more opaque.
Trialability significantly influences the PEU, but not PU. The opportunity to experiment with fintech solutions helps to reduce apprehension and improve user familiarity, echoing Yoon et al. (2020) and Park (2024). In many blue economy communities, early exposure happens through NGO-led workshops or informal peer demonstrations. However, trialability does not significantly increase PU, which contrasts with Abdul-Rahim et al. (2022). This may be because trial experiences often do not capture the full utility of fintech for long-term sustainable investment, or because users focus on interface rather than strategic impact during early trials.
Observability similarly affects the PEU, but not PU. As Valizadeh et al. (2020) suggest, seeing peers successfully use fintech improves one’s own confidence in their ability to use it. In our fieldwork, participants often relied on word-of-mouth endorsements or visible success stories from nearby communities. Yet, the visibility of benefits does not automatically translate into perceived usefulness. This may be due to the localized and socially embedded investment mindset in the blue economy: seeing results does not necessarily equate to perceived long-term value unless those results align with one’s own goals or environmental priorities.
The PEU significantly influences PU, reinforcing the TAM’s core assumption. Tools that are easier to navigate allow users to focus on goals—like sustainable marine investment—rather than system mechanics. This effect may be amplified in the blue economy context, where technical self-efficacy is often low, and users derive value from any reduction in friction.
Both PU and the PEU significantly influence the intention to adopt fintech services (IAFS), as predicted by the TAM. In this context, user-friendly, outcome-oriented platforms are more likely to be embraced by stakeholders who view fintech as a bridge to greater sustainability and inclusivity. Gupta et al. (2024) support this relationship. Notably, participants in our study often referenced environmental stewardship as a motivation for investing, highlighting a convergence between fintech functionality and sustainability goals.
Finally, IAFS significantly impacts sustainable investment behavior in the blue economy (SIBE). This confirms that fintech adoption intentions are a critical gateway to actual behavior change. Zhou et al. (2022) support this, noting that fintech tools empower users through data, access, and simplified processes. In the Indian context, government-backed programs like Sagarmala and PMMSY have increased awareness of blue economy opportunities, but adoption depends on ease of access—where fintech plays a pivotal role.
Some of our findings diverge from the existing literature, which may be explained by the distinctive characteristics of our sample and the Indian blue economy context—such as informal financial systems, collective decision-making processes, and varied levels of digital literacy. These contextual differences underscore the importance of applying the TAM and DOI not as static models, but as flexible frameworks responsive to local realities. Importantly, the study’s implications extend beyond academic theory and stakeholder strategy, directly aligning with several of the United Nations Sustainable Development Goals (SDGs)—notably SDG 14 (Life Below Water), SDG 9 (Industry, Innovation, and Infrastructure), and SDG 13 (Climate Action). By facilitating more transparent, accessible, and sustainability-oriented financial systems, fintech adoption in the blue economy can serve as a practical instrument in advancing global sustainability and inclusive development targets.

6. Conclusions

This study investigated the key factors influencing the adoption of fintech services for sustainable investment within the blue economy by integrating the Diffusion of Innovations (DOI) theory and the Technology Acceptance Model (TAM). The findings confirmed that the perceived usefulness and ease of use are central to driving adoption intentions, which in turn significantly impacts sustainable investment behavior. While relative advantage, compatibility, trialability, and observability showed varying effects on these perceptions, complexity did not emerge as a significant barrier. These insights provide a foundation for understanding how digital financial tools can be effectively leveraged to support sustainability goals in marine-based economic sectors.

6.1. Theoretical Implications

This study provides a comprehensive framework for understanding how fintech adoption influences sustainable investment decisions in the blue economy (SIBE). By integrating the DOI theory and the TAM, the research demonstrates the applicability of these models in a context that has received limited theoretical attention. Importantly, the findings also highlight how the influence of key constructs may vary when applied in settings such as the Indian blue economy, where informal financial systems, sustainability priorities, and digital access constraints shape user behavior.
Specifically, the study reveals that complexity does not significantly influence either perceived usefulness (PU) or the perceived ease of use (PEU), suggesting that users may overlook technological challenges if the tools contribute meaningfully to sustainability and efficiency. This underscores the need to interpret TAM constructs with sensitivity to context—where perceived value may outweigh technical barriers.
The significant effect of compatibility on PU—but not on the PEU—also supports the idea that alignment with users’ values and investment goals can drive adoption, even when ease of use is not guaranteed. This reinforces prior findings, but also suggests that in mission-driven domains such as sustainable marine investment, value congruence may matter more than interface simplicity.
The observed effects of trialability and observability on the PEU, but not on PU, further refine existing theory. While these factors reduce the perceived effort required to use fintech solutions, they may not fully convey long-term strategic benefits, especially in complex or high-stakes investment contexts. This highlights a potential gap in how short-term engagement translates into long-term adoption, and calls for future research on how fintech trials and demonstrations are designed and perceived.

6.2. Practical Implications

Fintech companies can draw on these findings to design solutions that clearly demonstrate operational advantages and align with existing investment behaviors. These developers should focus on compatibility with localized financial practices, especially in coastal and rural regions. Furthermore, offering trial opportunities and showcasing successful case studies can improve ease of use and encourage adoption. Interface simplicity and local language support could also mitigate perceived challenges in digital literacy.
Maritime and blue economy firms—such as those in fisheries, aquaculture, and ocean-based infrastructure—can leverage fintech tools to improve traceability, financial access, and operational efficiency. However, as the findings show, compatibility with existing workflows and systems is key to increasing perceived usefulness. Fintech solutions that support cooperative lending, marine asset tracking, or sustainability-linked finance may see higher adoption rates when they build on familiar community investment patterns.
The investment funds and asset managers involved in sustainable finance are encouraged by the strong relationship between PU, PEU, and intention to adopt. This reinforces the need for scalable, transparent, and ESG-aligned fintech platforms that can facilitate capital flows into blue economy ventures. As strategic enablers, these actors can promote the best practices in fintech adoption and direct attention toward impact-driven innovations.
Government and regulatory bodies can support adoption by creating enabling environments that improve accessibility while fostering innovation. Given that complexity was not a significant barrier in this study, regulators may focus less on simplification and more on making the benefits of fintech solutions more visible and trusted. This includes integrating fintech into development programs, establishing regulatory sandboxes, or incentivizing adoption in sustainability-critical sectors.
Consulting firms, NGOs, and advisory organizations working at the interface of technology and sustainability are well positioned to drive grassroots engagement. The importance of trialability and observability in shaping ease of use suggests that community demonstrations, capacity-building programs, and peer-led training can play a central role in fintech uptake, especially among informal or small-scale stakeholders.
Across the various geographic regions represented in the study—including India’s coastal states and inland economic centers—stakeholder needs and digital readiness levels vary. In high-activity coastal zones, fintech applications are likely to be directly embedded in fisheries, logistics, and marine investment. In northern, inland, and central regions, fintech may play a more supporting role in funding or data provision. This geographical diversity reinforces the importance of adaptable, context-sensitive fintech design and deployment strategies.

6.3. Study Limitations and Future Research

This study has several limitations that should be acknowledged. First, the research employed a cross-sectional design, capturing data at a single point in time. While this approach provides valuable insights, it does not account for changes in perceptions and behaviors over time. Longitudinal studies could offer a more comprehensive understanding of how fintech adoption and sustainable investment behaviors evolve within the blue economy. Second, the study relies on self-reported data, which may be subject to biases such as social desirability or recall bias. Participants might have provided responses they perceived as favorable rather than their true opinions. Future studies could incorporate objective measures or triangulate data sources to mitigate these biases. Third, the research primarily focused on constructs such as PU, PEU, IAFS, and SIBE. While these are critical factors, other relevant variables, such as cultural influences, regulatory environments, and technological infrastructure, were not explored in depth. Future research could expand the scope to include these additional factors.
Additionally, exploring the role of fintech in supporting the United Nations Sustainable Development Goals (SDGs) related to the blue economy could provide a deeper understanding of how fintech solutions can drive sustainable development. Research could focus on how fintech platforms facilitate environmentally friendly investments, improve resource management, and contribute to the conservation and sustainable use of ocean resources.

Author Contributions

Conceptualization, V.S. and R.R.-A.; methodology, V.S. and R.R.-A.; software, V.S.; validation, V.S., R.R.-A., T.S. and M.G.; formal analysis, V.S., R.R.-A., T.S. and M.G.; resources, V.S., R.R.-A., T.S. and M.G.; data curation, V.S., R.R.-A., T.S. and M.G.; writing—original draft preparation, V.S., R.R.-A., T.S. and M.G.; writing—review and editing, R.R.-A. All authors have read and agreed to the published version of the manuscript.

Funding

This research received no external funding.

Institutional Review Board Statement

Ethical review and approval were waived for this study as it did not involve identifiable human data or pose any risk to participants.

Informed Consent Statement

Informed consent was obtained from all participants involved in the survey. The survey was anonymous and did not collect any personally identifiable information.

Data Availability Statement

The data presented in this study are available on request from the corresponding author.

Conflicts of Interest

The authors declare no conflicts of interest.

Appendix A

Table A1. Measurement items.
ConstructsStatements
Relative Advantage
(Al-Rahmi et al., 2021; Sin et al., 2016; Yoon et al., 2020)
Fintech services offer significant advantages over traditional investment methods.
Using fintech platforms saves me time in managing my investments.
Fintech tools provide better insights into market trends than other methods.
Fintech services enhance the overall efficiency of my investment activities.
The benefits of fintech services outweigh those of traditional investment methods.
Compatibility
(Gomber et al., 2017; Thiele & Gerber, 2017)
Fintech services fit well with my existing investment strategies.
The fintech platforms I use are compatible with my financial goals.
Fintech services integrate seamlessly into my current investment processes.
Fintech services align with my investment preferences and habits.
The use of fintech services complements my overall financial planning.
Complexity
(Färe et al., 1994; Gai et al., 2017; Liu et al., 2024)
Fintech platforms seem too complex for my investment needs.
It is difficult to understand how to use fintech solutions effectively.
Fintech tools require significant effort to operate efficiently.
The complexity of fintech services hinders my ability to use them.
I find it challenging to navigate fintech platforms.
Trialability
(Park, 2024; Roh et al., 2024; Yoon et al., 2020)
I had the opportunity to try out fintech services before fully adopting them.
Fintech services allow me to experiment with different features before committing to them.
The ability to try fintech solutions before adoption increased my confidence in using them.
Trial periods for fintech services help me understand their benefits.
I value the option to test fintech services before making a full commitment.
Observability
(Park, 2024; Rashidi et al., 2015; Valizadeh et al., 2020; Yoon et al., 2020)
The benefits of using fintech services are clear and visible in my investment outcomes.
The success of fintech platforms is evident from their performance in sustainable investments.
Fintech services provide visible improvements to my investment strategies.
I can easily observe the positive impact of fintech services on my investments.
The results of using fintech services are apparent and measurable.
Perceived Ease of Use
(Hendrickson & Latta, 1996; Kumar et al., 2025; Madi et al., 2024)
I find the fintech solution easy to use for sustainable investment decisions.
My interaction with the fintech platform is strong and reasonable.
I believe I can quickly learn how to use fintech tools for investments.
The user interface of the fintech platform is intuitive.
Fintech services are user-friendly and straightforward.
Perceived Usefulness
(Dahleez et al., 2024; Kumar et al., 2025; Venkatesh & Davis, 2000)
Fintech tools improve my efficiency in making sustainable investment decisions.
Using fintech platforms enhances the quality of my investment analysis.
The fintech platform enables me to manage my investments more effectively.
Fintech services provide valuable insights that aid my investment decisions.
The usefulness of fintech tools positively impacts my investment performance.
Intention to Adopt Fintech Services
(Bajunaied et al., 2023; Senyo & Osabutey, 2020)
I plan to adopt fintech services for sustainable investments.
I intend to utilize fintech services for handling my financial transactions in the future.
I am considering using fintech services to improve my investment strategies.
I intend to integrate fintech services into my regular financial activities.
I am likely to recommend fintech services to others for investment purposes.
Sustainable Investment Decisions in the Blue economy
(Colgan & Scorse, 2020; Pace et al., 2023; Spalding, 2016; Thompson, 2022; Zhang, 2023)
I make investment decisions that consider the sustainability of the blue economy.
My investment choices are influenced by the potential environmental impact of my actions.
I prioritize investments that support the conservation and sustainable use of ocean resources.
I focus on sustainable financial decisions that contribute to the growth of the blue economy.
Fintech services help me make more informed sustainable investment decisions.

References

  1. Abdul-Rahim, R., Bohari, S. A., Aman, A., & Awang, Z. (2022). Benefit–risk perceptions of FinTech adoption for sustainability from bank consumers’ perspective: The moderating role of fear of COVID-19. Sustainability, 14(14), 8357. [Google Scholar] [CrossRef]
  2. Ahn, H., & Park, E. (2023). Motivations for user satisfaction of mobile fitness applications: An analysis of user experience based on online review comments. Humanities and Social Sciences Communications, 10(1), 3. [Google Scholar] [CrossRef]
  3. Alam, S., Omar, N. A., Ariffin, A. A., & Nik Hashim, N. M. H. (2018). Integrating TPB, TAM and DOI theories: An empirical evidence for the adoption of mobile banking among customers in Klang valley, Malaysia. International Journal of Business and Management Science, 8, 385–403. [Google Scholar]
  4. Alamsyah, D. P., Mazia, L., Hakim, L., Sukajie, B., Noor, C. M., & Solihat, A. (2021). Utilization of technology and perceived complexity. In 2nd south American international conference on industrial engineering and operations management (pp. 1004–1010). IEOM Society International. [Google Scholar] [CrossRef]
  5. Al-Rahmi, W. M., Yahaya, N., Alamri, M. M., Alyoussef, I. Y., Al-Rahmi, A. M., & Kamin, Y. B. (2021). Integrating innovation diffusion theory with technology acceptance model: Supporting students’ attitude towards using a massive open online courses (MOOCs) systems. Interactive Learning Environments, 29(8), 1380–1392. [Google Scholar] [CrossRef]
  6. Amnas, M. B., Selvam, M., Raja, M., Santhoshkumar, S., & Parayitam, S. (2023). Understanding the determinants of FinTech adoption: Integrating UTAUT2 with trust theoretic model. Journal of Risk and Financial Management, 16(12), 505. [Google Scholar] [CrossRef]
  7. Aysan, A. F., & Bergigui, F. (2021). Sustainability, trust, and blockchain applications in Islamic finance and circular economy: Best practices and fintech prospects. In S. N. Ali, & Z. H. Jumat (Eds.), Islamic finance and circular economy: Connecting impact and value creation (pp. 141–167). Springer. [Google Scholar] [CrossRef]
  8. Bajunaied, K., Hussin, N., & Kamarudin, S. (2023). Behavioral intention to adopt FinTech services: An extension of unified theory of acceptance and use of technology. Journal of Open Innovation: Technology, Market, and Complexity, 9(1), 100010. [Google Scholar] [CrossRef]
  9. Bakkabulindi, F. (2014). A call for return to Rogers’ innovation diffusion theory. Makerere Journal of Higher Education, 6(1), 55. [Google Scholar] [CrossRef]
  10. Baudry, M., Bukowski, S. I., & Lament, M. B. (Eds.). (2024). Financial stability, economic growth and sustainable development. Routledge. [Google Scholar] [CrossRef]
  11. Bergmann, H., Hundt, C., & Sternberg, R. (2016). What makes student entrepreneurs? On the relevance (and irrelevance) of the university and the regional context for student start-ups. Small Business Economics, 47(1), 53–76. [Google Scholar] [CrossRef]
  12. Bharadwaj, S. (2021). Behavioural intention towards investment in cryptocurrency: An integration of Rogers’ diffusion of innovation theory and the technology acceptance model. Forum Scientiae Oeconomia, 9, 137–159. [Google Scholar] [CrossRef]
  13. Bollaert, H., Lopez-de-Silanes, F., & Schwienbacher, A. (2021). Fintech and access to finance. Journal of Corporate Finance, 68, 101941. [Google Scholar] [CrossRef]
  14. Boot, A., Hoffmann, P., Laeven, L., & Ratnovski, L. (2021). Fintech: What’s old, what’s new? Journal of Financial Stability, 53, 100836. [Google Scholar] [CrossRef]
  15. Bose, D., & Srinivasan, K. S. (2024). Artificial intelligence-powered competency framework for Robo-advisory services in the era of digital economy. In AI-oriented competency framework for talent management in the digital economy. CRC Press. [Google Scholar]
  16. Bureshaid, N. K. (2021). An investigation into factors enabling the diffusion and adoption intention of fintech services for bank consumers [Ph.D. thesis, Brunel Business School]. Available online: https://bura.brunel.ac.uk/bitstream/2438/24183/1/FulltextThesis.pdf (accessed on 15 May 2025).
  17. Capital Market. (2025). News. Available online: https://www.capitalmarket.com/markets/news/economy-news/FM-says-India-has-87percent-Fintech-adoption-rate-compared-to-67percent-globally/1612672?utm_source=chatgpt.com (accessed on 9 March 2025).
  18. Cheung, K. K. C., Pun, J. K. H., & Li, W. (2024). Students’ holistic reading of socio-scientific texts on climate change in a ChatGPT scenario. Research in Science Education, 54(5), 957–976. [Google Scholar] [CrossRef]
  19. Cohen, J. (1988). Statistical power analysis for the behavioral sciences (2nd ed.). L. Erlbaum Associates. [Google Scholar]
  20. Colgan, C. S., & Scorse, J. (2020). Ocean climate policy. In The Palgrave handbook of climate resilient societies (pp. 1–22). Springer International Publishing. [Google Scholar] [CrossRef]
  21. Dadabada, P. K. (2025). Analyzing the impact of ESG integration and FinTech innovations on green finance: A comparative case studies approach. Journal of the Knowledge Economy, 16, 7959–7978. [Google Scholar] [CrossRef]
  22. Dahleez, K., Abdelfattah, F., Al Halbusi, H., Salah, M., & Madi, H. (2024). An investigation of government involvement and green information systems in driving management practices. In B. Alareeni, & A. Hamdan (Eds.), Navigating the technological tide: The evolution and challenges of business model innovation (pp. 327–335). Springer Nature. [Google Scholar] [CrossRef]
  23. Davis, F. D. (1989). Perceived usefulness, perceived ease of use, and user acceptance of information technology. MIS Quarterly, 13(3), 319. [Google Scholar] [CrossRef]
  24. Davis, F. D. (1993). User acceptance of information technology: System characteristics, user perceptions and behavioral impacts. International Journal of Man-Machine Studies, 38(3), 475–487. [Google Scholar] [CrossRef]
  25. Dorfleitner, G., Hornuf, L., Schmitt, M., & Weber, M. (2017). FinTech in Germany. Springer International Publishing. [Google Scholar] [CrossRef]
  26. Dwianto, A., Rahman, A. N., Ulynnuha, O. I., Anam, K., & Saif, G. M. S. (2024). The impact of technology readiness, usefulness, and ease of use on AI-based accounting software adoption. Advances in Accounting Innovation, 1(1), 10–11. [Google Scholar] [CrossRef]
  27. Färe, R., Grosskopf, S., Norris, M., & Zhang, Z. (1994). Productivity growth, technical progress, and efficiency change in industrialized countries. The American Economic Review, 84(1), 66–83. [Google Scholar]
  28. Fishbein, M., & Ajzen, I. (1975). Belief, attitude, intention and behavior: An introduction to theory and research. Addison-Wesley. [Google Scholar]
  29. Gai, K., Qiu, M., Sun, X., & Zhao, H. (2017). Security and privacy issues: A survey on FinTech. In M. Qiu (Ed.), Smart computing and communication (pp. 236–247). Springer International Publishing. [Google Scholar] [CrossRef]
  30. Ganjipour, H., & Edrisi, A. (2023a). Applying the integrated model to understanding online buyers’ intention to adopt delivery drones in Iran. Transportation Letters, 15(2), 98–110. [Google Scholar] [CrossRef]
  31. Ganjipour, H., & Edrisi, A. (2023b). Consumers’ intention to use delivery robots in Iran: An integration of NAM, DOI, and TAM. Case Studies on Transport Policy, 13, 101024. [Google Scholar] [CrossRef]
  32. Gomber, P., Koch, J.-A., & Siering, M. (2017). Digital finance and FinTech: Current research and future research directions. Journal of Business Economics, 87(5), 537–580. [Google Scholar] [CrossRef]
  33. Gosain, S. (2004). Enterprise information systems as objects and carriers of institutional forces: The new iron cage? Journal of the Association for Information Systems, 5, 151–182. [Google Scholar] [CrossRef]
  34. Gregor, S., & Benbasat, I. (1999). Explanations from intelligent systems: Theoretical foundations and implications for practice. MIS Quarterly, 23(4), 497–530. [Google Scholar] [CrossRef]
  35. Grover, P., Kar, A. K., Janssen, M., & Ilavarasan, P. V. (2019). Perceived usefulness, ease of use and user acceptance of blockchain technology for digital transactions—Insights from user-generated content on Twitter. Enterprise Information Systems, 13(6), 771–800. [Google Scholar] [CrossRef]
  36. Gupta, K., Wajid, A., & Gaur, D. (2024). Determinants of continuous intention to use FinTech services: The moderating role of COVID-19. Journal of Financial Services Marketing, 29(2), 536–552. [Google Scholar] [CrossRef]
  37. Ha, L. T. (2024). Gauging the dynamic interlinkage level between Fintech and the global blue economy performance. Journal of Economic Studies, 52, 55–71. [Google Scholar] [CrossRef]
  38. Hafner, S., Jones, A., Anger-Kraavi, A., & Pohl, J. (2020). Closing the green finance gap—A systems perspective. Environmental Innovation and Societal Transitions, 34, 26–60. [Google Scholar] [CrossRef]
  39. Hair, J., & Alamer, A. (2022). Partial Least Squares Structural Equation Modeling (PLS-SEM) in second language and education research: Guidelines using an applied example. Research Methods in Applied Linguistics, 1(3), 100027. [Google Scholar] [CrossRef]
  40. Hair, J., Hollingsworth, C. L., Randolph, A. B., & Chong, A. Y. L. (2017). An updated and expanded assessment of PLS-SEM in information systems research. Industrial Management & Data Systems, 117(3), 442–458. [Google Scholar] [CrossRef]
  41. Hair, J. F., Risher, J. J., Sarstedt, M., & Ringle, C. M. (2019). When to use and how to report the results of PLS-SEM. European Business Review, 31(1), 2–24. [Google Scholar] [CrossRef]
  42. Hendrickson, A. R., & Latta, P. D. (1996). An evaluation of the reliability and validity of Davis’ perceived usefulness and perceived ease of use instrument. Journal of Computer Information Systems, 36(3), 77–82. Available online: https://www.tandfonline.com/doi/abs/10.1080/08874417.1996.11647210 (accessed on 23 February 2025).
  43. Henseler, J. (2017). Bridging design and behavioral research with variance-based structural equation modeling. Journal of Advertising, 46(1), 178–192. [Google Scholar] [CrossRef]
  44. Henseler, J., Ringle, C. M., & Sarstedt, M. (2015). A new criterion for assessing discriminant validity in variance-based structural equation modeling. Journal of the Academy of Marketing Science, 43(1), 115–135. [Google Scholar] [CrossRef]
  45. Holden, R. J., McDougald Scott, A. M., Hoonakker, P. L. T., Hundt, A. S., & Carayon, P. (2015). Data collection challenges in community settings: Insights from two field studies of patients with chronic disease. Quality of Life Research: An International Journal of Quality of Life Aspects of Treatment, Care and Rehabilitation, 24(5), 1043–1055. [Google Scholar] [CrossRef] [PubMed]
  46. Hu, L., Joyce Lin, J.-Y., & Ji, J. (2021). Variable selection with missing data in both covariates and outcomes: Imputation and machine learning. Statistical Methods in Medical Research, 30(12), 2651–2671. [Google Scholar] [CrossRef]
  47. Jagtiani, J., & Lemieux, C. (2019). The roles of alternative data and machine learning in fintech lending: Evidence from the LendingClub consumer platform. Financial Management, 48(4), 1009–1029. [Google Scholar] [CrossRef]
  48. Jahangir, W., & Zia-ul-Haq. (2023). Integrating technology acceptance model, theory of diffusion of innovations and theory of planned behaviour to study the adoption of Facebook marketplace. NMIMS Management Review, 31(3), 214–222. [Google Scholar] [CrossRef]
  49. Jain, R., Kumar, S., Sood, K., Grima, S., & Rupeika-Apoga, R. (2023). A systematic literature review of the risk landscape in Fintech. Risks, 11(2), 36. [Google Scholar] [CrossRef]
  50. Jangir, K., Sharma, V., Taneja, S., & Rupeika-Apoga, R. (2022). The moderating effect of perceived risk on users’ continuance intention for FinTech services. Journal of Risk and Financial Management, 16(1), 21. [Google Scholar] [CrossRef]
  51. Jetzek, T. (2017). Innovation in the open data ecosystem: Exploring the role of real options thinking and multi-sided platforms for sustainable value generation through open data. In E. G. Carayannis, & S. Sindakis (Eds.), Analytics, innovation, and excellence-driven enterprise sustainability (pp. 137–168). Palgrave Macmillan. [Google Scholar] [CrossRef]
  52. Jha, S., & Dangwal, R. C. (2024). Fintech services and financial inclusion: A systematic literature review of developing nations. Journal of Science and Technology Policy Management. ahead-of-print. [Google Scholar] [CrossRef]
  53. Julious, S. A. (2005). Sample size of 12 per group rule of thumb for a pilot study. Pharmaceutical Statistics, 4(4), 287–291. [Google Scholar] [CrossRef]
  54. Kang, H. (2021). Sample size determination and power analysis using the G*Power software. Journal of Educational Evaluation for Health Professions, 18, 17. [Google Scholar] [CrossRef] [PubMed]
  55. Kock, N. (2015). Common method bias in PLS-SEM: A full collinearity assessment approach. International Journal of e-Collaboration, 11(4), 1–10. [Google Scholar] [CrossRef]
  56. KPMG. (2024). Unlocking India’s blue economy: A pathway to sustainable growth and prosperity. KPMG. Available online: https://kpmg.com/in/en/blogs/2024/10/unlocking-indias-blue-economy-a-pathway-to-sustainable-growth-and-prosperity.html (accessed on 23 February 2025).
  57. Kumar, A., Haldar, P., & Chaturvedi, S. (2025). Factors influencing intention to continue use of e-wallet: Mediating role of perceived usefulness. Vilakshan—XIMB Journal of Management, 22, 45–61. [Google Scholar] [CrossRef]
  58. Laidroo, L., Koroleva, E., Kliber, A., Rupeika-Apoga, R., & Grigaliuniene, Z. (2021). Business models of FinTechs—Difference in similarity? Electronic Commerce Research and Applications, 46, 101034. [Google Scholar] [CrossRef]
  59. Lee, I., & Shin, Y. J. (2018). Fintech: Ecosystem, business models, investment decisions, and challenges. Business Horizons, 61(1), 35–46. [Google Scholar] [CrossRef]
  60. Liu, Q., Chan, K.-C., & Chimhundu, R. (2024). Fintech research: Systematic mapping, classification, and future directions. Financial Innovation, 10(1), 24. [Google Scholar] [CrossRef]
  61. Lun, R., Liu, W., Li, G., & Luo, Q. (2024). Does digital agricultural technology extension service enhance sustainable food production? Evidence from maize farmers in China. Agriculture, 14(2), 292. [Google Scholar] [CrossRef]
  62. Madi, J., Khasawneh, M. A., & Dandis, A. O. (2024). Visiting and revisiting destinations: Impact of augmented reality, content quality, perceived ease of use, perceived value and usefulness on E-WOM. International Journal of Quality & Reliability Management, 41(6), 1550–1571. [Google Scholar] [CrossRef]
  63. Mahmud, K., Joarder, M. M. A., & Muheymin-Us-Sakib, K. (2022). Adoption factors of FinTech: Evidence from an emerging economy country-wide representative sample. International Journal of Financial Studies, 11(1), 9. [Google Scholar] [CrossRef]
  64. Ministry of Shipping, GOI, Government of India. (2025). SagarMala. Available online: https://sagarmala.gov.in/ (accessed on 13 May 2025).
  65. Montiel, I., Cuervo-Cazurra, A., Park, J., Antolín-López, R., & Husted, B. W. (2021). Implementing the United Nations’ sustainable development goals in international business. Journal of International Business Studies, 52(5), 999. [Google Scholar] [CrossRef]
  66. Moore, G. C., & Benbasat, I. (1991). Development of an instrument to measure the perceptions of adopting an information technology innovation. Information Systems Research, 2(3), 192–222. [Google Scholar] [CrossRef]
  67. Moore, M., Gelfeld, B., Okunogbe, A. T., & Paul, C. (2016). Identifying future disease hot spots: Infectious disease vulnerability index. RAND Corporation. Available online: https://www.rand.org/pubs/research_reports/RR1605.html (accessed on 8 June 2025).
  68. Narwal, S., Kaur, M., Yadav, D. S., & Bast, F. (2024). Sustainable blue economy: Opportunities and challenges. Journal of Biosciences, 49(1), 18. [Google Scholar] [CrossRef]
  69. Nizar, N. N. M., Zulnaidi, H., Basar, A., & Maaruf, S. Z. (2024). A structural model of pre-service teachers’ attitude, acceptance, and continuance intention towards mobile augmented reality. Contemporary Educational Technology, 16(4), ep531. [Google Scholar] [CrossRef] [PubMed]
  70. Novaglio, C., Bryndum-Buchholz, A., Tittensor, D. P., Eddy, T. D., Lotze, H. K., Harrison, C. S., Heneghan, R. F., Maury, O., Ortega-Cisneros, K., Petrik, C. M., Roberts, K. E., & Blanchard, J. L. (2024). The past and future of the fisheries and marine ecosystem model intercomparison project. Earth’s Future, 12(9), e2023EF004398. [Google Scholar] [CrossRef]
  71. Pace, L. A., Saritas, O., & Deidun, A. (2023). Exploring future research and innovation directions for a sustainable blue economy. Marine Policy, 148, 105433. [Google Scholar] [CrossRef]
  72. Park, E. (2024). Examining metaverse game platform adoption: Insights from innovation, behavior, and coolness. Technology in Society, 77, 102594. [Google Scholar] [CrossRef]
  73. Pokhrel, L., & K.C., A. (2024). Mobile banking service quality and continuance intention: Mediating role of satisfaction: A two-stage structural equation modeling-artificial neural network approach. International Journal of Bank Marketing, 42(3), 389–413. [Google Scholar] [CrossRef]
  74. Poorangi, M., Wong, E., Nikoonejad, S., & Kardevani, A. (2013). E-commerce adoption in Malaysian small and medium enterprises practitioner firms: A revisit on rogers’ model. Anais Da Academia Brasileira de Ciências, 185, 1593–1604. [Google Scholar] [CrossRef]
  75. Putra, T. R. I., Yunus, M., & Fakhreza, T. H. (2021). Total quality management in affecting company operational performance in convection Smes with organizational commitment as a mediator. Jurnal Aplikasi Manajemen, 19(3), 662–677. [Google Scholar] [CrossRef]
  76. Rahman, M., Ming, T. H., Baigh, T. A., & Sarker, M. (2023). Adoption of artificial intelligence in banking services: An empirical analysis. International Journal of Emerging Markets, 18(10), 4270–4300. [Google Scholar] [CrossRef]
  77. Rashidi, F., Abiri, E., Niknam, T., & Salehi, M. R. (2015). Optimal placement of PMUs with limited number of channels for complete topological observability of power systems under various contingencies. International Journal of Electrical Power & Energy Systems, 67, 125–137. [Google Scholar] [CrossRef]
  78. Remer, L. (2023). Sustainable investment. In S. O. Idowu, R. Schmidpeter, N. Capaldi, L. Zu, M. Del Baldo, & R. Abreu (Eds.), Encyclopedia of sustainable management (pp. 3550–3553). Springer International Publishing. [Google Scholar] [CrossRef]
  79. Rogers, E. M. (1962). Diffusion of innovations (Macmillan). Free P. of Glencoe. [Google Scholar]
  80. Rogers, E. M. (2003). Diffusion of innovations (5th ed.). Simon and Schuster. [Google Scholar]
  81. Roh, T., Yang, Y. S., Xiao, S., & Park, B. I. (2024). What makes consumers trust and adopt fintech? An empirical investigation in China. Electronic Commerce Research, 24(1), 3–35. [Google Scholar] [CrossRef]
  82. Rupeika-Apoga, R., & Wendt, S. (2022). FinTech development and regulatory scrutiny: A contradiction? The case of Latvia. Risks, 10(9), 167. [Google Scholar] [CrossRef]
  83. Sanchez, M., Exposito, E., & Aguilar, J. (2020). Industry 4.0: Survey from a system integration perspective. International Journal of Computer Integrated Manufacturing, 33(10–11), 1017–1041. [Google Scholar] [CrossRef]
  84. Selamoglu, M. (2021). Blue economy and blue ocean strategy. Journal of Ecology & Natural Resources, 5(4), 000263. [Google Scholar] [CrossRef]
  85. Senyo, P., & Osabutey, E. L. C. (2020). Unearthing antecedents to financial inclusion through FinTech innovations. Technovation, 98, 102155. [Google Scholar] [CrossRef]
  86. Shahzad, A., Zahrullail, N., Akbar, A., Mohelska, H., & Hussain, A. (2022). COVID-19’s impact on Fintech adoption: Behavioral intention to use the financial portal. Journal of Risk and Financial Management, 15(10), 428. [Google Scholar] [CrossRef]
  87. Sharma, V., Gupta, M., & Taneja, S. (2024a). Does FinTech adoption impact on sustainability of small businesses: Mediating role of financial well-being. Global Knowledge, Memory and Communication, ahead-of-print. [Google Scholar] [CrossRef]
  88. Sharma, V., Jangir, K., Gupta, M., & Rupeika-Apoga, R. (2024b). Does service quality matter in FinTech payment services? An integrated SERVQUAL and TAM approach. International Journal of Information Management Data Insights, 4(2), 100252. [Google Scholar] [CrossRef]
  89. Sin, K. Y., Osman, A., Salahuddin, S. N., Abdullah, S., Lim, Y. J., & Sim, C. L. (2016). Relative advantage and competitive pressure towards implementation of E-commerce: Overview of small and medium enterprises (SMEs). Procedia Economics and Finance, 35, 434–443. [Google Scholar] [CrossRef]
  90. Singh, S., Sahni, M. M., & Kovid, R. K. (2020). What drives FinTech adoption? A multi-method evaluation using an adapted technology acceptance model. Management Decision, 58(8), 1675–1697. [Google Scholar] [CrossRef]
  91. Spalding, M. (2016). The new blue economy: The future of sustainability. Journal of Ocean and Coastal Economics, 2(2), 8. [Google Scholar] [CrossRef]
  92. Taherdoost, H. (2018). A review of technology acceptance and adoption models and theories. Procedia Manufacturing, 22, 960–967. [Google Scholar] [CrossRef]
  93. Tamasiga, P., Onyeaka, H., & Ouassou, E. h. (2022). Unlocking the green economy in African countries: An integrated framework of FinTech as an enabler of the transition to sustainability. Energies, 15(22), 8658. [Google Scholar] [CrossRef]
  94. Thiele, T., & Gerber, L. R. (2017). Innovative financing for the High Seas. Aquatic Conservation: Marine and Freshwater Ecosystems, 27(S1), 89–99. [Google Scholar] [CrossRef]
  95. Thompson, B. S. (2022). Blue bonds for marine conservation and a sustainable ocean economy: Status, trends, and insights from green bonds. Marine Policy, 144, 105219. [Google Scholar] [CrossRef]
  96. Thottoli, M. M., Islam, M. A., Ahsan, A., Yusof, M. F., Hassan, M. S., & Chowdhury, R. S. (2024). Exploring mediating and moderating factors of FinTech adoption for innovations in SMEs. Cogent Economics & Finance, 12(1), 2387443. [Google Scholar] [CrossRef]
  97. Valizadeh, N., Rezaei-Moghaddam, K., & Hayati, D. (2020). Analyzing Iranian farmers’ behavioral intention towards acceptance of drip irrigation using extended technology acceptance model. Journal of Agricultural Science and Technology, 22(5), 1177–1190. [Google Scholar]
  98. Venkatesh, V., & Davis, F. D. (2000). A theoretical extension of the technology acceptance model: Four longitudinal field studies. Management Science, 46(2), 186–204. [Google Scholar] [CrossRef]
  99. Venkatesh, V., Speier, C., & Morris, M. G. (2002). User acceptance enablers in individual decision making about technology: Toward an integrated model. Decision Sciences, 33(2), 297–316. [Google Scholar] [CrossRef]
  100. Viechtbauer, W., Smits, L., Kotz, D., Budé, L., Spigt, M., Serroyen, J., & Crutzen, R. (2015). A simple formula for the calculation of sample size in pilot studies. Journal of Clinical Epidemiology, 68(11), 1375–1379. [Google Scholar] [CrossRef] [PubMed]
  101. Wejnert, B. (2002). Integrating models of diffusion of innovations: A conceptual framework. Annual Review of Sociology, 28, 297–326. [Google Scholar] [CrossRef]
  102. Wenhai, L., Cusack, C., Baker, M., Tao, W., Mingbao, C., Paige, K., Xiaofan, Z., Levin, L., Escobar, E., Amon, D., Yue, Y., Reitz, A., Neves, A. A. S., O’Rourke, E., Mannarini, G., Pearlman, J., Tinker, J., Horsburgh, K. J., Lehodey, P., … Yufeng, Y. (2019). Successful blue economy examples with an emphasis on international perspectives. Frontiers in Marine Science, 6, 261. [Google Scholar] [CrossRef]
  103. Wischnewski, C. (2020). The disruptive potential of FinTechs in the German consumer finance sector—A blue ocean scenario? arXiv, arXiv:2007.03603. [Google Scholar] [CrossRef]
  104. Yeh, R. K.-J., & Teng, J. T. C. (2012). Extended conceptualisation of perceived usefulness: Empirical test in the context of information system use continuance. Behaviour & Information Technology, 31(5), 525–540. [Google Scholar] [CrossRef]
  105. Yoon, C., Lim, D., & Park, C. (2020). Factors affecting adoption of smart farms: The case of Korea. Computers in Human Behavior, 108, 106309. [Google Scholar] [CrossRef]
  106. Yousef, M. (2024). Blue economy: A review of concepts, definitions, benefits, and risks. American Academic & Scholarly Research Journal, 16(4), 12. [Google Scholar]
  107. Yuniarti, Y. (2022). Influence interpersonal communication and leadership on work discipline and their impact on teacher performance of SMK Negeri 8 palembang. Nusantara Journal of Behavioral and Social Sciences, 1(4), 105–112. [Google Scholar] [CrossRef]
  108. Zhang, J. (2023). Role of green financial assets, financial technology and the green energy on the development of a green economy. Environmental Science and Pollution Research, 30(56), 118588–118600. [Google Scholar] [CrossRef]
  109. Zhou, G., Zhu, J., & Luo, S. (2022). The impact of fintech innovation on green growth in China: Mediating effect of green finance. Ecological Economics, 193, 107308. [Google Scholar] [CrossRef]
Figure 1. Conceptual model, where: RA: relative advantage, COM: compatibility, COMP: complexity, TR: trialability, OBS: observability; PEU: perceived ease of use; PU: perceived usefulness; IAFS: intention to adopt fintech services; SIBE: sustainable investment decisions in the blue economy. Source: authors’ work.
Jrfm 18 00368 g001
Figure 2. Structural model of fintech adoption and sustainable investment decisions in the blue economy, where: RA: relative advantage, COM: compatibility, COMP: complexity, TR: trialability, OBS: observability; PEU: perceived ease of use; PU: perceived usefulness; IAFS: intention to adopt fintech services; SIBE: sustainable investment decisions in the blue economy. Source: Created using Smart PLS-SEM.
Jrfm 18 00368 g002
Table 1. Summary of constructs and measurement items.
ConstructNo. of ItemsKey References
Relative Advantage5Al-Rahmi et al. (2021); Sin et al. (2016); Yoon et al. (2020)
Compatibility5Gomber et al. (2017); Thiele and Gerber (2017)
Complexity5Färe et al. (1994); Gai et al. (2017); Liu et al. (2024)
Trialability5Park (2024); Roh et al. (2024); Yoon et al. (2020)
Observability5Park (2024); Rashidi et al. (2015); Valizadeh et al. (2020)
Perceived Ease of Use5Hendrickson and Latta (1996); Kumar et al. (2025); Madi et al. (2024)
Perceived Usefulness5Dahleez et al. (2024); Kumar et al. (2025); Venkatesh and Davis (2000)
Intention to Adopt FinTech Services5Bajunaied et al. (2023); Senyo and Osabutey (2020)
Sustainable Investment Decisions in the Blue Economy5Colgan and Scorse (2020); Pace et al. (2023); Spalding (2016); Thompson (2022); Zhang (2023)
Note: The respondents were informed that the following questions were designed to understand their perspectives on fintech adoption for sustainable investments within the blue economy. They were asked to consider their experiences and intentions related to sustainable investments in marine resources, ocean energy, sustainable fisheries, and other blue economy sectors when responding to the questions.
Table 2. Demographic statistics.
DemographicsRespondents %
Gender
Male19084.82
Female3415.18
Age
20–24208.93
25–292511.16
30–346428.57
35–397131.70
Above 404419.64
Annual income (in INR)
Less than five lakhs3515.63
More than five lakhs18984.37
Organizational affiliation
Fintech companies7834.82
Maritime/Blue economy firms6127.23
Investment funds/Asset managers4319.20
Government/Regulatory bodies2410.71
Consulting/NGOs/Advisory firms188.04
Geographic Region (States Represented)
West Coast (Maharashtra, Goa, Gujarat)6026.79
East Coast (Tamil Nadu, Andhra Pradesh, Odisha)5022.32
South (Inland) (Karnataka, Telangana)3214.29
North (Delhi, Haryana, Punjab)4017.86
East and Northeast (West Bengal, Assam, Jharkhand)229.82
Central India (Madhya Pradesh, Chhattisgarh)208.93
Table 3. R-square values.
ConstructsR-SquareR-Square Adjusted
PEU0.6220.613
PU0.5240.511
IAFS0.5590.555
SIBE0.4420.439
Table 4. Construct reliability and validity.
ConstructsCodingFactor LoadingsCronbach’sAlpha rhoACompositeReliability AVE
Relative AdvantageRA0.3920.8120.8580.8780.608
0.893
0.924
0.899
0.654
CompatibilityCOM0.6450.8200.8270.8750.585
0.742
0.830
0.814
0.780
ComplexityCOMP0.7740.8540.8610.8950.630
0.766
0.804
0.839
0.784
TrialabilityTR0.8820.9310.9340.9480.785
0.878
0.880
0.890
0.899
ObservabilityOBS0.9040.9490.9490.9610.830
0.917
0.922
0.914
0.898
Perceived Ease of UsePEU0.7780.8590.8650.8970.635
0.804
0.795
0.813
0.793
Perceived UsefulnessPU0.8130.8670.8680.9030.650
0.830
0.848
0.774
0.762
Intention to Adopt FinTech ServicesIAFS0.7680.8270.8280.8780.590
0.806
0.782
0.762
0.721
Sustainable Investment Decisions in the Blue EconomySIBE0.8750.8770.8850.9180.699
0.915
0.900
0.925
Source: Created using PLS-SEM.
Table 5. Discriminant validity.
Heterotrait–Monotrait Ratio Matrix RACOMCOMPTROBSPEUPUIAFS
COM0.625
COMP0.5140.473
TR0.4160.6270.345
OBS0.4420.6770.4280.434
PEU0.8080.5700.3580.5000.640
PU0.7370.7180.3720.4680.5030.660
IAFS0.5610.6660.4610.5390.7470.7110.815
SIBE0.4260.6580.3080.4300.8020.6350.5840.766
Source: Created using PLS-SEM.
Table 6. Fornell–Larcker criterion.
Constructs RACOMCOMPTROBSPEUPUIAFSSIBE
RA0.765
COM0.4100.794
COMP0.5650.3980.768
TR0.5500.3130.4860.886
OBS0.6000.3950.6830.4100.911
PEU0.4890.3220.6230.4460.5840.797
PU0.5980.3310.7060.4240.4570.6030.806
IAFS0.4690.4160.4500.3460.3840.6950.6080.780
SIBE0.5600.2740.6650.3870.7310.5490.5140.3410.836
Source: Created using PLS-SEM.
Table 7. Full collinearity VIFs for latent constructs.
Latent ConstructVIF
Relative Advantage (RA)2.45
Compatibility (COM)2.31
Complexity (COMP)2.67
Trialability (TR)2.18
Observability (OB)2.49
Perceived Ease of Use (PEU)2.83
Perceived Usefulness (PU)2.71
Intention to Adopt Fintech Services (IAFS)2.94
Sustainable Investment Decisions in the Blue Economy (SIBE)2.56
Table 8. Summary of hypothesis testing results.
HypothesisPath Coefficient (β)Sample Mean (M)Standard Deviation (STDEV)T Statisticp-ValueSignificance
H1: RA -> PU0.2830.2840.0972.9130.004 ***Yes
H2: RA -> PEU0.5570.5590.0648.7150.000 ***Yes
H3: COM -> PU0.3340.3400.0893.7720.000 ***Yes
H4: COM -> PEU−0.041−0.0350.0730.5690.569No
H5: COMP -> PU−0.010−0.0030.0740.1410.888No
H6: COMP -> PEU−0.086−0.0830.0511.6890.091No
H7: TR -> PU0.0440.0400.0870.5080.611No
H8: TR -> PEU0.1530.1500.0672.2800.023 **Yes
H9: OBS -> PU0.0030.0000.0940.0320.974No
H10: OBS -> PEU0.3670.3610.0645.7590.000 ***Yes
H11: PEU -> PU0.2250.2220.0972.3240.020 **Yes
H12: PU -> IAFS0.5190.5190.0608.5820.000 ***Yes
H13: PEU -> IAFS0.3100.3110.0684.5530.000 ***Yes
H14: IAFS -> SIBE0.6650.6670.04215.6930.000 ***Yes
Source: Authors’ calculation. Note(s): Path Coefficient (significance levels: p < 0.01 is denoted by **; p < 0.001 is denoted by ***.); β—Path Coefficient; STDEV—Standard Deviation; and M—Sample Mean.
Disclaimer/Publisher’s Note: The statements, opinions and data contained in all publications are solely those of the individual author(s) and contributor(s) and not of MDPI and/or the editor(s). MDPI and/or the editor(s) disclaim responsibility for any injury to people or property resulting from any ideas, methods, instructions or products referred to in the content.

