1. Introduction
Mobile payment (MP) is a means of payment that utilizes information technology that is currently popular (
R. Liu et al., 2021;
The global payments report, 2021). An MP has different characteristics from manual payments. MP involves integration with banks and other digital wallets (
Lou et al., 2017). Mobile payment (MP) involves at least four stakeholders: technology providers, end-users, governments, and merchants (
Lou et al., 2017). Each party has a role, including technology providers providing application services that allow users to conduct transactions with their mobile devices. End-users are users who use mobile payments (MPs) as a means of payment. The government acts as a regulator that oversees and ensures no legal violations in the transaction process.
In comparison, merchants are partners of technology providers in receiving transactions. The main reason users choose to use mobile payment (MP) is that it is faster and more practical because there is no need to go to a bank or an ATM to obtain cash (
Au & Kauffman, 2008;
Cheng et al., 2021;
Dahlberg et al., 2015). Even the largest accounting institution in the world, based in the Netherlands, KPMG, predicts that mobile payment (MP) will change world civilization (
Hallsworth et al., 2019). The COVID-19 pandemic has also significantly increased the use of mobile payment (MP).
According to scholars, mobile payment (MP) can increase the efficiency and effectiveness of transactions, the use of mobile payments (MPs) can also increase consumer reach, so it is hoped that it will encourage the development of MSMEs. The studies conducted by Mahakittikun, Lu, and Eiriz (
Eiriz et al., 2019;
Lu, 2019;
Mahakittikun et al., 2020) confirm that the use of technology allows small companies to access the market and has the possibility to increase transaction growth. Therefore, governments in many countries are pushing to create integrated payment systems, including Indonesia. In Indonesia itself, many studies related to mobile payment (MP) have been carried out but are limited to end-users as objects.
Recent studies highlight the increasing role of digital payment adoption in emerging markets and its impact on MSME digital transformation. Research by the
Cambridge Centre for Alternative Finance [CCAF] (2025) and ADBI underscores how digital finance providers enhance MSME access to credit, improving business performance in emerging economies (
Cambridge Centre for Alternative Finance [CCAF], 2025). Furthermore, ODI Global Advisory, in their report, underlines how digital payments contribute to micro and small enterprises’ economic empowerment and competitiveness (
ODI Global Advisory, 2024). Moreover, digital orientation and innovation significantly drive MSME growth, with studies confirming that a strong digital strategy improves firm performance in emerging markets (
Egala et al., 2024). However, digital transformation remains gradual and unequal as firms encounter barriers such as infrastructure limitations and digital literacy gaps (
Marolt et al., 2025). These insights emphasize the need for policy interventions and fintech innovations to bridge the digital divide and accelerate MSMEs’ adoption of digital payments.
Furthermore, MSMEs play a significant role in most economies, especially in developing countries (
Kumar et al., 2019). More than 90% of businesses and 50% of workforces come from MSMEs. These data illustrate how massive the MSME economy is. MSMEs are one part of intermediary businesses, which provide digital payment services (
Musyaffi et al., 2021). On the other hand, China, India, and Indonesia occupy the top-ranking positions regarding the number of unbanked populations, and the majority are in rural areas (
Wang et al., 2021). This phenomenon opens considerable opportunities for MP stakeholders to increase profits. In Indonesia, MSMEs are predicted to employ 97% of the workforce, contributing 60.3% of the country’s GDP, and makeup 14.4% of its exports in 2021 (
ASEAN Investment Report, 2022).
Almost every country has a QR MP payment channel. For example, the Thai QR is used in Thailand as a means of payment directly connected to a bank account. The Quick Response Indonesian Standard (QRIS) is used in Indonesia. The QRIS is a QR code developed by the joint regulator of the Indonesian Payment Systems Association (ASPI), which aims to streamline digital payment systems securely, encourage government efficiency, and accelerate digital financial inclusion (
Dahlberg et al., 2015). Meanwhile, DuitNow is a payment channel issued by the Malaysian government. Singapore introduced SQQR in 2018 to combine multiple payment QR codes into a single label and aims to simplify QR code-based mobile payment (MP) for consumers and merchants. In India, the QR Payment channel is called Bharat QR.
More than 96% of the industries in Indonesia are MSMEs, and from that, only less than 20% are already using information technology or digitizing. Meanwhile, 51% of the MSMEs in Singapore have enacted a digital transformation (
Rouillard, 2008). Thailand is an ASEAN country with the highest level of digitization of MSMEs, around 71% (
Bezhovski, 2016), while in Vietnam, 43% of MSMEs have utilized information technology to support their business, including mobile payment (MP) (
Yakean, 2020). In Indonesia, the use of QRIS is very low compared to debit card use in transactions.
This fact is a challenge for MSMEs in developing countries, especially in Indonesia, because compared to other countries in the ASEAN Region, the level of digitization of the MSMEs in Indonesia is still very low. It is necessary to conduct research related to the factors that influence the use of MP QR by merchants, especially the MSMEs in developing countries, to increase the penetration of the use of MP QR.
Mobile payment (MP) research has been widely carried out and developed in both developed and developing countries. However, more research has been conducted to determine factors related to end-users, such as intention to use (
World Bank, n.d.;
World Bank Group Support for Small and Medium Enterprises A Synthesis of Evaluative Findings, 2019), the influence of gender (
Mishra et al., 2022), age (
Lee et al., 2019), experience with MP (
World Bank Group Support for Small and Medium Enterprises A Synthesis of Evaluative Findings, 2019), and trust (
Lee et al., 2019;
Liébana-Cabanillas & Lara-Rubio, 2017;
Mishra et al., 2022). Although the implementation of MP QR continues to grow and it is known that the effect of implementing it significantly helps increase value for merchants, especially MSMEs, research on MP QR in MSMEs is still rarely carried out; researchers focus on acceptance factors from end-users.
This study proposes factors and confirms the new models that can measure acceptance technologies of MP QR for merchants. The proposed factors in this study will refer to the frameworks and models that have been previously confirmed, such as Technology Acceptance models (TAM) (
Davis, 1986;
Mallat & Tuunainen, 2008), the Extended TAM (
Pal et al., 2019), the Unified Theory of Acceptance and Use of Technology (UTAUT) (
Ponte & Bonazzi, 2021), Theory Reason Action (TRA) (
Venkatesh & Bala, 2008), the Theory of Planned Behaviors (TPB) (
Pal et al., 2019), and a qualitative study from
Mallat (
2007), which will be adapted and developed with the conditions of MSMEs.
3. The Hypothesis
Both drivers and barriers influence mobile payment adoption among MSMEs. Drivers include perceived usefulness and ease of use, as mobile payments offer speed and efficiency (
Davis, 1989;
Venkatesh et al., 2003). Word-of-mouth learning encourages adoption, as MSMEs rely on peer recommendations (
Banerjee & Fudenberg, 2004). Additionally, customer engagement and perceived convenience motivate businesses to adopt mobile payments to enhance customer experience (
Mallat & Tuunainen, 2008). Moreover, barriers include perceived cost, as transaction fees may burden small businesses (
Y. Liu et al., 2019). Trust and security concerns also hinder adoption due to fears of fraud and data breaches (
Farivar et al., 2017;
Gefen, 2000). Lastly, complexity and a lack of digital literacy make it harder for some MSMEs to adopt mobile payments (
Anatan, 2023). Identifying these factors helps in designing better strategies to increase adoption. Based on this, we can see that groups became drivers and barriers. The drivers in this research are perceived ease of use, perceived usefulness, word-of-mouth learning, customer engagement, perceived convenience, and perceived experience. Furthermore, the barriers are perceived cost, trust and security, risk, and complexity.
3.1. Perceived Ease of Use
Davis (
1986) proposed the Theory Acceptance Model (TAM) which became the theoretical basis of this research. The TAM states that perceived ease of use and usefulness are independent factors determining attitudes towards using a technology (
Davis, 1986). Consistent with
Venkatesh and Davis (
2000), it contends that attitudes on the use of information technology can be influenced by perceived ease of use, which is a significant issue (
Venkatesh & Davis, 2000). Thus, Venkatesh assumes someone will use an application if the application is easy to use and learn. According to
Sinha and Singh (
2022), ease of use refers to how simple it is to utilize a technology (
Sinha & Singh, 2022). Additionally, the measurement of a technology’s usability depends on user expectations regarding the efficiency and utility of specific tasks when utilizing a technology (
Sinha & Singh, 2022). The technology under consideration may include mobile payment, mobile commerce, and related technologies. According to
Lisana (
2021), one of the elements determining the success of implementing mobile payments in Indonesia will be if the form of mobile payment is intended to be easy to use and follows standard regulations. In Indonesia, the simplicity of use for a new technology is a significant feature (
Lisana, 2021). Moreover,
Liébana-Cabanillas et al. (
2021), and
Puriwat and Tripopsakul (
2021) stated that when technology is simple to use and effortless, customers have a positive experience (
Liébana-Cabanillas et al., 2021;
Puriwat & Tripopsakul, 2021). Based on the opinions and findings of several researchers above, this encourages the formulation of the following hypothesis:
Hypothesis 1. Perceived ease of use has a significant, positive, direct effect on perceived experience in MP usage.
3.2. Perceived Usefulness
Davis (
1989) has defined perceived ease of use as the extent to which a person believes that using the system will support and improve their work performance (
Davis, 1989). Davis assumes that a person will use an application if the application helps him to complete the job better. Furthermore, Venkatesh analyzed usage predictions based on a comparison model including moderators in his study toward a unified view. Based on this study, perceived usefulness has a direct effect on interest in use (
Venkatesh et al., 2003). Still, based on
Venkatesh et al. (
2003), perceived usefulness is the degree to which someone believes that using technology can improve and help their work. The more people believe that using technology will make their work easier, the greater the increase in the number of people using technology.
Sinha and Singh (
2022) confirmed that usefulness has a significant direct impact on perceived experience. Research involving technology acceptance analyses, which included usefulness as one of the variables, has been widely carried out in Indonesia. For example, the research conducted by
Limantara et al. (
2021),
Lisana (
2021), involves usefulness as one of the factors that influence the use of technology (
Limantara et al., 2021;
Lisana, 2021;
Rahardja et al., 2020). Therefore, according to
Qalati et al. (
2021), in the merchant context, the usefulness of a service may be considered important if it increases value and provides the best experience for the retailer (
Qalati et al., 2021). In the MP studies conducted by
Khan et al. (
2021),
Talwar et al. (
2021), and
Mishra et al. (
2022), factors such as usefulness and convenience were found to be relevant to improving merchant experience and behavioral intentions (
Khan et al., 2021;
Mishra et al., 2022;
Talwar et al., 2021). Therefore, we propose the following:
Hypothesis 2. Perceived usefulness has a significant, positive, direct effect on perceived experience in MP usage.
3.3. Perceived Experience
Merchants have increasingly embraced digital payment services, prioritized high-quality products, and focused on perceived experience. Perceived experience encompasses the benefits and overall satisfaction derived from the features and effectiveness of a product or service (
Jiang & Stylos, 2021). It plays a crucial role in evaluating technology performance and popularity, influencing merchants’ intentions and decisions to adopt payment technologies (
Talwar et al., 2021). During the COVID-19 pandemic, mobile payment systems (MPSs) helped merchants address challenges in supplier payments, credit facilities, and physical transactions, enhancing their perceived experience. Research shows that perceived experience directly impacts merchants’ behavioral intentions and the adoption of technology, aligning with their business goals and improving efficiency (
Chowdhury & Sarkar, 2003;
Jiang & Stylos, 2021). To support adoption, payment companies must address merchants’ desires and challenges, recognizing the critical role of perceived experience in shaping behavioral intentions.
Hypothesis 3. Perceived experience has a significant, positive, direct effect on a merchant’s intention to use.
3.4. Word of Mouth Learning
A merchant’s decision-making process is influenced by word-of-mouth communication, which is an informal statement about a product’s features and benefits. An existing user may communicate this way to a new user, sharing his or her experience with the service. According to recent research, customers’ recommendations for goods and services are influenced by their perceptions of the quality of those goods and services, which in turn affects their intentions to utilize them. Despite the proliferation of commercial communication channels, word-of-mouth recommendations remain one of the most trustworthy methods to choose products or services (83% of us say we trust recommendations from people we know).
Hypothesis 4. Word-of-mouth learning has a significant, positive, direct effect on a merchant’s intention to use.
Hypothesis 5. Perceived experience mediates the relation between word-of-mouth learning and a merchant’s intention to use.
Hypothesis 6. Perceived experience moderates the relationship between word-of-mouth learning and a merchant’s intention to use.
In Hypothesis 5, perceived experience acts as a mediator, meaning it helps to explain how or why word-of-mouth learning influences merchants’ intention to use mobile payments. In this case, word-of-mouth learning affects a merchant’s perception of the experience, influencing their intention to adopt the technology. The effect of word-of-mouth learning on intention occurs indirectly through perceived experience. Meanwhile, in Hypothesis 6, perceived experience is proposed as a moderator, which affects the strength or direction of the relationship between word-of-mouth learning and intention to use. That is, the influence of word-of-mouth learning on intention may be stronger or weaker depending on the perceived experience level.
According to prior research, it is indicated that perceived experience serves a crucial role in both mediating and moderating the relationship between word-of-mouth learning and its outcomes. This suggests that an individual’s prior experiences can significantly influence how they interpret and react to information shared through word-of-mouth interactions (
Sinha & Singh, 2022). So, in this study, we want to know the relationship between them from the perspective of Indonesian merchants.
3.5. Perceived Cost
Cost refers to the monetary implications that arise when users use mobile payment applications. The cost structure of the technology has a substantial impact on users (
Venkatesh et al., 2003). The banking system in Indonesia still charges transaction fees for every inter-bank transaction and top ups on digital wallets. This is predicted to influence the interest of MSMEs and the public in using mobile payments as the main means of payment. Perceived cost is one of the many factors that affect Micro, Small, and Medium-Sized Enterprise (MSME)s’ adoption of mobile payment systems. The perceived cost negatively affects the intention to use mobile payment systems. High perceived costs can deter users from adopting mobile payment solutions, as they may view these costs as a barrier to entry or continued use (
Al-Saedi et al., 2020;
Y. Liu et al., 2019;
Schmidthuber et al., 2020).
Costs that arise can be in the form of investment fees, subscriptions, balance top-ups, transfers, internet, etc. Costs incurred can be borne by consumers as end users or merchants. Investment costs are costs that may arise when a merchant intends to provide mobile payment services as a payment medium. In Indonesia, several mobile payment financial service providers charge fees to top-up balances, and inter-bank transfers are also subject to quite high rates for each transaction.
Hypothesis 7. Perceived cost has a significant, positive, direct effect on a merchant’s intention to use.
3.6. Perceived Trust
The degree of trust is impacted by the danger and inadequate security of information systems. Trust refers to an individual’s psychological state based on positive expectancy toward others’ behaviors or intentions. Trust has been studied as an important predictor of a user’s behaviors in social commerce (
Farivar et al., 2017). Trust has been extensively studied in the information system literature, and it is considered an essential element in purchasing transactions, especially in the environments in which risk elements exist. Therefore, we consider trust as the driver of social commerce use which can motivate users to purchase from a social commerce website (
Farivar et al., 2017).
In line with Handarkho’s, Shi’s, and Farivar’s research, this study places trust as a factor influencing intention to use. In the use of technology, trust is an important factor that must be held by users (
Farivar et al., 2017;
Handarkho, 2021;
Shi & Chow, 2015). If a user has trust, they will use it safely and comfortably, so that the intention to use it also increases. By having trust for social commerce websites and the other users on them, a customer will accept the credibility of the information provided by the company who owns that site and the other users that engage in it (
Shi & Chow, 2015). The combination of trusts established by the two sources above will develop a customer’s positive perception, which will influence their intention to engage with and use social commerce sites (
Handarkho, 2021). Based on that study, we propose the following:
Hypothesis 8. Perceived trust has a significant, positive, direct effect on a merchant’s intention to use.
3.7. Perceived Convenience
According to previous research, convenience is a major aspect. Consumers prefer to utilize mobile payment to save time and effort when making purchases (
Boden et al., 2020;
Pal et al., 2021;
Shankar & Behl, 2021). Convenience refers to the degree of usefulness a technology offers. Convenience consists of various dimensions of benefits that can be felt by users, such as faster transactions and simpler payments, to support practicality (
Pal et al., 2021). Offline transactions require consumers to spend time, effort, and money, whereas mobile payment allows users to execute transactions at any time and from any location. As a result, transactional convenience, attentiveness, customer service, and transactions all have a big impact on the consumer’s mobile payment experience (
Shankar & Behl, 2021).
In Indonesia, convenience is something that is desired: to achieve a certain level of comfort, people are willing to pay more. The research of
Hadiyan et al. (
2021) revealed that when users feel comfortable using a technology, they will use and recommend it more often (
Hadiyan et al., 2021).
Mobile payments offer convenience by eliminating the need to carry cash and coins or provide exact change for purchases (
Mallat & Tuunainen, 2008). Furthermore, convenience in general can increase the willingness of customers to pay. So, the more comfortable it is to use mobile payments, the more willing a customer will be to pay, thus the merchant has the opportunity to increase revenue. Adoption of technology implies an acceptance of and familiarity with it, which raises the feeling of convenience (
Boden et al., 2020).
Hypothesis 9. Perceived convenience has a significant, positive, direct effect on a merchant’s intention to use.
3.8. Customer Engagement
Customer engagement is an interaction or communication relationship carried out by a company or producer with customers. Customer engagement can be seen as a multi-dimensional concept consisting of emotional, cognitive, and behavioral aspects (
Rather & Hollebeek, 2021). In the context of merchants, customer engagement is important because good relationships and the best service to customers will drive customers to continue shopping and if merchants have strong engagement with customers, they will be satisfied with the services provided and will increase loyalty.
Kumar and Pansari (
2016) define customer engagement as a mechanism for adding customer value to merchants, either directly or indirectly (
Kumar & Pansari, 2016). Meanwhile,
Hepola et al. (
2020) discovered that customer interaction had a considerable beneficial effect on intention to use (
Hepola et al., 2020). In this study, customer engagement is seen from the point of view of the business owner of an MSME.
Hypothesis 10. Customer engagement has a significant, positive, direct effect on a merchant’s intention to use.
3.9. Complexity
Complexity is one of the significant inhibiting factors in the use of mobile payments (
Mallat & Tuunainen, 2008). Seventy percent of the MSME players in Indonesia have completed at least high school, while the country’s MSME actors still have comparatively low levels of education. This has an impact on MSME participants’ ability to solve problems, and complexity will make it challenging for MSMEs to accept mobile payment applications.
Mobile applications are more widely used by educated people, the younger generations, who are accustomed to using other information technologies, and people who find it easy to learn new things. Complexity becomes an obstacle because economic transactions can be carried out by all groups, whether they are using technology or not. New users are concerned about the usability of mobile payment applications and view usability as an important factor influencing user adoption. As a modern payment technology, mobile payment should be easy to use and simple (
Mallat & Tuunainen, 2008). Furthermore, the MSME actors in Indonesia are predominantly parents and those with a low education. Based on a survey by the Faculty of Economics and Business, at the University of Indonesia, as many as 61% of MSME managers are over 40 years old and as many as 83% have high school as their highest education level. In recent research, complexity is also considered a predictor of intention to use mobile payments.
Hypothesis 11. Complexity has a significant, positive, direct effect on merchants’ intention to use.
3.10. Perceived Risk
In comparison to developed nations, Indonesia still maintains relatively low security standards. Numerous instances of unsuccessful transactions, data theft, and even money theft from consumer accounts have occurred.
As cybercrimes are on the rise, mobile payment transactions pose a risk to your finances and data (
Pal et al., 2021). Risk is a component that many researchers include and address in their research, as opposed to convenience. They use the UTAUT theory as a foundational theory, similar to Ponte and Bonazi’s investigation. Numerous changes were made, such as excluding social influence because it was shown to be insufficiently influential and adding the perceived risk variable to understand how much influence these risk factors have on the intention to use and find out whether the use of technology is safer (
Ponte & Bonazzi, 2021). The risks can be differentiated based on the losses that may be experienced, such as financial, privacy, security, and performance risks (
Pal et al., 2021). Financial risks can occur, such as failed transfers, wrong transfers, and theft. Some cases that often occur are crimes involving changing the payment barcode code, so that the user is not aware that he has transferred money to the wrong account. By linking mobile payments with a bank account, the possible losses will be greater when compared to cash transactions (
Zhou, 2015).
Hypothesis 12. Perceived risk has a significant, positive, direct effect on a merchant’s intention to use.
3.11. Merchant Intention to Use
Intention to use is the extent to which consumers are likely to use and engage in social commerce. Intention to use and usage behavior in the TAM are factors that refer to a user’s habitual interest in using information technology; meanwhile, intention to use can affect usage behavior (
Venkatesh & Davis, 2000). Intention to use in the context of technology describes a user’s interest in starting to use it and their desire to use it again. In this study, merchant intention to use is a mediating factor, because it links other factors rather than modifying their effect on actual use.
Hypothesis 13. Merchant’s intention to use has a significant, positive, direct effect on actual use.
3.12. Actual Use
Actual use was proposed by Davis in the Technology Acceptance Model. Davis distinguishes between desire to use and actual use. Meanwhile, Venkatesh with his UTAUT tries to confirm the factors that influence intention to use and then, influence use behavior either directly or indirectly (
Venkatesh et al., 2003). Studies on actual use continue to grow; for example, Pal et al. found that there is still a gap between intention to use and actual usage (
Pal et al., 2019) and there is still has chance for further research. Liu also mentions actual use (
C. H. Liu et al., 2022); he researched the impact of using mobile payments on shopping intentions and usage behavior. The results show that intention to use has a significant and positive effect on usage behavior. However, recent research indicates that utilization determines how much of an impact IT adoption has on corporate performance (
Au & Kauffman, 2008).
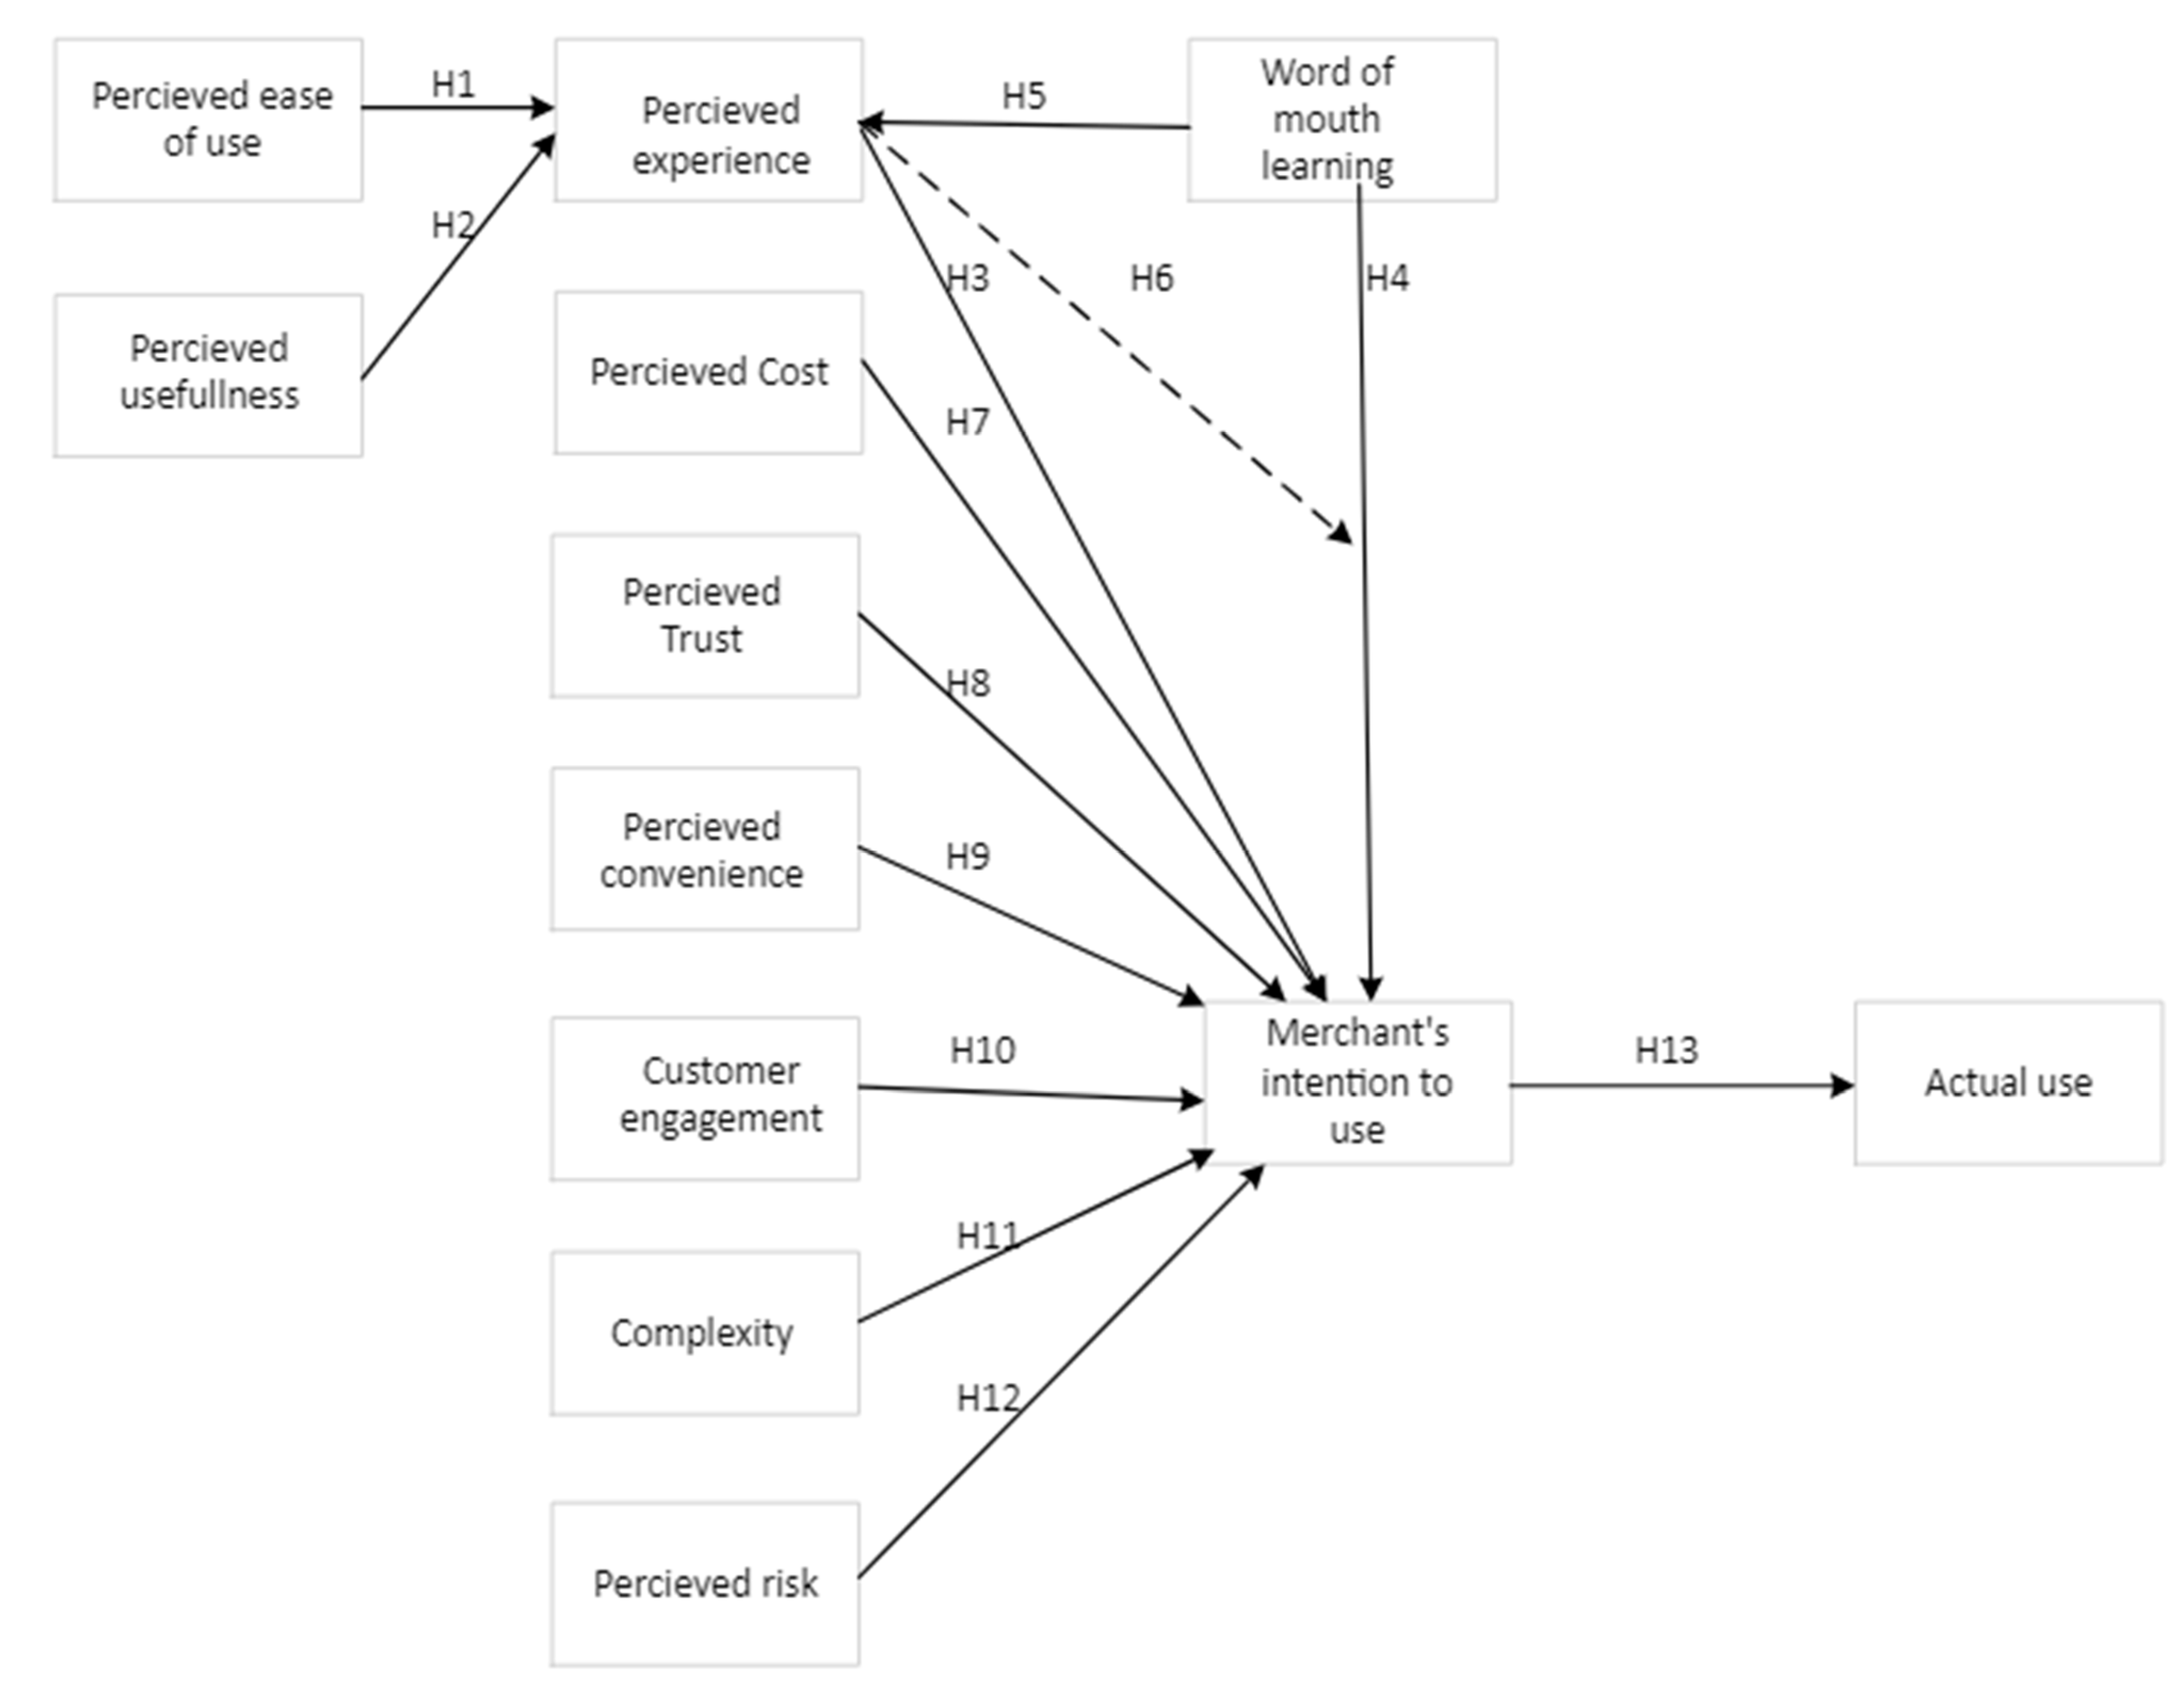
4. Proposed Model
After comprehensively discussing previous research and the factors involved, the researcher developed a theoretical model for further measurements. The proposed model incorporates key constructs such as perceived risk, convenience, and behavioral intention, adapted from established information systems’ adoption theories. The eight exogenous variables include perceived word-of-mouth learning, perceived cost, perceived trust, perceived convenience, customer engagement, complexity, perceived risk, and perceived experience. In addition to acting as an exogenous variable, perceived experience acts as a mediator and moderator for the word-of-mouth learning variable. Moreover, there are two antecedent variables: perceived ease of use and usefulness. We also have one intervening variable, intention to use, and one dependent variable, actual use.
Hence, the researcher would like to present the conceptual model of this study as follows:
Each of the 13 causal relationships shown in
Figure 1 are associated with a research hypothesis, which is based on previous research which has been discussed in the previous sub-section.
5. Research Methodology
The research employs structural equation modeling (SEM) with a 95% confidence level, utilizing AMOS 21 for a SEM analysis and SPSS 22 for data processing. This approach includes a factor loading analysis and a confirmatory analysis (CFA) to systematically organize, process, and validate the data. By using this method, this study ensures that all variables and constructs are accurately measured and properly aligned, enhancing the reliability of the findings.
5.1. Sample and Data Collection
The target population of this research includes business owners and decision-makers whose businesses meet the criteria of MSMEs and who are 18 years of age or older. The questionnaire was derived from the existing research and carefully translated into Indonesian to maintain accuracy and preserve the original meaning. To further translation accuracy, a back-translation method was applied. Additionally, a pilot test with ten responders was conducted to improve the instruments’ clarity, validity, and reliability.
For a population exceeding 100.000, a minimum sample size of 400 is required to achieve a 5% margin of error at a 95% confidence level (
Hair et al., 2014;
Kline, 2016). Eligible respondents were provided with a self-administered questionnaire in person or online.
The data used to test the research model were collected through questionnaire responses, with each item measured on a five-point Likert scale (1 = strongly disagree to 5 = strongly agree). To minimize semantic issues, the questionnaire was refined based on input from three experts in acceptance models and digital transformation. The questionnaire was then presented in a pretest to ten MSME actors and changed based on their feedback to ensure validity. Indicators and measurement instruments are shown in
Table 3.
5.2. Data Preparation and Analysis
A total of 418 responses from the target population were collected for this study. The measurements model was evaluated based on convergent validity and discriminant validity to ensure the reliability and accuracy of the constructs. Convergent validity was assessed using three criteria: factor loadings, average variance extracted (AVE), and composite reliability (CR). It measures the extent to which indicators of a specific construct share a high proportion of common variance. Discriminant validity is crucial for establishing construct validity, preventing multicollinearity, defining clear conceptual boundaries, and improving the accuracy of the theoretical model.
For convergent validity, standardized loading estimates should be 0.5 or higher, ideally 0.7 or higher (
Hair et al., 2014). The extracted variance should be 0.5 or higher, and the coefficient alpha for construct reliability should be 0.7 or greater (
George & Mallery, 2019), although values between 0.6 and 0.7 can be acceptable (
Dash & Paul, 2021). They also recommended that the variance extracted estimates for two factors should be more than the square of the correlation between them to provide evidence of discriminant validity for the total scale.
AVE measures how well a set of items converges to represent a construct, while CR evaluates the internal consistency of those items. In other words, AVE assesses how well a set of items converges to measure a construct, and CR checks the internal consistency of those items. In addition to convergent validity, discriminant validity is essential for ensuring construct validity, preventing multicollinearity, defining clear conceptual boundaries, and improving theoretical model accuracy. To assess discriminant validity, we apply the Fornell–Larcker criterion (
Fornell & Larcker, 1981), which compares the correlation between constructs with the square root of their AVE. For discriminant validity to be established, the square root of a construct’s AVE must be greater than its correlation with the other constructs. This confirms that a construct shares more variance with its indicators than the other constructs.
6. Result
The construct validity (discriminant and convergent) of the measures of the 12 latent variables from the theoretical models was examined using a principal component factor analysis (
Hair et al., 2014). The results derived from the evaluation of the factor loadings of the indicators in relation to their corresponding variables, as well as among the variables themselves, are presented in
Table 4. The factor loading values indicated in the table are above the recommended threshold of 0.5, which is commonly accepted for the measurement of factor loadings. We evaluated Composite Reliability (CR), and Average Variance Extracted (AVE) to assess validity further. All constructs have CR and AVE values that are higher than the minimal cutoffs of 0.7 for CR and 0.5 for AVE, except for the COST which had a CR value 0.677. Although slightly below the ideal threshold, it can still be acceptable (
Dash & Paul, 2021). We retained the COST variable due to its theoretical and practical significance in understanding merchant decision-making (
Bhimani, 2021;
E. F. Hasan et al., 2025;
James et al., 2025). Overall, the result of the factor loadings, average variance extracted (AVE), and composite reliability (CR) confirm that the survey items consistently and dependently align with their respective constructs, and each construct explains at least 50% of the variation in its indicators, supporting the measurement model’s reliability and validity.
Table 5 shows the result of the discriminant validity measurement. The values along the diagonal represent the square roots of the AVE (Average Variance Extracted) for each construct, and they are all greater than the corresponding inter-construct correlations. This confirms that each construct is different from the others, thus indicating acceptable discriminant validity based on the Fornell–Larcker criteria.
The results in
Table 6 indicate that hypotheses H1, H6, H7, H8, H10, and H11 are not supported, as their
p-values exceed 0.05. In contrast, hypotheses H2, H3, H4, H5, H9, H12, and H13 are statistically significant, with
p-values below the 0.05 threshold, demonstrating a strong relationship consistent with the theoretical framework. These findings partially validate the proposed model, identifying the areas requiring further investigation and refinement.
Table 6 presents the detailed hypothesis testing results.
The values in
Table 6 were presented in the following form: unstandardized effect followed by statistical significance presented by *, ***, or NS which refers to 0.05, 0.001, or Not Significant, respectively. In addition, the goodness of fit indicators of the models meet the minimum criteria of statistical values. The indicators of goodness of fit can be seen in
Table 7.
7. Discussions and Implications
The results highlight both supported and unsupported hypotheses, offering a clearer understanding of the factors influencing mobile payment usage. Notably, perceived ease of use directly affects perceived experience, which is rejected (H1). This result contrasts with the findings in previous research (
Liébana-Cabanillas et al., 2021;
Puriwat & Tripopsakul, 2021;
Sinha & Singh, 2022), which reported a significant relationship between these constructs. One of the potential explanations for this difference is the current study context, which focuses on MSME students in Indonesia. These users may prioritize practical business outcomes, such as cost-effectiveness, customer reach, and transaction reliability, over perceived system simplicity. In this context, ease of use may not significantly affect their overall experience, especially if combined with factors like trust, perception of utility, or security services. More specifically, various levels of digital literacy among MSME owners can reduce their perception of the ease of use of a system, making this concept more important for their adoption experience. This finding indicates that while ease of use is essential, it does not singularly shape users’ experiences, as individual preferences, expectations, and product features also play a significant role. Conversely, the positive impact of perceived usefulness on perceived experience was strongly supported (H2), aligning with previous research by Sinha, Puriwat, and Liebana-Cabanillas showcasing the critical importance of perceived value in shaping user experiences.
In addition, the significant influence of perceived experience (H3), word-of-mouth learning (H4), convenience (H9), and perceived risk (H12) on mobile payment adoption and actual usage was validated. Hence, these results highlight the critical role of these constructs in shaping user behavior and adoption decisions and align with prior studies (
Boden et al., 2020;
Jiang & Stylos, 2021;
Pal et al., 2021;
Ponte & Bonazzi, 2021;
Sinha & Singh, 2022;
Talwar et al., 2021). Additionally, the mediation analysis reveals that perceived experience mediates the relationship between word-of-mouth learning and intention to use, offering more profound insights into the indirect factors driving adoption. However, in this study, factors such as perceived cost (H7), trust (H8), customer engagement (H10), and complexity (H11) did not directly affect mobile payment adoption, likely due to the specific priorities and context of MSMEs. Business owners tend to focus on functionality and perceived benefits, such as usefulness, rather than concerns about cost and trust. In the context of Indonesian MSMEs, these factors may be less influential due to several contextual reasons, including limited digital literacy, the prioritization of business practicality over system features, and a reliance on peer recommendations over system characteristics. Additionally, trust may not be a significant barrier because, in Indonesia, there is no other system, so the community and MSME communities continue to use the mobile payment system even though trust issues exist. Government initiatives and technology provider policies may have further mitigated trust-related uncertainties, making it less of a deciding factor for adoption. Meanwhile, intention to use (H13) has a positive, direct effect relationship with actual usage. This result is consistent with previous studies by
C. H. Liu et al. (
2022) and
Pal et al. (
2019).
Similarly, perceived cost might not hinder the adoption of mobile payments in the MSME sector; since, they may also view the long-term benefits, such as increased sales, customer convenience, and easy handling with cashless payments, as outweighing the costs. Customer engagement may play a more indirect role, as MSMEs could adopt mobile payments primarily for operational efficiency rather than because of direct customer interaction. Moreover, complexity may not be a significant barrier, especially for business owners with less technology experience, but who are already familiar with digital payment systems. Training programs and fintech education could further reduce usability concerns, making perceived complexity less of an issue. The findings indicate that other factors, such as perceived usefulness, word-of-mouth learning, and perceived experience, strongly influence the adoption of mobile payments among MSMEs. This result suggests that MSMEs prioritize the practicality and benefits of mobile payments over the potential challenges related to cost, trust, or complexity.
7.1. Theoretical Implications
This study extends prior research by integrating multiple theoretical perspectives (TAM, UTAUT, and TPB) to develop a new theoretical framework tailored to MSME mobile payment adoption. By combining key factors from the proven theories in previous studies, this research offers a novel approach to explaining the factors influencing adoption behavior. Moreover, this study highlights the mediating role of merchants’ intention to use, showing how perceived usefulness, perceived risk, and word-of-mouth learning collectively shape actual adoption, in contrast with the previous studies that focused on individual constructs. Furthermore, the findings challenge the conventional assumption that perceived cost and trust directly influence adoption, suggesting that financial literacy and regulatory interventions may moderate their impact. This study also extends prior research by examining the indirect pathways through which user perceptions translate into adoption behavior, providing a more nuanced understanding of the decision-making process. These insights enrich theoretical discussions on digital payment adoption and serve as a foundation for future research exploring the evolving role of fintech solutions in MSME digital transformation.
7.2. Practical Implications
The findings of this study offer insights for fintech companies as technology providers and governments as policymakers to enhance mobile payment adoption among MSMEs. The results highlight the critical role of perceived usefulness, perceived experience, word-of-mouth learning, and perceived risk in shaping mobile payment adoption, while factors such as perceived cost, trust, customer engagement, and complexity were found to be insignificant.
Table 8 provides the following actionable implications:
8. Conclusions
This study provides insights into the factors influencing mobile payment adoption among MSMEs by integrating multiple theoretical perspectives. The findings confirm the significant roles of perceived usefulness, perceived risk, word-of-mouth learning, and merchants’ intention to use in shaping actual adoption behavior. Additionally, this study highlights the mediating effect of intention to use, demonstrating its role as a key mechanism through which various factors influence adoption decisions.
Interestingly, perceived cost, trust, customer engagement, and complexity did not directly affect adoption, suggesting that these factors may be more context-dependent and influenced by external conditions such as financial literacy and regulatory interventions. These findings challenge existing assumptions and underscore the need for further exploration into moderating effects and contextual variations.
The theoretical contributions of this research lie in its integration of the TAM, DOI, Trust Theory, and other proven theories, offering a more comprehensive understanding of mobile payment adoption dynamics. The findings provide actionable recommendations for technology providers, fintech companies, and governments as policymakers to enhance MSME adoption, such as improving financial literacy programs, ensuring secure and cost-effective payment systems, and leveraging word-of-mouth promotion strategies.
Future research could explore how cognitive biases, heuristics, and bounded rationality influence mobile payment adoption decisions, particularly among MSMEs with limited technological knowledge or regions with weaker FinTech regulations. Understanding these behavioral aspects may also shed light on the significance of perceived cost, trust, customer engagement, and complexity in different adoption contexts. Additionally, examining the moderating effects of financial literacy and regulatory interventions could provide deeper insights into how knowledge and policy frameworks shape MSME adoption behavior. Moreover, future studies should incorporate additional contextual and moderating factors to refine the theoretical framework further, ensuring a more nuanced understanding of adoption dynamics. A mixed-methods approach, integrating qualitative and quantitative perspectives, would offer a more comprehensive view, capturing statistical trends and deeper behavioral motivations. By bridging these perspectives, future research can enhance the applicability of mobile payment adoption models across diverse MSME environments.


