Abstract
This paper examines arbitrage opportunities available in one of the largest wholesale electricity markets in the world, the Midcontinent Independent System Operator (MISO) electricity exchange. While prior research suggests that market efficiency on the exchange has increased over time, this study reveals that historical pricing information can still be used to generate positive returns. I find that a trading rule based on prior spot and forward prices generates statistically and economically significant risk-adjusted returns across the entire MISO footprint. These returns may in part be explained by the relatively small number of financial traders in the market and the ability of generation owners to exercise market power.
Keywords:
wholesale electricity; efficient markets; Midcontinent Independent System Operator; energy derivatives JEL Classification:
G10; G12; G14
1. Introduction
Historically, US electricity markets were dominated by vertically integrated firms that owned both generation and transmission resources. These companies were treated as natural monopolies, with state and federal regulators determining the price they charged for their bundled transmission and generation services. There were several motivating factors behind the push for deregulation in the 1990s, perhaps the most salient being that government-controlled, bundled electricity prices were attributed to various market inefficiencies. Critics argued that virtual integration and the natural monopoly regulatory approach led to underinvestment by generators and higher energy prices for end users1.
Through a series of orders, the Federal Energy Regulatory Commission (FERC) required electricity providers to unbundle their services to promote competition. FERC also championed the establishment of Independent System Operators (ISOs) and Regional Transmission Organizations (RTOs) to ensure open access to transmission services within a given geographic footprint and to provide a competitive market for trading wholesale electricity. Today, ISOs and RTOs provide energy services to approximately 67% of the American population (FERC, 2024).
The Efficient Market Hypothesis (EMH), popularized by Fama (1970), defines three levels of market efficiency, where each form encompasses the previous one: weak form, semi-strong form, and strong form. For a market to be classified as weak form efficient, current prices must fully incorporate all relevant historical information. The price formation process in semi-strong form markets captures historical information and quickly adjusts to new, publicly available information. Finally, prices in strong-form markets include all relevant historical, public, and private information.
EMH tests of deregulated wholesale electricity markets often focus on the existence and magnitude of forward premiums. In power markets, the forward price is referred to as the day-ahead (DA) price, while the spot price is known as the real-time (RT) price. In MISO, DA and RT prices are quoted in terms of dollars per megawatt hour (USD/MWh) for a specific hour and location. Therefore, the realized forward premium may be defined as follows:
where and represent the day-ahead price (established in day t) and real-time price for electricity for hour i, at location j, for delivery on day t + 1, respectively. is the realized forward premium for hour i, at location , observed on day . For the market to be at least weak form efficient, realized forward premiums should have no predictive power on future forward premiums. It is important to note that predictable forward premiums do not necessarily translate to arbitrage opportunities, as the size of the premium and various market imperfections can erode potential returns.
Research covering arbitrage profits in electricity exchanges generally relies on strategies that can be implemented by participants who do not have the ability to generate or receive wholesale power. These participants are known as virtual traders and are restricted to placing financially settled bids and offers in the day-ahead market for electricity. Virtual bids and offers are settled alongside trades for the physical delivery of electricity. For the market to clear, virtual traders must close their position by making a reversing trade in the real-time market the following day. For instance, a virtual trader who agrees on day t to purchase 500 MWh of power in the day-ahead market for a specific hour and location on day t + 1 must then sell 500 MWh of electricity in the real-time market for delivery in that hour and location on day t + 1. Her realized return is 500*(). This process ensures that the return for a virtual trader is a function of the number of megawatt hours traded and the realized forward premium, as shown in Equation (1).
Virtual trading in electricity markets should support efficiency through increased liquidity and by curtailing arbitrage opportunities. However, several authors—Bessembinder and Lemmon (2002), Longstaff and Wang (2004), Haugom and Ullrich (2012), Michelfelder and Pilotte (2020), and Cao et al. (2022)—find predictable and sustained forward premiums in various US wholesale electricity markets that facilitate virtual trading.
A few authors have explored whether forward premiums can be leveraged to generate arbitrage returns in US electricity markets. Borenstein et al. (2008) establish a trading rule based on prior forward premiums in the years immediately prior to the collapse of California’s deregulated electricity market and report economically significant cumulative returns.
The research by Birge et al. (2018) is of particular interest to this study as the authors apply forward premium trading rules to the MISO exchange before and after a reduction in transaction costs for virtual traders. Their rules led to losses during the high transaction cost period. However, the authors report an increase in virtual trading volume and economically significant arbitrage returns for the 20 months immediately following the fee reduction.
While high transaction costs can create arbitrage opportunities, as explained by Birge et al. (2018), market power may also create sustained and exploitable market inefficiencies. FERC (2025) defines market power as “the ability of any market participant with a large market share to significantly control or affect price by withholding production from the market, limiting service availability, or reducing purchases”. Although FERC has attempted to mitigate the exertion of market power in US electricity markets through various orders, several authors have documented its persistence and impact on consumer welfare.
MacKay and Mercadal (2022) find that while marginal costs for power producers have decreased in deregulated portions of the US, consumers in these areas pay more for electricity than those who live in regulated states. The authors note that higher consumer prices are driven primarily by an increase in wholesale markups—defined as the difference between the wholesale price for power and the marginal cost of generation. The ability for generators to exert market power when their costs have decreased is attributed to market imperfections that were not affected by deregulation: high barriers to entry and inelastic demand for electricity. While MacKay and Mercadal (2002) utilize a national dataset, market power has been linked to consumer welfare losses for regional markets in California (Borenstein et al., 2002), Texas (Hortasçu & Puller, 2008), and the eastern United States (Mansur, 2008).
This paper utilizes a straightforward trading rule based on previous MISO day-ahead and real-time prices. This study extends Birge et al.’s (2018) work and adds to the overall literature in several aspects. Birge et al.’s (2018) sample period ends in 2012, just prior to MISO’s expansion into the southern United States in 2013. This increase in geographic size has contributed to the number of market participants growing from 356 in 2012 (MISO, 2012) to over 500 in 2023 (MISO, 2023). The sample used in this analysis (2018–2023) fully incorporates MISO’s growth, which should make it more difficult to find consistent arbitrage returns. Additionally, Birge et al. (2018) use only the Sharpe ratio to evaluate the profitability of their trading rule. This study utilizes two additional performance measures: the Sortino and gain–loss ratios, neither of which has been applied to wholesale electricity returns to my knowledge. While I find cumulative returns that are lower in comparison to those reported by Birge et al. (2018), they are both statistically and economically significant.
2. MISO Market Structure
The Midcontinent Independent System Operator2 (MISO) was established in 2001 as an ISO and is responsible for coordinating the flow of electricity across 15 states and Manitoba. Headquartered in Carmel, Indiana, MISO facilitates the delivery of power across 77,000 miles of transmission lines and provides service to 45 million people (MISO, 2025b). MISO’s geographic footprint is divided into eight regional hubs: Arkansas (AR), Illinois (IL), Indiana (IN), Louisiana (LA), Michigan (MI), Minnesota (MN), Mississippi (MS), and Texas (TX).
MISO also manages a wholesale market for electricity that generates USD 40 billion in annual transactions. Equilibrium day-ahead and real-time prices vary based on location as supply, demand, congestion, and transmission losses are not uniform across the MISO footprint. Market-clearing DA and RT prices, referred to as locational marginal prices (LMPs), represent the cost (quoted in USD/MWh) of providing an additional unit of energy at a given node. Nodal LMPs are calculated using a linear programming model designed to minimize electricity costs, subject to physical and reliability constraints. MISO aggregates nodal DA and RT LMPs to the hub level for each hour of the day. Thus, MISO posts 24 DA and 24 RT LMPs for each hub every day.
Virtual trading has been available on the MISO exchange since its inception and facilitates DA and RT price convergence by allowing trading access to those without the physical capacity to generate or transmit wholesale power. All virtual bids and offers originate in the day-ahead market and are reversed in the real-time market at expiration. Although virtual trades can be performed by physical participants (either for hedging or speculative purposes), the vast majority are executed by financial-only participants.
While virtual traders provide liquidity and limit arbitrage opportunities, their overall impact on the MISO exchange may be limited. MISO’s most recent annual report reveals that virtual trading accounted for only 16% of the total load cleared on the exchange (Potomac Economics, 2024). Similar to most power markets, MISO participants are required to meet high credit standards due to the volatility of wholesale electricity prices. As part of the registration process, prospective market participants must provide audited financial statements showing at least USD 5,000,000 in total assets or USD 500,000 in tangible net worth to avoid posting a financial security (MISO, 2025a). For those who do not meet the total assets or tangible net worth benchmarks, a minimum financial security of USD 200,000 (of which USD 100,000 is restricted) is required. While these credit requirements are designed to prevent market failure, they act as a barrier to entry for many potential virtual traders.
Day-ahead bids and offers for electricity must be submitted by 10:30 a.m. Eastern Prevailing Time on the day prior to delivery (operation) to MISO (MISO, 2024). MISO then posts market-clearing day-ahead LMPs for all 8 hubs by 1:30 p.m. Eastern Prevailing Time on the day prior to operation. Virtual traders can determine their profits or losses once the real-time prices for the operating day are posted.
3. Data and Methodology
This study incorporated all MISO hub-level DA and RT LMPs posted from 1 January 2018 to 31 December 2023. In total, the sample included 2191 day-ahead and 2191 real-time observations for every hour of the day on each of the 8 regional hubs. All pricing information is available for free on MISO’s website: https://www.misoenergy.org/ (accessed on 28 February 2025).
I utilized an intuitive trading strategy to evaluate arbitrage opportunities on the MISO market. In alignment with Borenstein et al. (2008), Birge et al. (2018), and several others, I incorporated prior forward premiums in developing the trading rule for this study. In addition to forward premiums, I also conditioned the trading strategy on prior observations of the basis.
Fama and French (1987) defined the basis for a commodity as the difference between its futures price observed in period t for delivery in period T and the spot price at period t, where T > t. The authors found that the basis has predictive power for realized forward premiums of several commodities. Michelfelder and Pilotte (2020) reported that the basis has predictive power in forward premiums on the Pennsylvania, New Jersey, and Maryland (PJM) electricity market. However, they did not test whether the basis could be used to generate arbitrage returns.
I calculated the basis as follows:
where represents the day-ahead price for electricity for hour , on hub , observed in period t for delivery in . is the hour spot price on hub in period t. is the basis for hour , on hub , in period t. Hub-level LMPs were used to calculate the forward premium, as shown in Equation (1).
The trading rule applied in this study creates buy (sell) signals in the day-ahead market if the previous forward premium and basis were both negative (positive). I assumed that each transaction involved the same number of megawatt hours and that traders left the market for one day after incurring a loss. The dollar return earned on day from employing this rule for hour in hub of the MISO footprint can be expressed as follows3:
All hour hub-level returns that occurred during the same day were added together to create hourly return observations spanning the entire footprint. These 24 footprint-level return observations were then added together to calculate the overall daily return for each day in the sample period. A running total of these daily returns was created to generate the cumulative return throughout the sample period.
The Jarque–Bera normality test was applied to the realized forward premiums in this sample. The null hypothesis of normality was rejected for each hour of the day across all eight hubs. Because of this and the price spikes inherent in wholesale energy prices, I used non-parametric tests to evaluate the following hypotheses:
- H1null: The median daily return generated by Equation (3) is less than or equal to zero.
- H1alt: The median daily return generated by Equation (3) is greater than zero.
- H2 null: The cumulative return series is a random process.
- H2alt: The cumulative return series is a non-random process.
The one-sample sign test was employed to assess whether the median daily return was greater than zero, while the one-sample run test was used to evaluate randomness. To perform the one-sample sign test, daily returns were assigned either a value of 1 (gains) or −1 (losses). If the market is at least weakform efficient, the expected median daily return is zero. Given the large sample size (1707 round-trip trades), I used the normal approximation of the binomial distribution to calculate the following one-sample sign test statistic:
where is the total number of days a positive return is observed during the sample period, and n is the total number of days in which a gain or a loss occurred.
The one-sample run test statistic was calculated as follows:
where r is the number of runs in the daily return series, and represents the number of days where a loss occurs in the sample period. n and are described in Equation (4).
Three techniques were used to evaluate the risk/return performance of the trading rule applied in this study. Following Birge et al. (2018), the annualized Sharpe ratio was estimated as follows:
where and are the average and standard deviation of the daily dollar return series, respectively, and is the daily risk-free rate4.
As discussed in Cherdito and Kromer (2013), the Sharpe ratio only satisfies three of the four axioms for assessing portfolio performance. The Sharpe ratio is quasi-concave, scale-invariant, and distribution-dependent. However, it is not strictly monotonic with respect to returns and can therefore lead to suboptimal investment decisions. Two additional measures were utilized here that overcome this problem and satisfied all four axioms. The annualized Sortino ratio was calculated as shown below:
where is the standard deviation of the negative returns in the sample period.
Finally, the gains–loss ratio was calculated as follows:
and represent the average daily positive and average daily negative return, respectively. () is the percentage of days with a positive (negative) return. While there are other, more complex methods to evaluate portfolio performance, the three ratios used in this study are intuitive and can be easily used by MISO speculators.
Table 1 provides summary statistics for hourly DA and RT prices as well as the forward premiums and basis observations. While the forward and spot price series are similar in terms of their averages (USD 34.99 and USD 34.44, respectively), the latter is approximately 63% more volatile. Table 1 reveals that the average forward premium is positive for 21 h of the day, and ranges between – USD 0.12 (21:00) and USD 1.92 (14:00). The forward and basis are similar both in their hourly averages and standard deviations.

Table 1.
MISO Hourly Summary Statistics. The table represents first and second moments of MISO day-ahead (DA) and real-time (RT) prices as well as hourly forward premium (FP) and basis observations. All values are in terms of dollars per megawatt hour.
4. Results
Virtual traders who employed the trading rule described above would have executed 1707 round-trip trades over the 2190-day sample period and earned a total of USD 376,737.33. This translates to an average return of USD 172 per day and USD 220.70 per round-trip transaction5. Table 2 provides descriptive statistics for the daily return series. The median return per roundtrip transaction is USD 246.83, which is inconsistent with an efficient market. Interestingly, the mean return for trades that result in a profit is smaller in absolute terms than the average return for trades that lose money. This is more than offset by the nearly 2:1 ratio of positive to negative return days.
Table 2.
Summary Statistics for Daily Returns. This table presents summary statistics for the daily return series generated by the trading rule used in this analysis. A total of 1707 round-trip trades occurred during the 2190-day sample period. Overall, 1130 of these trades resulted in a positive return, while 577 generated a loss. Returns are quoted in terms of dollars per megawatt hour.
The Z-score for the one-sample sign test applied to the daily return series is 13.36, which is significant at the 1% level. Therefore, the hypothesis that the median daily return is less than or equal to zero is rejected. Similarly, the cumulative return series is distinguishable from white noise. The Z-score for the runs test on the cumulative return series is −42.29, which is also significant at the 1% level.
As a robustness check, I compare the median return of USD 220 against another, more naïve approach. A virtual trader who notices that MISO forward premiums tend to be positive (i.e., the day-ahead price is an upward-biased estimate of the real-time price) could utilize a basic strategy of selling day-ahead power and buying real-time power in equal quantities across the entire market for all 24 h of the day throughout the sample period. The median return from this strategy is USD 142. A two-sample sign test reveals that the difference between these two medians is statistically significant, with a Z-score of −6.20.
While the return shown here is smaller than the arbitrage profits found by Birge et al. (2018), it provides a substantially better risk/return payoff as measured by the Sharpe ratio. The most profitable trading rule employed by Birge et al. (2018) resulted in profits of over USD 4.7 million during a 20-month span and a Sharpe Ratio of 1.17. The trading rule used in this study generates a Sharpe Ratio of 2.65. The Sortino and gain–loss ratios for the arbitrage portfolio created in this study are 4.07 and 1.74, respectively. All three performance measures suggest this portfolio produces returns that more than compensate for its risk.
Figure 1 illustrates the relative stability and upward trajectory of the cumulative return series, which was created by summing the daily profits and losses that occurred over the entire sample. While the reduction in transaction costs has muted the growth rate in cumulative returns, long-term MISO speculators can consistently exploit forward premiums.
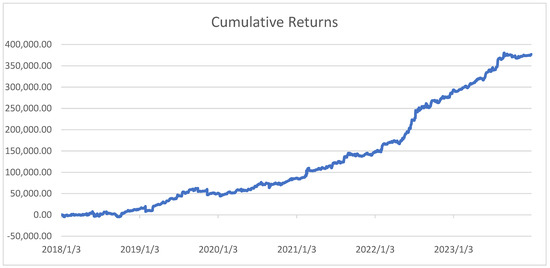
Figure 1.
Cumulative returns. This graph presents cumulative daily returns (in terms of USD/MWh) earned by buying (selling) the forward premium if the previous period’s forward premium and basis were both negative (positive). I assumed a 24 h withdrawal from the market after incurring a loss.
Although daily returns are lower in comparison to those reported in Birge et al. (2018), the natural question of why any trading rule can generate consistently positive returns still exists. In addition to the relatively low virtual trading volume and the barriers to entry for virtual traders mentioned above, market power may also play a role.
Potomac Economics serves as MISO’s Independent Market Monitor (IMM). Among other duties, IMMs are responsible for providing impartial market performance reports on the ISOs they service. In its most recent assessment of MISO’s operations (Potomac Economics, 2024), Potomac Economics outlines the potential for market power exertion within transmission-constrained areas of the footprint. Potomac classifies suppliers who are key in relieving these transmission constraints as Pivotal. In 2023, the IMM reported that 90% of the chronically constrained areas in MISO’s South and Midwest portions had at least one pivotal supplier. However, Potomac found no evidence to support anticompetitive behavior on the exchange, which they attributed to effective market power mitigation techniques.
There is an important caveat in Potomac’s overall assessment of market power abuse within MISO. The IMM measures market power exclusively in the real-time market, with the presumption that a competitive spot market will lead to a competitive forward market. This theory is dubious as more than 90% of all transactions occur in the day-ahead market, where both large-scale net suppliers and net demanders of power may be able to affect prices. Additionally, MISO’s real-time market is essentially an imbalance market, which is primarily used to address deviations in day-ahead energy forecasts. Furthermore, Potomac mentions that “fulsome participation by physical and virtual trading participants” in the forward market is required for competitive spot prices to translate to competitive forward price (Potomac Economics, 2024). As previously mentioned, approximately 85% of the load cleared on the exchange involves the physical delivery of power. Without granular trade information by each market participant, it is difficult to untangle whether market power or another factor is responsible for the returns found here.
5. Conclusions
This paper utilizes historical pricing information to evaluate arbitrage opportunities on the Midcontinent Independent System Operator electricity market. The overall arbitrage profits reported here are statistically significant. Furthermore, the Sharpe, Sortino, and gain–loss ratios all suggest that the arbitrage portfolio created in this analysis is a desirable one. Taken alongside the findings by Birge et al. (2018), the lower but stable returns reported are consistent with a maturing exchange that still has several participants with the ability to exercise market power.
The limited scope of virtual trading and market power abuse may contribute to the continued profitability of technical trading rules. Future research that focuses on pathways to increase the number of financial participants within wholesale electricity markets could lead to gains in market efficiency and consumer welfare.
Funding
This research received no external funding. The APC was funded by the author.
Institutional Review Board Statement
Not applicable.
Informed Consent Statement
Not applicable.
Data Availability Statement
All data used in this study can be accessed at https://www.misoenergy.org/ (accessed on 21 May 2025).
Conflicts of Interest
The author declares no conflicts of interest.
Notes
| 1 | For a more thorough discussion on the history of US electricity markets, see Glachant et al. (2023) and Nudell et al. (2019). |
| 2 | Formerly known as the Midwest Independent System Operator. |
| 3 | Since the deadline to submit DA bids and offers is 10:30 Eastern, it is not possible to employ this strategy based on information observed 24 h ago for each hourly time series. This rule uses a one-day lag for hours 00:00–10:00 and a 48 h lag for hours 11:00–23:00. |
| 4 | Extrapolated from historical 3-month treasury bill rates. Birge et al. (2018) did not account for the risk-free return in estimating the Sharpe ratio. |
| 5 | This rule initiates buy (sell) signals in the DA market whenever both the previous period’s basis and forward premium were negative (positive). Investors are assumed to withdraw from the market for 24 h after incurring a loss. Other specifications of this rule that increased the amount of time an investor refrains from the market were tested and yielded similar results. |
References
- Bessembinder, H., & Lemmon, M. (2002). Equilibrium pricing and optimal hedging in electricity forward markets. Journal of Finance, 57(3), 1347–1382. [Google Scholar] [CrossRef]
- Birge, J. R., Hortasçu, A., Mercadal, I., & Pavlin, J. M. (2018). Limits to arbitrage in electricity markets: A case study of MISO. Energy Economics, 75, 518–533. [Google Scholar] [CrossRef]
- Borenstein, S., Bushnell, J., Knittel, C., & Wolfram, C. (2008). Inefficiencies and market power in financial arbitrage: A study of California’s electricity markets. The Journal of Industrial Economics, 56(2), 347–378. [Google Scholar] [CrossRef]
- Borenstein, S., Bushnell, J., & Wolak, F. (2002). Measuring market inefficiencies in California’s wholesale electricity market. The American Economic Review, 92(5), 1376–1405. [Google Scholar] [CrossRef]
- Cao, K. H., Qi, H. S., Tsai, C. H., Woo, C. K., & Zarnikau, J. (2022). Energy trading efficiency in ERCOT’s day-ahead and real-time markets. Journal of Energy Markets, 15(3), 59–81. [Google Scholar] [CrossRef]
- Cherdito, P., & Kromer, E. (2013). Reward-risk ratios. Journal of Investment Strategies, 3(1), 3–18. [Google Scholar] [CrossRef]
- Fama, E. (1970). Efficient capital markets: A review of theory and empirical work. Journal of Finance, 25(2), 383–417. [Google Scholar] [CrossRef]
- Fama, E., & French, K. (1987). Commodity futures prices: Some evidence on forecast power, premiums and the theory of storage. Journal of Business, 60(1), 55–73. [Google Scholar] [CrossRef]
- Federal Energy Regulatory Commission (FERC). (2024). Energy primer: A handbook for energy market basics. Available online: https://www.ferc.gov/news-events/news/ferc-staff-issues-2024-energy-primer-handbook-energy-market-basics (accessed on 21 May 2025).
- Federal Energy Regulatory Commission (FERC). (2025). Glossary. Available online: https://www.ferc.gov/industries-data/market-assessments/overview/glossary#M (accessed on 21 May 2025).
- Glachant, J. M., Joskow, P., Lian, J., & Pollitt, M. (2023). Handbook on electricity markets. Edward Elgar Publishing. [Google Scholar]
- Haugom, E., & Ullrich, C. J. (2012). Market efficiency and risk premia in short-term forward prices. Energy Economics, 34, 1931–1941. [Google Scholar] [CrossRef]
- Hortasçu, A., & Puller, S. L. (2008). Understanding strategic bidding in multi-unit auctions: A case study of the Texas electricity spot market. RAND Journal of Economics, 39(1), 86–114. [Google Scholar] [CrossRef]
- Longstaff, F., & Wang, A. (2004). Electricity forward prices: A high-frequency empirical analysis. Journal of Finance, 59(4), 1877–1900. [Google Scholar] [CrossRef]
- MacKay, A., & Mercadal, I. (2022). Deregulation, market power, and prices: Evidence from the energy sector. CEEPR Working Paper No. 2022-008. MIT Center for Energy and Environmental Policy Research. [Google Scholar]
- Mansur, E. T. (2008). Measuring welfare in restructured electricity markets. The Review of Economics and Statistics, 90(2), 369–386. [Google Scholar] [CrossRef]
- Michelfelder, R. A., & Pilotte, E. A. (2020). Information in electricity forward prices. Journal of Financial Quantitative Analysis, 55(8), 2641–2664. [Google Scholar] [CrossRef]
- Midcontinent ISO (MISO). (2012). MISO fact sheet. Available online: https://www.pubmanitoba.ca/nfat/pdf/hydro_application/appendix_05_1_miso_corporate_fact_sheet_july_2012.pdf (accessed on 16 June 2025).
- Midcontinent ISO (MISO). (2023). MISO fact sheet. Available online: https://cdn.misoenergy.org/23_108%20Corp%20Fact%20Sheet%20NOVEMBER627569.pdf?_t_id=bT3hn584D13TEOtyefSIlg%3d%3d&_t_uuid=MuJYUAvqQz2C-MbZ7VLOpw&_t_q=fact+sheet&_t_tags=language%3aen%2csiteid%3a11c11b3a-39b8-4096-a233-c7daca09d9bf%2candquerymatch&_t_hit.id=Optics_Models_Find_RemoteHostedContentItem/627569&_t_hit.pos=5 (accessed on 16 June 2025).
- Midcontinent ISO (MISO). (2024). BPM 002-energy and operating reserves markets. Available online: https://www.misoenergy.org/legal/rules-manuals-and-agreements/business-practice-manuals/ (accessed on 21 May 2025).
- Midcontinent ISO (MISO). (2025a). Minimum participation requirements. Available online: https://cdn.misoenergy.org/Minimum%20Participation%20Requirements70105.pdf (accessed on 21 May 2025).
- Midcontinent ISO (MISO). (2025b). MISO fact sheet. Available online: https://www.misoenergy.org/meet-miso/media-center/corporate-fact-sheet/ (accessed on 21 May 2025).
- Nudell, T. R., Annaswamy, A. M., Lian, J., Kalsi, K., & D’Achiardi, D. (2019). Electricity markets in the United States: A brief history, current operations, and trends. In Smart grid control (pp. 3–27). Springer. [Google Scholar]
- Potomac Economics. (2024). 2023 State of the market report for the MISO electricity markets. Available online: https://www.potomaceconomics.com/wp-content/uploads/2024/06/2023-MISO-SOM_Report_Body-Final.pdf (accessed on 21 May 2025).
Disclaimer/Publisher’s Note: The statements, opinions and data contained in all publications are solely those of the individual author(s) and contributor(s) and not of MDPI and/or the editor(s). MDPI and/or the editor(s) disclaim responsibility for any injury to people or property resulting from any ideas, methods, instructions or products referred to in the content. |
© 2025 by the author. Licensee MDPI, Basel, Switzerland. This article is an open access article distributed under the terms and conditions of the Creative Commons Attribution (CC BY) license (https://creativecommons.org/licenses/by/4.0/).