
Shock and Volatility Transmissions Across Global Commodity and Stock Markets Spillovers: Empirical Evidence from Africa


Abstract
1. Introduction
2. Literature Review
2.1. Theoretical Underpinning
2.2. Empirical Literature
3. Econometric Methods
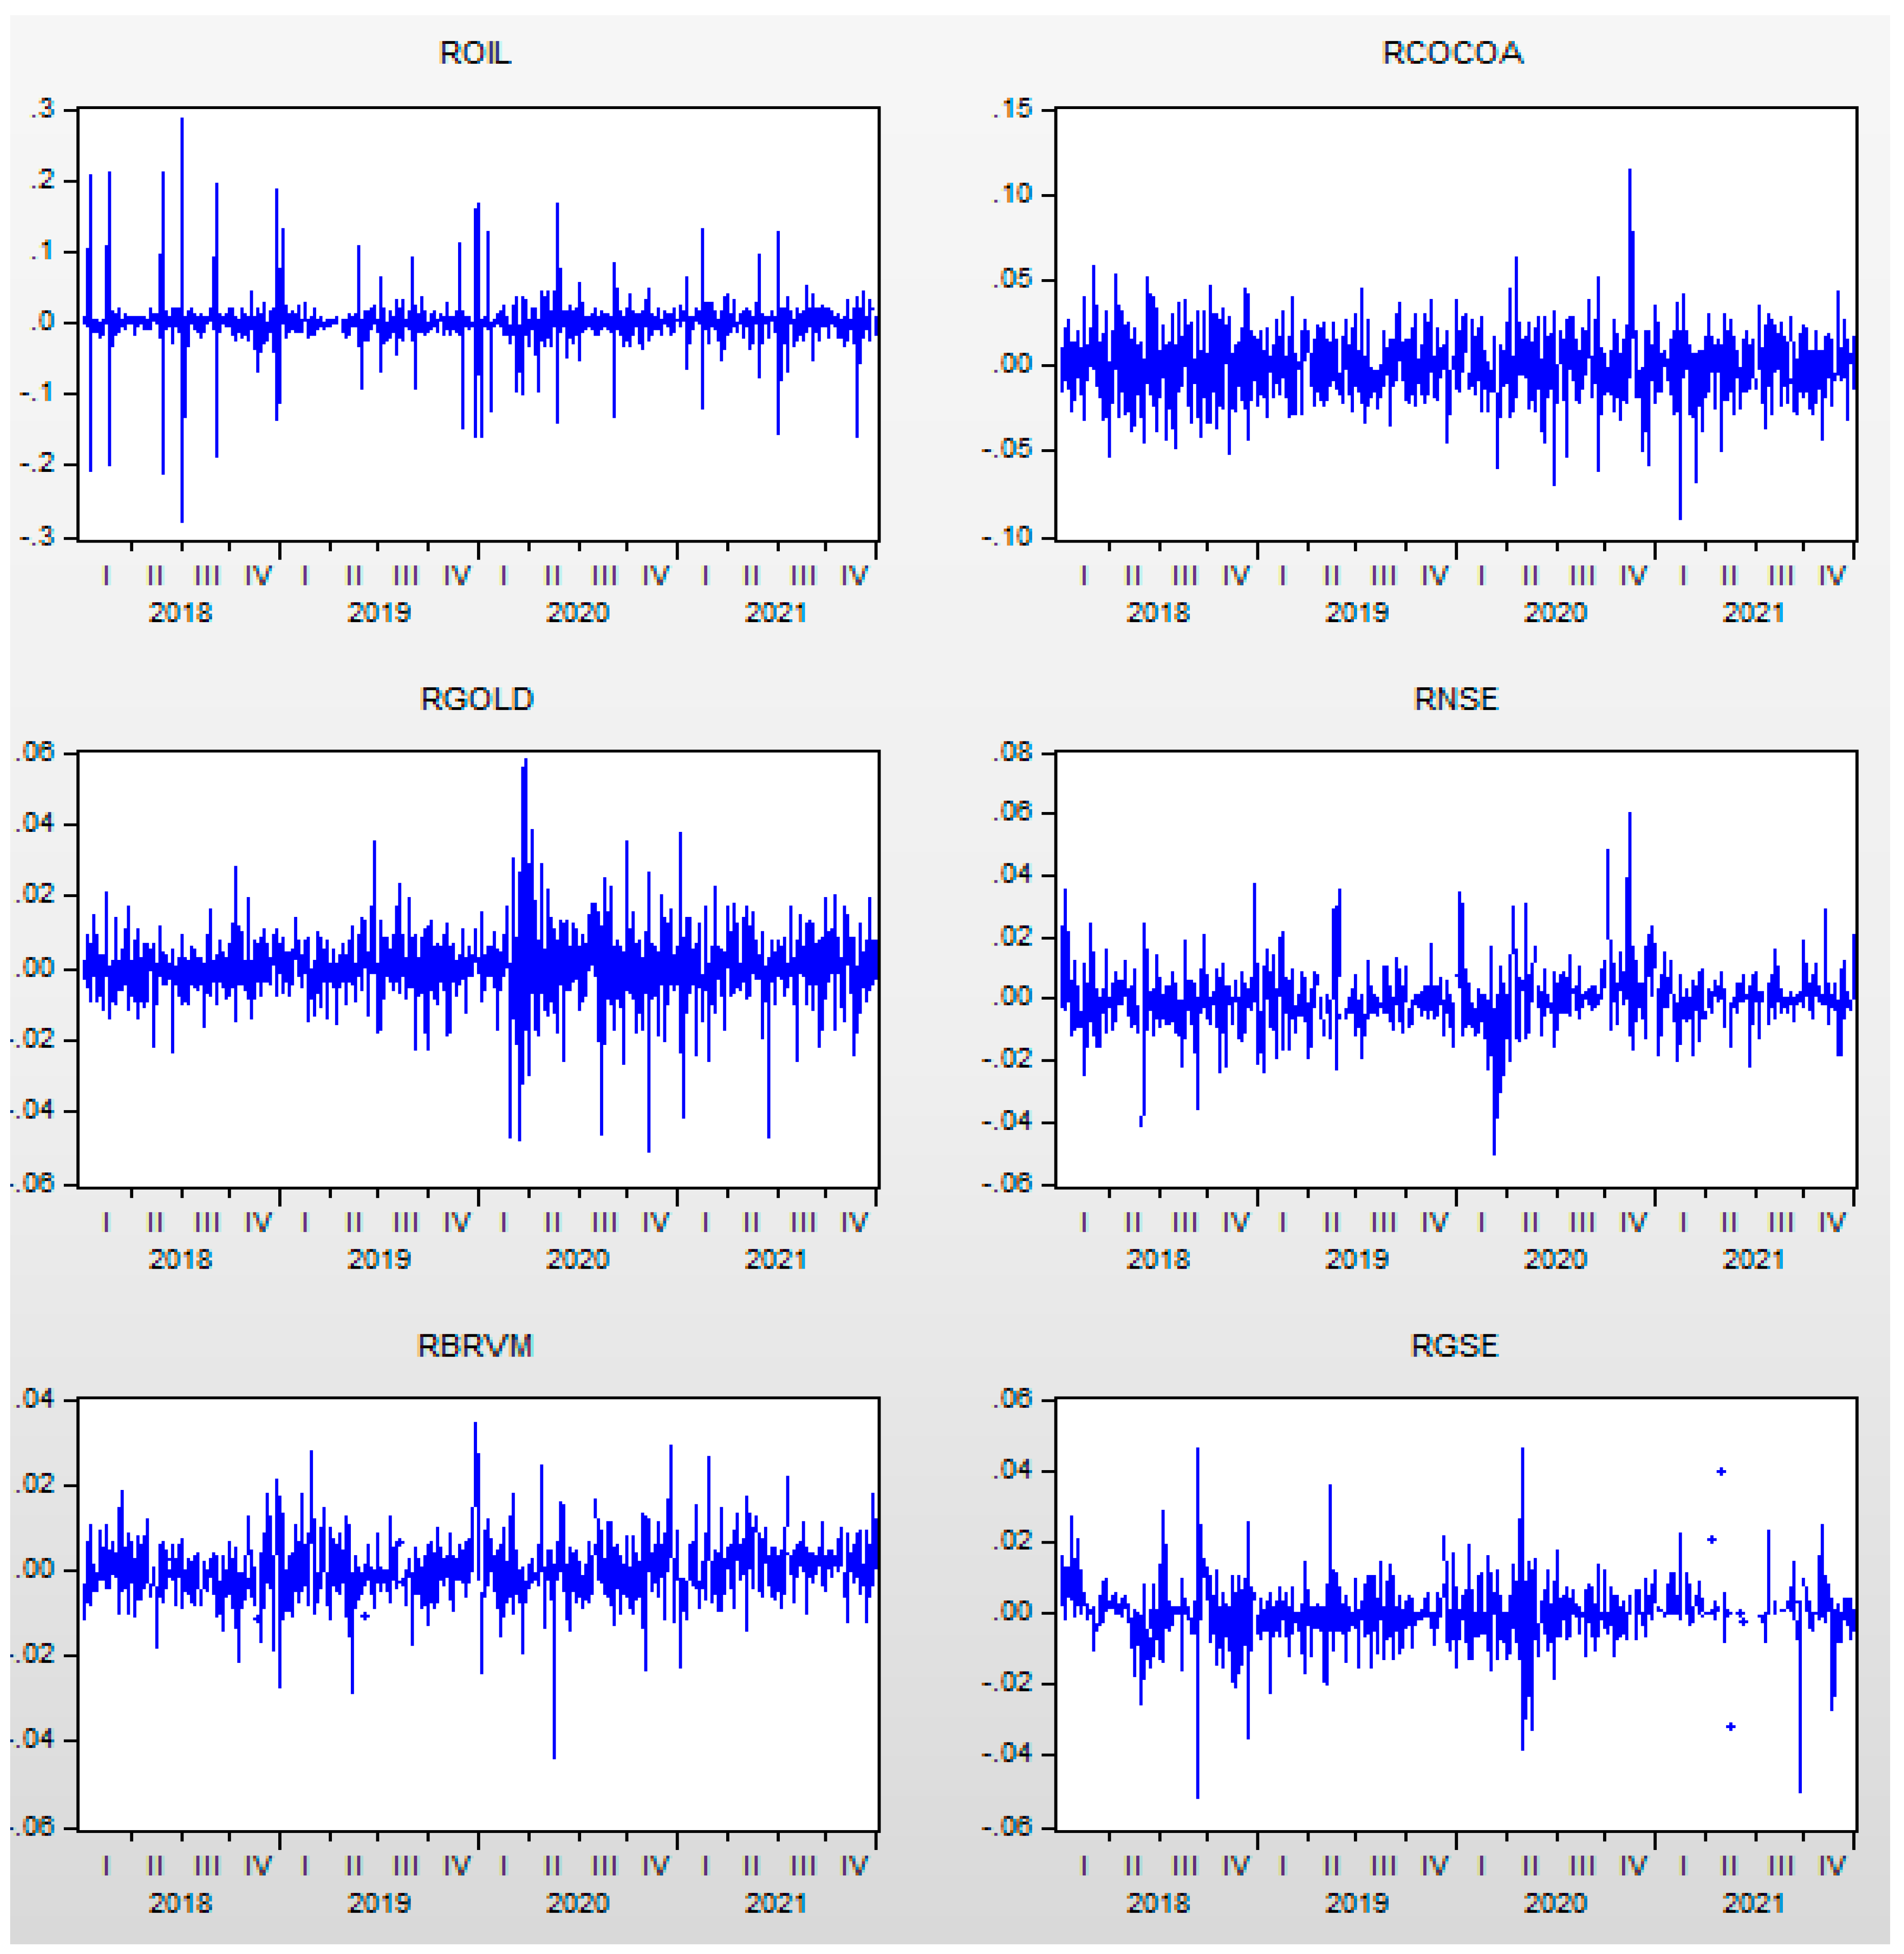
4. Data and Preliminary Analysis

| roil | rcocoa | rgold | rnse | rbrvm | rgse | |
|---|---|---|---|---|---|---|
| Mean | 0.000352 | 0.000382 | 0.000308 | 0.000089 | −0.00011 | −0.00021 |
| Median | 0.001507 | 0.001150 | 0.000504 | −0.00027 | −0.00037 | 0.0000 |
| Maximum | 0.287098 | 0.114913 | 0.057754 | 0.060478 | 0.034804 | 0.046232 |
| Minimum | −0.27851 | −0.08902 | −0.05055 | −0.05033 | −0.04405 | −0.05127 |
| Std. Dev | 0.034435 | 0.018902 | 0.009497 | 0.00962 | 0.006909 | 0.008042 |
| Skewness | −0.03103 | −0.03579 | −0.21704 | 0.417345 | 0.152220 | −0.20895 |
| Kurtosis | 25.65900 | 5.041799 | 9.277966 | 9.193079 | 7.221705 | 11.93962 |
| Jarque–Bera | 22013.5 | 169.2235 | 1711.105 | 1553.902 | 712.1402 | 2956.706 |
| ARCH test | ||||||
| F-Statistics | 276.215 | 4.907 | 35.768 | 68.709 | 14.311 | 110.831 |
| N*R2 | 217.736 | 4.892 | 34.636 | 64.055 | 14.120 | 98.051 |
| Unit root tests | ||||||
| ADFL | −22.173 | −31.275 | −32.515 | −17.496 | −16.063 | −32.826 |
| PPL | −61.297 | −31.295 | −33.299 | −24.043 | −27.168 | −33.447 |
| KPSSL | 0.2072 | 0.0258 | 0.1414 | 0.3392 | 0.2859 | 0.2298 |
5. Results and Discussion
5.1. Past Effects
5.2. Shocks and Volatility Spillovers Between Stock and Global Commodity Markets
5.3. Shocks and Volatility Spillovers Among Commodity Markets
5.4. Shocks and Volatility Spillovers Among Stock Markets
5.5. Asymmetric Effects
6. Conclusions and Policy Implications
7. Limitations and Future Directions
Author Contributions
Funding
Institutional Review Board Statement
Informed Consent Statement
Data Availability Statement
Conflicts of Interest
| 1 | The significance of the coefficient indicates the presence of asymmetric volatility transmission between markets i and j. |
| 2 | Results are globaly the same when we differentiate betwwen period 1 and period 2. These results are available upon request. |
| 3 | brvm: Bourse Régionale des ValeursMobilières represents the regional stock exchange of the member states of the West African Economic and Monetary Union (WAEMU), namely, Benin, Burkina Faso, Côte d’Ivoire, Guinea-Bissau, Mali, Niger, Senegal, and Togo. |
| 4 | The indirect links between African and commodity markets in terms of shocks and volatility are not reported in the paper due to the large number of estimated coefficients. |
References
- Aawaar, G., Logogye, L., & Domeher, D. (2023). Equity return volatility in Africa’s stock markets: A dynamic panel approach. Cogent Economics & Finance, 11(2), 2258704. [Google Scholar] [CrossRef]
- Aboluwodi, D., Nomlala, B., & Muzindutsi, P. F. (2022). The COVID-19 crisis and interaction between the JSE, real estate, energy, commodity and cryptocurrency markets. Journal of Economics and Financial Analysis, 6(1), 55–76. [Google Scholar]
- Agnolucci, P. (2009). Volatility in crude oil futures: A comparison of the predictive ability of GARCH and implied volatility models. Energy Economics, 31(2), 316–321. [Google Scholar] [CrossRef]
- Ahmed, A. D., & Huo, R. (2021). Volatility transmissions across international oil market, commodity futures and stock markets: Empirical evidence from China. Energy Economics, 93, 104741. [Google Scholar] [CrossRef]
- Anyikwa, I., & Le Roux, P. (2020). Integration of African stock markets with the developed stock markets: An analysis of co-movements, volatility and contagion. International Economic Journal, 34(2), 279–296. [Google Scholar] [CrossRef]
- Arouri, M., Lahiani, A., & Nguyen, D. K. (2011). Return and volatility transmission between world oil prices and stock markets of the GCC countries. Economic Modelling, 28(4), 1815–1825. [Google Scholar] [CrossRef]
- Baochen, Y., Yingjian, P., & Yunpeng, S. (2020). The financialization of Chinese commodity markets. Finance Research Letters, 34, 101438. [Google Scholar] [CrossRef]
- Basak, S., & Pavlova, A. (2016). A model of financialization of commodities. Journal of Finance, 71(4), 1511–1556. [Google Scholar] [CrossRef]
- Beirne, J., Caporale, G. M., Schulze, G. M., & Spagnolo, N. (2009). Volatility spillovers and contagion from mature to emerging stock markets [CESifo Working Paper Series No. 2545, DIW Berlin Discussion Paper No. 873]. European Central Bank. [Google Scholar] [CrossRef]
- Bollerslev, T. (1990). Modelling the coherence in the short-run nominal exchange rates: A multivariate generalized ARCH model. Review of Economics and Statistics, 72, 498–505. [Google Scholar] [CrossRef]
- Bollerslev, T., Engle, R. F., & Wooldridge, J. M. (1988). A Capital Asset Pricing Model with Time-Varying Covariances. The Journal of Political Economy, 96, 116–131. [Google Scholar] [CrossRef]
- Bunnag, T. (2015). Volatility transmission in oil futures markets and carbon emissions. Futures International Journal of Energy Economics and Policy, 5(3), 647–659. [Google Scholar]
- Canuto, O. (2023). Capital flows and emerging market economies since the global financial crisis. In Foreign Exchange Constraint and Developing Economies (pp. 208–222). Edward Elgar Publishing. [Google Scholar]
- Chang, C. L., McAleer, M., & Tansuchat, R. (2011). Conditional correlations and volatility spillovers between crude oil and stock index returns. The North American Journal of Economics and Finance, 25, 116–138. [Google Scholar] [CrossRef]
- Cheng, I. H., & Xiong, W. (2014). Financialization of commodity markets. Annual Review of Financial Economics, 6, 419–441. [Google Scholar] [CrossRef]
- Choi, K., & Hammoudeh, S. (2010). Volatility behavior of oil, industrial commodity and stock markets in a regime-switching environment. Energy Policy, 38, 4388–4399. [Google Scholar] [CrossRef]
- Creti, A., Joëts, M., & Mignon, V. (2013). On the links between stock and commodity markets’ volatility. Energy Economics, 37, 16–28. [Google Scholar] [CrossRef]
- Ederer, S., Heumesser, C., & Staritz, C. (2016). Financialization and commodity prices—An empirical analysis for coffee, cotton, wheat and oil. International Review of Applied Economics, 30(4), 462–487. [Google Scholar] [CrossRef]
- El Ghini, A., & Saidi, Y. (2017). Return and volatility spillovers in the Moroccan stock market during the financial crisis. Empirical Economics, 52, 1481–1504. [Google Scholar] [CrossRef]
- Endri, E., Aipama, W., Razak, A., Sari, L., & Septiano, R. (2021). Stock price volatility during the COVID-19 pandemic: The GARCH model. Investment Management and Financial Innovations, 18(4), 12–20. [Google Scholar] [CrossRef]
- Engle, R. (2002). Dynamic conditional correlation: A simple class of multivariate generalized autoregressive conditional heteroskedasticity models. Journal of Business and Economic Statistics, 20, 339–350. [Google Scholar] [CrossRef]
- Engle, R., & Kroner, K. F. (1995). Multivariate simultaneous generalized ARCH. Econometric Theory, 11(3), 122–150. [Google Scholar] [CrossRef]
- Ghorbel, A., & Boujelbene, Y. (2013). Contagion effect of the oil shock and US financial crisis on the GCC and BRIC countries. International Journal of Energy Sector Management, 7(4), 430–447. [Google Scholar] [CrossRef]
- Hammoudeh, S., Yuan, Y., & McAleer, M. (2009). Shock and volatility spillovers among equity sectors of the Gulf Arab stock markets. The Quarterly Reveview of Econonomics and Finance, 49(3), 829–842. [Google Scholar] [CrossRef]
- Hassan, S. A., & Malik, F. (2007). Multivariate GARCH modeling of sector volatility transmission. The Quarterly Review of Economics and Finance, 47(3), 470–480. [Google Scholar] [CrossRef]
- Hung, N. T., & Vo, X. V. (2021). Directional spillover effects and time-frequency nexus between oil, gold and stock markets: Evidence from pre and during COVID-19 outbreak. International Review of Financial Analysis, 76, 101730. [Google Scholar] [CrossRef]
- Jouini, J., & Harrathi, N. (2014). Revisiting the shock and volatility transmissions among GCC stock and oil markets: A further investigation. Economic Modelling, 38, 486–494. [Google Scholar] [CrossRef]
- Kroner, F. K., & Ng, V. K. (1998). Modeling asymmetric comovements of asset returns. The Review of Financial Studies, 11(4), 817–844. [Google Scholar] [CrossRef]
- Lajili, O. (2013). Volatility transmission among the oil market and the financial markets of oil-producing countries [MPRA Paper 86624]. University Library of Munich, Germany. [Google Scholar]
- Logogye, L., Aawaar, G., & Poku, K. (2024). Regional and global shock spillovers to Africa’s equity markets: Evidence from the global financial crisis and COVID-19 pandemic. SN Business & Economics, 4(12), 1–31. [Google Scholar]
- Majumder, M. K., Raghavan, M., & Vespignani, J. (2022). The impact of commodity price volatility on fiscal balance and the role of real interest rate. Empirical Economics, 63(3), 1375–1402. [Google Scholar] [CrossRef]
- Malik, F., & Ewing, B. T. (2009). Volatility transmission between oil prices and equity sector returns. International Review of Financial Analysis, 18(3), 95–100. [Google Scholar] [CrossRef]
- Mensi, W., Beljid, M., Boubaker, A., & Managi, S. (2013). Correlations and volatility spillovers across commodity and stock markets: Linking energies, Food, and Gold. Economic Modeling, 32, 15–22. [Google Scholar] [CrossRef]
- Özdemir, F. N., & Bilgiç, A. (2023). Determining the short and long term volatility spillovers between wheat, cotton and corn prices in Turkey using the asymmetric BEKK-GARCH-mean equation model. Scientific Papers Series Management, Economic Engineering in Agriculture & Rural Development, 23(1), 475–489. [Google Scholar]
- Salisu, A. A., & Oloko, T. F. (2015). Modelling spillovers between stock market and FX market: Evidence for Nigeria. Journal of African Business, 16(1–2), 84–108. [Google Scholar] [CrossRef]
- Spulbar, C., Trivedi, J., & Birau, R. (2020). Investigating abnormal volatility transmission patterns between emerging and developed stock markets: A case study. Journal of Business Economics and Management, 21(6), 1561–1592. [Google Scholar] [CrossRef]
- Suliman, Z. A., & Idris, E. A. (2013). Volatility spillovers between stock market returns and exchange rate: Empirical evidence from Saudi Arabia and Egypt. Arab Journal of Administrative Sciences, 20(2), 341–363. [Google Scholar]
- Takyi, P. O., & Bentum-Ennin, I. (2021). The impact of COVID-19 on stock market performance in Africa: A Bayesian structural time series approach. Journal of Economics and Business, 115, 105968. [Google Scholar] [CrossRef]
- Tiwari, A. K., Abakah, E. J. A., Karikari, N. K., & Hammoudeh, S. (2022). Time-varying dependence dynamics between international commodity prices and Australian industry stock returns: A Perspective for portfolio diversification. Energy Economics, 108, 105891. [Google Scholar] [CrossRef]
- Tsuji, C. (2018). Return transmission and asymmetric volatility spillovers between oil futures and oil equities: New DCC-MEGARCH Analyses. Economic Modelling, 74, 167–185. [Google Scholar] [CrossRef]
- Urom, H., Ndubuisi, G., Lo, G. D., & Yuni, D. (2023). Global commodity and equity markets spillovers to Africa during the COVID-19 pandemic. Emerging Markets Review, 55, 100948. [Google Scholar] [CrossRef]
- Yang, J., Ge, Y. E., & Li, K. X. (2022). Measuring volatility spillover effects in dry bulk shipping market. Transport Policy, 125, 37–47. [Google Scholar] [CrossRef]
- Youcef, C. A. (2019). How index investment impacts commodities: A story about the financialization of agricultural commodities. Economic Modelling, 80, 23–33. [Google Scholar] [CrossRef]
| roil | rcocoa | rgold | rnse | rbrvm | rgse | |
|---|---|---|---|---|---|---|
| roil | 1.000 | |||||
| rcocoa | 0.122 | 1.000 | ||||
| rgold | 0.042 | 0.082 | 1.000 | |||
| rnse | −0.078 | 0.024 | −0.009 | 1.000 | ||
| rbrvm | −0.061 | −0.028 | 0.018 | −0.006 | 1.000 | |
| rgse | −0.002 | 0.027 | −0.040 | 0.046 | −0.016 | 1.000 |
| roil (i = 1) | rcocoa (i = 2) | rgold (i = 3) | rnse (i = 4) | rbrvm (i = 5) | rgse (i = 6) | |
|---|---|---|---|---|---|---|
| 0.00041 * | 0.00025 | −0.00007 | −0.00017 | −0.00009 | 0.00007 | |
| ai1 | −0.072 * | 0.137 * | −0.283 *** | −0.172 ** | −0.144 * | −0.124 ** |
| ai2 | −0.028 *** | 0.147 *** | −0.137 *** | 0.068 ** | 0.007 | 0.008 |
| ai3 | −0.025 | 0.080 | −0.097 *** | 0.122 ** | −0.061 ** | −0.082 *** |
| ai4 | −0.042 *** | −0.106 *** | 0.069 *** | 0.325 *** | 0.029 | −0.029 * |
| ai5 | 0.028 | 0.031 | −0.079 *** | 0.238 *** | 0.221 *** | 0.060 *** |
| ai6 | −0.033 * | −0.125 *** | 0.103 *** | 0.082 * | −0.00005 | −0.075 ** |
| bi1 | 0.504 *** | −0.1333 ** | 0.124 *** | 0.304 *** | 0.348 *** | 0.123 *** |
| bi2 | −0.052 *** | 1.081 *** | −0.243 *** | −0.012 | 0.077 *** | 0.097 *** |
| bi3 | −0.026 | 0.818 *** | 0.693 *** | −0.225 *** | 0.122 ** | −0.005 |
| bi4 | 0.047 ** | −0.029 | −0.021 ** | 0.586 *** | 0.260 *** | 0.041 *** |
| bi5 | −0.197 *** | −0.130 *** | 0.037 ** | −0.556 *** | 0.518 *** | 0.048 ** |
| bi6 | 0.081 *** | 0.078 *** | 0.008 | −0.282 *** | −0.055 | 0.906 *** |
| di1 | −0.110 ** | 0.169 | −0.062 | 0.210 | −0.033 | 0.329 *** |
| di2 | 0.022 | −0.096 *** | −0.012 | −0.010 | −0.075 ** | 0.115 *** |
| di3 | 0.053 | −0.153 ** | −0.053 | 0.115 | 0.032 | 0.072 * |
| di4 | 0.023 | 0.194 *** | −0.019 | −0.169 ** | −0.346 *** | −0.015 |
| di5 | −0.392 *** | −0.209 *** | 0.139 *** | 0.148 * | 0.313 *** | −0.027 |
| di6 | −0.075 ** | −0.049 | 0.014 | 0.054 | −0.032 | 0.264 *** |
| JB | 46,212.40 *** | 194.485 *** | 869.456 *** | 791.616 *** | 991.136 *** | 22,210.47 *** |
| LB | 86.042 *** | 38.825 | 27.848 | 102.44 *** | 89.477 *** | 73.819 *** |
| LB2 | 46.848 | 39.257 | 22.951 | 19.702 | 40465 | 84.623 *** |
| ARCH | 1.179 | 0.129 | 0.436 | 0.048 | 0.013 | 0.163 |
| roil (i = 1) | rcocoa (i = 2) | rgold (i = 3) | rnse (i = 4) | rbrvm (i = 5) | rgse (i = 6) | |
|---|---|---|---|---|---|---|
| 0.00028 | 0.00045 | 0.00024 | 0.00076 *** | 0.00037 | 0.00074 | |
| ai1 | −0.077 ** | −0.073 | −0.107 *** | −0.288 *** | −0.082 | −0.014 |
| ai2 | 0.006 | −0.113 *** | −0.053 *** | −0.028 | −0.093 ** | −0.120 *** |
| ai3 | −0.054 | −0.459 *** | −0.47 | −0.259 * | −0.137 | 0.024 |
| ai4 | 0.009 | −0.034 | 0.012 | 0.122 *** | 0.059 | −0.005 |
| ai5 | −0.449 *** | −0.082 * | −0.038 * | 0.713 *** | −0.234 *** | −0.156 *** |
| ai6 | 0.023 | −0.066 | 0.088 *** | −0.034 | 0.017 | 0.0003 |
| bi1 | 0.906 *** | −0.296 *** | 0.158 *** | −0.316 *** | −0.119 * | −0.023 |
| bi2 | −0.044 *** | 0.787 *** | 0.039 *** | −0.294 *** | −0.023 | 0.031 * |
| bi3 | 0.010 | 0.274 *** | 0.648 *** | 0.303 *** | −0.099 | 0.112 *** |
| bi4 | 0.052 *** | −0.158 *** | −0.078 *** | 0.696 *** | 0.151 *** | 0.027 ** |
| bi5 | −0.095 *** | −0.236 *** | 0.134 *** | −0.341 *** | 0.190 *** | −0.002 |
| bi6 | 0.017 | 0.085 ** | −0.065 *** | −0.032 | 0.151 *** | 0.938 *** |
| di1 | −0.035 | 0.227 ** | 0.026 | 0.131 | −0.394 *** | 0.121 |
| di2 | 0.128 *** | −0.144* | 0.136 *** | 0.421 *** | −0.432 *** | 0.005 |
| di3 | 0.144 * | 0.376 ** | −0.169 *** | 0.910 *** | 0.513 *** | 0.172 *** |
| di4 | 0.097 *** | −0.013 ** | 0.053* | 0.121 | −0.468 *** | −0.038 |
| di5 | −0.053 | −0.111 | 0.064 | 0.125 | 0.006 | −0.065 |
| di6 | −0.038 | 0.979 | −0.137 *** | 0.171 * | 0.112 | 0.478 *** |
| JB | 2993.99 *** | 306.84 *** | 142.94 *** | 693.46 *** | 941.46 | 14,541.96 *** |
| LB | 31.005 | 29.550 | 40.369 | 71.371 *** | 36.883 | 37.941 |
| LB2 | 17.931 | 24.396 | 19.910 | 41.859 | 28.073 | 56.675 ** |
| ARCH | 0.286 | 0.000000001 | 0.075 | 2.594 | 0.188 | 0.081 |
| roil (i = 1) | rcocoa (i = 2) | rgold (i = 3) | rnse (i = 4) | rbrvm (i = 5) | rgse (i = 6) | |
|---|---|---|---|---|---|---|
| 0.00127 * | 0.00026 | 0.000006 | −0.00095 *** | −0.00041 | 0.00009 | |
| ai1 | −0.066 | −0.251 ** | 0.0309 | 0.025 | 0.152 * | 0.160 * |
| ai2 | −0.044 *** | 0.176 *** | −0.168 *** | 0.253 *** | −0.028 | 0.116 *** |
| ai3 | −0.019 | −0.282 *** | 0.151 *** | 0.200 *** | −0.084 | 0.238 *** |
| ai4 | −0.025 | −0.194 *** | 0.121 *** | 0.263 *** | 0.070 ** | 0.032 |
| ai5 | 0.103 *** | −0.110 ** | 0.012 | 0.045 | −0.306 *** | −0.006 |
| ai6 | −0.028 | −0.273 *** | 0.006 | 0.079 | −0.044 | −0.046 |
| bi1 | 0.929 *** | 0.299 *** | −0.153 ** | −0.007 | 0.706 *** | −0.063 |
| bi2 | 0.014 | 0.662 *** | −0.428 *** | −0.007 | −0.098 *** | 0.155 *** |
| bi3 | −0.033 | 0.743 *** | 0.071 | −0.079 | 0.432 *** | 0.156 *** |
| bi4 | −0.007 | 0.206 *** | 0.052 ** | 0.846 *** | 0.0049 | −0.077 *** |
| bi5 | 0.011 | −0.441 *** | −0.107 *** | 0.103 ** | 0.292 *** | −0.335 *** |
| bi6 | −0.102 *** | 0.176 *** | −0.297 *** | 0.016 | 1.024 *** | 0.605 *** |
| di1 | 0.035 | −0.514 *** | 0.094 | −0.170 | 0.241 ** | −0.061 |
| di2 | 0.005 | 0.041 | −0.175 *** | 0.169 ** | −0.065 | 0.386 *** |
| di3 | −0.033 | −0.066 | 0.032 | −0.079 | −0.068 | 0.315 *** |
| di4 | 0.077 *** | 0.116 * | 0.028 | −0.283 *** | −0.136 *** | −0.116 *** |
| di5 | −0.003 | −0.141 | 0.139 ** | −0.093 | 0.044 | −0.042 |
| di6 | −0.022 | −0.186 | 0.348 *** | −0.251** | −0.133 * | −0.062 |
| JB | 34,126.78 *** | 1.66 | 466.51 *** | 328.91 *** | 114.53 *** | 2015.64 *** |
| LB | 63.247 *** | 34.651 | 39.211 | 58.192 ** | 69.102 *** | 72.339 *** |
| LB2 | 30.598 | 55.897 ** | 18.766 | 22.500 | 22.282 | 13.394 |
| ARCH | 0.415 | 1.153 | 1.261 | 0.023 | 0.817 | 0.988 |
Disclaimer/Publisher’s Note: The statements, opinions and data contained in all publications are solely those of the individual author(s) and contributor(s) and not of MDPI and/or the editor(s). MDPI and/or the editor(s) disclaim responsibility for any injury to people or property resulting from any ideas, methods, instructions or products referred to in the content. |
© 2025 by the authors. Licensee MDPI, Basel, Switzerland. This article is an open access article distributed under the terms and conditions of the Creative Commons Attribution (CC BY) license (https://creativecommons.org/licenses/by/4.0/).
Share and Cite
Ben Flah, I.; Samet, K.; El Ammari, A.; Terzi, C. Shock and Volatility Transmissions Across Global Commodity and Stock Markets Spillovers: Empirical Evidence from Africa. J. Risk Financial Manag. 2025, 18, 332. https://doi.org/10.3390/jrfm18060332
Ben Flah I, Samet K, El Ammari A, Terzi C. Shock and Volatility Transmissions Across Global Commodity and Stock Markets Spillovers: Empirical Evidence from Africa. Journal of Risk and Financial Management. 2025; 18(6):332. https://doi.org/10.3390/jrfm18060332
Chicago/Turabian StyleBen Flah, Ichraf, Kaies Samet, Anis El Ammari, and Chokri Terzi. 2025. "Shock and Volatility Transmissions Across Global Commodity and Stock Markets Spillovers: Empirical Evidence from Africa" Journal of Risk and Financial Management 18, no. 6: 332. https://doi.org/10.3390/jrfm18060332
APA StyleBen Flah, I., Samet, K., El Ammari, A., & Terzi, C. (2025). Shock and Volatility Transmissions Across Global Commodity and Stock Markets Spillovers: Empirical Evidence from Africa. Journal of Risk and Financial Management, 18(6), 332. https://doi.org/10.3390/jrfm18060332