Systematic Review

Sustainability Balanced Scorecard: Systematic Literature Review

CEOS.PP, ISCAP, Polytechnic of Porto, 4465-004 Matosinhos, Portugal
*
Author to whom correspondence should be addressed.
J. Risk Financial Manag. 2025, 18(6), 324; https://doi.org/10.3390/jrfm18060324
Submission received: 21 March 2025 / Revised: 2 May 2025 / Accepted: 16 May 2025 / Published: 12 June 2025
(This article belongs to the Special Issue Innovations and Challenges in Management Accounting)

Abstract

:
Sustainability has become one of the main drivers of organizational performance. This study investigates the integration of sustainability with the balanced scorecard (BSC) as a framework for translating environmental management strategy into organizational performance. This review also seeks to map sustainability balanced scorecard (SBSC) research, clarifying its current role and identifying gaps and opportunities for future research. To achieve this, we sourced and reviewed 247 publications from the Web of Science index, corresponding to 129 scientific journals and 57 conference proceedings. Our analysis included content analysis and bibliometric analysis performed using the R packages Bibliometrix (version: 4.3.5), Biblioshiny, and CiteSpace (6.3.R1 Basic). The findings revealed that the SBSC enhances organizational capacity to align sustainability with strategic objectives, although significant implementation barriers remain, such as the selection of appropriate sustainability indicators and organizational resistance. This study contributes to advancing the theoretical and practical understanding of the SBSC while offering pathways for future research and application across sectors.

1. Introduction

The balanced scorecard (BSC) is a frequently utilized management framework that aids businesses in implementing and monitoring their strategies (Kumar et al., 2024). This tool has been widely explored and adopted across various sectors. With the rising importance of environmental, social, and governance (ESG) and ethical concerns and the need for performance measures related to these areas, there is a growing focus on systems for measuring and managing corporate sustainability performance (Barbosa et al., 2020b; Benn et al., 2014; Epstein & Buhovac, 2014; Hart & Milstein, 2003). Sustainability performance management integrates social, environmental, and economic aspects with business strategy. The BSC and its variant, the green balanced scorecard, offer robust structures for integrating sustainability into business operations, enabling companies to track their environmental initiatives, manage energy consumption, and assess progress in minimizing their ecological impact (Hansen & Schaltegger, 2016). When the BSC is explicitly adjusted to address environmental, social, or ethical dimensions, it is commonly called a sustainability balanced scorecard (SBSC).
The SBSC integrates sustainability accounting and reporting with strategic management, enhancing comprehensive performance evaluation. Research indicates that incorporating environmental data into BSC frameworks improves environmental stewardship and decision-making efficiency. For instance, studies have shown that participants using an SBSC make better investment decisions by considering both financial and non-financial data, including environmental metrics (Chalmeta & Palomero, 2011; Sands et al., 2016).
Furthermore, integrating corporate social responsibility (CSR) with management control systems via the SBSC can convert socially responsible initiatives into enhanced corporate performance. This integration helps align CSR activities with strategic goals, ultimately improving overall corporate outcomes (Chalmeta & Palomero, 2011). The SBSC also supports linking innovation processes to human capital and internal processes to financial and customer outcomes, fostering sustainable growth and competitive advantage. These linkages help organizations innovate and maintain competitiveness while adhering to sustainability principles (Sands et al., 2016).
Since its introduction in 1992, the BSC concept has evolved, with the SBSC now being a widely used framework. So, it is now an ideal time to review advancements in SBSCs and explore future research directions, particularly concerning the architecture of SBSCs and their ability to link performance indicators, strategic objectives, and the interrelationships between these elements (De Geuser et al., 2009; Dias-Sardinha et al., 2007). The increasing global concern for environmental and social issues has prompted organizations to integrate sustainability into their strategic management practices. The BSC, a renowned performance management framework, has evolved into the SBSC to address these growing concerns. However, there is a need for a comprehensive understanding of the current state of SBSC research and its future directions.
Given the growing interest in integrating sustainability into strategic performance tools, this study encompasses a systematic literature review (SLR) to evaluate the development and application of the SBSC. To orient this research, the study is centered on the following research questions:
  • What are the main research tendencies and thematic developments in the scientific literature on the SBSC from 2000 to 2024?
  • How has the integration of sustainability dimensions into balanced scorecard structures been conceptualized and implemented in different organizational contexts?
These questions formed the basis of the literature review, with the aim of providing both a historical mapping and a conceptual synthesis of the role of the SBSC in sustainable strategic management. By examining the existing literature, we aimed to identify gaps in the research and contribute to the development of more effective and sustainable management practices.
To perform an SLR effectively, researchers must adhere to transparent and precise methodological procedures. The rigorous nature of SLRs requires clear documentation at every stage, from formulating the research question to selecting studies, data extraction, and synthesis. This transparency ensures the review’s reproducibility and credibility, allowing other researchers to understand and potentially replicate the study (Aromataris & Munn, 2020; Moher et al., 2009).
The remainder of the paper is structured as follows: Section 2 provides a concise overview of the transition from the traditional BSC to the SBSC. Section 3 details the methodology employed for the systematic literature review. Section 4 presents and discusses the findings of the review. Finally, Section 5 concludes the paper by summarizing the key insights, identifying limitations, and suggesting future research directions.

2. From BSC to Sustainability BSC

The balanced scorecard was initially conceived as a comprehensive performance measurement system that integrates financial and non-financial indicators to monitor organizational performance across multiple dimensions (Kaplan & Norton, 1992). Kaplan and Norton (1992) describe the BSC as akin to a cockpit array of instruments, emphasizing that relying solely on financial metrics is inadequate. Managers must assess various aspects of performance to ensure a holistic view of the organization’s health and strategic alignment. The BSC framework organizes objectives and corresponding metrics into four key perspectives: learning and growth, internal business processes, customer, and financial (Kaplan & Norton, 1996a, 1996b). This structure encourages a bottom-up approach, where enhancing learning and innovation improves internal processes, leading to higher customer satisfaction and, consequently, improved financial outcomes (Epstein & Manzoni, 1997). The framework underscores the principle that “what gets measured gets managed” but also posits that measurement should serve as a means to achieve strategic objectives rather than an end in itself.
Numerous scholars have provided further elaborations on the utility of the BSC. For instance, Niven (2002) argued that the BSC helps organizations track performance and align day-to-day work with a long-term strategy, fostering strategic feedback and learning. Similarly, Malina and Selto (2001) emphasized the BSC’s role in facilitating communication and performance alignment across various levels of an organization. They highlighted how the BSC can be used to clarify and translate vision and strategy into specific objectives and measures.
The implementation of the BSC revolves around strategic performance management, leveraging key performance indicators (KPIs) and strategic maps to delineate the causal relationships between various objectives. This alignment ensures that an organization’s mission, values, and vision are operationalized through well-defined strategic objectives, as discussed by (Kaplan & Norton, 1996a, 1996b, 2001). Neely et al. (2002) further explored the BSC’s adaptability across different industries and its role in integrating performance measurement with management processes, highlighting its versatility and practical utility.
Nevertheless, the BSC’s four perspectives are not rigid; (Kaplan & Norton, 1996a, 1996b) acknowledge the possibility of adding more perspectives to cater to specific organizational needs. For example, perspectives focusing on corporate social responsibility and sustainability were integrated into the BSC framework by Figge et al. (2002) to address environmental and social performance metrics, broadening the scope beyond traditional financial and operational measures.
The motivation for integrating sustainability into the BSC stems from increasing stakeholder pressure, stricter environmental and social regulations, and the need to improve corporate reputation (Länsiluoto & Järvenpää, 2008; Rasolofo-Distler, 2022). Figge et al. (2002) proposed adding a fifth perspective to the traditional BSC: the environmental and social perspective. According to Bieker et al. (2002) and Figge et al. (2002), integrating sustainability indicators helps companies align their strategies with long-term objectives, reduce risks, and identify opportunities for sustainable innovation. This perspective considers indicators such as carbon emissions, natural resource consumption, and social impacts, allowing for a holistic view of corporate performance. This scorecard distinguishes environmental and social aspects once these dimensions prove their strategic importance and role in cause-and-effect relationships (Mio et al., 2022). Other approaches, such as those proposed by Hansen and Schaltegger (2016), suggest incorporating sustainability goals into the existing four perspectives of the BSC, creating an alignment between financial and non-financial goals. Adams and Frost (2008) and Hristov et al. (2019) explored modifying the existing BSC perspectives to incorporate sustainability indicators. For example, the internal processes perspective includes energy efficiency and waste management metrics (Stavropoulou et al., 2023). From the learning and growth perspective, indicators related to sustainability training and organizational culture focused on social responsibility are added.
The literature indicates that integrating sustainability into the BSC results in various benefits. According to Epstein and Wisner (2001), companies that adopt the sustainability BSC report improvements in operational efficiency, innovation, and stakeholder engagement. Additionally, sustainability metrics help identify areas of waste and inefficiency, promoting cost reduction and increased competitiveness (Hansen & Schaltegger, 2016).
Despite the benefits (Bieker et al., 2002; Hansen & Schaltegger, 2016), implementing a sustainability BSC faces significant challenges. These include difficulties in defining relevant and measurable sustainability indicators, resistance to change within the organization, and the need for training and capacity development (Hristov et al., 2019). Moreover, Adams and Frost (2008) also highlight the complexity of integrating sustainability data with existing management systems.
The problem escalates when we talk about small businesses that face significant difficulties in integrating sustainability into their operations (Barbosa et al., 2020b). Existing sustainability practices within small businesses are often characterized by informality and a lack of strategic planning. These practices rarely align with the core business model, organizational structure, or available resources. Instead, sustainability efforts tend to be isolated and ad hoc. This limited approach often reflects a narrow focus on economic benefits, neglecting potential social and environmental impacts (Depken & Zeman, 2018). In addition, small business face other key challenges such as financial constraints, limited human resources, technological shortcomings, structural obstacles, and insufficient knowledge of sustainable management tools (Shields & Shelleman, 2015). To overcome these limitations, Klewitz and Hansen (2014) and Shields and Shelleman (2015) underscore the importance of developing practical tools and processes. These resources are essential for helping small businesses move beyond sustainability rhetoric and implement tangible, actionable strategies. Achieving this requires a fundamental shift that begins with aligning a company’s values, mission, and core objectives with sustainability principles.
More recently, digital transformation has reshaped organizational frameworks through the adoption of technologies that streamline operations, enhance customer experiences, and support sustainable practices. This shift from analog to digital processes enables businesses to leverage data analytics to identify inefficiencies, apply artificial intelligence to optimize resource usage, and use cloud computing to reduce physical infrastructure needs (Stalmachova et al., 2022). Together, these technologies help minimize waste, lower energy consumption, and monitor carbon emissions, thereby making a measurable contribution to sustainability goals (Stalmachova et al., 2022). The connection between digital transformation and sustainability becomes particularly evident when digital tools are used to manage resources more effectively, aligning with SBSC frameworks to support corporate sustainability objectives (Vărzaru, 2022).
To gain a comprehensive understanding of the current state of research on SBSCs, we conducted a systematic literature review (SLR). This rigorous methodology involved a comprehensive search of the Web of Science (WoS) database, followed by a systematic screening and selection process. To further analyze the research landscape, we employed bibliometric techniques using the R packages Bibliometrix and Biblioshiny (Aria & Cuccurullo, 2017). This analysis helped us identify key trends, influential authors, and significant research gaps in the field of SBSCs.

3. Materials and Methods

A systematic literature review is a structured research methodology that has become an indispensable tool for synthesizing and critically evaluating existing research. Originally developed for medical sciences, it is driven by the need to compile and synthesize findings from multiple clinical studies, thereby enhancing the practice of evidence-based medicine (Silva & Silva, 2019). This approach allows for a comprehensive aggregation of research outcomes, facilitating informed clinical decisions by distilling vast amounts of data into actionable insights. Subsequently, SLRs have been increasingly adopted in social sciences, including the field of sustainability management. By systematically identifying, appraising, and synthesizing relevant studies, SLRs provide a rigorous and transparent approach to knowledge accumulation.
As the digitization of scientific publications advanced and the use of quality and impact metrics became prevalent across various scientific fields, the methodology of SLR was adopted beyond medical research, notably in the social sciences. In these disciplines, the SLR offers a means to manage the increasing volume of research outputs, ensuring that reviews are thorough, reproducible, and unbiased. However, applying SLRs in the social sciences presents distinct challenges that require methodological adaptations. Researchers can access practical guidelines such as the Cochrane Handbook and the Preferred Reporting Items for Systematic Reviews and Meta-Analyses (PRISMA) framework (Higgins et al., 2020; Page et al., 2021). These resources provide detailed instructions on how to conduct and report SLRs, ensuring consistency and comprehensiveness. However, these guidelines were also primarily developed with the medical sciences in mind and thus often require significant adjustments when applied to the social sciences.
One significant challenge in the social sciences is the heterogeneity of study designs, methodologies, and contexts. Unlike clinical trials, which often follow standardized protocols, social science research encompasses various methodologies, from qualitative interviews to large-scale surveys. This diversity complicates the statistical integration of results, particularly in conducting meta-analyses, which rely on the quantitative synthesis of findings. The differences in research design, outcome measures, and contextual variables mean that combining results into a single meta-analytic framework can be problematic. Issues such as publication bias, varying data quality, and the subjective interpretation of qualitative data further complicate this process.
Despite these challenges, applying SLRs in the social sciences remains invaluable for integrating knowledge on specific topics. By systematically reviewing and synthesizing the existing literature, researchers can identify prevailing theories, methodologies, and findings, providing a comprehensive overview of a field. This process highlights what is known and uncovers areas where further research is needed, thus guiding future studies and policymaking. In this context, our study employs a systematic literature review to explore the evolution and application of sustainability balanced scorecards (SBSCs). By examining the existing literature, we aim to identify key research trends, identify gaps in the literature, and propose future research directions. This review will contribute to a better understanding of the factors influencing the successful implementation of SBSCs and their impact on organizational performance. In this context, our study employs an SLR methodology to answer two guiding research questions:
  • What are the main research tendencies and thematic developments in the scientific literature on the SBSC from 2000 to 2024?
  • How has the integration of sustainability dimensions into balanced scorecard structures been conceptualized and implemented in different organizational contexts?
Following the PRISMA 2020 guidelines (Page et al., 2021), this study followed a four-phase systematic review protocol: identification, screening, eligibility, and inclusion. The literature search was conducted on WoS. The use of WoS is justified by its international recognition by peers (De Crossan & Apaydin, 2010; Zhu & Liu, 2020), its relevancy and pertinency due to its demand, and its provision of all bibliographic information on authors, their citations, journals, countries, and research areas. An initial exploratory search was conducted using Google Scholar to refine the search terms. Various combinations were tested, and the results were analyzed to identify the combinations that yielded the most relevant articles focused on sustainability in the balanced scorecard. The researchers independently conducted these exploratory searches and collectively concluded that the best search terms were “BSC or Balanced Scorecard” and “Sustainability” when used in the abstract (Table 1).
A study was considered to address SBSCs if it explicitly used the term “Sustainability Balanced Scorecard” or presented a modified BSC framework incorporating environmental, social, and governance indicators aligned with strategic performance goals. The final data collection was carried out on November 04, 2024. Any publications not available in this database were also excluded.
Figure 1 presents the PRISMA flow diagram, which summarizes the stages of document selection and the final sample retained for analysis.
After extracting the initial results list, the researchers selected the articles based on their titles. This first selection excluded 34 articles; most of them were from the engineering, environmental, and education fields. Since “BSC” was one of the terms used for searching articles in WoS database, the initial results list contained articles with other expressions with the same abbreviation, namely “biomass supply chain” (BSC), “biofuel supply chain” (BSC), “biological soil crusts” (BSC), “blockchain-enabled smart contracts” (BSC), and “Bachelor of Science” (BSc).
Subsequently, the abstracts were read independently by both researchers. The dominant criterion was the article focus: addressing the sustainability dimension using a BSC. This phase resulted in the exclusion of 13 articles. Applying this criterion resulted in different outcomes between the researchers regarding the classification of four articles. From the integral reading of these four articles, two more articles were excluded. One was about integrating sustainability issues into the academic curricula of Business Sciences degrees, and the other addressed performance measure models in general. The final database search resulted in 49 articles excluded and 247 articles included for the final analysis.
Following authors such as Donthu et al. (2021) and Gora et al. (2024), the analysis was carried out using the Bibliometrix (Aria & Cuccurullo, 2017) and Biblioshiny R packages, as these are two of the most widely used tools for bibliometric analysis and are capable of producing high-quality visual representations. In addition, CiteSpace (Chen, 2006) software was also used.

4. Results Presentation and Discussion

4.1. Descriptive Analysis

After the selection process, a brief analysis allowed us to make some general observations. Table 2 provides a comprehensive overview of the publications from 2000 to November 2024, including key metrics such as citation rates, publication-to-citation time, and author productivity. Additionally, the table highlights the extent of collaboration within the field. The publications included 183 articles, 49 proceeding papers, 10 review articles, and 5 early access articles, authored by 747 researchers. These publications were associated with 160 scientific journals and conference proceedings.
Only six journals had four or more publications on the topic (Sustainability; Journal of Cleaner Production; International Journal of Productivity and Performance Management; Journal of Business Ethics; and Sustainability Accounting, Management and Policy Journal). However, these six journals were responsible for twenty eight percent of our dataset. It is interesting to note that none of the most influent journals were from the accounting field. A significant portion of the research (83%) was collaborative, involving an average of 3.27 co-authors per paper. The average number of citations per paper was 21.91, suggesting a substantial impact of research in this area, and 24.29% of the collaborations were international, highlighting the global nature of this field.
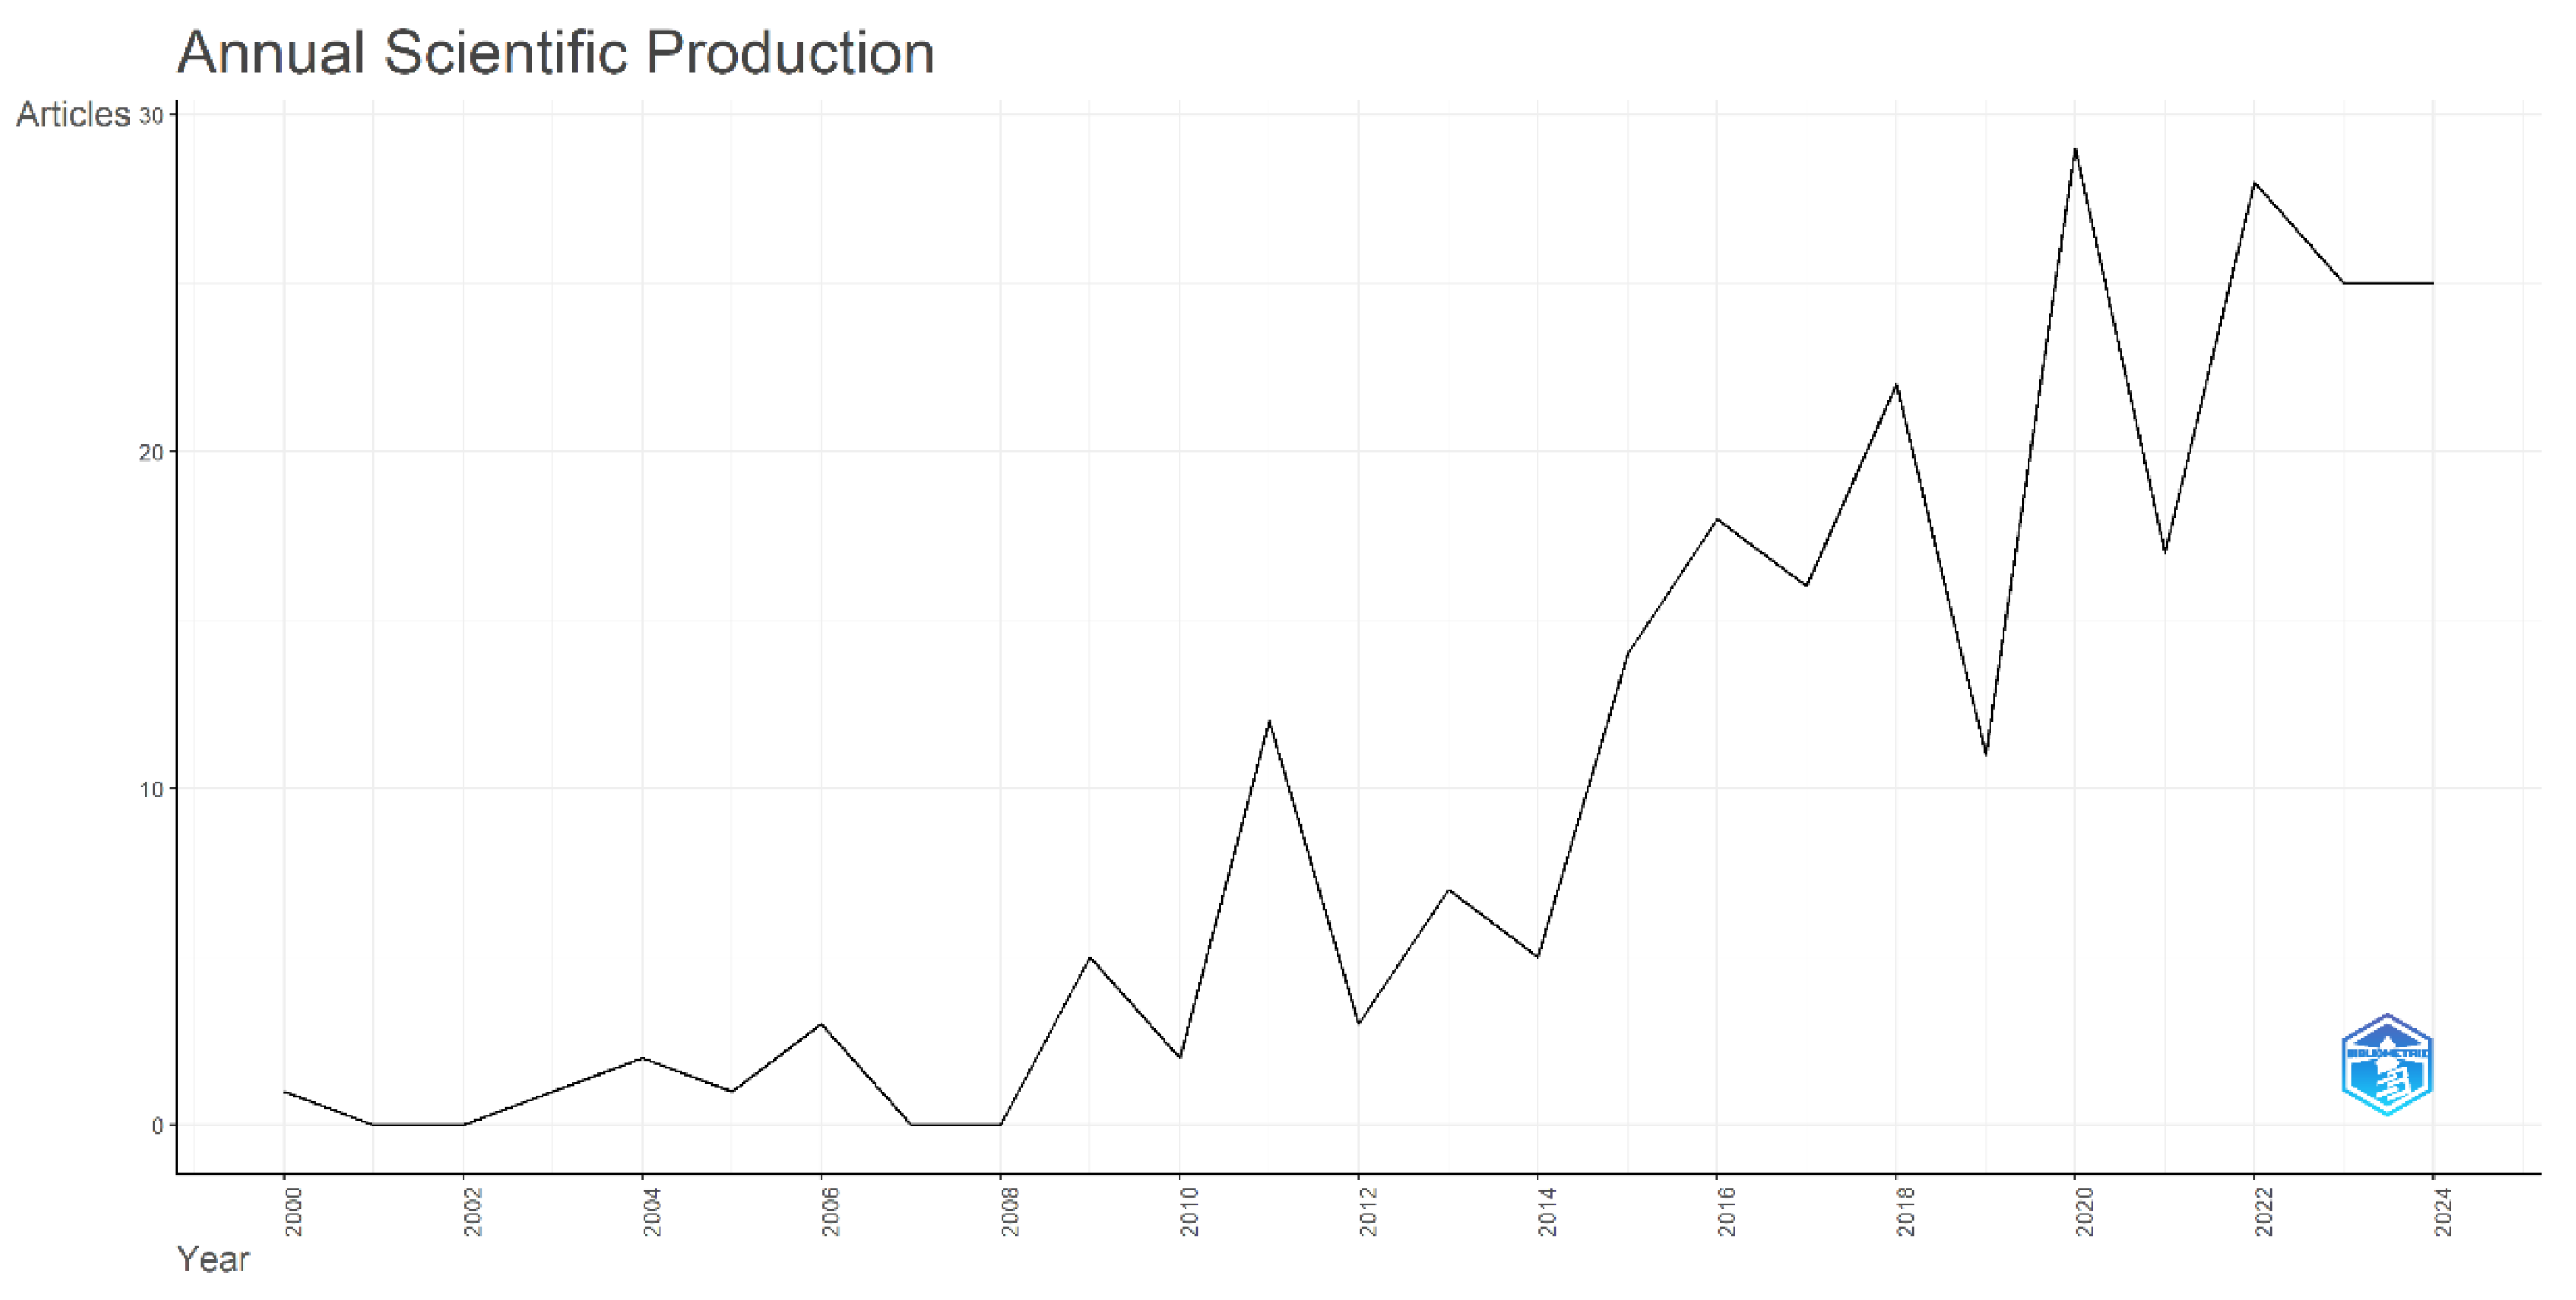
From 2000 to 2010, only 15 documents were published. The first paper identified was published in 2000 in conference proceedings. During this early period, applications of the SBSC were largely conceptual, with few empirical cases. In 2011, the number of publications reached 12, demonstrating a growing interest in the topic. From 2018 onwards, a significant shift was observed: the most fruitful recent years were 2018, 2020, 2022, 2023, and 2024, with annual publications ranging between 22 and 29 (Figure 2). The annual percentage growth rate was 14.35, reflecting the rising integration of SBSCs into organizational practice. In 2020, applications expanded into healthcare, with case studies from hospitals in Iran (Asadi Louye et al., 2026), highlighting the role of SBSCs in managing sustainability and patient care simultaneously. The years 2022 and 2023 saw further diversification, including the use of SBSCs in SMEs in Brazil’s manufacturing sector (Barbosa et al., 2020b), and in logistics and supply chain management in China (Zhang et al., 2023), often combined with digitalization tools such as IoT and big data analytics. These recent trends illustrate not only the quantitative growth of the field but also a qualitative shift toward sector-specific applications and digital integration.

4.2. Performance Analysis

Table 3 presents the top 20 most successful authors in the field of SBSC, ranked by various metrics, including the h-index, g-index, m-index, and total citations.
Hubbard, G. (Hubbard, 2009) stands out as the most influential author, with over 438 citations for only one publication in 2009, “Measuring organizational performance: beyond the triple bottom line”, published in Business Strategy and the Environment. Yet among the top twenty, there are nineteen other authors with more than one hundred citations. Schaltegger, S. follows closely with 336 citations, and Di Vaio, A. and Varriale, L. present 216 citations each. While Hubbard, G. has a higher citation count, it is important to consider the h-index, which measures both productivity and impact. Schaltegger, S. (Möller & Schaltegger, 2005), with “The sustainability balanced scorecard as a framework for eco-efficiency analysis” published in the Journal of Industrial Ecology, demonstrated a strong h-index, indicating substantial contributions to the field. For emerging researchers, the m-index is a more suitable metric. Di Vaio, A. and Varriale, L. exhibit promising m-indices, signifying their potential for future impact. The majority of top-contributing authors began their research careers after 2013/2014, highlighting the recent growth and increasing interest in SBSC research.
Table 4 presents the most influential articles based on global citations. This metric reflects the total number of times an article has been cited across various databases, and the number of citations received from highly cited papers serves as a measure of an article’s impact. The paper titled “Measuring Organizational Performance: Beyond the Triple Bottom Line” by Hubbard (2009) is the most influential article, with a total of 438 citations, averaging 27.38 citations per year. This paper has become a central reference pillar in BSC research, addressing the challenge of measuring sustainable organizational performance. It proposes a simplified, stakeholder-based SBSC framework, along with an organizational sustainability performance index. This index aims to integrate various sustainability measures into a single, easily understandable metric, making it more accessible to stakeholders.
Hsu et al. (2011) and Costa and Menichini (2013) follow with 140 and 133 citations per year, respectively. Hsu et al. (2011), with “Using the FDM and ANP to construct a sustainability balanced scorecard for the semiconductor industry”, adapt the traditional BSC by replacing the financial and customer perspectives with sustainability and stakeholder perspectives. Their proposed framework aims to enhance the sustainable competitiveness of Taiwanese semiconductor companies. “A multidimensional approach for CSR assessment: The importance of the stakeholder perception” by and Costa and Menichini (2013) investigates the impact of CSR on stakeholder perception and business performance. By combining Global Reporting Initiative (GRI) indicators and the BSC framework, the authors develop a multi-criterion model to assess CSR performance. The model considers both financial and non-financial dimensions, allowing for a comprehensive evaluation of a company’s social behavior from various stakeholder perspectives. The study highlights the importance of effective communication and transparency in CSR initiatives to positively influence stakeholder perceptions and ultimately enhance business outcomes.
Along with Hubbard (2009), Mio et al. (2022) have one of the highest average citation counts per year at 24.67. The authors investigate the factors that influence SBSC adoption, implementation approaches, and their impact on sustainability control and management, aiming to contribute to the understanding of SBSCs and identify potential future research directions.
However, the most productive author is Schaltegger, S. with five articles since 2005: “The Sustainability Balanced Scorecard as a Framework for Eco-Efficiency Analysis” (Möller & Schaltegger, 2005), “Managing Sustainability Performance Measurement and Reporting in an Integrated Manner—Sustainability Accounting as the Link Between the Sustainability Balanced Scorecard and Sustainability Reporting” (Schaltegger et al., 2006), “Management Roles and Sustainability Information. Exploring Corporate Practice” (Schaltegger et al., 2015), “The Sustainability Balanced Scorecard: A Systematic Review of Architectures” (Hansen & Schaltegger, 2016), and “Sustainability Balanced Scorecards and their Architectures: Irrelevant or Misunderstood?” (Hansen & Schaltegger, 2018) (Table 5).
In Table 5, we present the twenty most productive authors, aiming to highlight the authors’ contributions both in terms of the total number of articles published and their fractional authorship. Fractional authorship quantifies an individual author’s contribution to a set of papers, considering factors like co-authorship (Aria & Cuccurullo, 2017). Our analysis revealed that Schaltegger, S. also demonstrated the higher level of individual contribution, with a fractional authorship score of 2.2, indicating his involvement in multiple papers.
Figure 3 visualizes the authors’ productivity and impact over time. The line chart represents the publication timeline of each author, with Schaltegger, S. showing the longest active period from 2005 to 2018. The size of the bubbles indicates the number of documents published in a given year, and the color intensity of the bubbles reflects the total citations received per year, with 2018 being the most productive by author and number of citations: Di Vaio, A. and Varriale, L. with two articles (“Key performance indicators for developing environmentally sustainable and energy efficient ports: evidence from Italy” (Di Vaio et al., 2018) and “Management innovation for environmental sustainability in seaports: managerial accounting instruments and training for competitive green ports beyond the regulations”) (Di Vaio & Varriale, 2018) and 25.9 citations per year (Aria & Cuccurullo, 2017).
These authors are followed by Barbosa et al. (2020a, 2020b) with two articles (“Sustainable strategic management (GES): sustainability in small business” and “Sustainable management, balanced scorecard and small business: a systematic review and state of the art”) and 11.4 citations per year and by Alvarez-Perez, C. in 2017 with two articles (“Integration of balanced scorecard (BSC), strategy map, and fuzzy analytic hierarchy process (FAHP) for a sustainability business framework: a case study of a Spanish software factory in the financial sector” and “Integrating analytic hierarchy process (AHP) and balanced scorecard (BSC) framework for sustainable business in a software factory in the financial sector”) and 2.12 citations per year (Álvarez Pérez et al., 2017a, 2017b).
Authors such as Dincer, H.; Yuksel, S.; Kant, R.; Ali, S.M.; and Cheikhrouhou, N. started publishing in this area more recently and had several new publications in 2024.
Regarding the author’s affiliations, in Table 6, the Univ. Naples Parthenope—Italy presents the higher number of articles, followed by Istanbul Medipol Univ.—Turkey and Univ. Malaya—Kuala Lumpur, Malaysia. It is interesting to note that these authors come from universities in diverse countries with different levels of development, and it is clear that the concern for sustainability and sustainability reporting is universal.
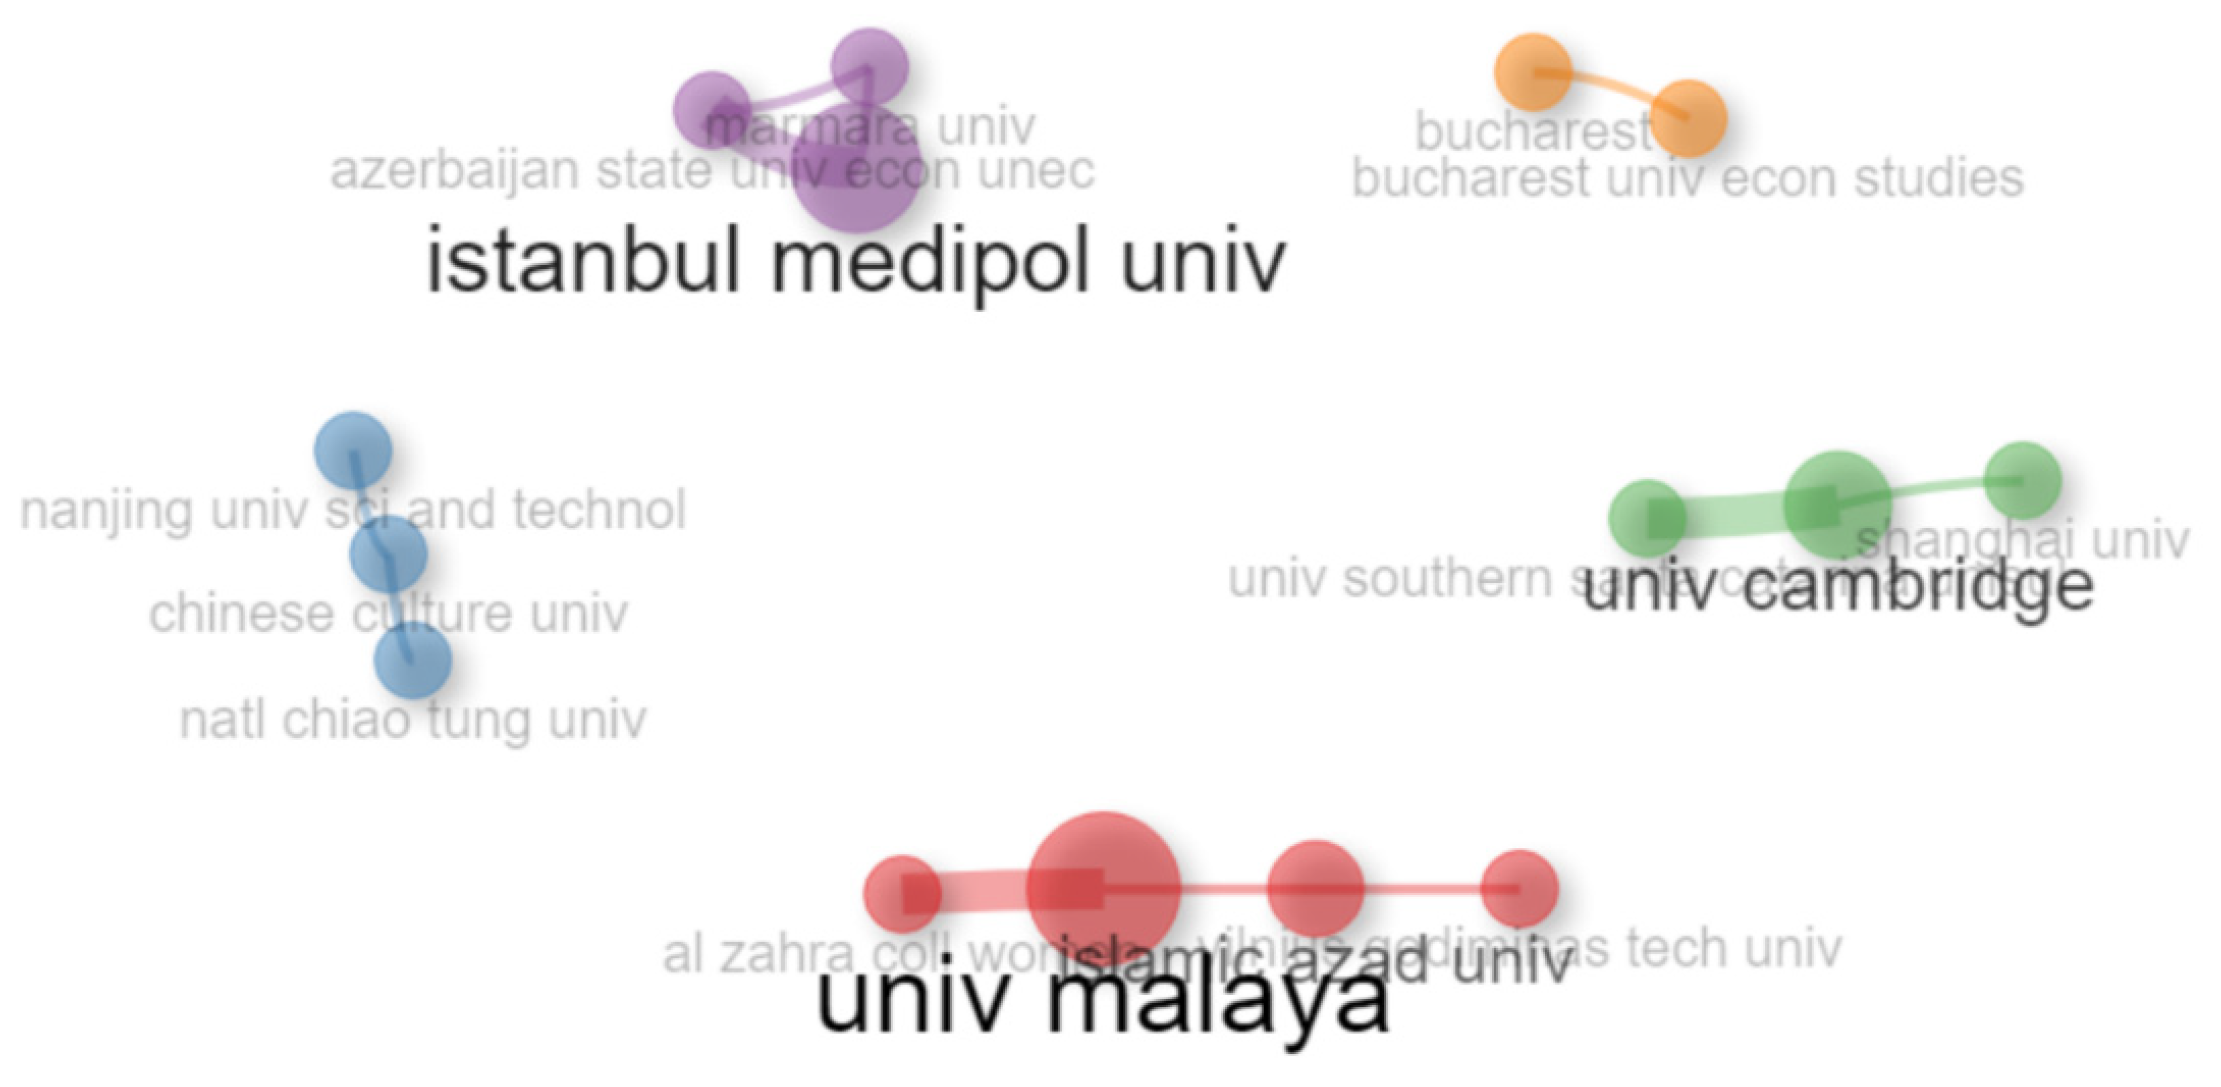
To gain insights into the collaborative landscape of research in this field, we also analyzed the network of institutional collaborations. By mapping the connections between institutions, we can identify key players and collaboration patterns. This analysis helps us understand how knowledge and resources are shared and how research communities evolve over time. Figure 4 illustrates the network of institutional collaborations, highlighting the most influential institutions and their interconnections.
Figure 4 visually represents the clustering of research institutions, and the size of each node corresponds to the institution’s research output, with larger nodes indicating higher productivity.
The connections between nodes signify cross-citations between researchers from different institutions, reflecting the extent of international collaboration. Table 7 presents the institutions with the highest centrality index, highlighting their significant influence within the research network.
The analysis of institutional connections reveals that Asian institutions hold a prominent position in the global research network on SBSC, as indicated by their high centrality index. Additionally, some European institutions play significant roles in international collaborations, highlighting the importance of global scientific cooperation in addressing sustainability reporting.
To understand the current state of research on SBSCs and their future trajectory, it is also crucial to identify the main journals in this field. Our total of 247 articles analyzed were published in 53 journals and conference proceedings. Table 8 shows the main journals based on the number of publications. Sustainability ranks first, with 34 articles, followed by Journal of Cleaner Production with 17 articles. These two journals together published approximately 21% of the total number of articles analyzed in this study.
Only three journals reached five publications on the topic: the International Journal of Productivity and Performance Management; Journal of Business Ethics; and Sustainability Accounting, Management and Policy Journal. Collectively, the top ten journals accounted for a 32% of the total number of articles from our dataset. It is interesting to note that none of the most influent journals were specific to the accounting field.
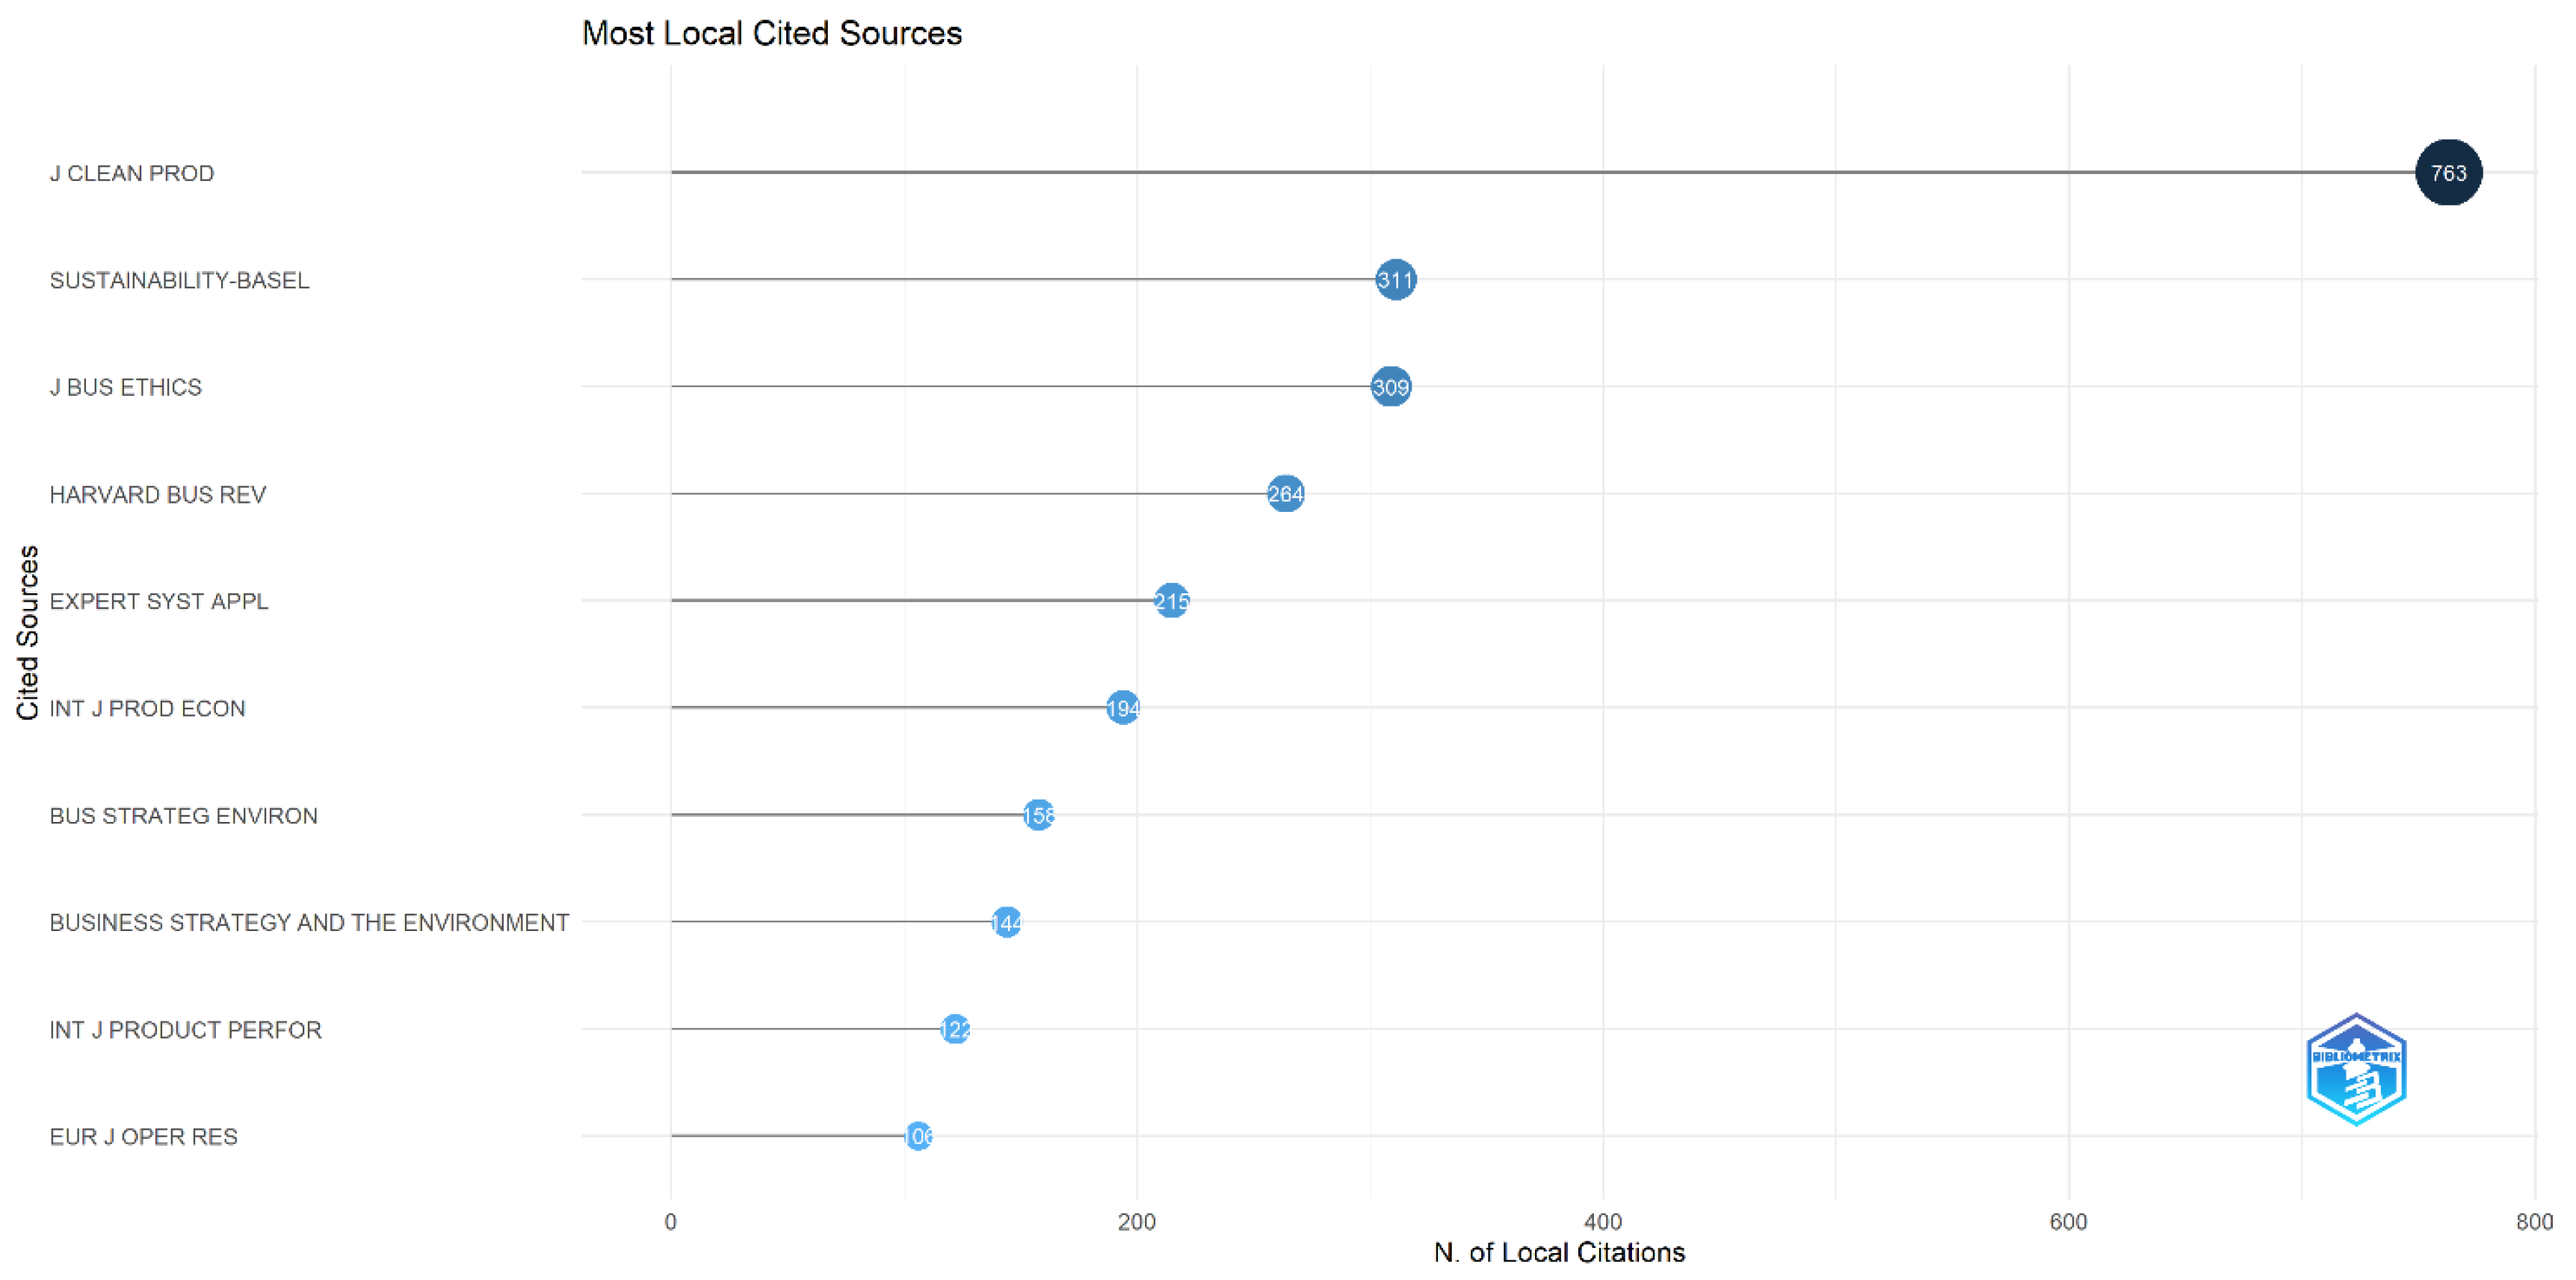
Regarding the most cited sources in the WoS database, we find the Journal of Cleaner Production, with 763 citations for 17 articles. Next, we find Sustainability with 311 citations and the Journal of Business Ethics with 309 citations (
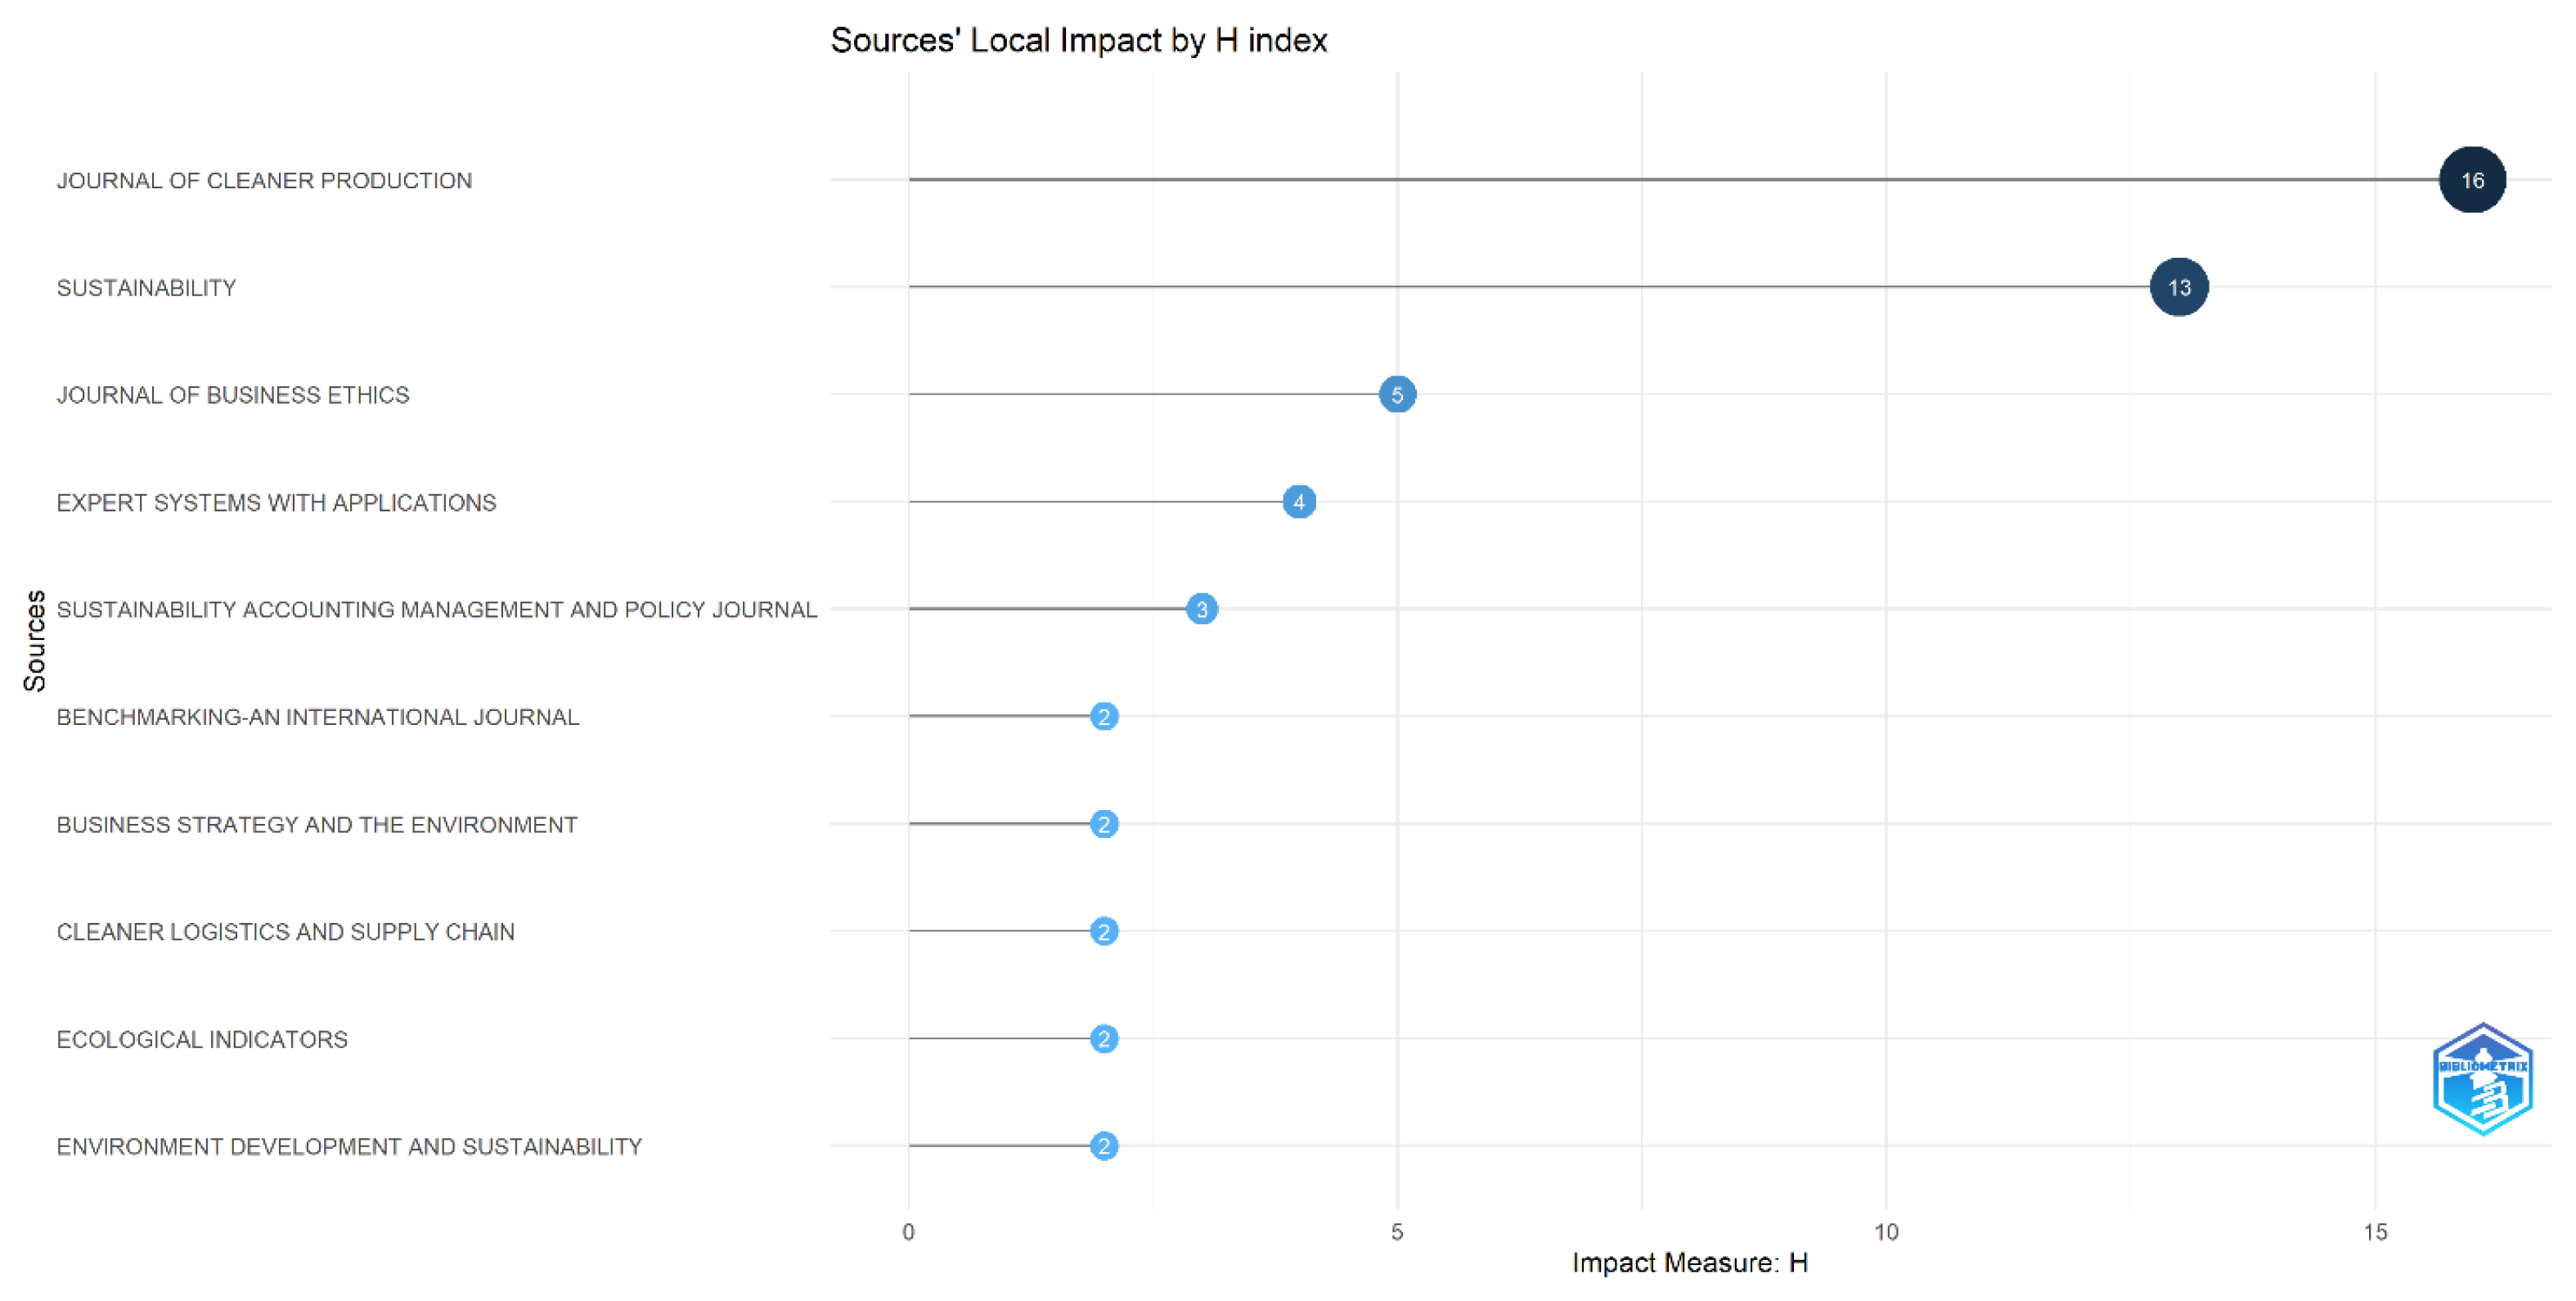
Figure 5). This analysis also allows us to evaluate the sources impact, with the Journal of Cleaner Production publishing 17 articles, reaching 763 citations and an impact measure of H = 16, while Sustainability, with twice as many articles, has 311 citations and an impact measure of H = 13 (Figure 6).
Figure 6 presents the publication sources’ local impact for our final sample of 247 documents collected from the WoS database using a combination of terms, namely, “BSC or Balanced Scorecard” AND “Sustainability”, for the timespan of 2000–2024.
When analyzing the contributions of various countries to scientific publications on SBSCs (sustainable business and social responsibility), it can be seen that the studies originate from a wide range of countries, covering Europe, Asia, Oceania, and South America (Figure 7). This geographical diversity shows that concern for sustainability and SBSC usage is a global priority, adopted by companies in economies at all levels of development. This widespread involvement underlines the universal recognition of the importance of integrating sustainable practices and social responsibility into business models in different economic contexts.
The analysis of the most productive countries in Figure 8 reveals that China and Spain lead the ranking with 22 (16 single-country and 6 collaborative) and 20 (17 single-country and 3 collaborative) publications, respectively. Next, we find Germany (15 publications = 13 SCP + 2 MCP), India (14 publications = 13 SCP + 1 MCP), Brazil (15 publications = 8 SCP + 4 MCP), Italy (15 publications = 10 SCP + 2 MCP), and Australia (10 publications = 5 SCP + 5 MCP). Australia presents the one of the highest MCP ratios at 0.5. This global participation also signifies a collective movement toward a more sustainable and responsible future.

4.3. Thematic Evolution and Cluster Analysis

Sustainability balanced scorecard (SBSC) studies have gained increasing academic and practical attention, reflecting organizations’ demand for tools that align financial performance with sustainability objectives (Agarwal et al., 2022; Fatima & Elbanna, 2023; 
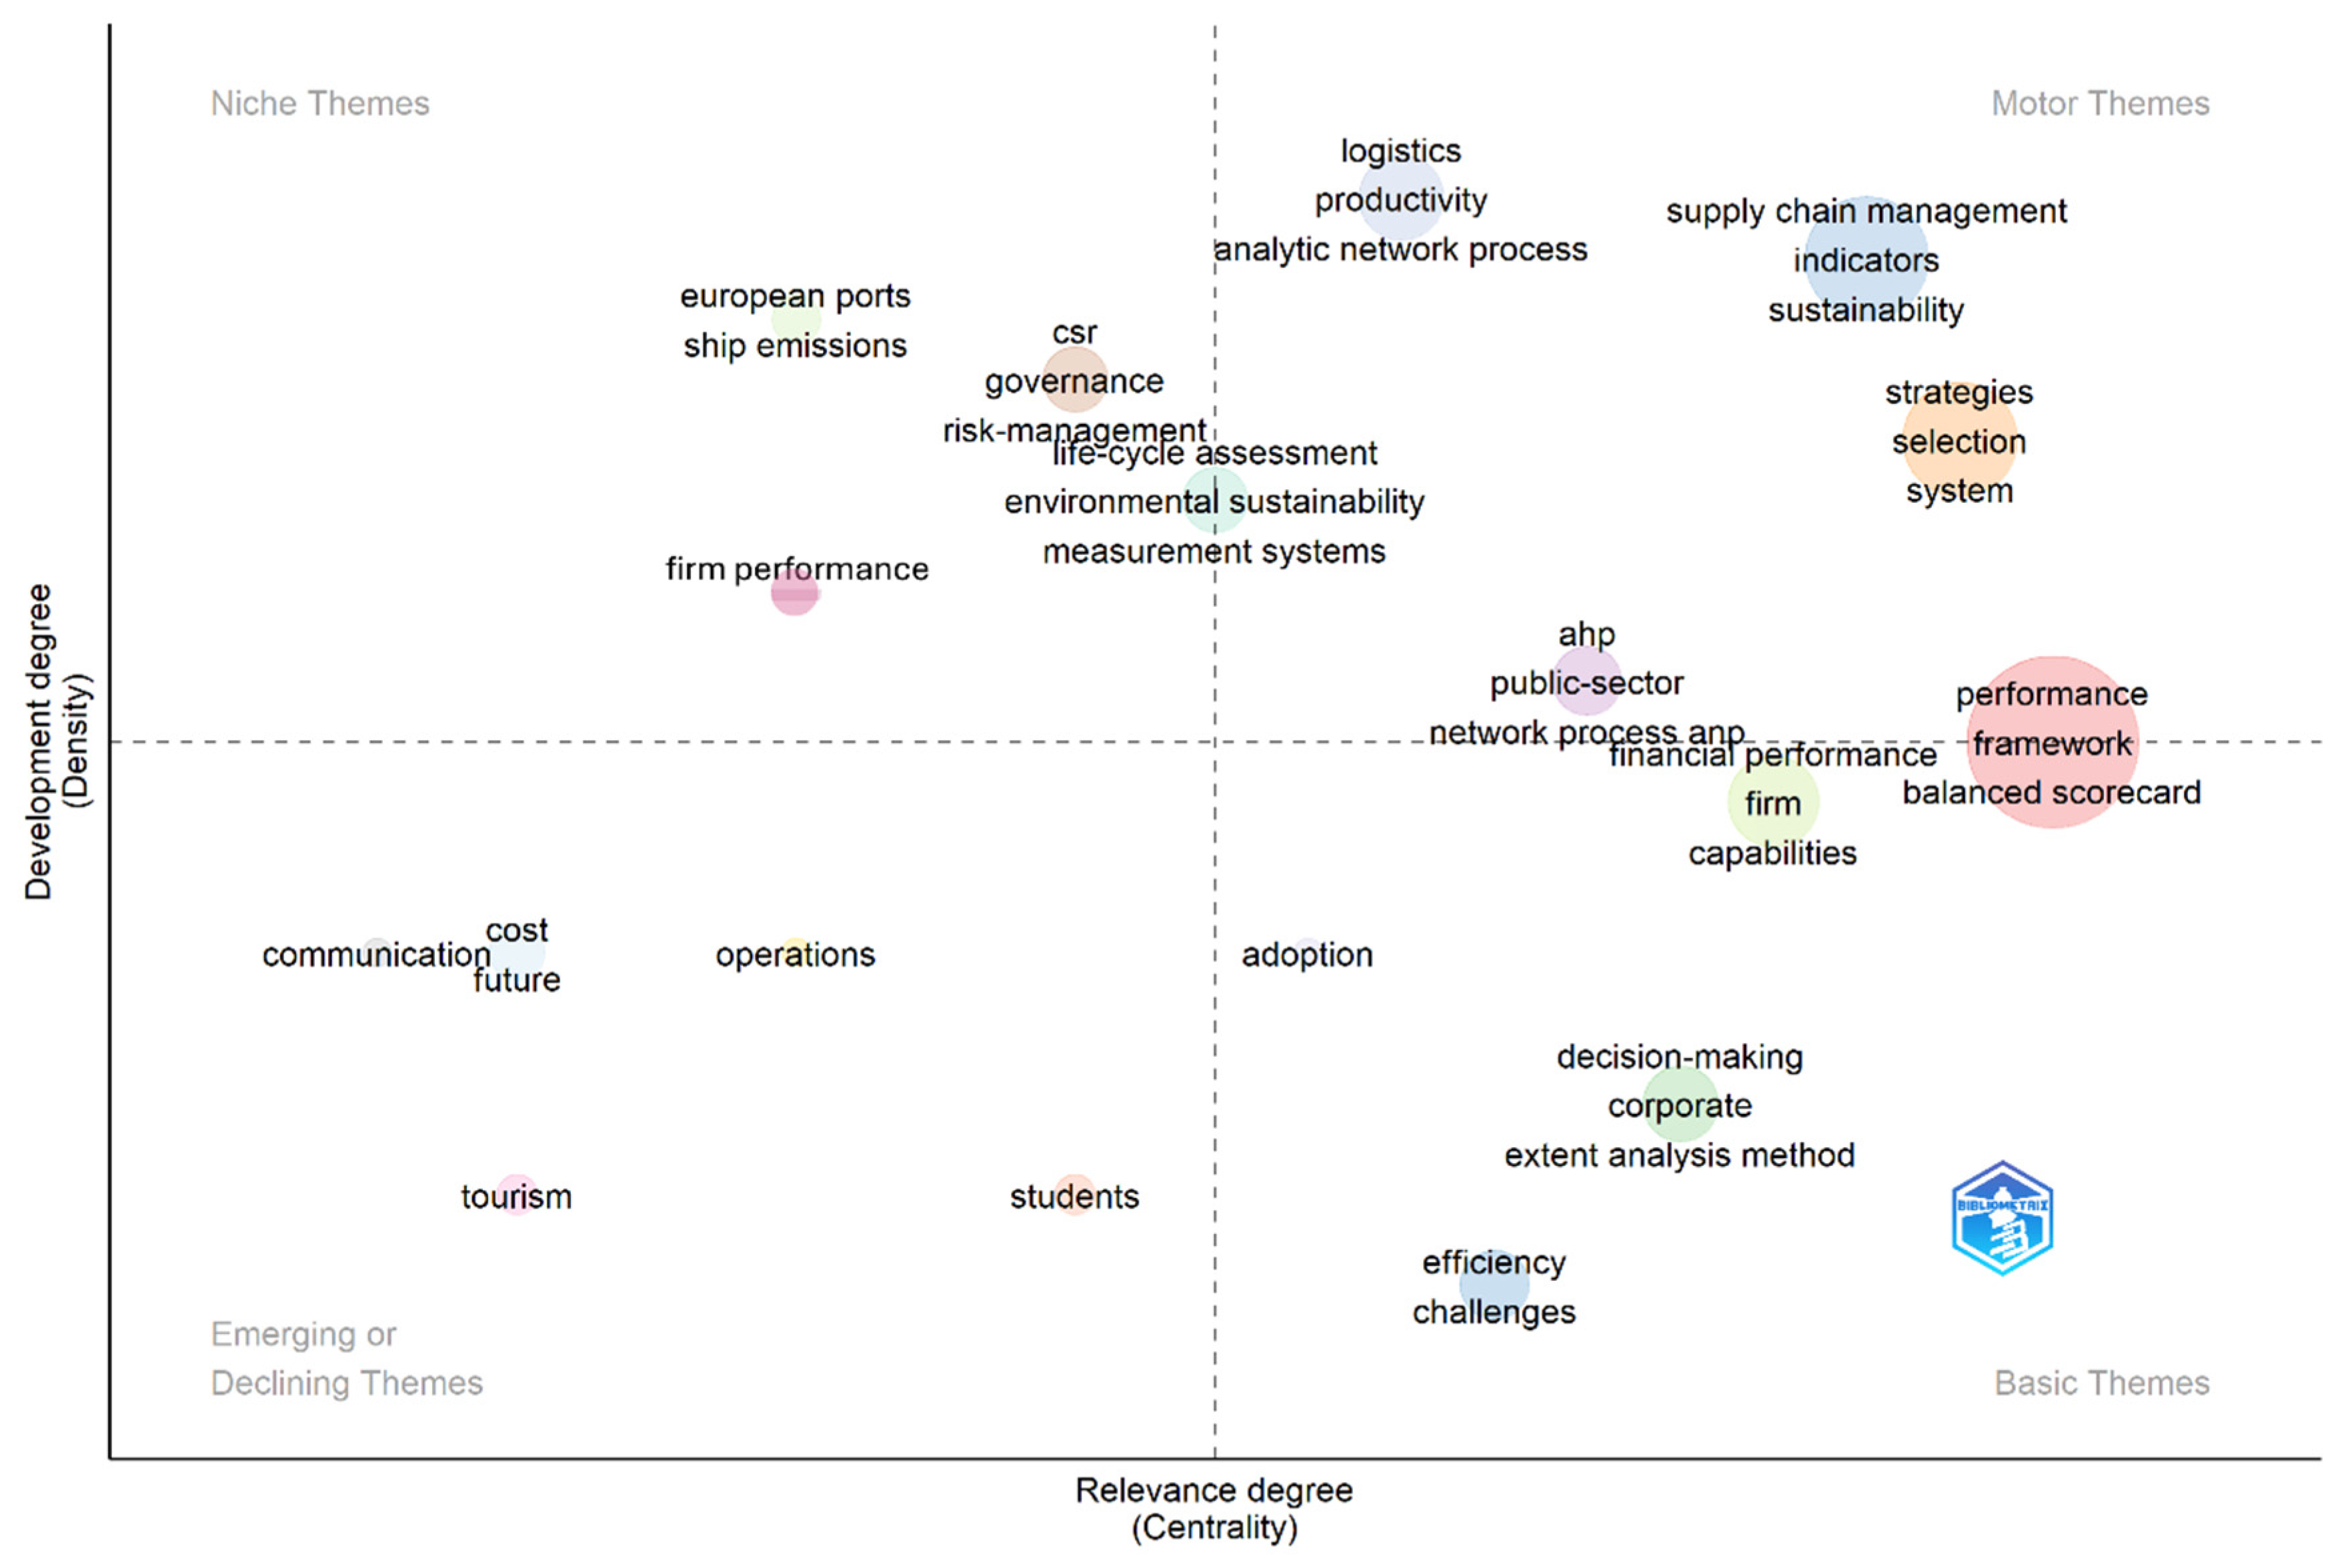
Fernández-González et al., 2023). The strategic diagram presented in Figure 8 is a valuable tool for understanding the intellectual structure of a research field. It helps to visualize the relationships between different research themes and identify potential areas for future research. The four quadrants represent different thematic areas based on their centrality (relevance degree) and density (development degree), identifying emerging or declining themes, niche themes, basic themes, and motor themes.
In the motor themes quadrant, we find sustainability, performance measurement systems, and balanced scorecard. These themes are well established, highly cited, and central to the field, representing the core research topics that drive the SBSC field forward. Sustainability is central to the field, indicating a strong focus on environmentally and socially responsible practices; performance measurement systems are crucial for evaluating organizational performance, particularly in relation to sustainability; and the balanced scorecard is a widely used framework for strategic performance measurement and is a fundamental tool for integrating sustainability into organizational strategies. Regarding niche themes, the thematic map highlights ship emissions and European ports. This indicates a growing interest in the environmental impact of maritime transportation and the need for sustainable port operations.
The connections between themes highlight the interdisciplinary nature of the field. For instance, the link between “sustainability” and “performance measurement systems” indicates that sustainability is increasingly being integrated into performance measurement frameworks. Based on the thematic map, future research can focus on deepening the integration of sustainability into performance measurement systems, exploring how to effectively incorporate sustainability indicators into existing performance frameworks. Addressing the challenges of implementing sustainability initiatives, exploring the barriers to sustainability implementation and developing strategies to overcome them, and investigating the potential of technologies like AI, IoT, and blockchain to drive sustainable innovation are also future fields of research.
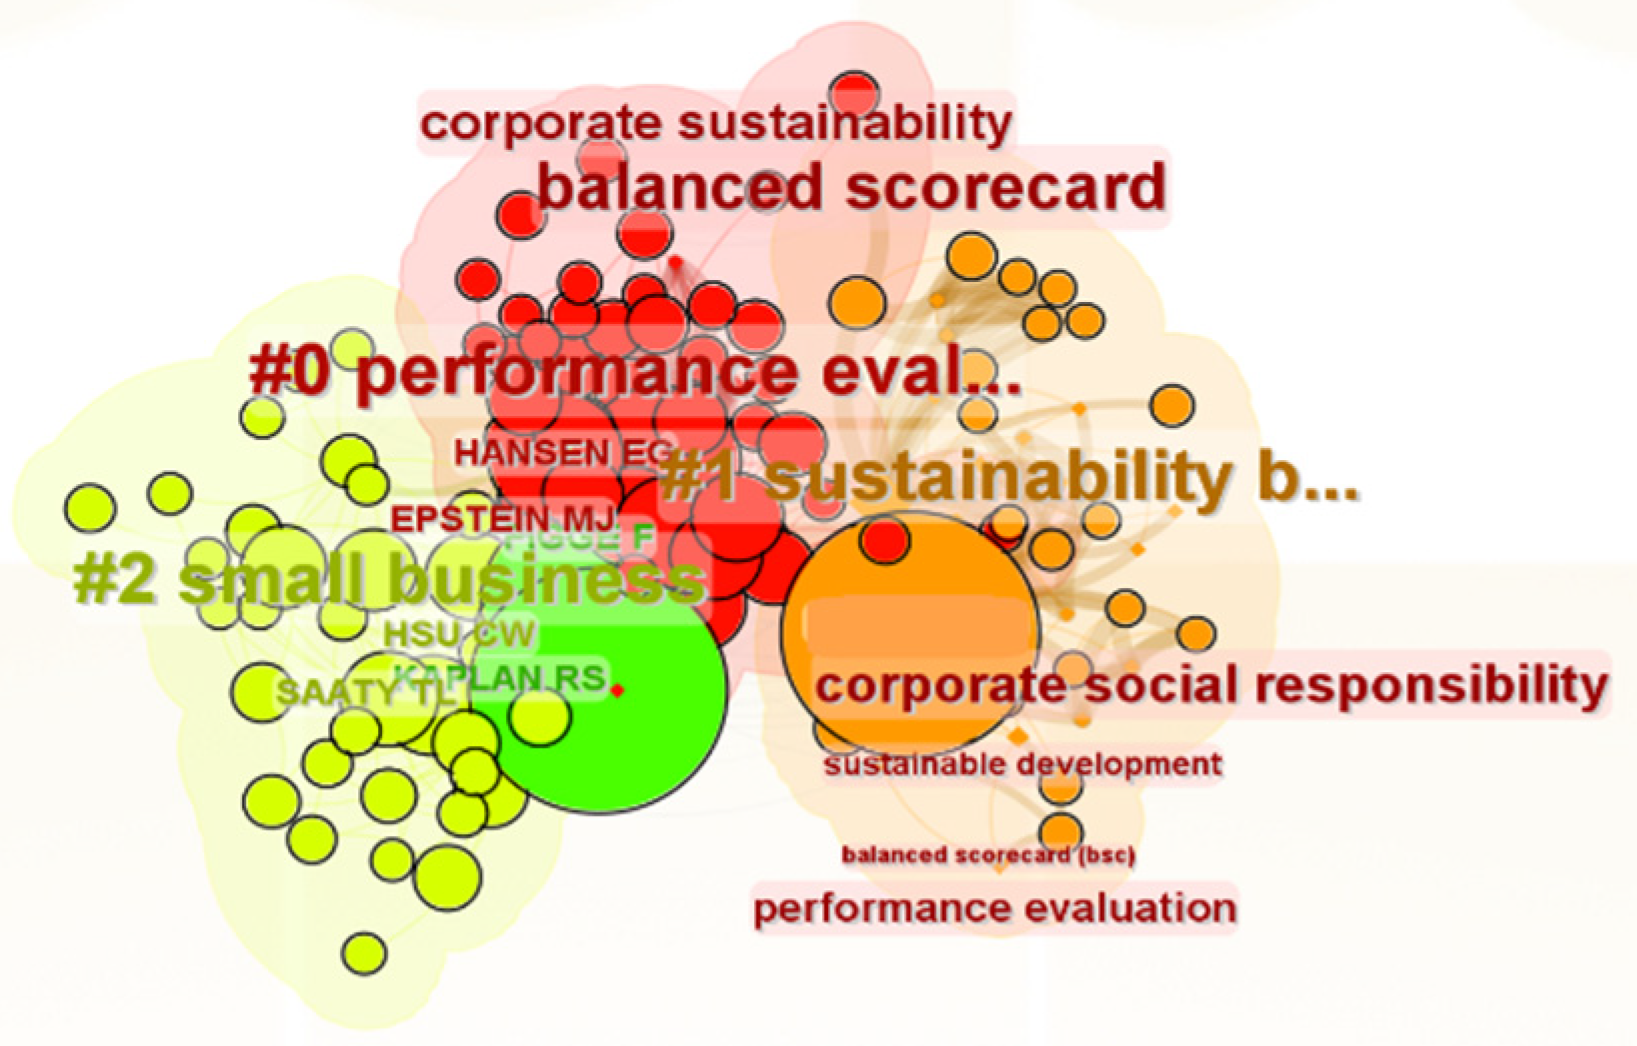
Using co-citation clustering, this study employed CiteSpace software, 6.3.R1 Basic version, to map research clusters by analyzing keyword patterns and tracking their frequency to uncover the main terms prioritized by researchers (Chen, 2006). This approach identified a network of 288 nodes (representing key terms) and 1180 academic connections, all associated with discussions on the BSC and sustainability. The most significant and frequently cited keywords found in articles are depicted in Figure 9.
The silhouette score, which ranges from 0 to 1, measures the clarity in defining each cluster’s main themes, with higher scores suggesting greater internal consistency and coherence within clusters (Issah & Rodrigues, 2021). In this analysis, each cluster received scores close to 1, demonstrating that articles were accurately categorized into distinct thematic groups. Among these, the leading clusters emerged around the terms “ Performance Evaluation”, “Sustainability Balanced Scorecard” and “Small Business”.
Based on the methodology of Enciso-Alfaro and García-Sánchez (2023), clusters with fewer than 20 keywords were excluded from the analysis to maintain focus on significant thematic areas. Using the log-likelihood ratio clustering algorithm, the program identified seven prominent clusters. Each cluster’s size reflects the number of articles it contains, which ranges from clusters with 51 articles down to those with 35, corresponding to cluster silhouette scores between 0 and 2 (Table 9).
Cluster 0—Performance Evaluation
This cluster focuses on integrating “performance evaluation” with sustainability aspects. The top terms suggest an emphasis on assessing corporate sustainability practices and incorporating environmental considerations into evaluation frameworks (Hansen & Schaltegger, 2018). The inclusion of “Sustainability Balanced Scorecard Knowledge” implies a link between traditional performance metrics and sustainability-focused ones, reflecting a shift toward evaluating not just financial outcomes but also environmental and societal impacts.
Seminal works by Bieker et al. (2002), Figge et al. (2002), and Mio et al. (2022) have highlighted the value of integrating sustainability indicators into corporate strategies. For example, Asadi Louye et al. (2026) demonstrated how Iranian hospitals integrated resource consumption and patient care metrics into their SBSC frameworks to enhance environmental management while maintaining healthcare quality.
The mentions of “corporate environmental management” and “digital innovation” suggest that this cluster captures trends where organizations leverage technologies such as big data and IoT to optimize sustainability metrics, as seen in Zhang et al. (2023), who analyzed SBSC adoption in China’s logistics sector. In essence, this cluster represents the evolution of performance evaluation systems to include sustainability as a core component of strategic management. Researchers such as Adams and Frost (2008), Hristov et al. (2019), and Stavropoulou et al. (2023), have explored modifications to the existing BSC perspectives, incorporating sustainability metrics within internal processes (e.g., energy efficiency, waste management) and learning and growth (e.g., sustainability training and fostering a socially responsible organizational culture).
Cluster 1—Sustainability Balanced Scorecard
The second cluster is centered around the SBSC, a framework that enhances the traditional balanced scorecard by integrating sustainability dimensions—environmental, social, and governance—into strategic performance management. The SBSC enables organizations to align long-term sustainable development goals with financial, operational, and strategic priorities.
Recent applications underscore its versatility: Barbosa et al. (2020b) demonstrated its use in Brazilian manufacturing SMEs, where an SBSC facilitated the alignment of eco-efficiency goals with production targets. In the resource recovery sector, studies such as that by Zhang et al. (2023) have combined the SBSC with MCDM techniques like AHP to optimize decisions on waste valorization and logistics. These quantitative methodologies assist businesses in evaluating trade-offs between profitability and ecological or social impact.
The prominence of sustainable development in this cluster underscores SBSC’s ability to balance financial outcomes with societal benefits, enabling organizations to adopt sustainable practices while maintaining competitiveness. The SBSC helps organizations prioritize sustainable practices, address stakeholder demands, and enhance resilience in a resource-constrained world (Hansen & Schaltegger, 2016, 2018). By systematically linking sustainability objectives to KPIs, the SBSC ensures that sustainability is embedded into both strategic planning and daily operations (Hahn & Figge, 2018), as evidenced in its adoption by logistics firms in China (Zhang et al., 2023). This cluster reflects sectors and organizations that are pioneers in adopting sophisticated tools to navigate sustainability challenges.
Cluster 2—Small Business
This cluster highlights the role of small businesses in adopting sustainability practices. Despite significant obstacles such as limited resources and informality (Barbosa et al., 2020a; Shields & Shelleman, 2015), the SBSC is emerging as a valuable tool for SMEs. For instance, Barbosa et al. (2020b) detailed how Brazilian SMEs incorporated energy efficiency and waste reduction metrics within SBSC frameworks, overcoming integration challenges and enhancing competitiveness.
The presence of terms like “green supply chain management” and “sustainable management” signals rising environmental awareness among small businesses, which are adopting structured frameworks to evaluate and improve their sustainability performance. Applications in sectors like textile SMEs (Iran) and food processing (Brazil) further demonstrate the adaptability of the SBSC to varied small business contexts. Additionally, digitalization trends are enabling SMEs to operationalize the SBSC more effectively using user-friendly dashboards and performance tracking tools. This cluster likely reflects the growing role of small businesses as active agents in achieving sustainability objectives, leveraging methodologies traditionally reserved for large corporations.
In Figure 10, larger nodes represent the most frequently used terms per year, and the curved lines between them indicate co-occurrence.
As can be seen, the first and second clusters are the clusters with the most frequently used terms. Despite this, all clusters follow the timeline under study and are still very recently reflected in the literature. Cluster 0—Performance Evaluation shows that the literature has evolved to integrate sustainability metrics, allowing companies to align their strategies with long-term goals, mitigate risks, and identify opportunities for sustainable innovation (e.g., Mio et al., 2022; Stavropoulou et al., 2023). In Cluster 2—Small Business, as the literature shows, the BSC has been highlighted as a valuable tool for small businesses, allowing them to overcome the challenges of sustainability integration, improve their competitive advantage, and contribute to a more sustainable future, despite costs and implementation difficulties (e.g., Barbosa et al., 2020a).
To conclude, Cluster 1—Sustainability Balanced Scorecard is considered the most recent due to the growing relevance and sophistication of the methodologies used to integrate sustainability into strategic management. The SBSC concept, initially developed to incorporate environmental, social, and governance dimensions into the traditional balanced scorecard, has evolved significantly with the adoption of approaches such as MCDM and AHP. These methodologies enable organizations to assess and balance trade-offs between financial goals and ecological or social impacts, responding to growing demands for corporate responsibility and resilience in the context of limited resources. The recent literature, such as the work of Hansen and Schaltegger (2018) and Hahn and Figge (2018), highlights the effectiveness of the SBSC in aligning sustainability objectives with the strategic and operational priorities of organizations. This approach is especially relevant in sectors facing complex challenges such as resource recovery and corporate sustainability. Furthermore, the SBSC not only incorporates sustainable practices but ensures that they are systematically integrated into strategic planning and daily operations, strengthening companies’ competitiveness. The recent relevance of this cluster reflects the increasingly widespread adoption of the SBSC in innovative organizations, which are leading the transition to more sustainable practices. These trends show how the SBSC has evolved from a theoretical idea to a widely applied strategic tool, positioning it as an essential element in contemporary management.
The results confirm the SBSC’s effectiveness in promoting strategic alignment with sustainability objectives while emphasizing the need for additional empirical studies to validate its application in specific contexts. The identified international collaborations, particularly between European and Asian institutions, point to the increasing globalization of research in this field. The SBSC framework not only provides a structured approach to monitoring and evaluating sustainability initiatives but also enhances innovation and competitiveness by aligning organizational practices with long-term goals. Despite these advancements, challenges persist, including the definition of relevant indicators and organizational resistance (Hristov et al., 2019). In particular, SMEs face specific challenges such as organizational resistance and resource constraints, but they can benefit from an adapted SBSC implementation by including metrics tailored to their needs, such as energy efficiency indicators and waste reduction measures (Stavropoulou et al., 2023). Furthermore, the integration of ESG indicators into the SBSC framework enables SMEs to strengthen their stakeholder reputation and boost their capacity for sustainable innovation—key factors in responding to regulatory pressures and market demands (Hansen & Schaltegger, 2016). These results highlight that while significant barriers remain, SMEs can leverage the SBSC’s flexibility as a catalyst for achieving both their strategic and sustainability objectives in a practical and integrated manner. Furthermore, the limited integration of sustainability goals with existing management systems requires greater attention, particularly in industries that are less mature regarding sustainable practices.

4.4. Practical Implications and Sectoral Considerations

In the context of SMEs (Cluster 2), the literature highlights recurring challenges such as limited financial and human resources, informality in sustainability practices, and insufficient strategic alignment (Barbosa et al., 2020a; Shields & Shelleman, 2015). Despite these constraints, recent studies (e.g., Stalmachova et al., 2022) suggest that the SBSC can be operationalized effectively in SMEs by leveraging digital tools and simplified indicator frameworks. Practical recommendations for SMEs include integrating metrics related to energy efficiency, waste reduction, and employee sustainability training into the internal process and learning SBSC perspectives. Furthermore, government agencies and business associations can facilitate adoption by offering subsidized access to digital sustainability dashboards, standardized ESG reporting templates, and targeted training programs. Case examples from manufacturing SMEs in Europe show that digitalization—through smart meters and IoT devices—has enabled the real-time monitoring of energy consumption, directly feeding into SBSC performance reviews.
The performance measurement cluster (Cluster 0) underscores the need to position sustainability indicators at the strategic BSC core rather than as peripheral or compliance-oriented add-ons. Practical implementation requires deliberate alignment of environmental and social metrics with financial targets, creating an integrated value proposition. For example, leading firms in the consumer goods sector have linked reductions in carbon emissions with cost savings and brand equity enhancement, thus reinforcing the financial relevance of ESG goals. Recommended practices include adopting sectoral ESG standards—such as the GRI and the Sustainability Accounting Standards Board (SASB)—to ensure comparability while customizing specific metrics to reflect the company’s operational realities. Digitalization further supports this process by enabling automated data collection, real-time dashboards, and predictive analytics for sustainability performance.
For large corporations and public sector organizations, the growing application of multi-criterion decision-making methods (e.g., AHP, MCDM) reflects a more advanced approach to embedding sustainability in strategic planning. In these contexts, the SBSC functions not only as a management tool but also as a mechanism for demonstrating accountability, transparency, and legitimacy. However, common barriers such as organizational resistance, a lack of standardized metrics, and coordination difficulties persist. To overcome these, organizations are advised to establish cross-functional sustainability committees, adopt internationally recognized frameworks such as the United Nations Sustainable Development Goals (SDGs), and ensure that stakeholder engagement is embedded in SBSC design. In the public sector, best practices include linking SBSC indicators directly to institutional mandates (e.g., public health, education outcomes) and involving citizens and NGOs in the performance evaluation process, thereby reinforcing social value creation.
Overall, the findings suggest that the SBSC should not be applied as a one-size-fits-all model but adapted to organizational characteristics, sectoral requirements, and technological capabilities. Enabling policies such as public incentives for digital sustainability tools, ESG reporting regulations, and capacity-building initiatives can further support effective SBSC implementation. In doing so, the SBSC can evolve into a dynamic and adaptable tool for aligning sustainability objectives with strategic management practices in all sectors, including those undergoing rapid digital transformation.

4.5. Conceptual Tensions and Structural Debates in SBSC Research

Although SBSC is becoming increasingly important in the academic and management fields, the literature reveals several conceptual tensions and unresolved structural issues that require further analysis. These issues focus particularly on the SBSC architectural configuration, the selection and harmonization of performance indicators and the adaptability of the reference framework to different sectors.
One of the main discussions is centered on the introduction of sustainability into the balanced scorecard model structure. Authors differ on whether sustainability should be presented as a fifth autonomous perspective (Figge et al., 2002) or whether it should be integrated into the four traditional perspectives (financial, customer, internal processes, and learning and growth). Authors who defend the autonomous model argue that it ensures greater visibility and prioritization of environmental, social, and governance objectives (Hansen & Schaltegger, 2016). However, this approach has been criticized for potentially isolating sustainability from the organization’s core strategic narrative. The integrated model, on the other hand, promotes consistency by distributing sustainability considerations across existing dimensions, as argued by Hansen and Schaltegger (2016). However, this can run the risk of underestimating sustainability unless it is explicitly prioritized in each domain.
A second point of divergence relates to sustainability indicators. Although the SBSC seeks to align strategic objectives with measurable ESG performance, there is still a lack of consensus on the selection of indicators. Studies often adopt sectoral or case-specific metrics, which makes comparison difficult. This issue becomes particularly important in global or multi-sector analyses, where contextual variability further fractures the research fields.
Finally, there is ongoing discussion about the transferability of the SBSC from business organizations to other types of organizations. While some authors propose universal applicability, the literature also emphasizes the barriers to adoption among SMEs, including limited resources, insufficient technical expertise, and resistance to structural change. Public sector organizations face different obstacles, often requiring the adaptation of SBSCs to emphasize legitimacy, transparency, and stakeholder involvement rather than competitive advantage.
These tensions reveal a field in active evolution. To increase theoretical and practical coherence, future researchers should seek to carry out comparative assessments of SBSC models, investigate sector-specific adaptations, and work toward greater standardization of sustainability measurement. In doing so, it will contribute to the maturity of SBSC, both as a conceptual framework and as a practical tool.
To improve the practical application of SBSC, organizations should first carefully evaluate whether sustainability goals are better served by adopting an autonomous fifth perspective or by integrating them into the existing four perspectives. This decision should be guided by the organization’s structure, strategic priorities, and the need for visibility in ESG objectives. Second, when selecting performance indicators, practitioners are advised to combine internationally recognized ESG standards (such as the GRI, Sustainability Accounting Standards Board—SASB, or United Nations Sustainable Development Goals—SDGs) with sector-specific metrics to ensure both comparability and relevance. To enhance adaptability, especially in SMEs and public sector organizations, SBSC frameworks should be simplified where necessary, supported by training programs to build technical expertise, and designed to include stakeholder engagement mechanisms that foster transparency and legitimacy. Finally, organizations should establish regular review and benchmarking processes to refine their SBSCs in line with emerging sustainability practices and evolving sectoral challenges.

5. Conclusions

The BSC’s sustainability management approach seeks to holistically address corporate sustainability contributions. It posits that businesses should simultaneously enhance their performance in sustainability’s economic, environmental, and social dimensions to truly contribute to sustainable development. In this context, the BSC methodology promotes an integrated perspective where the relationship between the four traditional dimensions and the other pillars of sustainability are explicitly considered (Kaplan & Norton, 2001). The assumption is that businesses can achieve enduring and sustainable development only through this balanced approach, which recognizes and values the interdependence of different sustainability aspects. Therefore, companies must assess and improve their performance by considering this triad of factors, ensuring that economic growth does not come at the environment’s or society’s expense (Benn et al., 2014; Hart & Milstein, 2003).
This study confirms the sustainability balanced scorecard (SBSC) as a pivotal tool for embedding sustainability into strategic management practices. By synthesizing 247 publications, this systematic literature review reveals that the SBSC has evolved into a mature framework capable of aligning ESG objectives with organizational goals, fostering a holistic approach to sustainable performance management. The thematic clusters identified—Performance Evaluation, Sustainability Balanced Scorecard, and Small Business—illustrate the framework’s adaptability and its growing relevance across diverse organizational contexts. The SBSC’s practical application is particularly relevant for SMEs, as it enables the adaptation of indicators and strategies to address their specific limitations, such as financial and technological constraints. Evidence suggests that successful SBSC implementation by SMEs can enhance their competitiveness and bolster their organizational reputation (Klewitz & Hansen, 2014; Hansen & Schaltegger, 2018). Furthermore, the SBSC provides a flexible and adaptable model, allowing SMEs to overcome challenges such as organizational resistance through targeted training and awareness programs focusing on sustainability. The SBSC has demonstrated its capacity to drive sustainable innovation, enhance decision-making, and improve resource efficiency. However, significant barriers persist, including the lack of standardized sustainability metrics, organizational resistance, and the complexities of integrating sustainability into existing management systems. These challenges are particularly pronounced for small businesses, which often lack the resources to implement comprehensive sustainability strategies.
Despite the methodological rigor employed in this study, certain limitations must be acknowledged. The exclusive reliance on the Web of Science database may have introduced sampling bias, potentially excluding relevant studies indexed in other databases. Additionally, the use of specific search terms and bibliometric indicators is inherently sensitive to indexing inconsistencies and metadata variability, which may affect the findings’ comprehensiveness. While efforts were made to ensure objective classification through dual review and software-assisted clustering, some subjectivity may still influence the thematic synthesis.
Additionally, the findings of this study suggest that future research should explore practical strategies for mitigating organizational resistance. This includes leveraging digital technologies to automate the monitoring of sustainability indicators and analyzing successful case studies of SBSC implementation across various sectors. These initiatives can facilitate broader and more effective SBSC adoption, driving positive outcomes at both organizational and societal levels. Also, some contextual heterogeneity across studies, especially regarding companies’ size and/or activity sector, can limit the results’ generalizability.
Future research should address these limitations by broadening database inclusion, ensuring that reviews consider the broader social and cultural contexts of the studies under review (Munn et al., 2018; Page et al., 2021), and conducting sector-specific meta-analyses.

Author Contributions

Conceptualization, A.S. and I.M.; methodology, A.S. and I.M.; software, I.M. and C.C.; validation, A.S., M.d.S. and I.M.; formal analysis, A.S., I.M., M.d.S. and C.C.; investigation, A.S., I.M., M.d.S. and C.C.; resources, A.S., I.M., M.d.S. and C.C.; data curation, A.S., I.M. and C.C.; writing—original draft preparation, A.S. and I.M. writing—review and editing, A.S., I.M., and M.d.S., visualization, A.S., I.M., M.d.S. and C.C.; supervision, A.S., I.M. and M.d.S.; project administration, A.S., I.M. and M.d.S. All authors have read and agreed to the published version of the manuscript.

Funding

This research received no external funding.

Institutional Review Board Statement

Not applicable.

Informed Consent Statement

Informed consent was obtained from all subjects involved in the study.

Data Availability Statement

Data Availability Statements are available at https://www.webofscience.com/wos (accessed on 4 November 2024).

Conflicts of Interest

The authors declare no conflicts of interest.

References

  1. Adams, C. A., & Frost, G. R. (2008). Integrating sustainability reporting into management practices. Accounting Forum, 32(4), 288–302. [Google Scholar] [CrossRef]
  2. Agarwal, S., Kant, R., & Shankar, R. (2022). Exploring sustainability balanced scorecard for performance evaluation of humanitarian organizations. Cleaner Logistics and Supply Chain, 3, 100026. [Google Scholar] [CrossRef]
  3. Aria, M., & Cuccurullo, C. (2017). bibliometrix: An R-tool for comprehensive science mapping analysis. Journal of Informetrics, 11(4), 959–975. [Google Scholar] [CrossRef]
  4. Aromataris, E., & Munn, Z. (2020). JBI manual for evidence synthesis. JBI. In J. P. T. Higgins, J. Thomas, J. Chandler, M. Cumpston, T. Li, M. J. Page, & V. A. Welch (Eds.), Cochrane handbook for systematic reviews of interventions. Cochrane. [Google Scholar]
  5. Asadi Louye, N., Maleki Choubari, M., & Kheradyar, S. (2026). Identifying the effective factors of management accounting techniques on the tendency to earnings management in financial crisis conditions. International Journal of Finance & Managerial Accounting, 11(43), 1–18. [Google Scholar]
  6. Álvarez Pérez, C., Rodríguez Montequín, V., Ortega Fernández, F., & Villanueva Balsera, J. (2017a). Integrating analytic hierarchy process (AHP) and balanced scorecard (BSC) framework for sustainable business in a software factory in the financial sector. Sustainability, 9(4), 486. [Google Scholar] [CrossRef]
  7. Álvarez Pérez, C., Rodríguez Montequín, V., Ortega Fernández, F., & Villanueva Balsera, J. (2017b). Integration of Balanced Scorecard (BSC), strategy map, and Fuzzy Analytic Hierarchy Process (FAHP) for a sustainability business framework: A case study of a Spanish software factory in the financial sector. Sustainability, 9(4), 527. [Google Scholar] [CrossRef]
  8. Barbosa, M., Castañeda-Ayarza, J. A., & Ferreira, D. H. L. (2020a). Sustainable management, balanced scorecard and small business: A systematic review and state of the art. Independent Journal of Management & Production, 11(1), 156–179. [Google Scholar] [CrossRef]
  9. Barbosa, M., Castañeda-Ayarza, J. A., & Lombardo Ferreira, D. H. (2020b). Sustainable Strategic Management (GES): Sustainability in small business. Journal of Cleaner Production, 258, 120880. [Google Scholar] [CrossRef]
  10. Benn, S., Edwards, M., & Williams, T. (2014). Organizational change for corporate sustainability (3rd ed.). Routledge. [Google Scholar] [CrossRef]
  11. Bieker, T., Dyllick, T., Gminder, C. U., & Hockerts, K. (2002). Towards a sustainable balanced scorecard: Linking environmental and social sustainability to business strategy. Journal of Business Ethics, 55(2), 125–137. [Google Scholar]
  12. Chalmeta, R., & Palomero, S. (2011). Methodological proposal for business sustainability management by means of the Balanced Scorecard. Journal of the Operational Research Society, 62(7), 1344–1356. [Google Scholar] [CrossRef]
  13. Chen, C. (2006). CiteSpace II: Detecting and visualizing emerging trends and transient patterns in scientific literature. Journal of the American Society for Information Science and Technology, 57(3), 359–377. [Google Scholar] [CrossRef]
  14. Costa, R., & Menichini, T. (2013). A multidimensional approach for CSR assessment: The importance of the stakeholder perception. Expert Systems with Applications, 40(1), 150–161. [Google Scholar] [CrossRef]
  15. De Crossan, M. M., & Apaydin, M. (2010). A multi-dimensional framework of organizational innovation: A systematic review of the literature. Journal of Management Studies, 47(6), 1154–1191. [Google Scholar] [CrossRef]
  16. De Geuser, F., Mooraj, S., & Oyon, D. (2009). Does the balanced scorecard add value? Empirical evidence on its effect on performance. European Accounting Review, 18(1), 93–122. [Google Scholar] [CrossRef]
  17. Depken, D., & Zeman, C. (2018). Small business challenges and the triple bottom line, TBL: Needs assessment in a Midwest State, U.S.A. Technological Forecasting and Social Change, 135, 44–50. [Google Scholar] [CrossRef]
  18. Di Vaio, A., & Varriale, L. (2018). Management innovation for environmental sustainability in seaports: Managerial accounting instruments and training for competitive green ports beyond the regulations. Sustainability, 10(3), 783. [Google Scholar] [CrossRef]
  19. Di Vaio, A., Varriale, L., & Alvino, F. (2018). Key performance indicators for developing environmentally sustainable and energy efficient ports: Evidence from Italy. Energy Policy, 122, 229–240. [Google Scholar] [CrossRef]
  20. Dias-Sardinha, I., Reijnders, L., & Antunes, P. (2007). Developing sustainability balanced scorecards for environmental services: A study of three large Portuguese companies. Environmental Quality Management, 16(4), 13–34. [Google Scholar] [CrossRef]
  21. Donthu, N., Kumar, S., Mukherjee, D., Pandey, N., & Lim, W. M. (2021). How to conduct a bibliometric analysis: An overview and guidelines. Journal of Business Research, 133, 285–296. [Google Scholar] [CrossRef]
  22. Enciso-Alfaro, S. Y., & García-Sánchez, I. M. (2023). Corporate governance and environmental sustainability: Addressing the dual theme from a bibliometric approach. Corporate Social Responsibility and Environmental Management, 30(3), 1025–1041. [Google Scholar] [CrossRef]
  23. Epstein, M. J., & Buhovac, A. R. (2014). Making sustainability work: Best practices in managing and measuring corporate social, environmental, and economic impacts. Greenleaf Publishing. [Google Scholar] [CrossRef]
  24. Epstein, M. J., & Manzoni, J. F. (1997). The balanced scorecard and tableau de bord: Translating strategy into action. Management Accounting, 79(2), 28–36. [Google Scholar]
  25. Epstein, M. J., & Wisner, P. S. (2001). Using a Balanced Scorecard to Implement Sustainability. Environmental Quality Management, 11(2), 1–10. [Google Scholar] [CrossRef]
  26. Fatima, T., & Elbanna, S. (2023). Drivers and outcomes of corporate sustainability in the Indian hospitality industry. Management Decision, 61(6), 1677–1696. [Google Scholar] [CrossRef]
  27. Fernández-González, R., Puime-Guillén, F., & Vila-Biglieri, J. E. (2023). Environmental strategy and the petroleum industry: A sustainability balanced scorecard approach. Journal of Petroleum Exploration and Production Technology, 13(2), 763–774. [Google Scholar] [CrossRef]
  28. Figge, F., Hahn, T., Schaltegger, S., & Wagner, M. (2002). The sustainability balanced scorecard—Linking sustainability management to business strategy. Business Strategy and the Environment, 11(5), 269–284. [Google Scholar] [CrossRef]
  29. Gora, K., Dhingra, B., & Yadav, M. (2024). A bibliometric study on the role of micro-finance services in micro, small and medium enterprises. Competitiveness Review, 34(4), 718–735. [Google Scholar] [CrossRef]
  30. Hahn, T., & Figge, F. (2018). Why architecture does not matter: On the fallacy of sustainability balanced scorecards. Journal of Business Ethics, 150(4), 919–935. [Google Scholar] [CrossRef]
  31. Hansen, E. G., & Schaltegger, S. (2016). The sustainability balanced scorecard: A systematic review of architectures. Journal of Business Ethics, 133(2), 193–221. [Google Scholar] [CrossRef]
  32. Hansen, E. G., & Schaltegger, S. (2018). Sustainability balanced scorecards and their architectures: Irrelevant or misunderstood? Journal of Business Ethics, 150(4), 937–952. [Google Scholar] [CrossRef]
  33. Hart, S. L., & Milstein, M. B. (2003). Creating sustainable value. Academy al Management Executive, 17(2), 56–67. [Google Scholar] [CrossRef]
  34. Higgins, J. P. T., Thomas, J., Chandler, J., Cumpston, M., Li, T., Page, M. J., & Welch, V. A. (2020). Cochrane handbook for systematic reviews of interventions. Wiley-Blackwell. [Google Scholar]
  35. Hristov, I., Chirico, A., & Appolloni, A. (2019). Sustainability value creation, survival, and growth of the company: A critical perspective in the sustainability Balanced Scorecard (SBSC). Sustainability, 11(7), 2119. [Google Scholar] [CrossRef]
  36. Hsu, C. W., Hu, A. H., Chiou, C. Y., & Chen, T. C. (2011). Using the FDM and ANP to construct a sustainability balanced scorecard for the semiconductor industry. Expert Systems with Applications, 38(10), 12891–12899. [Google Scholar] [CrossRef]
  37. Hubbard, G. (2009). Measuring organizational performance: Beyond the triple bottom line. Business Strategy and the Environment, 18(3), 177–191. [Google Scholar] [CrossRef]
  38. Issah, O., & Rodrigues, L. L. (2021). Corporate social responsibility and corporate tax aggressiveness: A scientometric analysis of the existing literature to map the future. Sustainability, 13(11), 6225. [Google Scholar] [CrossRef]
  39. Kaplan, R. S., & Norton, D. P. (1992). The balanced scorecard: Measures that drive performance. Harvard Business Review, 70(1), 71–79. [Google Scholar]
  40. Kaplan, R. S., & Norton, D. P. (1996a). The balanced scorecard: Translating strategy into action. Harvard Business School Press. [Google Scholar]
  41. Kaplan, R. S., & Norton, D. P. (1996b). Using the balanced scorecard as a strategic management system. Harvard Business Review, 74(1), 75–85. [Google Scholar]
  42. Kaplan, R. S., & Norton, D. P. (2001). The strategy-focused organization: How balanced scorecard companies thrive in the new business environment. Harvard Business School Press. [Google Scholar]
  43. Klewitz, J., & Hansen, E. G. (2014). Sustainability-oriented innovation of SMEs: A systematic review. In Journal of Cleaner Production, 65, 57–75. [Google Scholar] [CrossRef]
  44. Kumar, S., Lim, W. M., Sureka, R., Jabbour, C. J. C., & Bamel, U. (2024). Balanced scorecard: Trends, developments, and future directions. Review of Managerial Science, 18(8), 2397–2439. [Google Scholar] [CrossRef]
  45. Länsiluoto, A., & Järvenpää, M. (2008). Environmental and performance management forces: Integrating “greenness” into balanced scorecard. Qualitative Research in Accounting & Management, 5(3), 184–206. [Google Scholar] [CrossRef]
  46. Malina, M. A., & Selto, F. H. (2001). Communicating and controlling strategy: An empirical study of the effectiveness of the balanced scorecard. Journal of Management Accounting Research, 13(1), 47–90. [Google Scholar] [CrossRef]
  47. Mio, C., Costantini, A., & Panfilo, S. (2022). Performance measurement tools for sustainable business: A systematic literature review on the sustainability balanced scorecard use. Corporate Social Responsibility and Environmental Management, 29(2), 367–384. [Google Scholar] [CrossRef]
  48. Moher, D., Liberati, A., Tetzlaff, J., & Altman, D. G. (2009). Preferred reporting items for systematic reviews and meta-analyses: The PRISMA statement. Journal of Clinical Epidemiology, 62(10), 1006–1012. [Google Scholar] [CrossRef] [PubMed]
  49. Möller, A., & Schaltegger, S. (2005). The sustainability balanced scorecard as a framework for eco-efficiency analysis. Journal of Industrial Ecology, 9(4), 73–83. [Google Scholar] [CrossRef]
  50. Munn, Z., Peters, M. D., Stern, C., Tufanaru, C., McArthur, A., & Aromataris, E. (2018). Systematic review or scoping review? Guidance for authors when choosing between a systematic or scoping review approach. BMC Medical Research Methodology, 18, 1–7. [Google Scholar] [CrossRef]
  51. Neely, A., Adams, C., & Kennerley, M. (2002). The performance prism: The scorecard for measuring and managing business success. Financial Times Prentice Hall. [Google Scholar]
  52. Niven, P. R. (2002). Balanced scorecard step-by-step: Maximizing performance and maintaining results. John Wiley & Sons. [Google Scholar]
  53. Page, M. J., McKenzie, J. E., Bossuyt, P. M., Boutron, I., Hoffmann, T. C., Mulrow, C. D., Shamseer, L., Tetzlaff, J. M., Akl, E. A., Brennan, S. E., Chou, R., Glanville, J., Grimshaw, J. M., Hróbjartsson, A., Lalu, M. M., Li, T., Loder, E. W., Mayo-Wilson, E., McDonald, S., … Moher, D. (2021). The PRISMA 2020 statement: An updated guideline for reporting systematic reviews. BMJ, 372, n71. [Google Scholar] [CrossRef]
  54. Rasolofo-Distler, F. (2022). Institutional pressure and real estate balanced scorecard indicators. Sustainability Accounting, Management and Policy Journal, 13(4), 826–857. [Google Scholar] [CrossRef]
  55. Sands, J. S., Rae, K. N., & Gadenne, D. (2016). An empirical investigation on the links within a Sustainability Balanced Scorecard (SBSC) framework and their impact on financial performance. Accounting Research Journal, 29(2), 154–178. [Google Scholar] [CrossRef]
  56. Schaltegger, S., Burritt, R., Zvezdov, D., Hörisch, J., & Tingey-Holyoak, J. (2015). Management roles and sustainability information. Exploring corporate practice. Australian Accounting Review, 25(4), 328–345. [Google Scholar] [CrossRef]
  57. Schaltegger, S., Wagner, M., Schaltegger, S., Bennett, M., & Burritt, R. (2006). Chapter 30 managing sustainability performance measurement and reporting in an integrated manner. Springer. [Google Scholar]
  58. Shields, J., & Shelleman, J. M. (2015). SBI 2015 conference best applied paper awarded by the Small Business Institute® integrating sustainability into sme strategy. Journal of Small Business Strategy, 25(2), 59–78. [Google Scholar]
  59. Silva, A. F., & Silva, A. M. (2019). Contabilidade de gestão nos hospitais: Uma revisão sistemática da literatura (2014–2019). In Em memória de João Carvalho. In Estudos sobre Contabilidade, Finanças e Políticas Públicas Área Editora (pp. 73–90). [Google Scholar]
  60. Stalmachova, K., Chinoracky, R., & Strenitzerova, M. (2022). Changes in business models caused by digital transformation and the COVID-19 pandemic and possibilities of their measurement—Case study. Sustainability, 14(1), 127. [Google Scholar] [CrossRef]
  61. Stavropoulou, E., Spinthiropoulos, K., Ragazou, K., Papademetriou, C., & Passas, I. (2023). Green balanced scorecard: A tool of sustainable information systems for an energy efficient business. Energies, 16(18), 6432. [Google Scholar] [CrossRef]
  62. Vărzaru, A. A. (2022). An empirical framework for assessing the balanced scorecard impact on sustainable development in healthcare performance measurement. International Journal of Environmental Research and Public Health, 19(22), 15155. [Google Scholar] [CrossRef] [PubMed]
  63. Zhang, Y., Zeng, H., Zhou, H., Li, J., Wang, T., Guo, Y., Cai, L., Hu, J., Zhang, X., & Chen, G. (2023). Predicting the outcome of patients with aneurysmal subarachnoid hemorrhage: A machine-learning-guided scorecard. Journal of Clinical Medicine, 12(22), 7040. [Google Scholar] [CrossRef] [PubMed]
  64. Zhu, J., & Liu, W. (2020). A tale of two databases: The use of Web of Science and Scopus in academic papers. Scientometrics, 123(1), 321–335. [Google Scholar] [CrossRef]
Figure 1. Sample selection process (PRISMA). Note: Figure 1 presents the PRISMA flow diagram (Page et al., 2021) applied to our initial sample collected from the WoS database using a combination of terms, namely, “BSC or Balanced Scorecard” AND “Sustainability”, for the timespan of 2000–2024. Source: Authors based on (Page et al., 2021).
Jrfm 18 00324 g001
Figure 2. Annual scientific production (2000:2024). Note: Figure 2 presents the annual production for our final sample of 247 documents collected from the WoS database using a combination of terms, namely, “BSC or Balanced Scorecard” AND “Sustainability”, for the timespan of 2000–2024. Source: Bibliometrix and Biblioshiny R package output.
Jrfm 18 00324 g002
Figure 3. Authors’ production over time (2000:2024). Note: Figure 3 presents the authors’ production over time for our final sample of 247 documents collected from the WoS database using a combination of terms, namely, “BSC or Balanced Scorecard” AND “Sustainability”, for the timespan of 2000–2024. Source: Bibliometrix and Biblioshiny R package output.
Jrfm 18 00324 g003
Figure 4. Cooperation network between universities (2000:2024). Note: Figure 3 presents the cooperation network between institutions for our final sample of 247 documents collected from the WoS database using a combination of terms, namely, “BSC or Balanced Scorecard” AND “Sustainability”, for the timespan of 2000–2024. Source: Bibliometrix and Biblioshiny R package output.
Jrfm 18 00324 g004
Figure 5. Most locally cited sources (2000:2024). Note: Figure 5 presents the most locally cited publication sources for our final sample of 247 documents collected from the WoS database using a combination of terms, namely, “BSC or Balanced Scorecard” AND “Sustainability”, for the timespan of 2000–2024. Source: Bibliometrix and Biblioshiny R package output.
Jrfm 18 00324 g005
Figure 6. Sources’ local impact (2000:2024). Source: Bibliometrix and Biblioshiny R package output.
Jrfm 18 00324 g006
Figure 7. Corresponding authors’ countries (2000:2024). Note: Figure 7 presents the corresponding authors’ countries of origin for our final sample of 247 documents collected from the WoS database using a combination of terms, namely, “BSC or Balanced Scorecard” AND “Sustainability”, for the timespan of 2000–2024. Source: Bibliometrix and Biblioshiny R package output.
Jrfm 18 00324 g007
Figure 8. Thematic map (2000:2024). Note: Figure 8 presents a strategic thematic map for our final sample of 247 documents collected from the WoS database using a combination of terms, namely. “BSC or Balanced Scorecard” AND “Sustainability”, for the timespan of 2000–2024. Source: Bibliometrix and Biblioshiny R package output.
Jrfm 18 00324 g008
Figure 9. Publication cluster (2000:2024). Note: Figure 9 presents research clusters for our final sample of 247 documents collected from the WoS database using a combination of terms, namely, “BSC or Balanced Scorecard” AND “Sustainability”, for the timespan of 2000–2024. Source: CiteSpace output.
Jrfm 18 00324 g009
Figure 10. Cluster characterization (2000:2024). Note: Figure 10 presents research cluster evolution for our final sample of 247 documents collected from the WoS database using a combination of terms, namely, “BSC or Balanced Scorecard” AND “Sustainability”, for the timespan of 2000–2024. Source: CiteSpace output.
Jrfm 18 00324 g010
Table 1. Inclusion and exclusion criteria used in the screening process.
Screening StageDescription
IdentificationWeb of Science (WoS) database
Abstract field: included “Balanced Scorecard OR BSC” AND “Sustainability”
Initial filteringType: excluding editorials and revisions
Relevance: excluding articles due to acronym mismatches (e.g., biomass supply chain, blockchain smart contracts)
Title screeningTitles: excluding articles focused on unrelated fields (e.g., engineering, education, biological sciences) or those that used the BSC in irrelevant contexts
Abstract screeningAbstracts were reviewed to determine if the article addressed the sustainability dimension within the balanced scorecard framework.
Inclusion criteriaArticles were included if they (1) addressed the integration of sustainability (environmental, social, governance) into the BSC framework, (2) were published between 2000 and 2024, and (3) were articles or proceedings papers.
Exclusion criteriaArticles were excluded if they did not address the SBSC concept explicitly or conceptually, used the BSC acronym in unrelated contexts, or focused on general performance measurements without specific reference to SBSCs.
Final inclusionOverall, 247 articles were included in the final review after applying all criteria.
Note: this table presents the step-by-step screening and selection process employed in accordance with PRISMA guidelines for our sample.
Table 2. Dataset description.
Main Information About Data
Timespan2000:2024
Sources (journals, conference proceedings)160
Documents247
Annual growth rate %14.35
Document average age5.66
Average citations per doc21.91
Average citations per year per doc3.211
References1
Document types
Article183
Article: early access5
Proceedings: paper49
Review articles10
Document contents
Keywords plus (id)512
Author’s keywords (de)847
Authors
Authors747
Author appearances808
Authors of single-authored docs30
Authors collaboration
Single-authored docs30
Documents per author0.331
Co-authors per doc3.27
International co-authorships %24.29
Note: this table presents the descriptive statistics for our final sample of 247 documents collected from the WoS database using a combination of terms, namely, “BSC or Balanced Scorecard” AND “Sustainability”, for the timespan of 2000–2024. Source: Bibliometrix R package output.
Table 3. Twenty most successful authors.
h_indexg_indexm_indexTCNPPY_start
Hubbard, G110.0625000043812009
Schaltegger, S550.2500000033652005
Di Vaio, A330.4285714321632018
Varriale, L330.4285714321632018
Tseng, Ml220.2000000015222015
Chang, Ay110.1250000014012017
Hansen, Eg220.2222222214022016
Hsu, Ch110.1250000014012017
Luo, W110.1250000014012017
Costa, R110.0833333313312013
Menichini, T110.0833333313312013
Chou, WC110.0625000012612009
Hsu, W110.0625000012612009
Tsai, WH110.0625000012612009
Rabbani, A110.0909090912112014
Yazdani-Chamzini, A110.0909090912112014
Zamani, M110.0909090912112014
Zavadskas, EK110.0909090912112014
Möller, A110.0500000011512005
Kraslawski, A110.1428571410812018
Note: this table presents the most successful authors, ranked by h-index, g-index, m-index, and total citations, of our final sample of 247 documents collected from the WoS database using a combination of terms, namely, “BSC or Balanced Scorecard” AND “Sustainability”, for the timespan of 2000–2024. Source: Bibliometrix R package output.
Table 4. Twenty most cited papers.
PaperDOITCTCperYearNTC
1HUBBARD G, 2009, Bus. Strategy Environ.10.1002/bse.56443827.383.829
2HSU CH, 2017, J. Clean. Prod.10.1016/j.jclepro.2017.05.06314017.504.859
3COSTA R, 2013, Expert Syst. Appl.10.1016/j.eswa.2012.07.02813311.082.918
4TSAI WH, 2009, J. Oper. Res. Soc.10.1057/jors.2008.911267.881.101
5RABBANI A, 2014, Expert Syst. Appl.10.1016/j.eswa.2014.05.02312111.002.966
6MÖLLER A, 2005, J. Ind. Ecol.10.1162/1088198057752479271155.751.000
7QORRI A, 2018, J. Clean. Prod.10.1016/j.jclepro.2018.04.07310815.432.873
8LU MT, 2018, J. AIR Transp. Manag.10.1016/j.jairtraman.2018.05.00810414.862.767
9HSU CW, 2011, Expert Syst. Appl.10.1016/j.eswa.2011.04.0821007.144.181
10TSENG ML, 2015, Ind. Manag. \& DATA Syst.10.1108/IMDS-10-2014-0319989.803.965
11AGRAWAL S, 2016, Resour. Conserv. Recycl.10.1016/j.resconrec.2016.01.0049610.672.801
12KANG JS, 2015, Int. J. Hosp. Manag.10.1016/j.ijhm.2015.05.001949.403.803
13SINGH S, 2018, J. Intell. Manuf.10.1007/s10845-015-1081-19213.142.447
14DI VAIO A, 2018, SUSTAINABILITY10.3390/su100307839012.862.394
15DI VAIO A, 2018, Energy Policy10.1016/j.enpol.2018.07.0468712.432.314
16TUNG A, 2011, Int. J. Oper. \& Prod. Manag.10.1108/01443571111187457876.213.638
17ROSCHANGAR F, 2017, GREEN Chem.10.1039/c6gc02901a8510.622.950
18HANSEN EG, 2016, J. Bus. ETHICS10.1007/s10551-014-2340-3839.222.421
19RAUT R, 2017, Bus. Strategy Environ.10.1002/bse.1946769.502.638
20MIO C, 2022, Corp. Soc. Responsib. Environ. Manag.10.1002/csr.22067424.678.125
Note: this table presents the most cited papers in our final sample of 247 documents collected from WoS database using a combination of terms, namely, “BSC or Balanced Scorecard” AND “Sustainability”, for the timespan of 2000–2024. Source: Bibliometrix R package output.
Table 5. Twenty most productive authors.
AuthorsArticlesAuthorsArticles Fractionalized
1Schaltegger, S.5Schaltegger, S.2.200
2Dincer, H.4Chalmeta, R.1.500
3Yuksel, S.4Di Vaio, A.1.333
4Chalmeta, R.3Heebkhoksung, K.1.333
5Di Vaio, A.3Varriale, L.1.333
6Jassem, S.3Dincer, H.1.167
7Kant, R.3Yuksel, S.1.167
8Varriale, L.3Kant, R.1.083
9Zakaria, Z.3Al-Mawali, H.1.000
10Agrawal, S.2Arnold, M.1.000
11Ali, H.M.2Awadallah, E.1.000
12Ali, S.M.2Baumgartner, R.1.000
13Alvarez-Perez, C.2Bui, T.D.1.000
14Ayodele, L.A.2Chikutuma, C.N.1.000
15Barbosa, M.2Cleaves, G.W.1.000
16Barbosa, S.B.2Dimitropoulos, P.E.1.000
17Che-Azmi, A.2Domanovic, V.1.000
18Cheikhrouhou, N.2Dvorakova, L.1.000
19De Amorim, W.S.2Eklund, M.A.1.000
20Deng, D.2Elbanna, S.1.000
Note: this table presents the most productive authors of our final sample of 247 documents collected from WoS database using a combination of terms, namely, “BSC or Balanced Scorecard” AND “Sustainability”, for the timespan of 2000–2024. Source: Bibliometrix R package output.
Table 6. Authors’ affiliations.
AffiliationArticles
1Univ Naples Parthenope11
2Istanbul Medipol Univ9
3Univ Malaya9
4Qatar Univ7
5Democritus Univ Thrace6
6Islamic Azad Univ6
7Univ Oviedo6
8Delhi Technol Univ5
9Leuphana Univ Luneburg5
10Natl Taipei Univ Technol5
11Univ Lueneburg5
12Univ New Brunswick5
13Univ Roma Tor Vergata5
14Univ Southern Santa Catarina Unisul5
15Univ Tehran5
16Vilnius Gediminas Tech Univ5
17Al Zahra Coll Women4
18Azerbaijan State Univ Econ Unec4
19Bangladesh Univ Engn and Technol4
20Int Islamic Univ Malaysia4
Note: this table presents the most productive institutions based in author affiliations for our final sample of 247 documents collected from the WoS database using a combination of terms, namely, “BSC or Balanced Scorecard” AND “Sustainability”, for the timespan of 2000–2024. Source: Bibliometrix R package output.
Table 7. The institutions with the highest centrality index.
NodeClusterBetweennessClosenessPageRank
Univ Malaya120.250.093
Islamic Azad Univ120.250.07
Vilnius Gediminas Tech Univ100.1670.04
Al Zahra Coll Women100.1670.063
Natl Chiao Tung Univ200.3330.051
Chinese Culture Univ210.50.097
Nanjing Univ Sci and Technol200.3330.051
Univ Southern Santa Catarina Unisul300.3330.065
Shanghai Univ300.3330.038
Univ Cambridge310.50.097
Istanbul Medipol Univ400.50.074
Azerbaijan State Univ Econ Unec400.50.074
Marmara Univ400.50.052
Bucharest5010.067
Bucharest Univ Econ Studies5010.067
Note: this table presents the most successful institutions, ranked by h-index, for our final sample of 247 documents collected from the WoS database using a combination of terms, namely. “BSC or Balanced Scorecard” AND “Sustainability”, for the timespan of 2000–2024. Source: Bibliometrix R package output.
Table 8. Ten most relevant sources.
SourcesArticles
Sustainability34
Journal of Cleaner Production17
International Journal of Productivity and Performance Management5
Journal of Business Ethics5
Sustainability Accounting Management and Policy Journal5
Expert Systems with Applications4
Business Strategy and the Environment3
Sustainable Development3
Benchmarking—An International Journal2
Cleaner Logistics and Supply Chain2
Note: this table presents the most relevant publication sources for our final sample of 247 documents collected from the WoS database using a combination of terms, namely, “BSC or Balanced Scorecard” AND “Sustainability”, for the timespan of 2000–2024. Source: Bibliometrix R package output.
Table 9. CiteSpace clustering structure.
Cluster IDSizeSilhouetteMean (Year)Main TermTop Terms (Log-Likelihood Ratio, p-Level)
0510.8232016Performance EvaluationPerformance evaluation (6.37, 0.05); Corporate sustainability (5.36, 0.05); Sustainability balanced scorecard knowledge (4.03, 0.05); Corporate environmental management (3.75, 0.1); Digital innovation (3.75, 0.1)
1460.7592013Sustainability balanced scorecardSustainability balanced scorecard (19.48, 1.0 × 10⁻⁴); Balanced scorecard (14.46, 0.001); MCDM (7.65, 0.01); Sustainable development (4.72, 0.05); AHP (3.43, 0.1)
2410.7272017Small businessSmall business (8.75, 0.005); Green supply chain management (8.75, 0.005); Sustainable management (8.75, 0.005); BSC (6.89, 0.01); Performance evaluation (5.73, 0.05)
Source: CiteSpace output. Note: Size-number of words per cluster.
Disclaimer/Publisher’s Note: The statements, opinions and data contained in all publications are solely those of the individual author(s) and contributor(s) and not of MDPI and/or the editor(s). MDPI and/or the editor(s) disclaim responsibility for any injury to people or property resulting from any ideas, methods, instructions or products referred to in the content.

