Article

Spillovers Among the Assets of the Fourth Industrial Revolution and the Role of Climate Uncertainty

1
Department of Finance, King Saud University, Riyadh 11451, Saudi Arabia
2
College of Business, Imam Mohammad Ibn Saud Islamic University (IMSIU), Riyadh 11564, Saudi Arabia
*
Author to whom correspondence should be addressed.
J. Risk Financial Manag. 2025, 18(6), 316; https://doi.org/10.3390/jrfm18060316
Submission received: 16 April 2025 / Revised: 2 June 2025 / Accepted: 6 June 2025 / Published: 9 June 2025
(This article belongs to the Special Issue Innovative Approaches to Managing Finance Risks in the FinTech Era)

Abstract

:
This research investigates the spillover effects between assets of the Fourth Industrial Revolution (4IR), focusing on the role of climate policy uncertainty in shaping these interactions. Using a time-varying parameter vector autoregressive (TVP-VAR) approach and a joint connectedness method, the analysis incorporates five global indices representing key 4IR domains: the internet, cybersecurity, artificial intelligence and robotics, fintech, and blockchain. The findings reveal significant interdependencies among 4IR assets and evaluate the effect of risk factors, including climate policy uncertainty, as a critical driver of the determinants of returns. The results indicate the growing impact of climate-related risks on the structure of connectedness between 4IR assets, highlighting their implications for portfolio diversification and risk management. These insights are vital for investors and policymakers navigating the intersection of technological innovation and environmental challenges in a rapidly changing global economy.

1. Introduction

Financial integration creates connections and interdependence across financial markets (Lane & Milesi-Ferretti, 2003). It promotes economic growth and development, making capital investments and financial services seamless across international borders (Schindler, 2009). Studies of financial integration have explored the intricacies and consequences of linking financial markets throughout diverse territories and nations (S. Park, 2011). This study area looks at the effects of unification of the financial system on market efficiency, investment behavior, economic performance, and volatility spillover effects (Bonfiglioli, 2008). Financial integration promotes portfolio diversity while lowering the total portfolio risk by providing access to a larger range of markets and assets (Edison et al., 2002).
Diversifying portfolios and searching for safe-haven assets have long been recognized as essential components of investing strategy (Martin & Rey, 2000). People have always seen gold as a safe haven in turbulent times and a hedge in favorable market situations (Beckmann et al., 2015). However, changes in the use of gold for hedging and speculation might have affected its safe-haven qualities (Y. Bai & Zhang, 2012). Today, the assets of the Fourth Industrial Revolution (4IR) offer new investment opportunities amid these transformations (Ratner & Chiu, 2013).
Robots and artificial intelligence (AI) are key technologies in the 4IR (Demiralay et al., 2021). These transformative technologies are merging the digital, biological, and physical worlds, drastically altering how we work, live, and interact with one another (Huynh et al., 2020). These technologies are increasing production, efficiency, and innovation, which is changing industries (Thampanya et al., 2020).
Combined, these 4IR technologies offer a diverse portfolio of high-growth investment options that can benefit from the ongoing technological and digital revolution in the world economy (Li et al., 2021). It makes sense that robots and AI technology businesses are growing in prominence and are a viable alternative for portfolio diversification (Demiralay et al., 2021). However, it is critical to comprehend the spillover dynamics of 4IR assets to fully appreciate the diversification benefits associated with them. Spillovers are defined as the transmission of effects (positive or negative) from one financial market or asset to another (Gulzar et al., 2019).
Research has suggested that extreme risk spillovers between financial assets, metals, and currencies are greatly aggravated by climate policy uncertainty, particularly in times of market turbulence (Barnett et al., 2022; Gao et al., 2024; Hoque et al., 2023).
Climate change is one of the most urgent issues of our day, defined as primarily human-caused long-term changes in precipitation, temperature, and weather patterns (Qin et al., 2024). There has been much discussion about how climate uncertainty affects financial markets (Venturini, 2022). Giglio et al. (2021) emphasized how investor behavior and asset prices might be impacted by climate threats, which could result in more volatility and risk premiums. In their investigation of the pricing of climate-related risks in financial markets, Engle et al. (2020) found that an asset’s vulnerability to climate policy increases its volatility (Beatty & Shimshack, 2010).
Climate change alters the dynamics of investment, production, and sustainability by substantially affecting 4IR assets (Choi & Kim, 2019). AI, the Internet of Things, blockchain, and sophisticated robotics are examples of 4IR technologies (Su et al., 2020) that are becoming increasingly important as climate change increases the demand for resilient and sustainable solutions (Mhlanga, 2023).
In this context, Batten (2018) explored the efficacy of green bonds and other environmentally related financial products as hedging tools against climate risks. Using a quantile VAR technique, Pham et al. (2024) demonstrated how the interplay between 4IR assets and traditional markets intensifies in times of high climate uncertainty, with green assets being essential in risk mitigation.
By combining these two streams, studies have begun to investigate the relationship between 4IR assets and climate uncertainty. This study aims to examine the spillover effects among 4IR assets and evaluate how climate uncertainty affects these interdependent financial dynamics. Following the approach of El Khoury et al. (2023), this study measures the interactions of 4IR assets and the effect of climate uncertainty on their interconnected port order using six global-level indices (an internet index, a cybersecurity index, an artificial intelligence and robotics index, disruptive technologies indexes, fintech indexes, and a blockchain index).
The convergence of the 4IR and climate change represents a dual transformation of the global economy: technological and environmental. The technologies of the 4IR disrupt traditional industries and play an increasingly strategic role in advancing sustainable finance, clean innovation, and green infrastructure (Chen, 2017; Adekoya et al., 2022). These technologies enable smarter energy management, carbon tracking, decentralized financing for climate projects, and data-driven solutions for environmental challenges. However, the rapid evolution and integration of 4IR sectors also bring new complexities and systemic risks, especially under rising climate policy uncertainty. Investors and regulators are challenged to understand how climate-related risks ripple through innovation-driven markets. Despite the theoretical promise of 4IR assets in enabling climate solutions, there remains a critical gap in understanding how these assets behave under environmental uncertainty. This study addresses that gap by exploring how climate policy risk affects the spillover structure for 4IR assets.
This paper makes three core contributions to the literature on financial connectedness, technological innovation, and sustainable investing. First, we apply the advanced time-varying parameter vector autoregressive (TVP-VAR) model with an extended joint connectedness framework developed by Balcilar et al. (2021), allowing for a dynamic, high-resolution analysis of the systemic interlinkages among five major 4IR classes. This methodology overcomes the limitations of fixed-window VAR models. Second, we investigate the determinants of systemic risk transmission using a set of global uncertainty indicators, including CPU. This allows for a complete evaluation of how macro-level risk factors, especially environmental policy uncertainty, affect the structure of interdependence among innovative-driven financial assets. Third, the findings generate practical, forward-looking insights for investors and policymakers. By identifying which 4IR assets act as net transmitters or receivers of volatility under heightened climate uncertainty, this study offers guidance for portfolio diversification, climate-risk-aware asset allocation, and systemic risk monitoring.
The following outlines the remainder of this paper: Section 2 provides a literature review. Section 3 describes the data and methodology. Section 4 presents the findings, and Section 5 concludes.

2. The Literature Review

The extant literature has used advanced analytical approaches to exploring the complex relationships among 4IR assets. The results of these studies reveal important relationships that are strong during a crisis (Umar et al., 2021). Prior studies on technology-intensive businesses, such as clean-tech and IT firms, show greater volatility than those in assets from traditional industries (Dirican, 2015). There is evidence of interdependence, causality, and spillovers among 4IR assets. However, their links with other assets, such as clean energy stocks, technology stocks, and oil prices, differ (Sadorsky, 2012). Le et al. (2021) examined the volatility interactions between cryptocurrencies, fintech, and green bonds from November 2018 to June 2020. Using Diebold and Yılmaz (2014)’s methodology, they found high connectivity and identified the asset-specific volatility contributions and hedging potential. The research has also looked at the stocks for robotics and AI businesses, a field not yet thoroughly researched (Ortas & Moneva, 2013).
Demiralay et al. (2021) applied a wavelet coherence analysis to investigating the interdependence of AI and robotics equities with traditional and alternative assets. Their findings showed limited hedging possibilities, time-scale-dependent benefits, and higher co-movements during COVID-19, whereas government security offered safe-haven qualities at all scales. Using ARDL frameworks, Thampanya et al. (2020) investigated the asymmetric effects of gold and cryptocurrencies on the Thai stock market. After examining data from 2000 to 2019 for gold and 2013 to 2019 for bitcoin, they discovered that although cryptocurrency has a minor effect on stock returns, gold has an uneven and primarily negative impact on stock returns. These two assets show favorable correlations and cannot be used to hedge stock portfolios successfully.
Huynh et al. (2020) investigated the role of AI, robotics stocks, and green bonds. Using data from 2017 to 2020, copulas, and generalized forecast error variance decomposition, their results showed that amid economic turbulence, there are considerable joint losses and highly volatile transmissions in the short term. Umar et al. (2021) explored how the cryptocurrency market’s recovery and volatility affected international financial systems between January 2018 and March 2020. The results obtained through BEKK parameterization showed that shocks to the cryptocurrency market affect other financial markets, with high-yield bonds and stocks exhibiting long-term volatility spillovers. Khalfaoui et al. (2022) investigated shock spillovers through the US stock market, green markets, and bitcoin. Using a quantile VAR model, they concluded that there are asymmetric spillover effects, with bitcoin acting as a net receiver with strong spillover transfer in US markets and considerable contributions from green markets during downturns.
A second body of literature has addressed climate uncertainty’s role in the spillover among 4IR assets. Understanding the impact of climate risk on technological development is essential for the 4IR (Qin et al., 2024). Naifar (2024b) concluded there is a tendency toward more isolated and unique approaches to climate concerns, suggesting that increased climate policy uncertainty lowers the interdependence of sovereign default risks among the Group of 20 countries. Climate uncertainty affects changes in market volatility, asset prices, risk perceptions, and investment behavior (Xu et al., 2023).
The recent literature on technological innovation systems (TISs) emphasizes that emerging technologies do not evolve in isolation but rather as part of interdependent innovation ecosystems shaped by institutions, market forces, and policy signals (S. Park, 2011; Almpanopoulou et al., 2019). Fourth Industrial Revolution (4IR) assets—such as AI, blockchain, and fintech—are particularly prone to systemic interlinkages due to their shared dependencies on digital infrastructure, data flows, and innovation investment cycles. AI, blockchain, and fintech rely heavily on digital infrastructure, such as cloud computing and the IoT, to function effectively. These technologies are often integrated to create smart ecosystems, enhancing the automation and efficiency across industries (Nyagadza et al., 2022).
Additionally, the concept of digital financial ecosystems indeed suggests that technology-driven assets are increasingly operating within platform-based markets. This transformation is largely driven by the integration of digital platforms into the financial sector, which has led to the restructuring of traditional financial markets and the emergence of new business models. These platforms leverage technology not just to enhance competitiveness but to fundamentally alter market dynamics, often resulting in increased centralization and the creation of digital monopolies or oligopolies. Digital Asset Management Platforms (DAMPs) are reshaping asset management by providing services such as index fund and ETF provision, robo-advising, and analytics and trading support. These platforms restructure markets by centralizing services and creating a winner-takes-all scenario, which contrasts with the expected technological decentralization (Haberly et al., 2019).
On the climate side, recent theoretical contributions in climate finance indicate how climate policy uncertainty (CPU) influences asset pricing, volatility, and inter-market transmission channels (Naifar, 2024a; Ji et al., 2024). CPU can lead to increased investment in green innovation. For instance, in China, CPU has been found to positively correlate with investment in corporate innovation, particularly in the renewable energy industry and state-owned enterprises. This is attributed to government regulations pushing companies towards cleaner production and optimistic market expectations encouraging a shift to green development models (Zhu et al., 2023; D. Bai et al., 2023). These mechanisms provide a theoretical basis for analyzing the amplifying effect of climate uncertainty on the connectedness of 4IR assets.
As 4IR assets increasingly operate in globally integrated markets, financial integration becomes a critical factor in amplifying spillovers and inter-asset dependencies (Edison et al., 2002; C. Y. Park & Lee, 2011). In this context, portfolio diversification theory provides a foundational lens through which to evaluate risk mitigation strategies for technology-heavy portfolios (Martin & Rey, 2000; Y. Bai & Zhang, 2012).
The concept of spillovers itself is rooted in theories of contagion and financial interdependence, which posit that shocks are transmitted through trade, institutional, and behavioral channels (Allen & Gale, 2000; Frischmann & Lemley, 2007; Liu et al., 2017). These dynamics become even more pronounced in the context of globalized finance, where economic disturbances in major economies can quickly ripple through financial systems via cross-border investment flows and trade linkages (Eckert, 2020; Döring & Schnellenbach, 2006).
The body of knowledge about 4IR resources is growing quickly. The 4IR for which the greatest amount of research is accessible is cryptocurrency (Bouri et al., 2018; Malhotra & Gupta, 2019). Studies on the most researched cryptocurrency, bitcoin, have revealed that it is extremely volatile and exhibits inconsistent relationships with conventional assets (Bouri et al., 2017; Dwyer, 2015). Although some studies have demonstrated their strong relationships with assets like gold and oil prices, others suggested cryptocurrencies can act as safe havens and hedges and provide diversification benefits (Symitsi & Chalvatzis, 2019).

3. Data and Methodology

3.1. The Data

This study evaluates the interconnectedness of 4IR assets by examining five global indices: the internet index (QNET), the cybersecurity index (NQCYBR), the artificial intelligence and robotics index (NQROBO), fintech (STXFTV), and the blockchain index (RSBLCN). Table 1 describes all the indexes selected and their abbreviations. For this purpose, we collect the daily closing prices for all six indexes and calculate the continuously compounded daily returns by taking the logarithmic difference between two consecutive prices. We consider seven important risk indicators: CPU (climate policy uncertainty) is a monthly index measuring the uncertainty in climate policy (e.g., carbon regulation, renewable incentives). EPU (economic policy uncertainty) is the U.S. economic policy uncertainty index (Baker et al., 2016), and GPR (geopolitical risk) captures global political tensions (e.g., wars, terrorism). OVX (the Oil Volatility Index) measures the expected uncertainty in oil prices. TPU (Trade Policy Uncertainty) is an index of uncertainty related to trade policies (tariffs, trade wars). VIX (the Stock Market Volatility Index) measures the market’s expectation of the 30-day volatility in the S&P 500. WHCE (WilderHill Clean Energy Index) is a proxy for the clean-tech sector; higher values indicate a stronger clean energy stock market. Our research uses a daily dataset spanning the pre-COVID period, the onset of the COVID-19 pandemic, and the period following the Russian invasion of Ukraine, covering 1 January 2017 to 30 April 2023. The data are sourced from the Bloomberg database, Investing.com, and PolicyUncertainty.com. Table 1 outlines the indices employed in the study, including their abbreviations, definitions, and data sources.
As shown in Table 2, all of the examined indices exhibit positive average returns. The cybersecurity index demonstrates the most important mean return (0.053%); however, the artificial intelligence and robotics index has the lowest mean return (0.023%). The internet index has a greater level of risk than that of all other indexes, as the internet’s variance was the highest during the period studied, followed by that of the cybersecurity index. On the other hand, the artificial intelligence and robotics index is the most stable of all. The Jarque–Bera test statistics for all series are significant in the sense that the null hypothesis of normality is rejected in each case. Also, all variables have consistently negative skewness over the sample, and their kurtosis values are above 3, indicating asymmetry and heavy tails in return distributions.
To examine the factors influencing the total connectedness spillovers among 4IR innovation assets, we included key indices such as climate policy uncertainty (CPU), economic policy uncertainty (EPU), geopolitical risk (GPR), the Oil Volatility Index (OVX), Trade Policy Uncertainty (TPU), the Stock Market Volatility Index (VIX), and the WilderHill Clean Energy Index (WHCE).

3.2. The Research Methodology

This study applies the approach from Balcilar et al. (2021) using the time-varying parameter vector autoregression (TVP-VAR) model with a joint connectedness approach to identify the relationships among five indices, which include the internet index (QNET), the cybersecurity index (NQCYBR), the artificial intelligence and robotics index (NQROBO), the fintech index (STXFTV), and the blockchain index (RSBLCN). Lastrapes and Wiesen (2021) used the joint connectedness approach to enhance Diebold and Yılmaz’s (2009, 2012, 2014) conventional spillover method, which was limited by its reliance on arbitrarily chosen rolling window sizes. Balcilar et al. (2021) refined this by developing a TVP-VAR-based extended joint connectedness method, synthesizing previous insights.

3.2.1. The TVP-VAR Model and GFEVD

Let y t = y 1 t , y 2 t , , y k t T denote a K × 1 vector of the log-returns of the selected 4IR asset indices at time t. The TVP-VAR(p) model is specified as
y t = i = 1 p A i . t y t i + ε t , ε t N 0 , Σ t
where A i . t are time-varying coefficient matrices of size K × k , ε t is a vector of innovations, and Σ t is a time-varying positive-definite covariance matrix of the residuals.
To examine the structure of dynamic connectedness, we employ generalized forecast error variance decomposition (GFEVD), as proposed by Pesaran and Shin (1998). GFEVD quantifies the proportion of the H-step-ahead forecast error variance in variable i that can be attributed to shocks in variable j, without requiring orthogonalization of the shocks. Let ϑ i , t H denote the contribution of variable j to the variance in the forecast errors for variable i at horizon H. To support the derivation of joint connectedness measures, we define the H-step-ahead variance in the forecast error for variable i at time t as
ϑ i , t H = h = 0 H 1 e i A h , t Σ t A h , t e i
To derive this variance term, the TVP-VAR model is transformed into its moving average (MA) representation. In this context, A h , t denotes the h-step-ahead moving average coefficient matrix, which is recursively derived from the time-varying autoregressive coefficients A i . t in Equation (1), and e i is a selection vector with 1 in the i-th position and 0s elsewhere. This variance term ϑ i , t H serves as the baseline measure used to compute the contribution of the other variables to the volatility in variable i, as detailed in the joint connectedness Equation (3) below.

3.2.2. The Joint Connectedness Approach

The joint connectedness framework utilizes sum normalization, which is based on the R2 goodness-of-fit criterion by Balcilar et al. (2021). Consequently, the directional pairwise spillover is net-measured as S i , t j n t . f r o m . The joint connectedness approach is defined as follows:
S i , t j n t . f r o m = E ϑ i , t 2 H E ϑ i , t H ϑ i , t H | i , t + 1 , , i , t + H ] 2 E ϑ i , t 2 H
= h = o H 1 e i A h t t M i ( M t t M t ) 1 M t t A h t e i h = o H 1 e i A h t t A h t e i
This equation describes the contribution to the H-step variance in the forecast error for variable i from joint conditioning on the future shocks to all variables except i. In this context, Mi denotes a rectangular matrix with the dimensions K × K − 1, and 1 denotes the ith column. Additionally,       i ,   t + 1 Represents a K−1 K−1-dimensional vector of the shocks at time t + 1 affecting all variables other than i. The joint total connectedness index is defined as follows:
j T C I t   = 1 K   i = 1 K S i , t j n t . f r o m
This equation suggests that the value should lie within the range of zero to one; however, discrepancies emerge when applying the methodologies proposed by Chatziantoniou et al. (2021).

3.2.3. The Extended Joint Connectedness Approach

The essential aim is to determine the equivalence of the scaled generalized forecast error variance decomposition gTClji,t in the framework of the joint connectedness approach ( j T C I j i , t ), which meets the following conditions:
S i , t j n t . f r o m = j = 1 , i j K j T C I j i , t  
S j , t j n t , n e t = S i , t j n t , t o S i , t j n t , f r o m
S i j , t j n t , n e t = j T C I j i , t j n t , t o j T C I i j , t j n t , f r o m

3.2.4. The Impact of Climate Uncertainty on Return Spillovers

We explore the consequences of climate policy uncertainty for the total index return spillover as follows:
j T C I t = β 0 + β C P U C P U t + C o n t r o l s t + ε t
where jTCIt signifies the joint total connectedness index calculated using Equation (4) and CPU indicates the climate policy uncertainty. Controls represents the control variables.

4. Empirical Results and Discussion

4.1. The Results on the Averaged Joint Connectedness

The mean results concerning the interlinkages of all indices among themselves as perceived by the network are presented in Table 3. In this table, the diagonal elements represent the volatility in each index attributable to its shocks. Meanwhile, the off-diagonal elements summarize the contribution of an index to the volatility of others (FROM) and the contribution of others to the volatility of this index (TO). Table 3 details the contribution of every individual index to the variance in the forecast error for an index in the rows, with the columns indicating the impact of one specific market type on all other markets individually. The total connectedness (TC) index is determined by dividing the sum of the off-diagonal elements by the overall sum of all elements, including both diagonal and off-diagonal values. Furthermore, the net connectedness is calculated as the difference between the sum of off-diagonal elements in each column and the sum of those in each row.
The estimated total connectedness index (TCI), reflecting the overall network connectedness, averages at a high 81.34%, indicating the strong interdependence among the indices throughout the sample period. The NET value, calculated as the difference between the TO and FROM values, reveals each index’s role within the network. A positive NET value identifies an index as a connectedness transmitter, while a negative value indicates it as a receiver. The net spillovers are positive for all indexes except NQCYBR and RSBLCN, indicating that these two indexes act as net receivers, being more influenced by other markets than they influence them. These results are consistent with the previous empirical findings of El Khoury et al. (2023). In contrast, the remaining indices are net transmitters of spillovers. A closer analysis of the NET values shows that fintech is the leading net transmitter, with a value of 1.02%, followed by the internet (0.95%) and artificial intelligence and robotics (0.10%). On the other hand, blockchain and cybersecurity emerge as the primary net receivers, with NET values of −1.30% and −0.76%, respectively. The TO and FROM values further confirm the dominant position of artificial intelligence and robotics as the largest transmitter and receiver of return connectedness within the system, transmitting 84.38% and receiving 84.28% of the connectedness spillover on average. The internet ranks second, with its TO and FROM values averaging 83.28% and 82.34%, respectively. Overall, the results on static connectedness underscore a high level of integration and pronounced spillover effects among the selected indices.
The average connectedness results may obscure the impact of individual incidents or major shocks on interconnectedness; therefore, to understand the variations among indexes better, particularly under different market conditions and extreme events, we focus on the dynamic connectedness results.

4.2. The Dynamic Total Connectedness

Figure 1 illustrates the variation in the dynamic total connectedness across indexes throughout the sample period. The TCI values exhibit significant variation across our studied sample period. The TCI shows relatively high values at certain points early in the sample period but tends to decline, stabilizing at lower levels during the 2020–2021 period. The TCI figures from 2017 to late 2019 remained relatively stable, fluctuating slightly between approximately 82% and 85%. This index hit an all-time high of 95% in 2020 due to worldwide COVID-19 infections. These findings align with prior research by Disli et al. (2021), which similarly observed heightened volatility during crises, followed by a gradual decrease over time. The TCI exhibits a decreasing trend, reaching its lowest point of approximately 65% at the end of 2021. Higher TCI values, indicating greater contagion between various market types, were observed only briefly following the initial emergence of the COVID-19 pandemic. Balcilar et al. (2021) also observed similar patterns, where the total connectedness increased dramatically at the beginning of the pandemic. According to Ha et al. (2022), the connectedness increased remarkably, reaching a notably high level by the time the COVID-19 pandemic started in early 2020, and the peak connectedness represented about a 50% increase. The Russian invasion of Ukraine caused a further rise in their connectedness, reaching approximately 80% by the end of the period. These findings underscore the crisis effect and align with the concept of market contagion, where crises drive significant increases in connectedness.

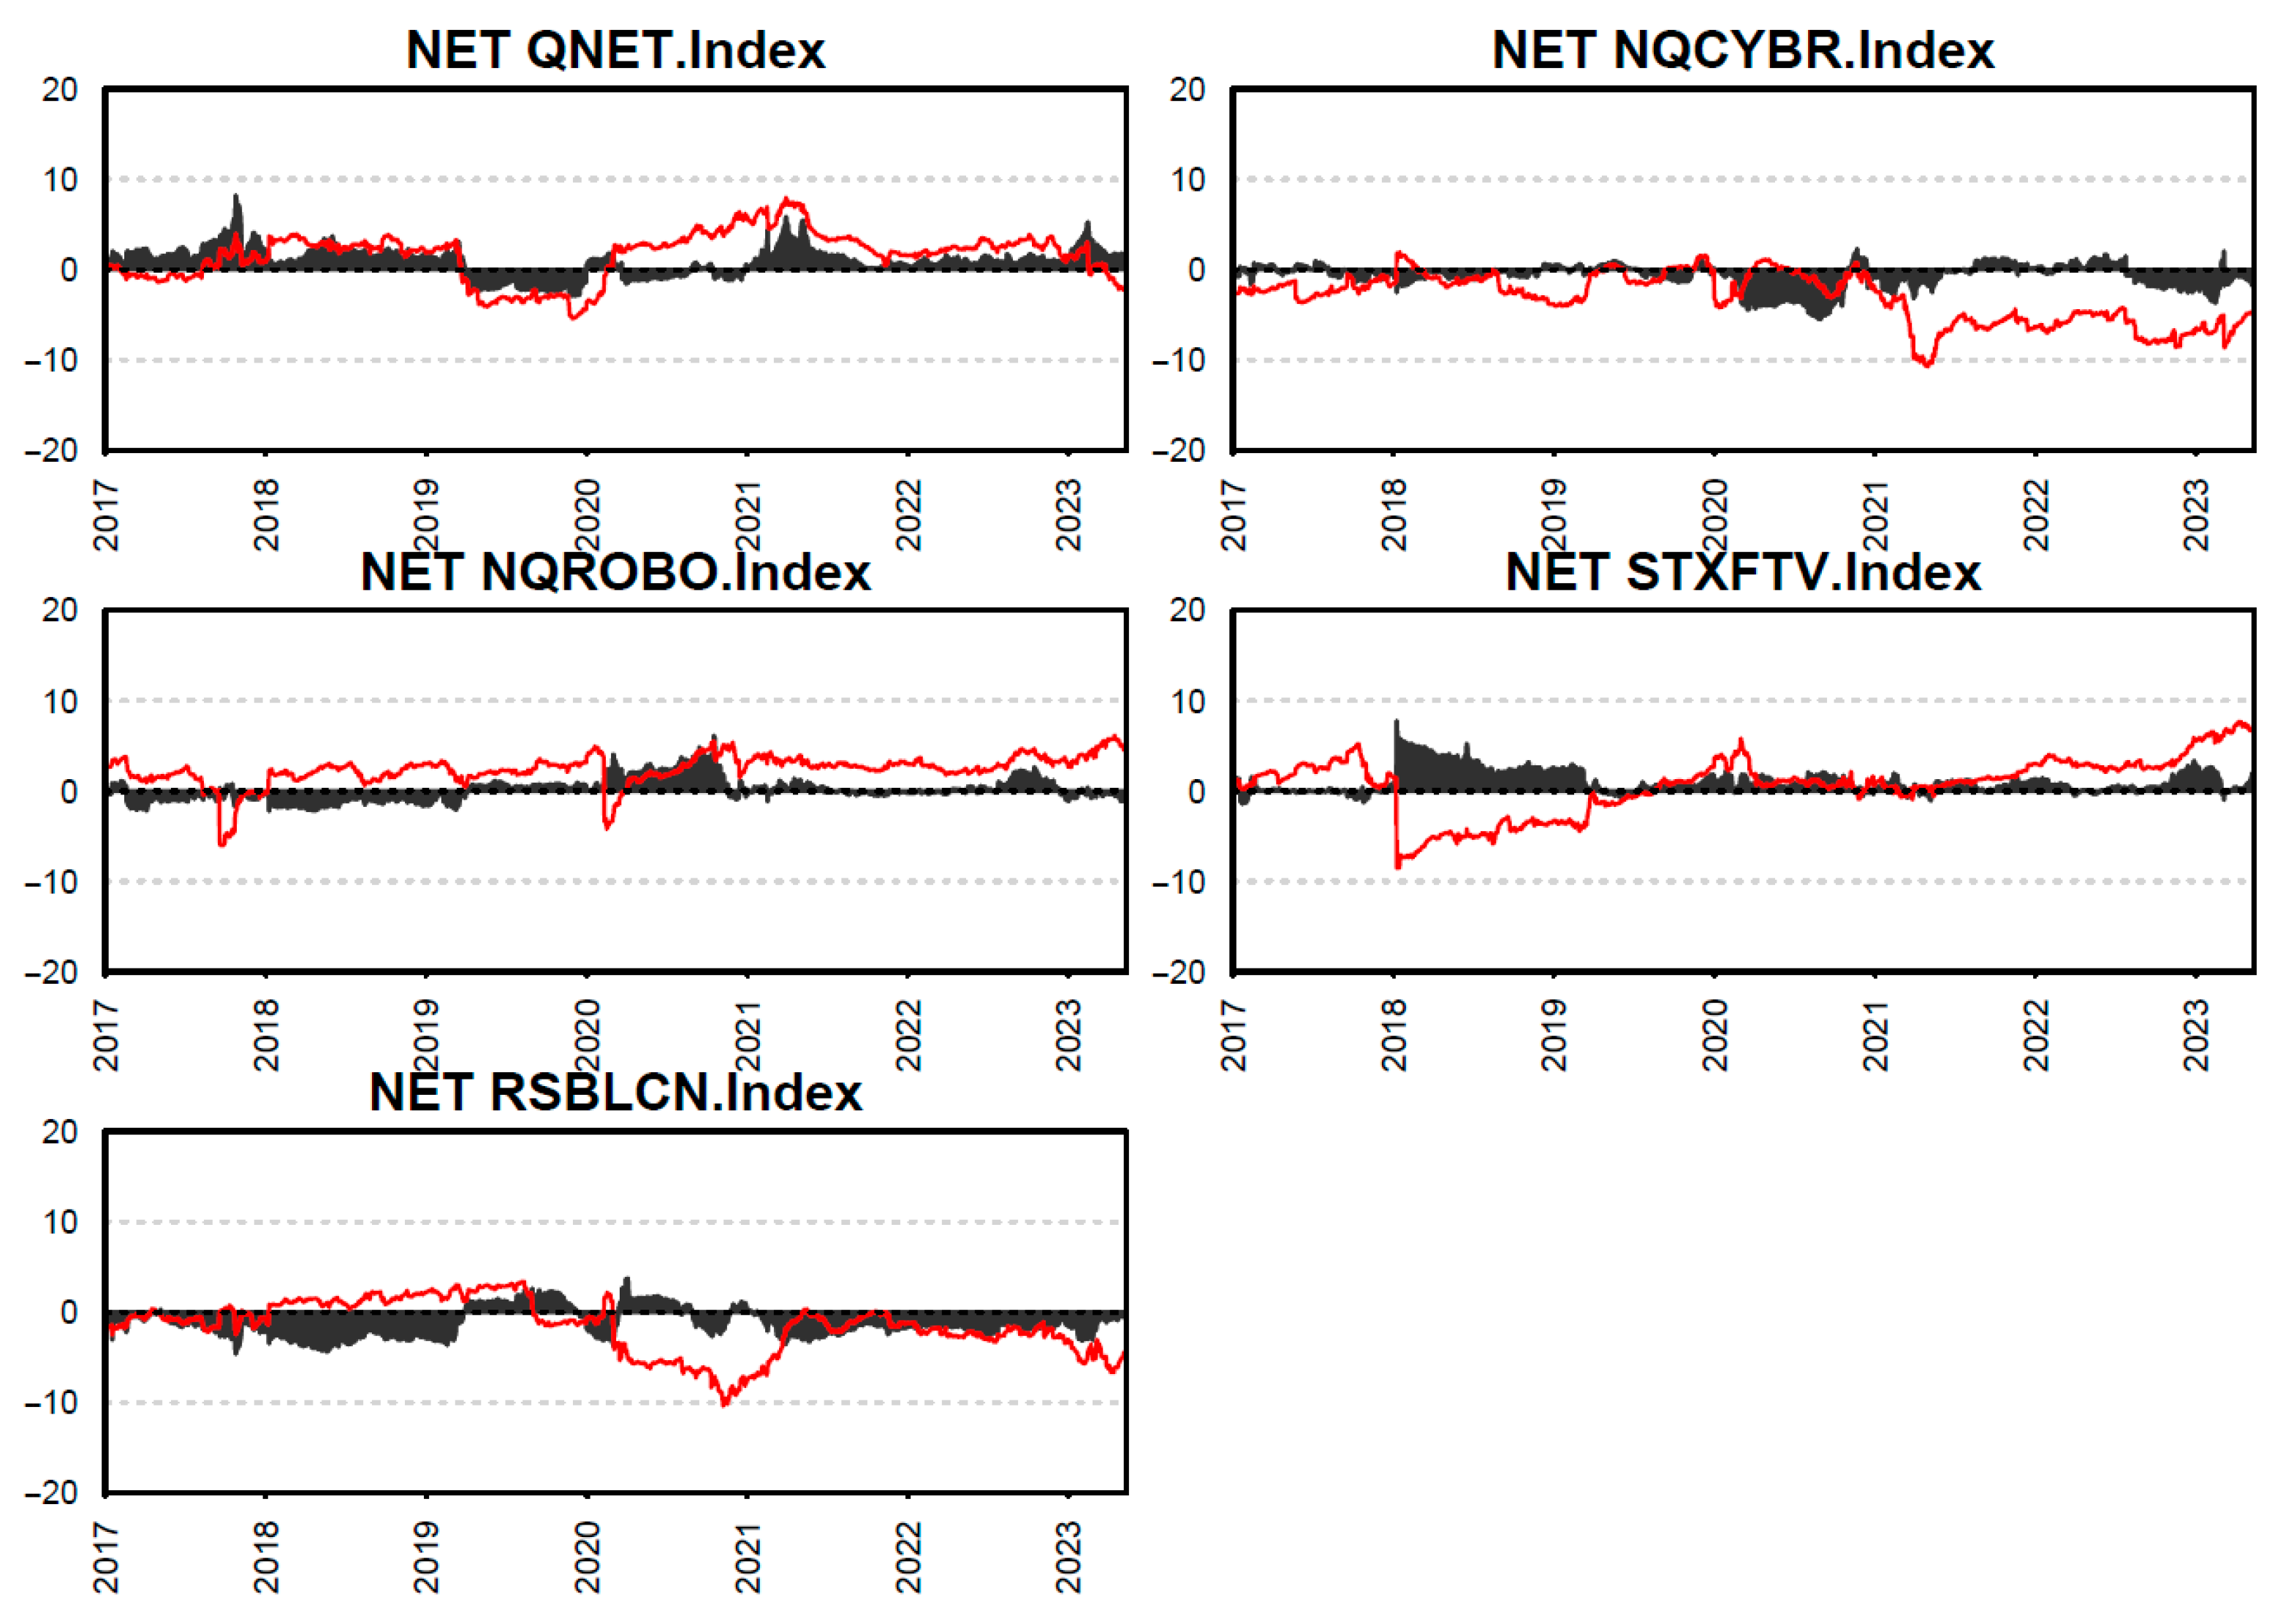
4.3. The Net Total Directional Connectedness

The next analysis focuses on the net connectedness results, which enable the classification of a typical market as either a net shock transmitter or receiver. Unlike the earlier static classification, the current dynamic approach allows us to observe the changes in each market’s role over time. In other words, whether a specific market acts as a net shock transmitter or receiver within the system depends on the period and the particular types of markets in the network studied. Our study begins with an analysis of the net total connectedness, which helps identify variations in a market’s role across different periods. Aligned with the primary findings discussed earlier, the results reveal in Figure 2 that both the blockchain and cybersecurity indexes consistently function as net contagion shock receivers. This indicates that the cybersecurity index and the blockchain index tend to be more reactive than proactive in their response to external shocks. These findings align with the earlier empirical results of El Khoury et al. (2023), which emphasized that the cybersecurity index predominantly acts as a receiver of shocks. Additionally, fintech consistently emerges as a key net shock transmitter throughout the period. This underscores the fintech index’s ability to transmit external shocks to other markets, possibly due to its innovative traits. In contrast, the internet’s role is evolving. The internet acted as a critical net shock transmitter during the pre-COVID-19 pandemic period, shifted to an important net receiver in the 2019–2020 period, and reverted to being a net shock transmitter when the COVID-19 pandemic impacted the globe, maintaining this role until the end of the period studied. Additionally, during the Russian–Ukrainian war, the internet index emerges as a net transmitter, likely due to the war’s potential effects on the online and digital industries, which are closely linked to the internet index. A similar observation is reported in the study by Balcilar et al. (2021), which noted a significant new peak in the total connectedness values as a result of the COVID-19 crisis. The AI and robotics index plays a fluctuating role, alternating between being a net transmitter and a net receiver. It functioned as a net receiver from 2017 to 2020, but in more recent years, particularly during 2020–2021 and the Russian–Ukrainian war, it has shifted to become a net transmitter. This shift may be attributed to the potential impact of the COVID-19 pandemic and the war on rapidly growing industries that are more susceptible to crises. Figure 2 illustrates the evolution of the net total connectedness among 4IR assets from 2017 to 2023.

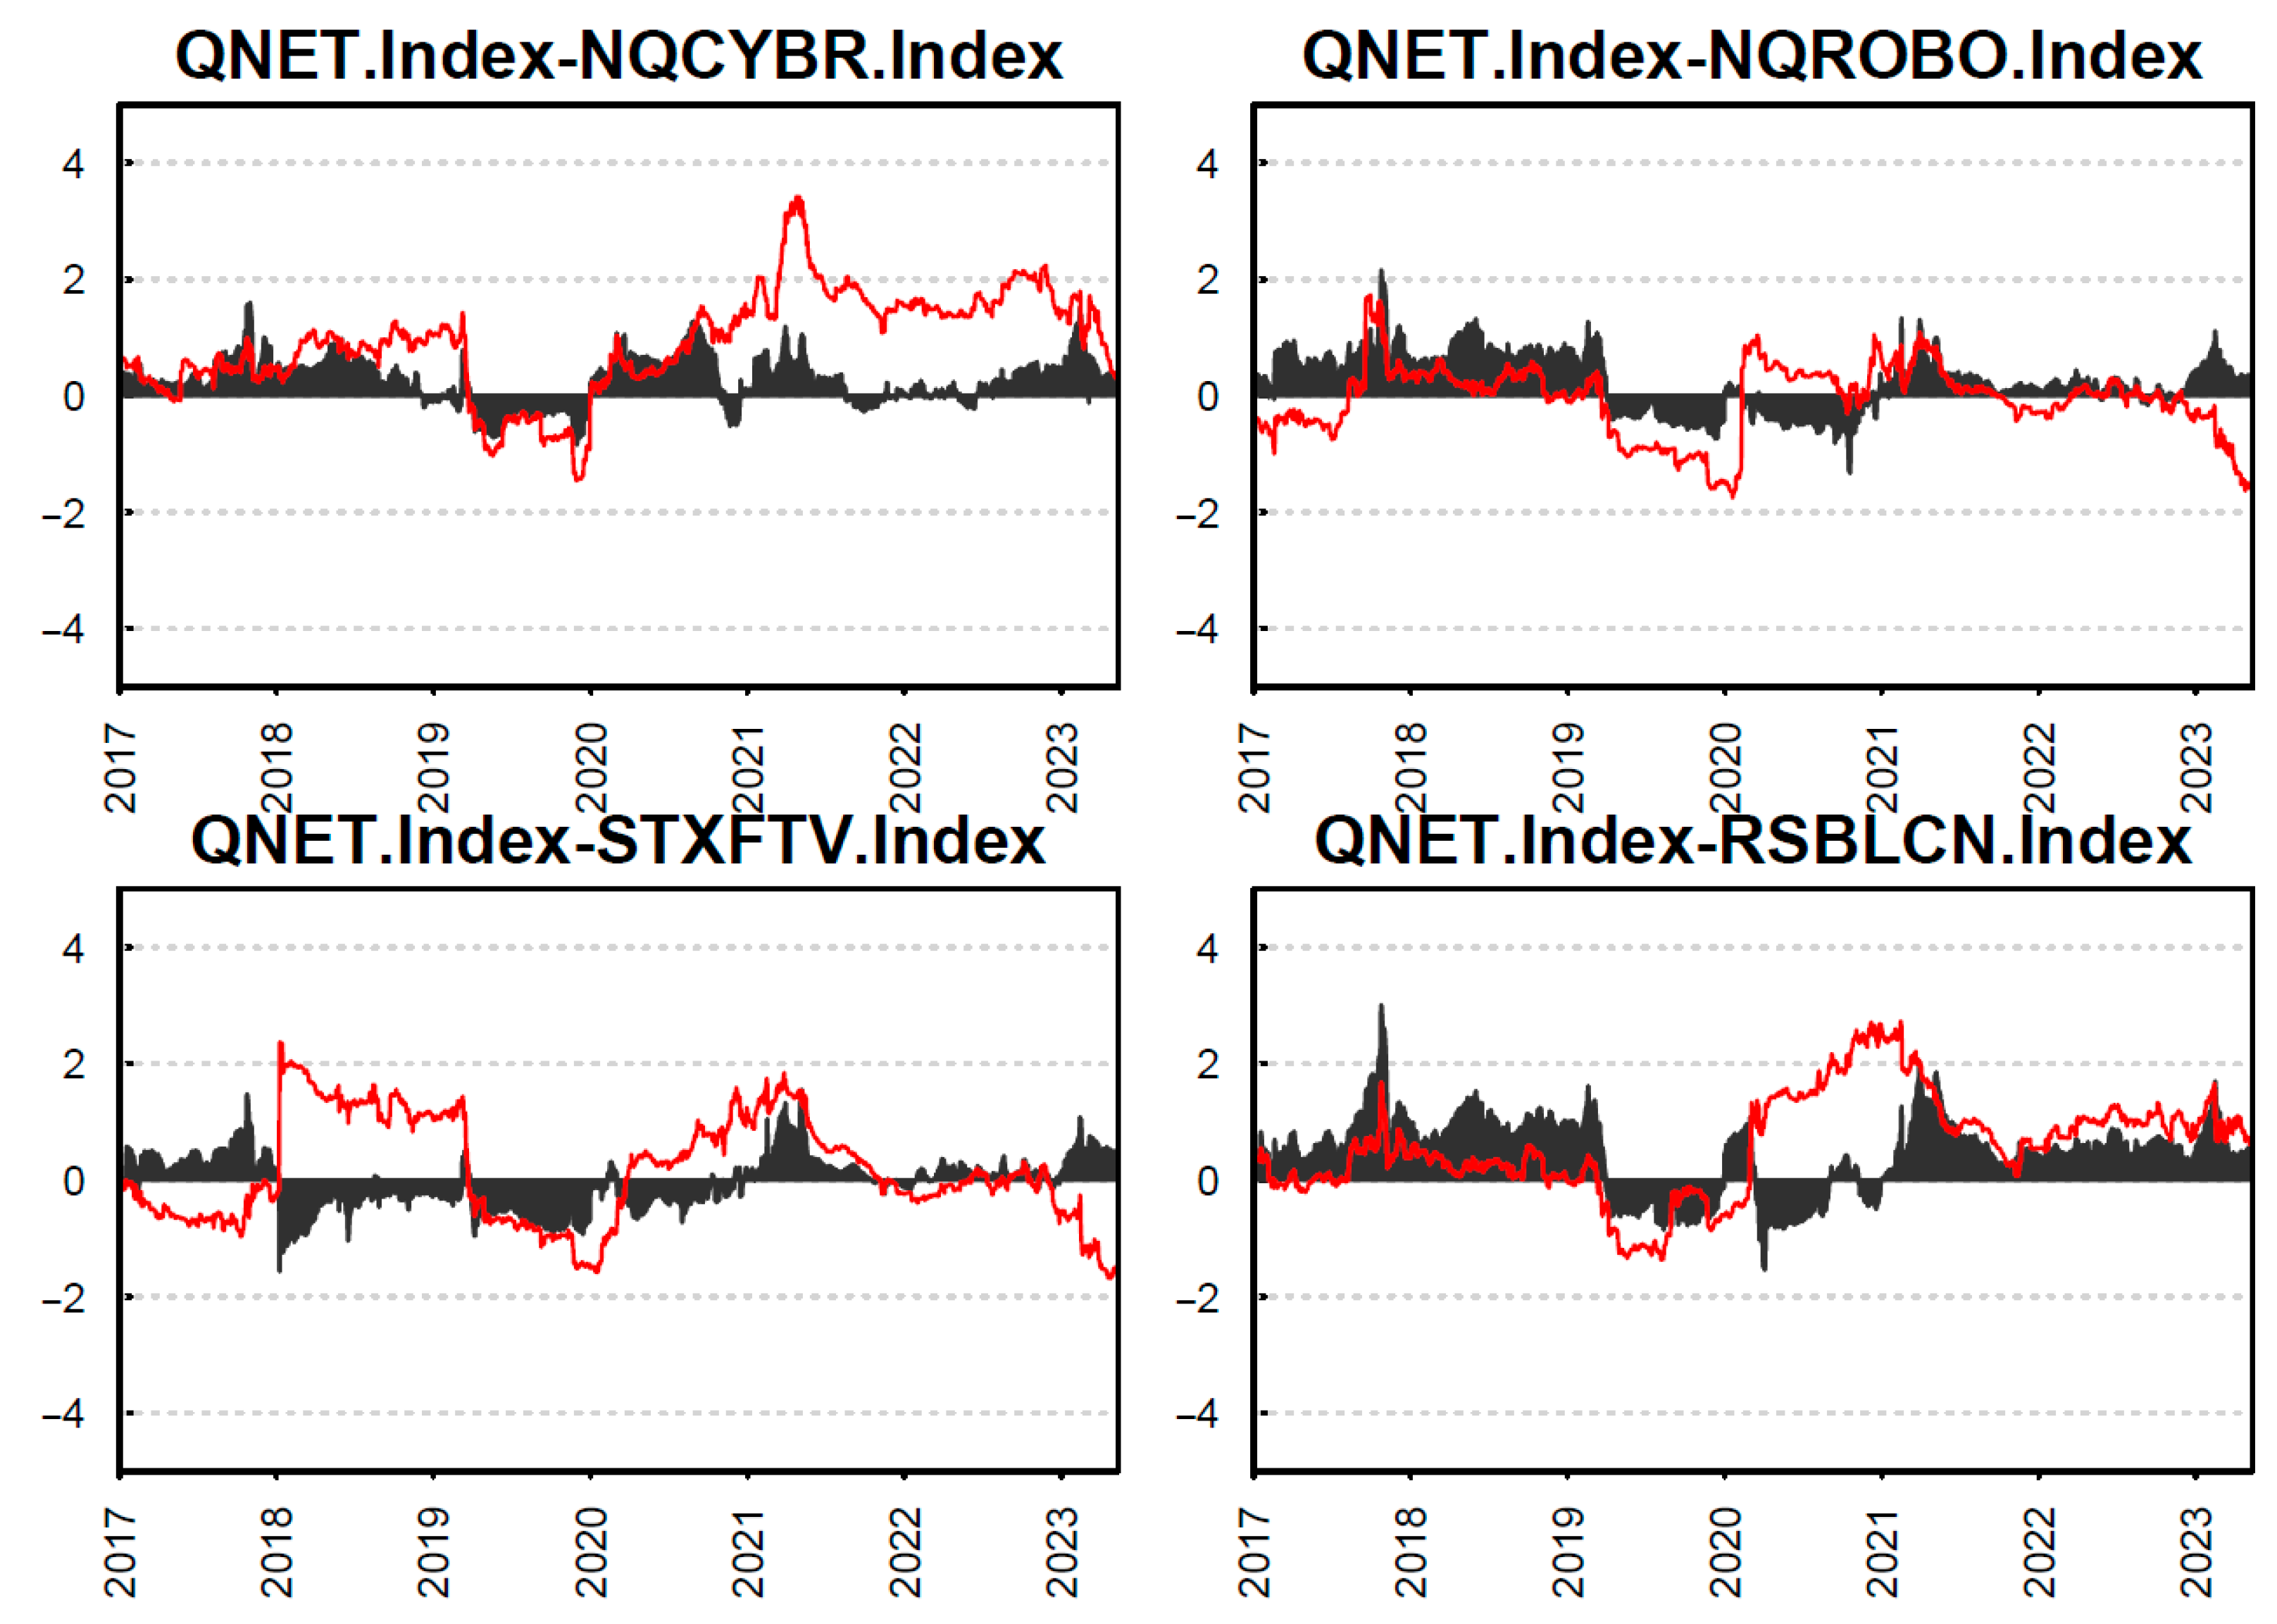
4.4. Pairwise Connectedness

Our study focuses on the net pairwise connectedness estimates illustrated in Figure 3. We begin by examining the contagion effects associated with the internet to determine its critical role within our network of diverse indexes. Notably, while the net influence of the internet may have varied over time across other indices, it exhibited a relatively high level of contagion activity in 2017 and 2018, which diminished from 2019 to 2020. This suggests that the internet consistently responds to shocks from other indexes and, in turn, affects these markets. Specifically, the internet emerges as a prominent shock transmitter in its interactions with cybersecurity, except during the 2019–2020 period. Additionally, the net pairwise directional connectedness relating the internet and artificial intelligence and robotics, fintech, and blockchain follows a fluctuating transmission pattern throughout 2017–2023. It is particularly noteworthy that the internet predominantly acts as a shock transmitter both at the start of the period and through the COVID-19 pandemic.
This suggests that extreme market conditions have a greater impact on connectedness than normal conditions. Furthermore, our research highlights the importance of analyzing the net pairwise directional connectedness network among these indices and underscores the necessity of investors understanding the dynamics of these markets and the complex interactions between various factors.

4.5. The Determinants of Joint Total Connectedness

In this section, we use monthly data to estimate the determinants of the joint total connectedness index j T C I t , as the climate policy uncertainty (CPU) index is available only at a monthly frequency. Employing quantile regression, we analyzed the factors influencing ( j T C I t ), treating it as the dependent variable and incorporating a variety of risk factors. These factors include CPU, economic policy uncertainty (EPU), geopolitical risk (GPR), the Oil Volatility Index (OVX), Trade Policy Uncertainty (TPU), the Stock Market Volatility Index (VIX), and the WilderHill Clean Energy Index (WHCE). This choice of variables for quantile regression is due to the main global risk factors on which the estimation of the joint total connectedness index is dependent. OVX measures the swings in global commodity markets and can affect energy prices and investment stability. VIX maintains overall market volatility, while EPU reflects economic policy uncertainty, two factors that shape the investment climate globally and domestically. Table 4 presents the connectedness regressions across seven quantiles. At the quantile level, the effect of climate policy uncertainty (CPU) is positive, whereas it has three significant negative coefficients for quantiles (0.75, 0.90, 0.95). This shows that while CPU matters more in low-connectedness states, it diminishes or can even turn negative as the connectedness increases. However, the coefficient is positive and significant at the quantiles (0.05) and (0.10), meaning that at lower levels of connectedness, when climate policy uncertainty increases, the total connectedness improves. Since the coefficient of the low quantile (0.05) is larger than the regression coefficient of the high quantile (0.10), the effect of the drop in climate uncertainty is larger. On the other hand, when climate policy uncertainty rises, the 4IR asset network tends to become more interlinked. The coefficient for EPU is mixed across quantiles, being insignificant at lower and middle quantiles but positive and significant at higher quantiles (0.90 and 0.95), indicating that economic uncertainty plays a role in increasing connectedness in extreme periods of volatility. This result validates economic policy uncertainty, which affects cross-market linkages when financial stress is elevated. In contrast, GPR has a significant negative impact, particularly at the quantile (0.75) at the 5% level, emphasizing that GPRs attenuate the overall connectedness during periods of peaks in connectedness. This outcome suggests that markets might be becoming more fragmented due to geopolitical risks. OVX indicates a significant negative effect on the quantiles (0.90, 0.95). This result suggests that in the case of high connectedness, oil market volatility will decrease 4IR spillovers, mainly in relatively high-connectedness states. Moving to the TPU, it has no prominent impact on quantiles, indicating no clear impact of trade uncertainty on 4IR network connectedness in our sample. The positive but insignificant coefficients for VIX at all quantiles imply that while stock market volatility may help explain changes in connectedness, its impact is weak. Finally, WHCE has a negative coefficient that is statistically significant in the lowest quantile. At the quantile 0.05, WHCE’s coefficient is −0.016. This result signifies that when the clean energy sector is strong, the overall 4IR connectedness tends to be lower. One explanation is the strength of clean energy enhances its diversification relative to that of the other 4IR assets, reducing co-movement among these assets.
The quantile regression results indicate differences in the impact of the uncertainty factors on j T C I t . Importantly, CPU has positive and often larger effects in low quantiles, like EPU has positive and often larger effects in high quantiles, while GPR and OVX are relevant only in certain lower-quantile cases. The strong positive impact of climate policy uncertainty (CPU) on connectedness suggests that unpredictable environmental regulations make technology stocks move more cohesively. It appears that with uncertain climate policies, investors might respond in a synchronized manner across various tech sectors, increasing the spillover risk. EPU shocks tend to increase the connections among 4IR assets and induce overall market volatility, which is in line with the findings of Youssef et al. (2021). The positive (but not significant) role of VIX suggests that overall market fear increases 4IR connectedness: When the equity risk premium rises, investors move away from risky assets, driving them together. When the equity risk premium rises, investors move away from risky assets, driving them together. The lack of significance might imply a saturation effect where other factors (like CPU/EPU) dominate in periods of very high connectedness. In contrast, the negative value for WHCE implies that a robust performance of clean energy stocks is correlated with lower connectedness among 4IR assets.
These results indicate that climate policy uncertainty is a key determinant of 4IR spillovers. Policymakers should be aware that ambiguity in climate rules can transmit risks across high-tech sectors. Similarly, investors need to be cognizant of the fact that increases in economic (or climate) policy uncertainty are likely to attenuate the benefits of diversifying 4IR assets.

5. Conclusions and Implications

There is a dearth of literature addressing the interconnectedness and volatility dynamics for several 4IR assets, despite growing interest in the Fourth Industrial Revolution. This study contributes to bridging this gap by investigating the impact of climate policy uncertainty on the spillovers in volatility between these emerging technologies. To this end, we applied six uncertainty indicators, alongside five major 4IR indices. The major risk-related indices included are climate policy uncertainty, geopolitical risk, economic policy uncertainty, the Oil Volatility Index, Trade Policy Uncertainty, the Stock Market Volatility Index, and the WilderHill Clean Energy Index. The major assets of the Fourth Industrial Revolution chosen are the internet, cybersecurity, artificial intelligence and robotics, fintech, and blockchain. The period of observation was from 1 January 2015 to 30 April 2023. To add novel insights to the empirical analysis, we adopted the approach from Balcilar et al. (2021), using the time-varying parameter vector auto-regression (TVP-VAR) model with a joint connectedness approach. This study utilized the DY method by Diebold and Yılmaz (2012, 2014) and the joint connectedness method.
This study highlights the necessity of recognizing the assets of the Fourth Industrial Revolution and climate and economic policy uncertainty as closely linked components, rather than treating them as isolated sectors. The results show that both the blockchain and cybersecurity indices emerge as key recipients of spillovers. This indicates that the cybersecurity index and the blockchain index are more responsive to external disruptions rather than proactive. In contrast, fintech is the quintessential net shock transmitter over the whole period. This highlights how the fintech index can translate external shocks into movement across other markets, perhaps thanks to its nifty characteristics. The internet, on the other hand, changes in its role over time. While at times the artificial intelligence and robotics index are both net transmitters, at other times, they are net receivers. These findings underscore the complex interdependencies among the assets of the Fourth Industrial Revolution, integrating their significant spillover effects and collective behaviors, and risk comportment. Climate policy uncertainty and economic policy uncertainty are external factors that are critical to understand because they add to the volatility in these assets, as well as changing the strength and direction of their spillovers. With climate policy uncertainty and economic policy uncertainty increasing for financial markets, understanding these interactions is critical for those making policy, looking to invest, or looking to innovate to support resilient, sustainable growth in this era of digital transformation. The findings of this study carry several important implications. They provide new insights for investors, portfolio managers, and policymakers into the portfolio diversification strategies within financial markets, forecasting, and risk management in different market conditions. They can use these findings to improve their asset selection by assessing how different uncertainty indicators affect correlation structures, especially in innovation-driven sectors such as the Fourth Industrial Revolution. Research on this subject will be key going forward as technology systems evolve and the climate crisis worsens. Moreover, the results of this study offer actionable guidance for investment decision-making in an era of growing climate-related uncertainty. By identifying which 4IR assets act as net transmitters or receivers of volatility under different uncertainty regimes, particularly under elevated climate policy risk, these findings can support more informed asset allocation strategies. For instance, investors may overweight net receivers such as cybersecurity or blockchain during periods of heightened uncertainty to reduce the exposure to systemic shocks. Conversely, recognizing the role of fintech and AI as frequent net transmitters enables portfolio managers to use these assets strategically as early indicators of market shifts or as instruments for directional plays. The evidence on the time-varying roles of each asset class also supports sector rotation strategies, allowing investors to dynamically reallocate across 4IR sectors as the macro-risk conditions evolve. These insights can help improve portfolio resilience, enhance diversification, and align investment strategies with long-term sustainability goals in increasingly volatile markets.
Despite its contributions, this study has two limitations. First, it focuses on a specific set of 4IR indices and may not capture the full spectrum of emerging technologies or region-specific innovation trends. Second, while the TVP-VAR and joint connectedness framework effectively captures dynamic spillovers, it does not account for the potential nonlinearities or structural breaks that may exist in financial networks. These limitations present opportunities for future research to incorporate broader asset classes, high-frequency indicators, and alternative modeling approaches.

Author Contributions

Conceptualization, M.A., N.B. and N.N.; methodology, N.B. and N.N.; software, N.N.; validation, N.B.; formal analysis, N.B.; investigation, N.B. and N.N.; resources, M.A. and N.N.; data curation, N.B. and N.N.; writing—original draft preparation, N.B.; writing—review and editing, N.B. and N.N.; visualization, N.N.; supervision, M.A., N.B. and N.N. All authors have read and agreed to the published version of the manuscript.

Funding

This work was supported and funded by the Deanship of Scientific Research at Imam Mohammad Ibn Saud Islamic University (IMSIU) (grant number IMSIU-DDRSP2504).

Institutional Review Board Statement

Not applicable.

Informed Consent Statement

Not applicable.

Data Availability Statement

All variables are sourced from the Bloomberg database, https://www.investing.com/ (accessed on 5 June 2025), and https://policyuncertainty.com/ (accessed on 5 June 2025).

Conflicts of Interest

The authors declare no conflicts of interest.

References

  1. Adekoya, O. B., Oliyide, J. A., Saleem, O., & Adeoye, H. A. (2022). Asymmetric connectedness between Google-based investor attention and the fourth industrial revolution assets: The case of FinTech and robotics & artificial intelligence stocks. Technology in Society, 68, 101925. [Google Scholar]
  2. Allen, F., & Gale, D. (2000). Financial contagion. Journal of Political Economy, 108(1), 1–33. [Google Scholar] [CrossRef]
  3. Almpanopoulou, A., Ritala, P., & Blomqvist, K. (2019, January 8–11). Innovation ecosystem emergence barriers: Institutional perspective. 52nd Hawaii International Conference on System Sciences, Wailea, HI, USA. [Google Scholar]
  4. Bai, D., Du, L., Xu, Y., & Abbas, S. (2023). Climate policy uncertainty and corporate green innovation: Evidence from Chinese A-share listed industrial corporations. Energy Economics, 127, 107020. [Google Scholar] [CrossRef]
  5. Bai, Y., & Zhang, J. (2012). Financial integration and international risk sharing. Journal of International Economics, 86(1), 17–32. [Google Scholar] [CrossRef]
  6. Baker, S. R., Bloom, N., & Davis, S. J. (2016). Measuring economic policy uncertainty. The Quarterly Journal of Economics, 131(4), 1593–1636. [Google Scholar] [CrossRef]
  7. Balcilar, M., Gabauer, D., & Umar, Z. (2021). Crude oil futures contracts and commodity markets: New evidence from a TVP-VAR extended joint connectedness approach. Resources Policy, 73, 102219. [Google Scholar] [CrossRef]
  8. Barnett, M., Brock, W., & Hansen, L. P. (2022). Climate change uncertainty spillover in the macroeconomy. NBER Macroeconomics Annual, 36(1), 253–320. [Google Scholar] [CrossRef]
  9. Batten, S. (2018). Climate change and the macro-economy: A critical review. SSRN Electronic. [Google Scholar] [CrossRef]
  10. Beatty, T., & Shimshack, J. P. (2010). The impact of climate change information: New evidence from the stock market. The BE Journal of Economic Analysis & Policy, 10(1), 105. [Google Scholar]
  11. Beckmann, J., Berger, T., & Czudaj, R. (2015). Does gold act as a hedge or a safe haven for stocks? A smooth transition approach. Economic Modelling, 48, 16–24. [Google Scholar] [CrossRef]
  12. Bonfiglioli, A. (2008). Financial integration, productivity and capital accumulation. Journal of International Economics, 76(2), 337–355. [Google Scholar] [CrossRef]
  13. Bouri, E., Das, M., Gupta, R., & Roubaud, D. (2018). Spillovers between Bitcoin and other assets during bear and bull markets. Applied Economics, 50(55), 5935–5949. [Google Scholar] [CrossRef]
  14. Bouri, E., Molnár, P., Azzi, G., Roubaud, D., & Hagfors, L. I. (2017). On the hedge and safe haven properties of Bitcoin: Is it really more than a diversifier? Finance Research Letters, 20, 192–198. [Google Scholar] [CrossRef]
  15. Chatziantoniou, I., Gabauer, D., & Stenfors, A. (2021). Interest rate swaps and the transmission mechanism of monetary policy: A quantile connectedness approach. Economics Letters, 204, 109891. [Google Scholar] [CrossRef]
  16. Chen, L. (2017). International competitiveness and the fourth industrial revolution. Entrepreneurial Business and Economics Review, 5(4), 111–133. [Google Scholar]
  17. Choi, C., & Kim, C. (2019). Towards sustainable environmental policy and management in the fourth industrial revolution: Evidence from big data analytics. The Journal of Asian Finance, Economics and Business, 6(3), 185–192. [Google Scholar] [CrossRef]
  18. Demiralay, S., Gencer, H. G., & Bayraci, S. (2021). How do Artificial Intelligence and Robotics Stocks co-move with traditional and alternative assets in the age of the 4th industrial revolution? Implications and Insights for the COVID-19 period. Technological Forecasting and Social Change, 171, 120989. [Google Scholar] [CrossRef]
  19. Diebold, F. X., & Yılmaz, K. (2009). Measuring financial asset return and volatility spillovers, with application to global equity markets. Economic Journal, 119(534), 158–171. [Google Scholar] [CrossRef]
  20. Diebold, F. X., & Yılmaz, K. (2012). Better to give than to receive: Predictive directional measurement of volatility spillovers. International Journal of Forecasting, 28(1), 57–66. [Google Scholar] [CrossRef]
  21. Diebold, F. X., & Yılmaz, K. (2014). On the network topology of variance decompositions: Measuring the connectedness of financial firms. Journal of Econometrics, 182(1), 119–134. [Google Scholar] [CrossRef]
  22. Dirican, C. (2015). The impacts of robotics, artificial intelligence on business and economics. Procedia-Social and Behavioral Sciences, 195, 564–573. [Google Scholar] [CrossRef]
  23. Disli, M., Nagayev, R., Salim, K., Rizkiah, S. K., & Aysan, A. F. (2021). In search of safe haven assets during COVID-19 pandemic: An empirical analysis of different investor types. Research in International Business and Finance, 58, 101461. [Google Scholar] [CrossRef]
  24. Döring, T., & Schnellenbach, J. (2006). What do we know about geographical knowledge spillovers and regional growth?: A survey of the literature. Regional Studies, 40(03), 375–395. [Google Scholar] [CrossRef]
  25. Dwyer, G. P. (2015). The economics of Bitcoin and similar private digital currencies. Journal of Financial Stability, 17, 81–91. [Google Scholar] [CrossRef]
  26. Eckert, C. (2020). Risk and risk management of spillover effects: Evidence from the literature. Risk Management and Insurance Review, 23(1), 75–104. [Google Scholar] [CrossRef]
  27. Edison, H. J., Levine, R., Ricci, L., & Sløk, T. (2002). International financial integration and economic growth. Journal of International Money and Finance, 21(6), 749–776. [Google Scholar] [CrossRef]
  28. El Khoury, R., Alshater, M. M., & Li, Y. (2023). Multidimensional connectedness among the fourth industrial revolution assets. Borsa Istanbul Review, 23(4), 953–979. [Google Scholar] [CrossRef]
  29. Engle, R. F., Giglio, S., Kelly, B., Lee, H., & Stroebel, J. (2020). Hedging climate change news. The Review of Financial Studies, 33(3), 1184–1216. [Google Scholar] [CrossRef]
  30. Frischmann, B. M., & Lemley, M. A. (2007). Spillovers. Columbia Law Review, 107, 257. [Google Scholar]
  31. Gao, W., Wei, J., Zhang, H., & Zhang, H. (2024). Does climate policy uncertainty exacerbate extreme risk spillovers between green economy and energy metals? Resources Policy, 91, 104946. [Google Scholar] [CrossRef]
  32. Giglio, S., Maggiori, M., Rao, K., Stroebel, J., & Weber, A. (2021). Climate change and long-run discount rates: Evidence from real estate. The Review of Financial Studies, 34(8), 3527–3571. [Google Scholar] [CrossRef]
  33. Gulzar, S., Mujtaba Kayani, G., Xiaofen, H., Ayub, U., & Rafique, A. (2019). Financial cointegration and spillover effect of global financial crisis: A study of emerging Asian financial markets. Economic Research-Ekonomska Istraživanja, 32(1), 187–218. [Google Scholar] [CrossRef]
  34. Ha, S., Yangchen, S., & Assan, A. (2022). COVID-19 testing: A qualitative study exploring enablers and barriers in the Greater Accra Region, Ghana. Frontiers in Public Health, 10, 908410. [Google Scholar] [CrossRef] [PubMed]
  35. Haberly, D., MacDonald-Korth, D., Urban, M., & Wójcik, D. (2019). Asset management as a digital platform industry: A global financial network perspective. Geoforum, 106, 167–181. [Google Scholar] [CrossRef]
  36. Hoque, M. E., Soo-Wah, L., Bilgili, F., & Ali, M. H. (2023). Connectedness and spillover effects of US climate policy uncertainty on energy stock, alternative energy stock, and carbon future. Environmental Science and Pollution Research, 30(7), 18956–18972. [Google Scholar] [CrossRef] [PubMed]
  37. Huynh, T. L. D., Hille, E., & Nasir, M. A. (2020). Diversification in the age of the 4th industrial revolution: The role of artificial intelligence, green bonds and cryptocurrencies. Technological Forecasting and Social Change, 159, 120188. [Google Scholar] [CrossRef]
  38. Ji, Q., Ma, D., Zhai, P., Fan, Y., & Zhang, D. (2024). Global climate policy uncertainty and financial markets. Journal of International Financial Markets, Institutions and Money, 95, 102047. [Google Scholar] [CrossRef]
  39. Khalfaoui, R., Jabeur, S. B., & Dogan, B. (2022). The spillover effects and connectedness among green commodities, Bitcoins, and US stock markets: Evidence from the quantile VAR network. Journal of Environmental Management, 306, 114493. [Google Scholar] [CrossRef]
  40. Lane, P. R., & Milesi-Ferretti, G. M. (2003). International financial integration. IMF Staff Papers, 50(Suppl. S1), 82–113. [Google Scholar] [CrossRef]
  41. Lastrapes, W. D., & Wiesen, T. F. P. (2021). The joint spillover index. Economic Modelling, 94, 681–691. [Google Scholar] [CrossRef]
  42. Le, T. L., Abakah, E. J. A., & Tiwari, A. K. (2021). Time and frequency domain connectedness and spill-over among fintech, green bonds and cryptocurrencies in the age of the fourth industrial revolution. Technological Forecasting and Social Change, 162, 120382. [Google Scholar] [CrossRef]
  43. Li, J. P., Naqvi, B., Rizvi, S. K. A., & Chang, H. L. (2021). Bitcoin: The biggest financial innovation of fourth industrial revolution and a portfolio’s efficiency booster. Technological Forecasting and Social Change, 162, 120383. [Google Scholar] [CrossRef]
  44. Liu, X., An, H., Huang, S., & Wen, S. (2017). The evolution of spillover effects between oil and stock markets across multi-scales using a wavelet-based GARCH–BEKK model. Physica A: Statistical Mechanics and Its Applications, 465, 374–383. [Google Scholar] [CrossRef]
  45. Malhotra, N., & Gupta, S. (2019). Volatility spillovers and correlation between cryptocurrencies and Asian equity market. International Journal of Economics and Financial Issues, 9(6), 208–215. [Google Scholar] [CrossRef]
  46. Martin, P., & Rey, H. (2000). Financial integration and asset returns. European Economic Review, 44(7), 1327–1350. [Google Scholar] [CrossRef]
  47. Mhlanga, D. (2023). FinTech and climate-related challenges in the fourth industrial revolution. In FinTech and artificial intelligence for sustainable development: The role of smart technologies in achieving development goals (pp. 213–239). Springer Nature Switzerland. [Google Scholar]
  48. Naifar, N. (2024a). Climate policy uncertainty and comparative reactions across sustainable sectors: Resilience or vulnerability? Finance Research Letters, 65, 105543. [Google Scholar] [CrossRef]
  49. Naifar, N. (2024b). Spillover among sovereign credit risk and the role of climate uncertainty. Finance Research Letters, 61, 104935. [Google Scholar] [CrossRef]
  50. Nyagadza, B., Pashapa, R., Chare, A., Mazuruse, G., & Hove, P. K. (2022). Digital technologies, fourth industrial revolution (4IR) & global value chains (GVCs) nexus with emerging economies’ future industrial innovation dynamics. Cogent Economics & Finance, 10(1), 2014654. [Google Scholar]
  51. Ortas, E., & Moneva, J. M. (2013). The clean Techs equity indexes at stake: Risk and return dynamics analysis. Energy, 57, 259–269. [Google Scholar] [CrossRef]
  52. Park, C. Y., & Lee, J. W. (2011). Financial integration in emerging Asia: Challenges and prospects. Asian Economic Policy Review, 6(2), 176–198. [Google Scholar] [CrossRef]
  53. Park, S. (2011). Co-evolution of policy and emerging technology: Hydrogen energy policies in Iceland, the United Kingdom, and Korea. Korean Journal of Policy Studies, 26(1), 117–143. [Google Scholar] [CrossRef]
  54. Pesaran, H. H., & Shin, Y. (1998). Generalized impulse response analysis in linear multivariate models. Economics Letters, 58(1), 17–29. [Google Scholar] [CrossRef]
  55. Pham, S. D., Nguyen, T. T., & Do, H. X. (2024). Impact of climate policy uncertainty on return spillover among green assets and portfolio implications. Energy Economics, 134, 107631. [Google Scholar] [CrossRef]
  56. Qin, M., Zhu, Y., Xie, X., Shao, X., & Lobonţ, O. R. (2024). The impact of climate risk on technological progress under the fourth industrial era. Technological Forecasting and Social Change, 202, 123325. [Google Scholar] [CrossRef]
  57. Ratner, M., & Chiu, C. C. J. (2013). Hedging stock sector risk with credit default swaps. International Review of Financial Analysis, 30, 18–25. [Google Scholar] [CrossRef]
  58. Sadorsky, P. (2012). Correlations and volatility spillovers between oil prices and the stock prices of clean energy and technology companies. Energy Economics, 34(1), 248–255. [Google Scholar] [CrossRef]
  59. Schindler, M. (2009). Measuring financial integration: A new data set. IMF Staff Papers, 56(1), 222–238. [Google Scholar] [CrossRef]
  60. Su, C. W., Qin, M., Tao, R., & Umar, M. (2020). Financial implications of fourth industrial revolution: Can bitcoin improve prospects of energy investment? Technological Forecasting and Social Change, 158, 120178. [Google Scholar] [CrossRef] [PubMed]
  61. Symitsi, E., & Chalvatzis, K. J. (2019). The economic value of Bitcoin: A portfolio analysis of currencies, gold, oil and stocks. Research in International Business and Finance, 48, 97–110. [Google Scholar] [CrossRef]
  62. Thampanya, N., Nasir, M. A., & Huynh, T. L. D. (2020). Asymmetric correlation and hedging effectiveness of gold & cryptocurrencies: From pre-industrial to the 4th industrial revolution. Technological Forecasting and Social Change, 159, 120195. [Google Scholar]
  63. Umar, M., Rizvi, S. K. A., & Naqvi, B. (2021). Dance with the devil? The nexus of fourth industrial revolution, technological financial products and volatility spillovers in global financial system. Technological Forecasting and Social Change, 163, 120450. [Google Scholar] [CrossRef]
  64. Venturini, A. (2022). Climate change, risk factors and stock returns: A review of the literature. International Review of Financial Analysis, 79, 101934. [Google Scholar] [CrossRef]
  65. Xu, X., Huang, S., Lucey, B. M., & An, H. (2023). The impacts of climate policy uncertainty on stock markets: Comparison between China and the US. International Review of Financial Analysis, 88, 102671. [Google Scholar] [CrossRef]
  66. Youssef, M., Mokni, K., & Ajmi, A. N. (2021). Dynamic connectedness between stock markets in the presence of the COVID-19 pandemic: Does economic policy uncertainty matter? Financial Innovation, 7(1), 13. [Google Scholar] [CrossRef]
  67. Zhu, N., Zhang, X., Ren, X., & Wang, L. (2023). The response of corporate innovation to climate policy uncertainty: Evidence from China. Journal of Environmental Assessment Policy and Management, 25(02), 2350008. [Google Scholar] [CrossRef]
Figure 1. Dynamic total connectedness. Note: Figure 1 illustrates the evolution of the total connectedness among 4IR assets from 2017 to 2023. The gray shaded area represents the total connectedness index (TCI) estimated using the extended joint connectedness approach (Balcilar et al., 2021). The red line indicates the dynamic connectedness measure based on Diebold and Yılmaz (2012)’s framework. Source: authors’ calculations using Bloomberg data.
Jrfm 18 00316 g001
Figure 2. The net total directional connectedness. Note: The gray shaded area represents the total connectedness index (TCI) estimated using the extended joint connectedness approach (Balcilar et al., 2021). The red line indicates the dynamic connectedness measure based on Diebold and Yılmaz (2012)’s framework. Source: authors’ calculations using Bloomberg data.
Jrfm 18 00316 g002
Figure 3. The net pairwise directional connectedness. Note: Figure 3 illustrates the evolution of the net pairwise directional connectedness among 4IR assets from 2017 to 2023. The gray shaded area represents the total connectedness index (TCI) estimated using the extended joint connectedness approach (Balcilar et al., 2021). The red line indicates the dynamic connectedness measure based on Diebold and Yılmaz (2012)’s framework. Source: authors’ calculations using Bloomberg data.
Jrfm 18 00316 g003
Table 1. Description of indices.
IndexAbbr.DesriptionSource
Internet
Index
QNETThe Nasdaq Internet Index is a modified market-capitalization-weighted index designed for tracking the performance of the largest and most liquid US-listed companies engaged in internet-related businesses that are listed on the Nasdaq Stock Market, the New York Stock Exchange (NYSE), or the NYSE Amex. It includes companies engaged in a broad range of internet-related services, including internet software, internet access providers, internet search engines, web hosting, website design, and internet retail commerce.Bloomberg
Cybersecurity
Index
NQCYBRThe Nasdaq CTA Cybersecurity IndexSM is designed for tracking the performance of companies engaged in the cybersecurity segment of the technology and industrial sectors. This index includes companies primarily involved in building, implementing, and managing security protocols applied to private and public networks, computers, and mobile devices to protect data integrity and network operations.Bloomberg
(AI) and
Robotics
Index
NQROBOThe Nasdaq CTA Artificial Intelligence and Robotics Index is designed for tracking the performance of companies engaged in the artificial intelligence and robotics segment of the technology, industrial, medical, and other economic sectors. This index includes companies in artificial intelligence or robotics that are classified as either enablers, engagers, or enhancers.Bloomberg
FintechSTXFTVThe Global Fintech Index consists of companies associated with financial technology (fintech). These businesses utilize technology to transform the way financial services are delivered to end customers and/or to enhance the competitive edge of traditional financial service providers by improving efficiency and driving new products and solutions. Bloomberg
Blockchain
Index
RSBLCNThe Nasdaq Blockchain Economy Index is designed for measuring the returns of companies that commit material resources to developing, researching, supporting, innovating, or utilizing blockchain technology for their proprietary use or use by others.Bloomberg
Table 2. Descriptive statistics.
QNETNQCYBRNQROBOSTXFTVRSBLCN
Mean0.0310.0530.0230.0350.039
Variance3.1302.2711.9291.9622.165
Skewness−0.363 ***−0.550 ***−0.485 ***−0.514 ***−0.201 ***
Kurtosis3.055 ***4.364 ***5.989 ***11.710 ***5.042 ***
Jarque–Bera682.436 ***1401.659 ***2547.273 ***9563.532 ***1770.746 ***
ERS−15.970 ***−18.329 ***−15.725 ***−13.612 ***−17.909 ***
Q(20)56.012 ***66.176 ***85.277 ***164.235 ***53.649 ***
Q2(20)630.595 ***917.198 ***760.780 ***1426.597 ***694.350 ***
Note: Table 2 presents the summary statistics of the daily returns for the five Fourth Industrial Revolution indices: internet (QNET), cybersecurity (NQCYBR), artificial intelligence and robotics (NQROBO), fintech (STXFTV), and blockchain (RSBLCN). Data are sourced from Bloomberg. *** indicates significance at the 1% level. ERS refers to the Elliott–Rothenberg–Stock unit root test. Q(20) and Q2(20) denote the Ljung–Box statistics for the return and squared return autocorrelations up to lag 20, respectively.
Table 3. Averaged connectedness.
QNETNQCYBRNQROBOSTXFTVRSBLCNFrom
QNET17.6620.4420.8120.7120.3882.34
NQCYBR20.7121.9820.5619.7716.9878.02
NQROBO21.0520.3415.7221.1621.7384.28
STXFTV20.6719.4020.9618.6520.3181.35
RSBLCN20.8417.0722.0520.7419.3080.70
To83.2877.2584.3882.3779.40406.69
Net0.95−0.760.101.02−1.30TCI = 81.34
NPDC3.001.002.004.000.0081.34
Note: Table 3 reports the time-averaged connectedness measures among the 4IR indices: internet (QNET), cybersecurity (NQCYBR), artificial intelligence and robotics (NQROBO), fintech (STXFTV), and blockchain (RSBLCN). “To” and “From” indicate the total directional connectedness transmitted to and received from others, respectively. “Net” shows the difference between “To” and “From”. “NPDC” refers to net pairwise directional connectedness. TCI is the total connectedness index. Source: authors’ calculations based on Bloomberg data.
Table 4. Determinants of the joint total connectedness.
CoefficientQ = 0.05Q = 0.10Q = 0.25Q = 0.50Q = 0.75Q = 0.90Q = 0.95
CPU0.0061 ***0.0054 ***0.00230.0005−0.0006−0.0009−0.0017
EPU−0.00620.0032−9.44 × 10−60.00180.00460.0118 *0.0133 *
GPR−0.0005−0.0013−0.0009−0.0043−0.0079 **−0.0038−0.0012
OVX−0.0057−0.0040−0.0042−0.00210.0004−0.0098 *−0.0109 *
TPU0.0027−0.0002−0.0007−0.0009−0.0014−0.0047−0.0055
VIX0.00110.00120.00440.00540.00020.00120.0009
WHCE−0.0169 *−0.0032−0.0057−0.0016−0.0039−0.0116−0.0104
Constant−0.0065−0.005 ***−0.0024−0.00060.0017 ***0.0055 ***0.0061 ***
R2 (%)27.3619.9812.158.4512.1918.3628.73
Note: This table presents the quantile regression results for the determinants of the joint total connectedness index j T C I t using the risk factors as independent variables. CPU: climate policy uncertainty; EPU: economic policy uncertainty; GPR: geopolitical risk; OVX: the Oil Volatility Index; TPU: Trade Policy Uncertainty; VIX: the Stock Market Volatility Index; WHCE: the WilderHill Clean Energy Index. Each quantile (Q) represents a different level of j T C I t , capturing the varying impacts of these factors across different market conditions. ***, **, * show that the relevant coefficient is significant at the 1%, 5%, and 10% levels, respectively. Source: authors’ calculations using Bloomberg data.
Disclaimer/Publisher’s Note: The statements, opinions and data contained in all publications are solely those of the individual author(s) and contributor(s) and not of MDPI and/or the editor(s). MDPI and/or the editor(s) disclaim responsibility for any injury to people or property resulting from any ideas, methods, instructions or products referred to in the content.

