Article

Determinants of Financial Performance in Advertising and Marketing Companies: Evidence from Central and Eastern European Countries

1
Department of Management, Business and Marketing Technologies, Zhytomyr Polytechnic State University, 10005 Zhytomyr, Ukraine
2
Department of Information Systems in Management and Accounting, Zhytomyr Polytechnic State University, 10005 Zhytomyr, Ukraine
3
Department of International Relations and Political Management, Zhytomyr Polytechnic State University, 10005 Zhytomyr, Ukraine
*
Author to whom correspondence should be addressed.
J. Risk Financial Manag. 2025, 18(3), 141; https://doi.org/10.3390/jrfm18030141
Submission received: 29 January 2025 / Revised: 19 February 2025 / Accepted: 6 March 2025 / Published: 8 March 2025
(This article belongs to the Section Business and Entrepreneurship)

Abstract

:
The issue of key determinants affecting the financial performance of advertising and marketing companies in Central and Eastern Europe remains understudied, despite the industry’s rapid growth and regional specifics. This study investigates financial performance determinants of advertising and marketing companies in four CEE countries (the Czech Republic, Poland, the Slovak Republic, and Ukraine) during 2021–2023, employing the least absolute deviations method. The study examines three financial performance measures (Return on Assets, Return on Equity, and Operating Profit Margin) using three independent variables (Current Ratio, Debt to Equity, and Total Asset Turnover) and control variables such as Company Size, Leverage, and Company Type. The results show that Total Asset Turnover consistently has a significant positive impact on ROA and ROE across all studied countries. The study also identified significant regional variations in liquidity and capital structure impacts, particularly in the Polish market, and uncovered distinct patterns in how financial leverage affects various performance metrics across the studied countries. Specifically, while leverage shows a predominantly negative relationship with ROE in most countries, it positively influences OPM for Polish, Slovak, and Ukrainian companies, suggesting that the role of financial leverage in company performance is highly context-dependent. The novelty of the study lies in a comprehensive investigation of specific determinants of financial performance in the CEE advertising and marketing sector, revealing the crucial role of efficient asset and equity management in the region.

1. Introduction

Advertising and marketing companies are characterized by a number of specific features that determine the nature of their activities. First, they have a unique asset structure, where intangible assets, including intellectual capital, creative developments, and technological solutions, play a dominant role (O’Connor et al., 2017; Lynch, 2019; Collier et al., 2020). This feature significantly impacts the balance sheet structure and asset performance indicators. Second, the operating activities of advertising and marketing companies are characterized by high cash flow volatility due to the business’s project nature and dependence on clients’ marketing budgets (Levin et al., 2017; Levin et al., 2018). This specificity creates additional liquidity management challenges and requires special financial planning approaches. Third, in the context of the economy’s digital transformation, advertising and marketing companies demonstrate high adaptability to technological changes. This is reflected in the constant modification of business models, which is accompanied by a change in the cost structure and the need for significant investments in the development of digital competencies (Xie et al., 2018). Fourth, an important characteristic of the industry is its high dependence on human capital (Nyilasy et al., 2013; Von Nordenflycht, 2010), which is reflected in the structure of operating costs, where a significant share is made up of personnel costs. This creates specific requirements for managing financial resources and forming reserves to solve the problem of staff turnover. Fifth, the market environment in which advertising and marketing companies operate is characterized by high competition, which is due to the relative barrier-free entry into the market and rapid changes in consumer preferences (Feng et al., 2018; Zavalii et al., 2024).
The Central and Eastern European (CEE) region presents a particularly compelling context for studying these companies’ financial performance. Recent research highlights the region’s distinct characteristics in terms of digital transformation and business competitiveness (Szabo et al., 2020), while demonstrating significant heterogeneity in business performance factors across individual CEE countries (Cieślik et al., 2015). This regional diversity is further evidenced by variations in financial performance determinants (Lehenchuk et al., 2023), and the importance of organizational characteristics in firm performance (Gharios et al., 2024).
Given the specifics of advertising and marketing companies, there is a need for research to analyze the determinants of their financial performance in CEE countries. This is justified by the fact that the markets in CEE countries are characterized by different levels of economic development and institutional environment, which significantly affects the activities of advertising and marketing companies. In particular, the impact on financial performance indicators such as ROA (Return on Assets), which shows the efficiency of using all assets, including intangible ones, and reflects the overall efficiency of operations in a competitive environment, ROE (Return on Equity), which reflects the efficiency of using equity capital to implement changes and, accordingly, is an indicator of a company’s competitiveness, and OPM (Operating Profit Margin), which shows the efficiency of operating activities, including when changing the business model, and takes into account the impact of high personnel costs, is studied. The probable determinants of influence are the Current Ratio (CR), which is important for assessing liquidity and the ability to cover short-term liabilities, Debt to Equity (DE), which shows financial stability and capital structure, and Total Asset Turnover (TAT), which reflects the efficiency of using assets to generate sales and shows the efficiency of using assets in a competitive environment. Additionally, the study employs control variables—two measures of company size (total assets—1_TA and number of employees—1_NE), leverage ratio (LEV), and a dummy variable characterizing access to equity capital (DJSC_1).
The dependent, independent, and control variables used in the models reflect key market characteristics of advertising and marketing companies. The unique asset structure and intangible assets dominance affects financial indicators through ROA demonstrating management efficiency, TAT reflecting asset generation effectiveness, company size (1_TA) capturing asset base, and DJSC_1 showing organizational structure impact. High cash flow volatility and project-based operations are captured by CR indicating liquidity management, OPM showing project revenue efficiency, and LEV demonstrating debt balance management. Digital transformation is reflected through ROE showing investment effectiveness, DE revealing technological financing structure, and TAT demonstrating digital asset utilization. Human capital dependence is measured through company size (1_NE) representing workforce scale, OPM indicating personnel cost management, and ROA/ROE showing human capital utilization efficiency. Finally, high market competition and low entry barriers are reflected through LEV balancing competitiveness with stability, TAT showing operational efficiency, CR demonstrating financial flexibility, and DE revealing competitive financing strategies.
The primary purpose of this study is to investigate the determinants of financial performance in advertising and marketing companies across four CEE countries—the Czech Republic, Poland, the Slovak Republic, and Ukraine—using panel data analysis for the period 2021–2023. Specifically, this study aims to examine the impact of key financial ratios (Current Ratio, Debt to Equity, and Total Asset Turnover) on companies’ financial performance while considering the cross-country context of the CEE region.
The results of such studies are of great practical importance for developing effective financial management strategies and making informed investment decisions in advertising and marketing companies in CEE countries.

2. Literature Review

2.1. Cross-Country Analysis

The main objective of cross-country analysis (CCA) is to compare certain phenomena, processes, or indicators between different countries to identify patterns, differences, and common characteristics. This allows for a better understanding of the phenomena being studied in an international context.
Szabo et al. (2020), in a cross-country analysis in the CEE region (Hungary, Serbia, Slovakia, and Romania), investigated the impact of digital transformation on the competitiveness of B2B companies through the driving forces and barriers of Industry 4.0. In particular, one of the driver categories was “Financial resources and profitability,” which includes “Increase in ROA”.
In the context of CCA, Chen et al. (2018) studied a sample of 500 companies from 34 countries (2014–2015), which allowed for a comprehensive analysis of the relationship between green initiatives, environmental performance, and corporate financial performance on a global scale. The significance of the relationships found was not the same across countries and also varied over time. Thus, a positive impact of environmental performance on financial performance was found for companies from the United States. This impact increased in 2015 compared to 2014, demonstrating the importance of geographical context and time dynamics in understanding the relationship between environmental responsibility and corporate financial performance.
Cieślik et al.’s (2015) study covered Estonia, Latvia, Lithuania, the Czech Republic, Hungary, Poland, and Slovakia, and was based on firm-level BEEPS data collected over three years: 2002, 2005, and 2009. The estimation results obtained for the Baltic and Central European countries showed that the probability of exporting positively depends on the level of productivity, firm size, the share of university graduates in productive employment, and the firm’s internationalization. The results obtained for the two groups of countries (Central European and Baltic) are not statistically different, while the results for individual countries show a certain degree of heterogeneity.
Arikawa et al. (2019) examine whether the persistently lower profitability and market value of Japanese firms relative to their global peers can be explained by an insider-dominated board structure and an employment system that impedes flexible employment adjustment using cross-country data, specifically using a sample of 1548 firms from 27 countries with sales of USD 3 million or more and constructing a panel data set covering seven years from 2006 to 2012.
In the context of CCA, a study by Lehenchuk et al. (2023) demonstrated significant variability in the determinants of financial performance of agricultural companies in Poland, Slovakia, and Ukraine based on panel data of 462 companies (34 Polish, 123 Slovak, and 305 Ukrainian) for the period 2017–2020, identifying which determinants of influence are significant across country samples.
According to the findings of Gharios et al. (2024), who investigated the impact of board gender diversity on the financial performance of European listed non-financial companies during 2011–2023, board characteristics, particularly gender diversity, independence, and size, along with liquidity, positively influence firm performance (ROA).
CCA is actively used in modern research to study various aspects of companies’ activities. The CCA methodology allows us to identify both general patterns for a group of countries and national characteristics of the influence of various factors on the financial performance of companies.

2.2. Determinants of Financial Performance

The analysis of the financial performance of companies mainly focuses on studying the factors that influence the key indicators of profitability—ROA and ROE. ROA measures the net income generated from each currency unit invested in total assets, and ROE shows how well managers have used shareholders’ resources to generate net income (Patin et al., 2020). Less common objects of empirical research are Return on Sales (ROS), OPM, Net Profit Margin, and Gross Profit Margin.
One of the key financial ratios is the Current Ratio (CR) (Kangari et al., 1992). CR is a liquidity ratio that measures a business’s capability to meet its short-term liabilities with its current assets. Researchers have studied CR’s impact on companies’ financial performance in various industries and countries.
A number of researchers have examined the significance of the impact of CR. Dencic-Mihajlov (2015) found that CR has a significant positive impact on OPM using the example of Serbian listed companies. Durrah et al. (2016) found a significant impact on ROA and OPM with a positive coefficient using the example of Jordanian industrial food companies. Supardi et al. (2018) found a significant impact on ROA with a positive coefficient in a case study of registered cooperatives in the Department of Cooperatives, Small and Medium Enterprises, Trade and Industry Indramayu district (Indonesia). Irman and Purwati (2020), analyzing automotive companies listed on the Indonesia Stock Exchange, found that CR had a positive and significant impact on ROA. Juliani et al. (2023) found a significant impact on ROE with a positive coefficient in a sample of manufacturing companies listed on the Indonesia Stock Exchange. Mazanec (2023), using a sample of 4,000 small- and medium-sized enterprises in the transport sector in the Central European region (the Czech Republic, Hungary, Poland, and Slovakia), found that CR positively and significantly influenced corporate performance. The empirical findings of Gharios et al. (2024) reveal a positive relationship between liquidity and firm performance in the context of European listed non-financial firms.
Other researchers, on the contrary, find that the impact of CR on the financial performance of companies is insignificant. Thuraisingam (2015) found no significant relationship between CR and ROE/ROA in a sample of selected companies from different sectors in Sri Lanka. Hantono (2018) found that CR has no significant effect on the dependent variable (ROA) for consumer goods companies listed on the Indonesia Stock Exchange. Madushanka and Jathurika (2018) found that CR has an insignificant effect on ROA and ROE of listed manufacturing companies in Sri Lanka. Lehenchuk et al. (2022) revealed that the impact of CR on ROA is insignificant based on a sample study of 88 Slovak advertising agencies. Rachman et al. (2023) found that CR has an insignificant impact on the financial performance (ROA) of property and real estate companies listed on the IDX in 2016–2020.
Some authors have found the existence of specific effects on different financial performance indicators. Nguyen et al. (2024) found that the impact of CR on ROA was significant and on ROE was insignificant based on the results of a study of data from the top 100 Vietnamese listed companies. In addition to traditional approaches, the cross-section can be studied not only by dependent indicators but also by countries. For example, as in Lehenchuk et al. (2023), who, while studying agricultural companies, revealed the significance of CR’s influence on ROA, ROE, and ROS for companies in Poland, on ROA and ROS for Slovakia, and on ROE for Ukraine, while at the same time finding an insignificant influence of CR on ROE (Slovakia) and ROA and ROS (Ukraine).
Many articles have discussed capital structure, but the results remain contradictory (Tran et al., 2023). Researchers study the impact of debt to equity (DE) on the financial performance of companies in different industries and countries. One group of researchers found the influence of DE to be significant. For example, Hantono (2018) found that DE significantly influences the dependent variable (ROA) for consumer goods companies listed on the Indonesia Stock Exchange. Odhiambo et al. (2022) revealed that DE has a negative statistically significant impact on firms’ financial performance measured as ROE using a sample of Kenyan firms listed on the Nairobi Securities Exchange. On the contrary, other researchers conclude that the influence of DE on financial performance is insignificant. For example, Irman and Purwati (2020) found that DE has a negative effect on ROA, although it is not statistically significant, using a sample of automotive companies listed on the Indonesia Stock Exchange. Juliani et al. (2023) found an insignificant impact of DE on ROE in the case of manufacturing companies listed on the Indonesia Stock Exchange. Rachman et al. (2023) found that the DE ratio has a negative and insignificant impact on the financial performance (ROA) of IDX-listed property and real estate companies over the period 2016–2020. The results of a cross-country study by Lehenchuk et al. (2023) revealed the significant impact of DE on ROE of agricultural companies in Poland, Slovakia, and Ukraine, while the impact of DE on ROA and ROS was insignificant in the samples of the three countries.
Total Asset Turnover (TAT) is the activity ratio at which a company can achieve very high sales volume of products or services because it can effectively utilize all of its assets (Ratnaningtyas & Nurbaeti, 2023). Researchers study the impact of TAT on the financial performance of companies in various industries and countries. A number of researchers find the impact of TAT to be significant. For example, Irman and Purwati (2020) showed that the TAT ratio positively and significantly impacted ROA in the case of automobile companies listed on the Indonesia Stock Exchange. Jati et al. (2023) found that TAT had a negative and significant impact on the OPM of construction service companies in Indonesia. Lehenchuk et al. (2022) found that TAT significantly impacted the ROA of Slovak advertising agencies with a positive coefficient. Rachman et al. (2023) found that TAT has a positive and significant impact on the financial performance (ROA) of property and real estate companies listed on the IDX during 2016–2020. Nguyen et al. (2024) found a significant impact of TAT on ROA and ROE based on the results of a study of data from Vietnamese top 100 listed companies. On the contrary, other researchers conclude that TAT’s impact on financial performance is insignificant. For example, Dencic-Mihajlov (2015) found that TAT has a statistically insignificant impact on OPM using Serbian listed companies as a sample. Warrad and Omari (2015) found that TAT has no significant impact on the ROA and ROE of the Jordanian services sector. Juliani et al. (2023) found an insignificant impact on ROE in the case of manufacturing companies listed on the Indonesia Stock Exchange.
An analysis of the scientific literature revealed a significant gap: the lack of cross-country panel analysis examining how key financial ratios (Current Ratio, Debt to Equity, and Total Asset Turnover) specifically impact the financial performance of advertising and marketing companies. This gap is significant because understanding these relationships would provide valuable industry-specific benchmarks and inform strategic financial decision-making in this sector.

2.3. Advertising and Marketing Companies

The issue of identifying the influence of different types of determinants (influencing factors) on the financial performance of advertising and marketing companies is studied in the context of different countries and industries since determining factors (i.e., financial measures/ratios) that can accurately predict a firm’s performance is of great interest to any decision maker (Delen et al., 2013).
Cheong et al. (2013) focused on the operational efficiency of US advertising agencies. Feng et al. (2018) studied the determinants of advertising agency efficiency in the Chinese market. Collier et al. (2020) analyzed the interaction between creativity and organizational effectiveness in international advertising networks in the Asia–Pacific region (China, Hong Kong, Japan, and Australia). Lehenchuk et al. (2022) studied the financial performance of Slovak advertising agencies. The results of the study by Uniamikogbo et al. (2023) showed that corporate social responsibility has a significant positive impact on ROA, ROE, and stock price of Nigerian oil and gas marketing companies. A study by Sharabati et al. (2024) conducted on a sample of marketing companies in Jordan found relationships between digital marketing strategy, digital investment, customer engagement, digital transformation, and performance. Zavalii et al. (2024) studied the relationship between risk factors and financial results of Ukrainian advertising and marketing companies. Our analysis of these studies showed that in the context of the impact on financial performance indicators, the authors emphasize the importance of the impact of the size of advertising and marketing companies and financial leverage (Lehenchuk et al., 2022). Zavalii et al. (2024) highlight the role of innovation and transformation (Collier et al., 2020; Sharabati et al., 2024), with a focus on single-country studies (Cheong et al., 2013; Feng et al., 2018; Lehenchuk et al., 2022; Uniamikogbo et al., 2023; Sharabati et al., 2024; Zavalii et al., 2024).
An analysis of the scientific papers revealed a gap in research that determines the significance of the impact of key financial ratios (CR, DE, TAT) of advertising and marketing companies on financial performance through cross-country panel analysis.

3. Materials and Methods

3.1. Sampling

The econometric tool of panel data regression analysis was used for the empirical analysis of the determinants influencing the financial performance of advertising and marketing companies. Initially, 4241 companies were examined, but incomplete data led to a reduced sample size. The final study covered 785 companies from four Central and Eastern European countries, including 68 companies from the Czech Republic, 405 from Poland, 141 from the Slovak Republic, and 171 from Ukraine. The study’s time horizon covered the period 2021–2023. Its empirical basis was secondary data obtained from the international Orbis database and the companies’ financial statements. Only companies for which complete information was available for the period under study were included in the sample. According to the EU Classification of Economic Activities, the companies studied belong to group 73, “Advertising and market research”. At the time of data loading (29 November 2024), all companies in the sample had the status of “Active companies”. The sample included companies of three sizes: Large, Medium, and Very Large. Small enterprises were excluded solely due to widespread missing data that prevented the necessary calculations for this subgroup.

3.2. Variables

For a comprehensive approach to the analysis, independent variables were selected from various subgroups of financial ratios:
-
Liquidity ratio—Current Ratio;
-
Turnover ratio—Debt to Equity;
-
Solvency ratio—Total Asset Turnover.
A similar triad of financial ratios in the context of their impact on the financial performance of companies has been used in previous studies (Supardi et al., 2018; Irman & Purwati, 2020; Listiyono et al., 2022; Juliani et al., 2023; Lehenchuk et al., 2022; Rachman et al., 2023), which indicates the representativeness of the selected set of determinants.
The use of two indicators of company size (total assets and number of employees) is justified by the fact that they are considered alternative and not interchangeable, provided that multicollinearity between them is refuted. To improve the regression analysis, we calculated their natural logarithm (Martini et al., 2012). The number of employees is an important factor when analyzing the activities of advertising and marketing companies due to the specific nature of this sector, which scientists define as “human capital-intensive professional services” (Von Nordenflycht, 2010). In 2023, according to the studied samples, the share of companies with fewer than 10 employees was 13.5% in Ukraine, 31% in Poland, 38% in the Czech Republic, and 55% in Slovakia.
The dummy variable “Joint-stock company” was used to take into account the features of such a form of company organization as a joint-stock company, which has better opportunities to access financial resources, for example, through the issuance of shares, more stringent regulatory requirements for the creation of such a form of business organization, etc. According to Feng et al. (2018), agencies that adopted initial public offering (IPO) strategies performed better than those that did nothing.
Table 1 lists the names, calculation procedure, and abbreviations of the dependent, independent, and control variables used in the study.
Figure 1 shows the dynamics of three indicators (ROA, ROE, and OPM) that characterize the financial performance of Czech, Polish, Slovak, and Ukrainian advertising and marketing companies from 2021 to 2023.
The most stable indicators are demonstrated by Czech companies with a slight decrease in ROE from 35% to 30%, while ROA and OPM remain practically unchanged and amount to 15% and 8%, respectively. Polish companies show a gradual decrease in all indicators, with a particularly noticeable drop in ROE from 55% to 30%. Ukrainian companies demonstrate the greatest volatility in performance with a significant drop in 2022, which is associated with the outbreak of hostilities and subsequent recovery in 2023. Of particular note is the increase in ROE from 20% to almost 60%. Overall, despite the challenging economic conditions, all companies maintain positive profitability indicators, which demonstrates their ability to adapt to market challenges.

3.3. Equation

To determine the strength and direction of the influence of independent variables on financial performance for advertising and marketing companies in the Czech Republic, Poland, Slovakia, and Ukraine, the following model was examined:
Model: DVit = α + β1 CRit + β2 DEit + β3 TATit + β4 1_TAit + β5 1_NEit + β6 LEVit + β7 DJSC_1it + εit
where DV—dependent variable (ROA, ROE, OPM), with i = entity and t = time; α—identifier; β—regression coefficient; CR, DE, TAT—independent variables, 1_TA, 1_NE, LEV, DJSC_1—control variables, where i = entity and t = time; εit—error term.

4. Results

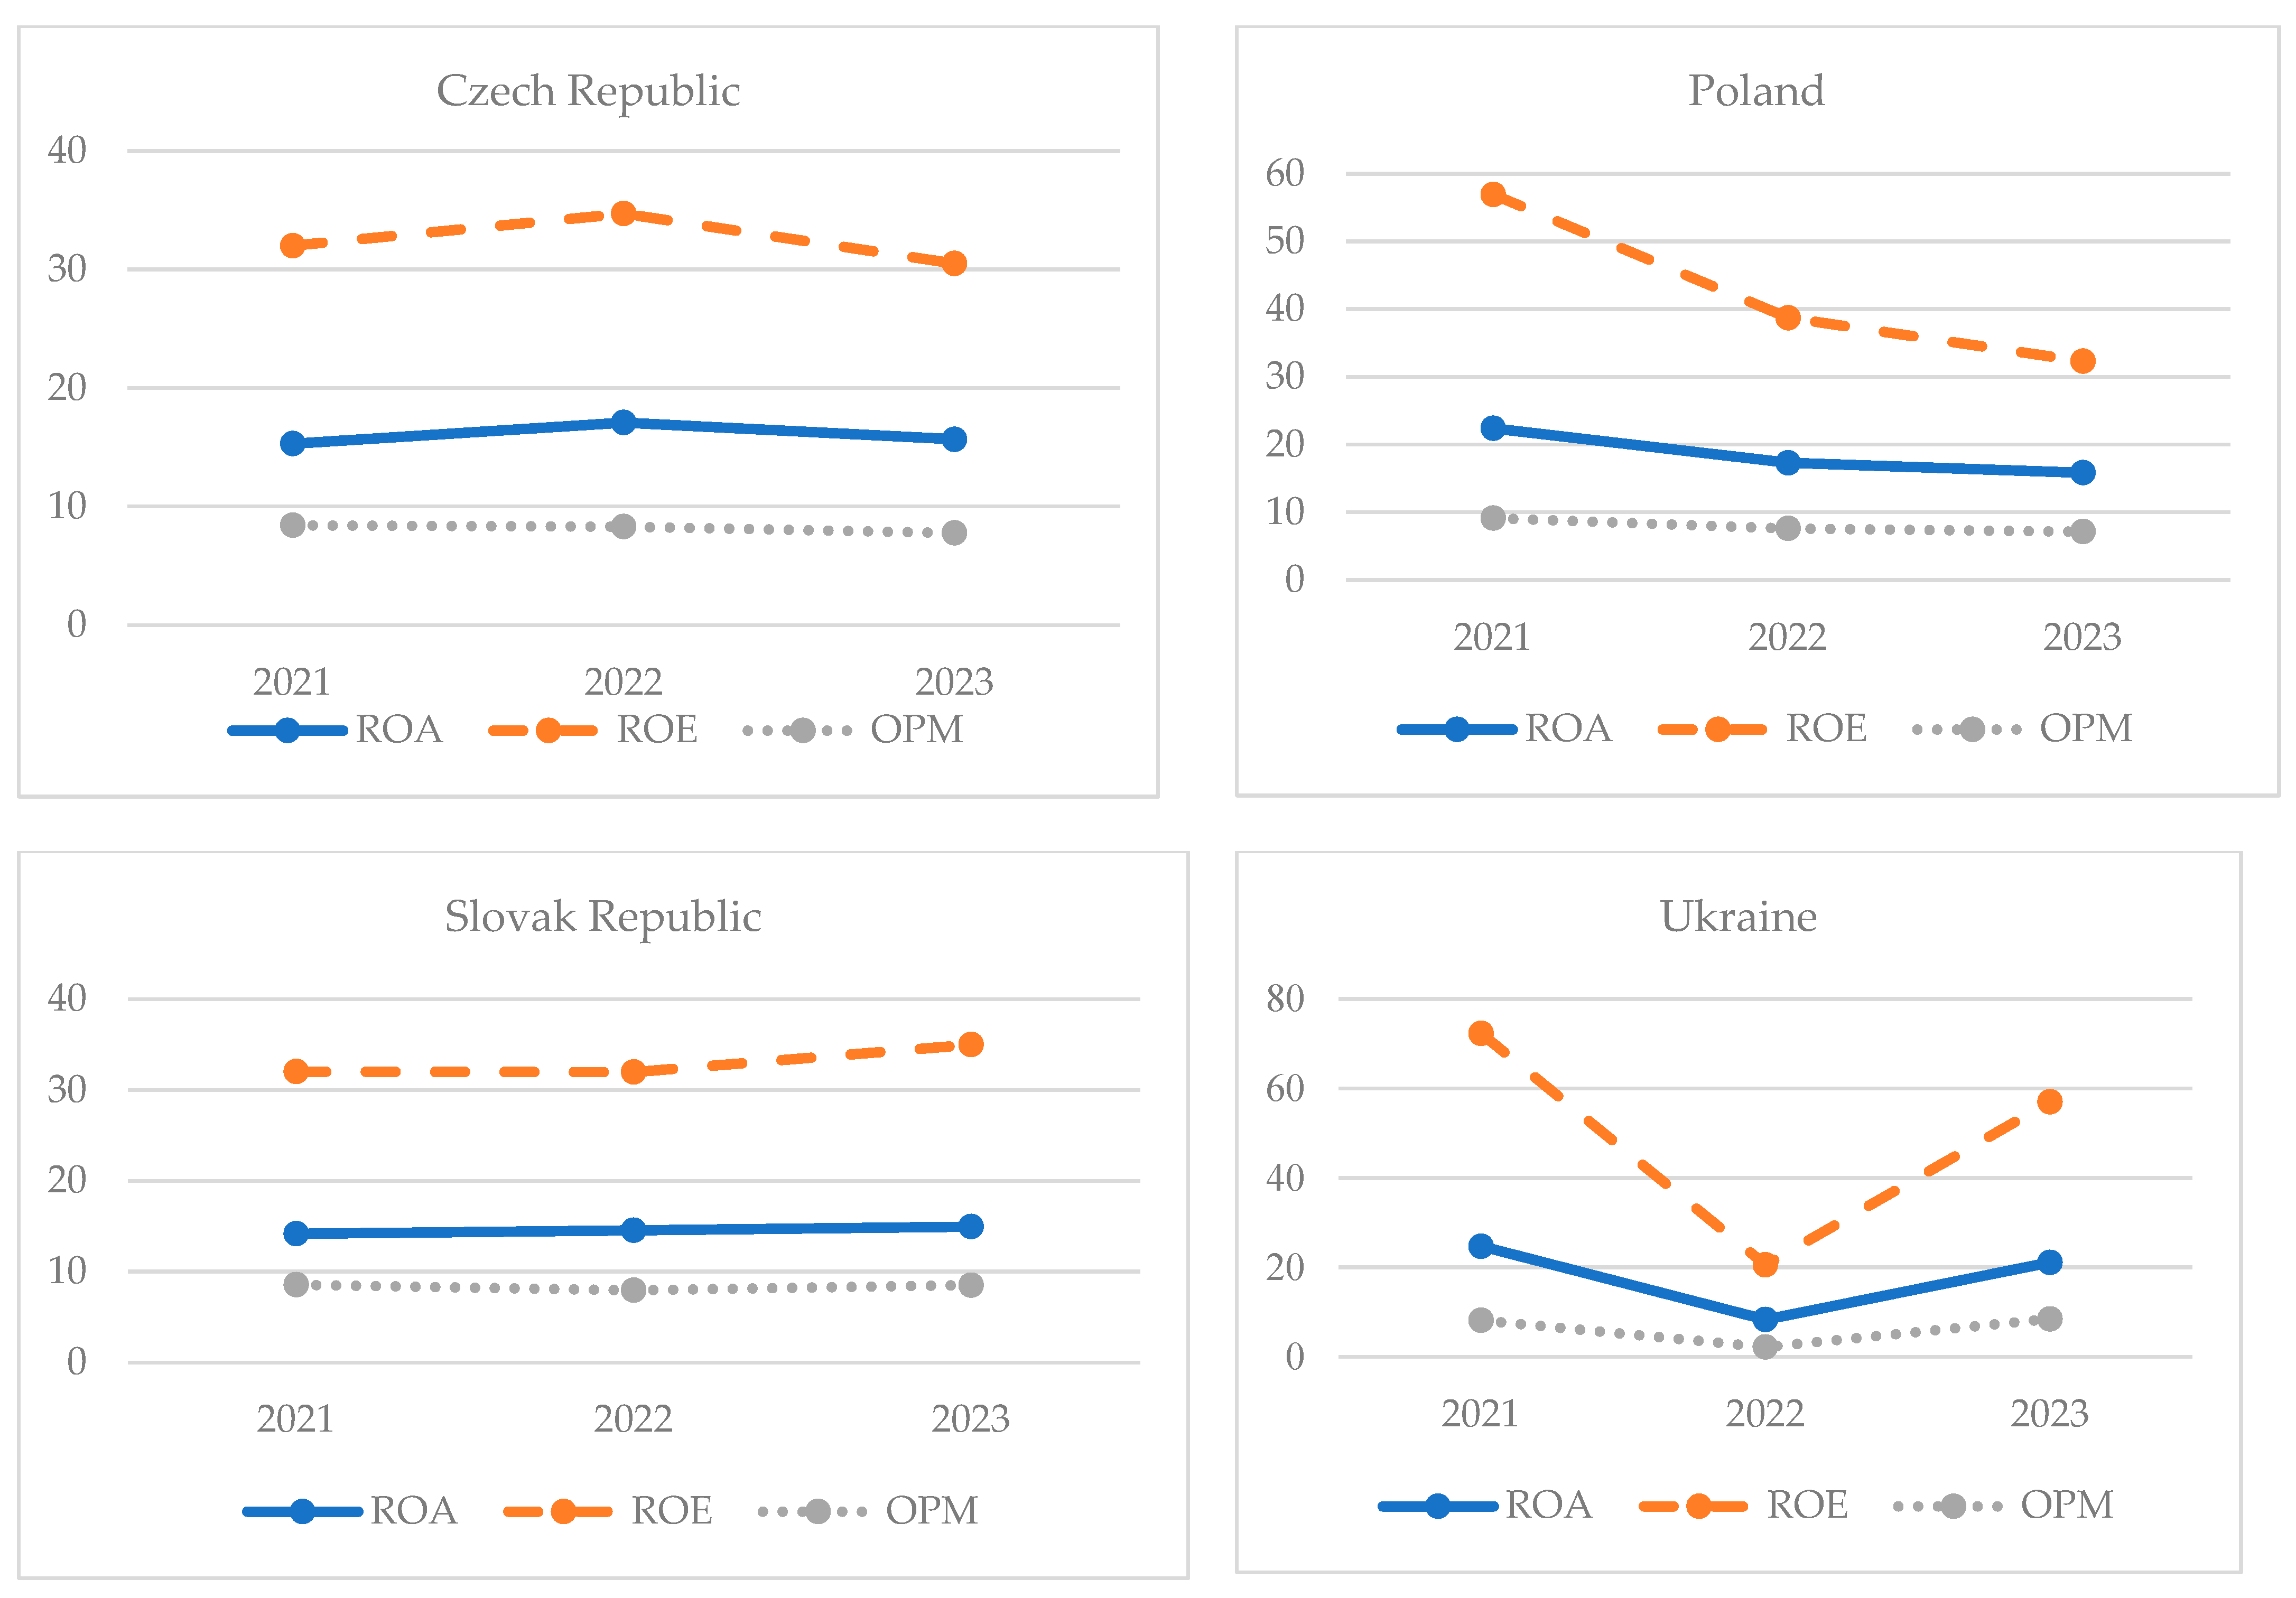
4.1. Descriptive Statistics

Table 2 shows the descriptive statistics (mean, minimum, and maximum) of all variables for the four countries.
The analysis of descriptive statistics of panel data for 2021–2023 on the activities of advertising and marketing companies in four countries (Czech Republic, Poland, Slovak Republic, and Ukraine) by financial performance indicators shows the following results:
-
Poland is the leader in average ROA values (mean = 18.5);
-
Ukraine is the leader in average ROE values (mean = 50.0), although it demonstrates the maximum volatility, from min −862.3 to max 840.61, compared to other countries;
-
The Slovak Republic is the leader in average OPM values (mean = 8.3), i.e., USD 8.3 of operating profit is generated from every dollar of sales before interest and taxes.
The results for all countries relative to the average value are CR > 2, which indicates a high ability to repay short-term liabilities. Logarithmized values of alternative indicators of company size (total assets and number of employees) demonstrate relative homogeneity of average values across countries, confirming samples’ comparability. Wide ranges of LEV values indicate the diversity of companies’ financial strategies in different countries, with maximum values near 100% indicating the presence of companies with critically high debt loads. The DJSC_1 variable, being binary (0—joint-stock company, 1—non-joint-stock company), indicates a low share of joint-stock companies in the sample (average values from 0.85 (Czech Republic) to 0.99 (Ukraine)).

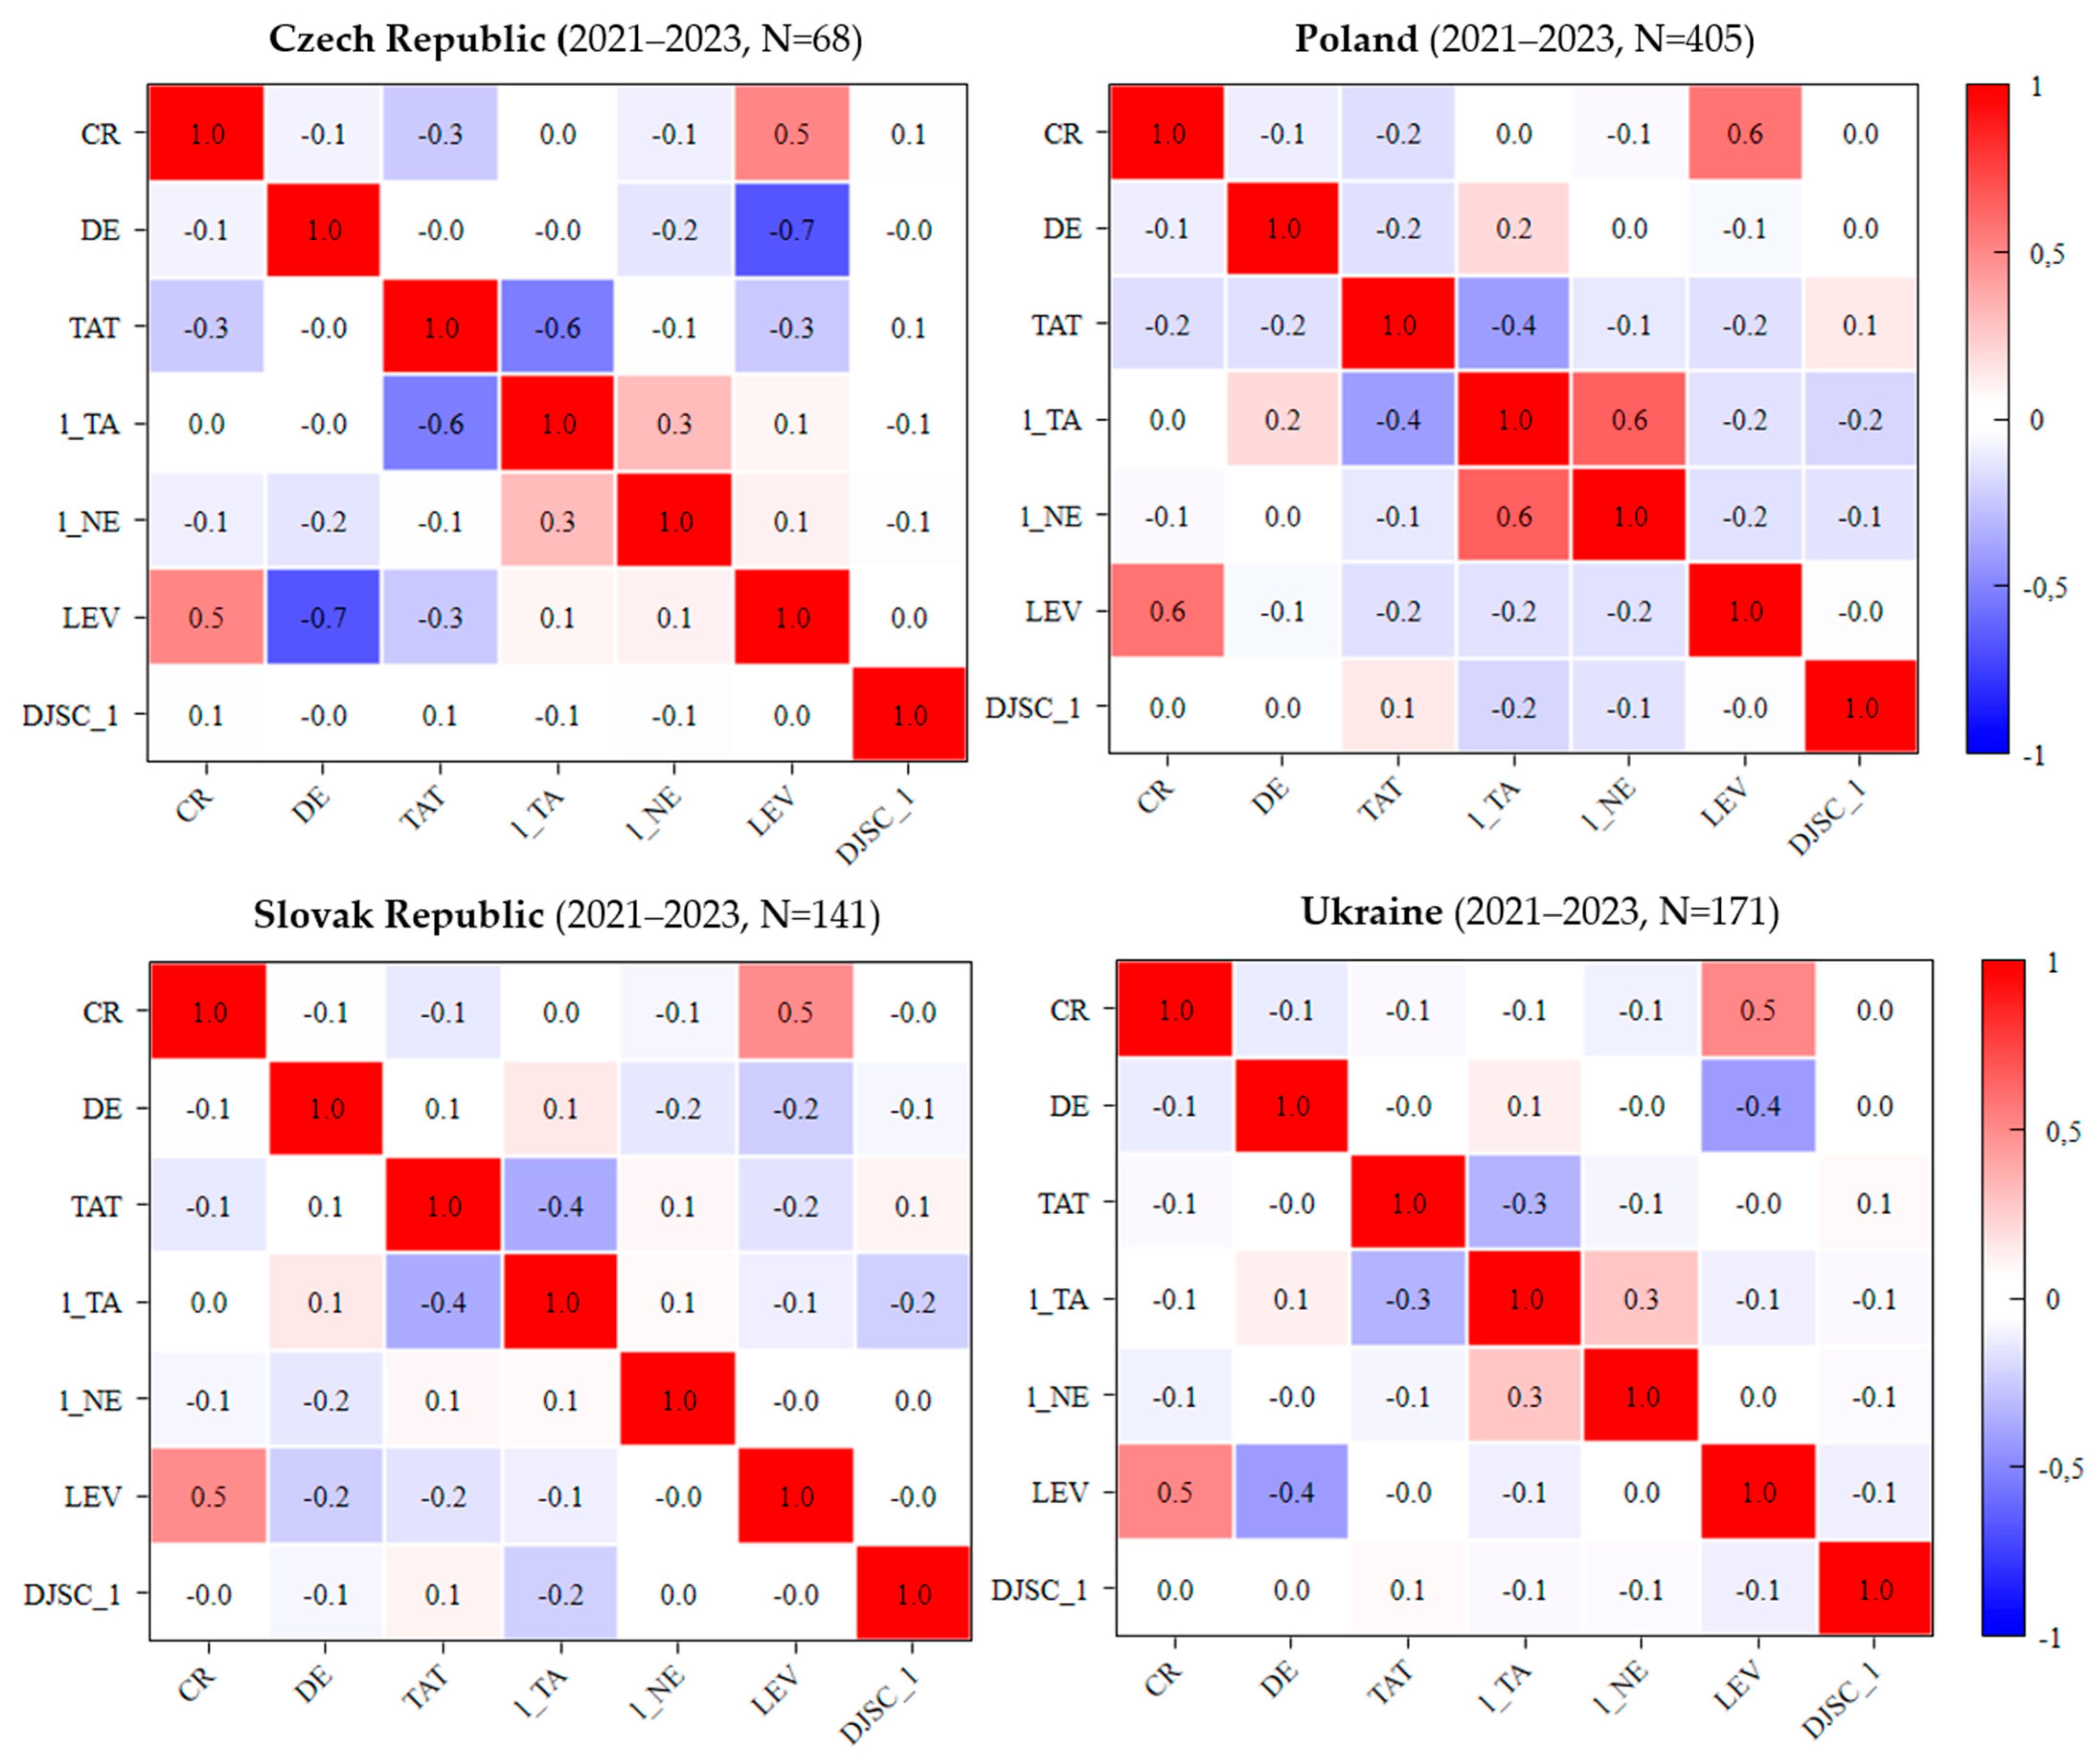
4.2. Multicollinearity Assessment

The requirement for conducting regression analysis is the absence of multicollinearity between independent variables, i.e., the absence of correlation coefficient values above “0.7–0.8” (or below the value of “−0.7”–“−0.8”). Figure 2 shows the correlation matrices for the samples of the countries under study.
The highest value of the correlation coefficient, “0.6922” (in Figure 2, the value is rounded to “0.7”), is recorded in the panel data of the Czech sample (Figure 2) between the independent variables DE and LEV, which generally meets the specified requirements and allows for regression analysis. However, in the future, one could consider excluding one of these two variables (DE or LEV) for the Czech sample, since these two indicators measure the level of debt.

4.3. Model Selection

The first step in choosing a model specification for panel data is to confirm/disconfirm the presence of significant individual effects using the Breusch–Pagan test (Table 3).
Data testing using the Breusch–Pagan test confirmed the possibility of using REM/FEM models as opposed to WLS since the p-value for all specifications takes extremely small values (<0.05).
The next step is to choose between REM and FEM based on the results of the Hausman test (Table 4).
If p > 0.05 is accepted, REM is the most appropriate model used in panel data regression. But if p ≤ 0.05, it is rejected and accepted, which means FEM is the most appropriate model for panel data regression.
Testing for autocorrelation of random errors is necessary for constructing a regression model, which is tested using the Wooldridge test (Table 5).
Based on the results of the Wooldridge test, it can be stated that the models for the Czech Republic and Ukraine, and partially for Slovakia, do not have the problem of first-order autocorrelation, which is confirmed in Table 5. This is a positive result, indicating that the assumption of independence of observations is met. However, all models for Poland and the model (ROE) for the Slovak Republic failed the autocorrelation test. For models where autocorrelation is captured, it is recommended to use robust standard errors and construct a robust covariance matrix to obtain more accurate conclusions about the statistical significance of the independent variables.
The results of the Breusch–Pagan test confirm the presence of statistically significant heteroscedasticity in all 12 models (Table 3), as the p-values are less than 0.05. The use of robust standard errors to minimize the negative impact of heteroscedasticity was not effective enough. In this regard, it was decided to implement a robust estimation method, namely the least absolute deviation (LAD) method. The main advantages of robust estimation methods are their robustness to outliers, deviations from data distribution assumptions, and heteroscedasticity problems. In addition, a comparative analysis was conducted of the information criteria for REM/FEM, the use of which was decided before the heteroscedasticity test, and LAD, the decision to use which was made after eliminating the heteroscedasticity problem in all 12 models (Table 6).
Information criteria are used to compare models with each other rather than to make absolute assessments of model quality: the lower the index, the better the model is considered. Table 6 shows that 10 out of 12 models have an advantage over LAD in three information criteria, while M3C and M1S have an advantage over FEM in two out of three information criteria. It is possible to use FEM for M3C and M1S with subsequent appropriate corrections for heteroscedasticity, but since LAD estimates would be more robust in the presence of heteroscedasticity, it was decided to use LAD for all the 12 models.

4.4. Empirical Results

Table 7 presents the results of the panel data regression analysis (p-value and significance level) for 12 models implemented using LAD.
The specificity of the LAD method does not involve calculating the coefficient of determination of the model; therefore, model adequacy is assessed based on analyzing the statistical significance of the coefficients for independent and control variables.
Based on the calculations carried out (Table 7), twelve analytical models were proposed, which can be interpreted using the equations below:
M1C (ROA): ROAit = 14.23 − 0.17·CRit − 1.59·DEit + 3.38·TATit + 0.43·1_TAit − 1.28·1_NEit − 0.08·LEVit − 0.5·DJSC_1it + εit;
M2C (ROE): ROEit = 70.33 + 0.33·CRit − 6.91·DEit + 4.83·TATit + 1.84·1_TAit − 3.89·1_NEit − 0.81·LEVit − 1.62·DJSC_1it + εit;
M3C (OPM): OPMit = 9.55 + 0.15·CRit − 0.21·DEit − 1.02·TATit + 0.5·1_TAit − 0.73·1_NEit − 0.02·LEVit − 1.08·DJSC_1it + εit;
M1P (ROA): ROAit = −11.11 + 1.22·CRit + 2.32·DEit + 3.68·TATit − 0.41·1_TAit − 0.008·1_NEit + 0.16·LEVit + 1.9·DJSC_1it + εit;
M2P (ROE): ROEit = 23.15 + 2.62·CRit + 5.95·DEit + 6.73·TATit − 2.97·1_TAit + 1.56·1_NEit − 0.34·LEVit + 3.95·DJSC_1 + εit;
M3P (OPM): OPMit = −2.66 + 1.41·CRit + 1.4·DEit − 0.009·TATit + 0.002·1_TAit − 0.03·1_NEit + 0.02·LEVit + 0.21·DJSC_1it + εit;
M1S (ROA): ROAit = −15.7 + 0.18·CRit − 0.014·DEit + 2.56·TATit + 0.88·1_TAit − 1.48·1_NEit + 0.22·LEVit + 8.98·DJSC_1it + εit;
M2S (ROE): ROEit = −31.74 + 0.74·CRit + 0.006·DEit + 9.32·TATit + 5.62·1_TAit − 5.85·1_NEit − 0.16·LEVit + 18.75·DJSC_1it + εit;
M3S (OPM): OPMit = −6.84 + 1.04·CRit − 0.009·DEit − 0.16·TATit + 1.03·1_TAit − 0.73·1_NEit + 0.07·LEVit + 2.34·DJSC_1it + εit;
M1U (ROA): ROAit = −9.68 − 0.08·CRit − 0.07·DEit + 1.69·TATit + 0.26·1_TAit − 0.93·1_NEit + 0.15·LEVit +11.9·DJSC_1it + εit;
M2U (ROE): ROEit = 33.11 + 0.29·CRit − 0.45·DEit + 3.11·TATit + 1.98·1_TAit − 3.06·1_NEit − 0.41·LEVit + 6.93·DJSC_1it + εit;
M3U (OPM): OPMit = −3.61 + 0.13·CRit − 0.01·DEit − 0.23·TATit + 0.45·1_TAit − 0.53·1_NEit + 0.05·LEVit + 4.8·DJSC_1it + εit
Models for ROA (M1C, M1P, M1S, M1U): TAT shows a significant and positive impact on ROA in all countries; CR and DE have a significant and positive impact on ROA only for Poland; 1_NE has a significant and negative impact on ROA in Ukraine; LEV has a significant and positive impact on ROA in Poland, the Slovak Republic, and Ukraine; DJSC_1 has a significant and positive impact for the Slovak Republic and Ukraine, i.e., taking into account the original coding of this dummy variable (Table 1), the ROA value will be higher for a non-joint-stock company (1) as opposed to a joint-stock company (0).
Models for ROE (M2C, M2P, M2S, M2U): TAT has a significant and positive impact on ROE in all countries; CR has a significant and positive impact on ROE only for Polish companies; mixed results are recorded for DE and 1_TA (DE has a significant and positive impact on ROE in Poland and a significant and negative impact in the Czech Republic; 1_TA has a significant and positive impact on ROE in the Slovak Republic and a significant and negative impact in Poland); company size, determined by the number of employees (l_NE), has a significant and negative impact on ROE in the Czech Republic and Slovak Republic; LEV has a significant and negative impact on ROE in the Czech Republic, Poland, and Ukraine; DJSC_1 has a significant and positive impact on ROE for Slovakia, i.e., given the original coding of this dummy variable (Table 1), the ROE value will be higher for a non-joint-stock company (1) than for a joint-stock company (0).
Models for OPM (M3C, M3P, M3S, M3U): TAT shows a significant and negative impact on OPM in the Czech Republic and Ukraine; CR has a significant and positive impact on OPM for Polish and Slovak companies; DE has a significant and positive impact on OPM only in Poland; 1_TA has a significant and positive impact on OPM in Slovakia and Ukraine; company size as measured by the number of employees (l_NE), has a significant and negative impact on OPM in the Czech Republic, Slovakia, and Ukraine; LEV has a significant and positive impact on OPM in Poland, Slovakia, and Ukraine; DJSC_1 is not a significant determinant in any model.
TAT is the most stable and significant factor influencing company profitability in all countries studied. It demonstrates a positive correlation with ROA (from +1.69 to +3.68) and ROE (from +3.11 to +9.32), which confirms the critical importance of effective asset management for improving business profitability.
CR shows the most significant and positive impact for Polish companies—with coefficients of +1.22 for ROA, +2.62 for ROE, and +1.41 for OPM, while for other countries its impact is statistically insignificant (except for the impact on OPM in Slovakia with a coefficient of +1.04).
DE shows a contradictory pattern of influence across countries: the most pronounced positive influence is observed for Polish companies (+2.32 for ROA, +5.95 for ROE, and +1.4 for OPM), while for Czech companies a significant negative influence on ROE (−6.91) and ROA (−1.59) is recorded, and for Slovak and Ukrainian companies the influence is mostly statistically insignificant.
The company size variable, expressed as the logarithm of total assets (1_TA), shows heterogeneous effects across countries. The most significant positive impact was observed for Slovak companies, with a value of +5.62 for ROE and a positive effect on OPM in Slovakia (+1.03) and Ukraine (+0.45). At the same time, a significant negative impact on ROE, with a coefficient of −2.97, was found for Polish companies.
The company size indicator expressed as the logarithm of the number of employees (1_NE) shows a predominantly negative impact on financial results: the most significant negative impact on ROE is for Slovak companies (−5.85) and Czech companies (−3.89), while there is also a negative impact on ROA for Ukrainian companies (−0.93), and on OPM for three countries—the Czech Republic (−0.73), Slovakia (−0.73), and Ukraine (−0.53)—which may indicate a decrease in efficiency with an increase in the number of employees.
LEV has a multidirectional impact on the financial performance of companies: for ROA, a positive significant impact is observed among Polish (+0.16), Slovak (+0.22), and Ukrainian companies (+0.15), while in terms of ROE, a stable negative impact is recorded among Czech (−0.81), Polish (−0.34), and Ukrainian companies (−0.41), and in terms of OPM, a significant positive impact is observed among Polish (+0.02), Slovak (+0.07), and Ukrainian (+0.05) companies.

5. Discussion

The analysis of the impact of financial indicators on the efficiency of advertising and marketing companies in CEE countries allowed us to draw the following conclusions and generalizations. TAT demonstrates the most consistent positive impact on ROA across all countries studied, confirming the importance of effective asset management to improve profitability. The capital structure, expressed through the debt-to-equity ratio (DE), has an ambiguous effect: negative for Czech companies (−1.59*) and positive for Polish ones (2.32***). This indicates differences in the efficiency of using borrowed capital in different countries. CR has the most significant impact on the performance of Polish companies, where a positive correlation (1.22***) with ROA is observed. Company size, expressed as the logarithm of the number of employees (I_NE), shows a predominantly negative impact on ROE, especially in the Slovak Republic (−5.85**). LEV shows a positive impact on ROA for Ukrainian and Slovak companies, but a negative impact on ROE in most countries. DJSC_1 has a statistically significant impact on the financial performance of Slovak (ROA and ROE) and Ukrainian (ROA) companies. And given that this is a dummy variable, for Slovak companies, the ROA and ROE indicators will be higher for non-joint-stock companies, which is similar for Ukrainian companies regarding ROA. The lowest sensitivity to the factors under study compared to ROA and ROE is shown by OPM, which may indicate a greater dependence of operational efficiency on internal management factors.
The business environments within the CEE region are characterized by significant heterogeneity across several dimensions. These countries represent different stages of market development and economic transition, with Poland exhibiting more mature market structures compared to Ukraine’s developing economy. Regulatory frameworks vary substantially, with different approaches to corporate governance, taxation, and financial reporting requirements. The post-Soviet legacy influences business practices differently across countries, with varying levels of institutional reform and market liberalization. Each country also demonstrates distinct financial market development, with differing access to capital, banking sector stability, and foreign investment flows. Additionally, these economies responded differently to recent economic shocks including the COVID-19 pandemic and regional geopolitical tensions, creating divergent macroeconomic conditions that affect business operations and financial decision-making across the region.
The analysis of the results of models confirming or refuting the significance of the influence of individual determinants on ROA for advertising and marketing companies in CEE countries shows significant differences in their influence between countries (Table 8).
The most complex impact was found for Polish companies, where CR, DE, and TAT have a significant positive impact at the 1% level, which indicates a balanced impact of all the factors studied. This is consistent with the findings of Supardi et al. (2018), who found similar patterns in Indonesian firms, and partly due to the significant influence of CR and TAT, supported by Irman and Purwati (2020) and Nguyen et al. (2024).
The results for Czech companies form a more complex picture due to a significant but opposite effect: negative for DE (1%) and positive for TAT (1%). Similar results, also obtained in the study by Lehenchuk et al. (2022) on the example of Slovak advertising agencies, point to the critical importance of balancing capital structure and asset efficiency. Slovak and Ukrainian companies show similar results regarding the impact of factors, where TAT and LEV play a key role (positive impact at the 1% level). Rachman et al. (2023) obtained similar results regarding the impact of TAT.
The significant positive impact of TAT on ROA is common to all countries, highlighting the fundamental importance of effective asset management for financial performance in the CEE region. However, this contrasts with the results of Warrad and Omari (2015), who found little impact of TAT on Jordan’s services sector, which could be explained by differences in business models and market environments relative to the countries studied.
The significance of LEV for ROA in companies from Poland, Slovakia, and Ukraine, which is consistent with the findings of Ramnoher and Seetah (2020), highlights the importance of capital structure for financial performance in emerging markets.
The analysis of the results of modeling the impact of determinants on the ROE of advertising and marketing companies in CEE countries reveals both general patterns and significant differences between the countries studied (Table 9).
Most notable is the universal nature of the effect of TAT, which shows a positive and statistically significant impact on ROE in all countries studied. This result is consistent with the findings of Nguyen et al. (2024), but contrasts with Warrad and Omari (2015), who found an insignificant impact of TAT on ROE. This discrepancy can be explained by differences in market specificities and business models across regions.
Of particular interest is the LEV indicator, which shows a significant negative impact on ROE for companies from three countries—the Czech Republic, Ukraine, and Poland (at the level of 1%). This pattern, which was also observed in the study by Ramnoher and Seetah (2020) on Mauritian listed companies, may indicate that excessive debt burden reduces the efficiency of using equity capital in emerging markets. However, no such trend was found for Slovak companies. For Polish companies, in addition to the factors already mentioned, a significant positive impact of CR and DE (at the 1% level) and a negative impact of 1_TA (at the 5% level) were also found. This may indicate a greater maturity and complexity of the Polish advertising services market.
Other indicators show significant heterogeneity in their impact across firms in different countries or are statistically insignificant. Such variability may reflect differences in the regulatory environment, market structure, and business practices across CEE countries.
The econometric modeling of the impact of determinants on OPM of advertising and marketing companies in CEE countries reveals significant regional heterogeneity in the impact of the factors studied (Table 10).
The most universal characteristic for enterprises in all the countries studied is the lack of a statistically significant effect of organizational and legal form (DJSC_1) on OPM. This indicates that the status of a joint-stock company is not a determining factor in operational efficiency in the region’s advertising and marketing services.
CR shows a significant positive impact on OPM for Polish (at the 1% level) and Slovak companies (at the 10% level), which is consistent with the results of Dencic-Mihajlov (2015) and Durrah et al. (2016). At the same time, this effect turned out to be statistically insignificant for Czech and Ukrainian companies, which emphasizes the regional peculiarities of the influence of liquidity on operational efficiency.
The effect of TAT was found to be statistically significant with a negative coefficient for Czech (at the 1% level) and Ukrainian (at the 1% level) companies, which is consistent with the findings of Jati et al. (2023). Instead, confirming the findings of the study by Dencic-Mihajlov (2015), the effect of TAT for Polish and Slovak companies was found to be insignificant.
LEV shows a statistically significant positive impact on companies from the three countries studied (Poland, Slovakia, and Ukraine), with the impact being most significant for companies from Poland and Ukraine (at the 1% level). This indicates a predominantly positive impact of the use of debt capital on the operational efficiency of companies in the region’s industry, except for the Czech Republic, where this impact was statistically insignificant.
The Polish market shows the highest sensitivity of OPM to financial indicators, which is confirmed by the significant positive impact of CR and DE indicators at the 1% level. This may indicate greater maturity and efficiency of Polish companies’ financial management.
Our study provides important practical implications for managers of advertising and marketing companies in CEE countries. The findings demonstrate that efficient asset management is crucial across all studied markets, as evidenced by the consistent positive impact of TAT on both ROA and ROE. This suggests that managers should prioritize the regular monitoring and optimization of asset utilization while developing appropriate performance metrics. The research reveals distinct country-specific approaches to capital structure management. Managers of Polish companies can benefit from more aggressive debt financing strategies, while maintaining strong liquidity positions. In contrast, Czech companies should adopt more conservative debt financing approaches, as higher DE ratios negatively impact their performance. For Slovak and Ukrainian companies, the strategic use of LEV can be beneficial, though managers should carefully consider their organizational structure, as non-joint-stock companies show superior performance in these markets. Operational efficiency management requires market-specific approaches based on our findings. In the Polish market, managers should implement comprehensive financial management systems that monitor multiple financial indicators simultaneously. Czech and Ukrainian market managers should focus on optimizing operational processes, considering the negative correlation between TAT and OPM. The size of operations, particularly in terms of employee numbers, requires careful consideration across all markets, as our research indicates potential negative impacts on ROE. These findings emphasize the importance of adapting financial and operational strategies to market-specific conditions while maintaining focus on core performance indicators. Managers should consider their specific market conditions and company characteristics when implementing these recommendations, while maintaining flexibility to adjust strategies based on changing market conditions and company performance.
The study has a number of limitations that should be considered by other scientists when using and interpreting the results obtained in this article. Firstly, the study sample was limited to data from four CEE countries—the Czech Republic, Poland, Slovakia, and Ukraine. Secondly, the financial reporting data for 2021–2023 were used, so this time period can be extended to obtain more accurate results. Thirdly, the list of dependent variables characterizing financial efficiency can be supplemented with other indicators depending on the directions and objectives of the study. Fourth, the list of independent variables can also be expanded to include other regressors to identify more complex causal relationships. Overcoming these limitations will enable future research in several directions, particularly expanding the comparative analysis to include more CEE countries and enhancing the proposed model by incorporating additional influential factors.

6. Conclusions

The primary purpose of this study is to investigate the determinants of financial performance in advertising and marketing companies across four CEE countries—the Czech Republic, Poland, the Slovak Republic, and Ukraine—using panel data analysis for the period 2021–2023. The comprehensive analysis of financial performance determinants in advertising and marketing companies across CEE countries reveals significant cross-country variations in the impact of financial ratios, highlighting the importance of considering the regional context in financial performance assessment. The study demonstrates that while some determinants show consistent results across countries, others exhibit substantial heterogeneity in their influence on ROA, ROE, and OPM, reflecting the diverse nature of business environments within the CEE region.
Total Asset Turnover (TAT) emerges as the most consistent determinant, showing a significant positive influence on ROA and ROE across all studied countries, although its impact on OPM varies. This finding underscores the fundamental importance of asset efficiency management for financial performance in the advertising and marketing sector, regardless of the specific national context. However, the study reveals that this relationship becomes more complex when considering operational profitability, where TAT shows negative effects for companies in some countries, particularly in the Czech Republic and Ukraine.
The analysis of Current Ratio (CR) and Debt to Equity (DE) indicators reveals notable regional differences, with Poland demonstrating the most comprehensive response to these factors across all performance metrics. The significant positive impact of both CR and DE on Polish companies’ performance suggests a more mature market with better-developed financial management practices. However, these indicators show varying degrees of significance in other countries, indicating that the importance of liquidity and debt management strategies differs across national markets within the CEE region.
The analysis demonstrates varying leverage (LEV) impacts across different performance metrics and companies from different countries. While LEV shows a predominantly negative relationship with ROE in most countries, it positively influences OPM for Polish, Slovak, and Ukrainian companies, suggesting that the role of financial leverage in company performance is highly context-dependent and varies based on the specific performance metric being considered. This finding highlights the complexity of capital structure decisions for advertising and marketing companies in the regional context of CEE countries.

Author Contributions

Conceptualization, T.Z. and S.L.; methodology, S.L.; software, T.Z. and I.H.; validation, T.Z., S.L., I.H. and L.C.; formal analysis, L.C.; resources, L.C.; data curation, L.C.; writing—original draft preparation, T.Z.; writing—review and editing, S.L.; visualization, I.H.; supervision, S.L.; project administration, I.H. All authors have read and agreed to the published version of the manuscript.

Funding

This research received no external funding.

Institutional Review Board Statement

Not applicable.

Informed Consent Statement

Not applicable.

Data Availability Statement

Due to ethical reasons, data will be supplied upon request.

Conflicts of Interest

The authors declare no conflicts of interest.

Abbreviations

The following abbreviations are used in this manuscript:
CEECentral and Eastern Europe
CCACross-country analysis
ROAReturn on Assets
ROEReturn on Equity
OPMOperating Profit Margin
CRCurrent Ratio
DEDebt to Equity
TATTotal Asset Turnover
1_TALogarithm of total assets
1_NELogarithm of the number of employees
LEVLeverage
DJSC_1Dummy variable for joint-stock company
WLSWeighted Least Squares
REMRandom Effect Model
FEMFixed Effect Model
LADLeast Absolute Deviations
IDXIndonesia Stock Exchange

References

  1. Abraham, R., Chaarani, H. E., & Tao, Z. (2024). The Impact of audit oversight quality on the financial performance of U.S. firms: A Subjective assessment. Journal of Risk and Financial Management, 17(4), 151. [Google Scholar] [CrossRef]
  2. Arikawa, Y., Inoue, K., & Saito, T. (2019). Corporate Governance, employment, and Financial Performance of Japanese Firms: A Cross-Country Analysis. SSRN Electronic Journal. [Google Scholar] [CrossRef]
  3. Bhatia, S., & Srivastava, A. (2016). Working capital management and firm performance in emerging economies: Evidence from india. Management and Labour Studies, 41(2), 71–87. [Google Scholar] [CrossRef]
  4. Cardinal, L. B. (2001). Technological innovation in the pharmaceutical industry: The use of organizational control in managing research and development. Organization Science, 12(1), 19–36. [Google Scholar] [CrossRef]
  5. Chen, F., Ngniatedema, T., & Li, S. (2018). A cross-country comparison of green initiatives, green performance and financial performance. Management Decision, 56(5), 1008–1032. [Google Scholar] [CrossRef]
  6. Cheong, Y., Kim, K., & Combs, J. (2013). Advertising agency operating efficiency. Journal of Marketing Communications, 22(1), 83–99. [Google Scholar] [CrossRef]
  7. Cieślik, A., Michałek, A., Michałek, J., & Mycielski, J. (2015). Determinants of export performance: Comparison of Central European and Baltic firms. Finance a Uver-czech Journal of Economics and Finance, 64(3), 211–229. [Google Scholar]
  8. Collier, P. M., Ewing, M. T., & Cooper, H. B. (2020). Balancing creativity and organisational performance in an advertising agency network: A case study. Journal of Marketing Communications, 27(8), 840–864. [Google Scholar] [CrossRef]
  9. Delen, D., Kuzey, C., & Uyar, A. (2013). Measuring firm performance using financial ratios: A decision tree approach. Expert Systems With Applications, 40(10), 3970–3983. [Google Scholar] [CrossRef]
  10. Dencic-Mihajlov, K. (2015). Profitability during the financial crisis: Evidence from the regulated capital market in Serbia. SEEJE, 12(1), 7–33. [Google Scholar]
  11. Diaz-Fernandez, M., Bornay-Barrachina, M., & Lopez-Cabrales, A. (2015). Innovation and firm performance: The role of human resource management practices. Evidence-based HRM a Global Forum for Empirical Scholarship, 3(1), 64–80. [Google Scholar] [CrossRef]
  12. Durrah, O., Rahman, A. a. A., Jamil, S. A., & Ghafeer, N. A. (2016). Exploring the Relationship between Liquidity Ratios and Indicators of Financial Performance: An Analytical Study on Food Industrial Companies Listed in Amman Bursa. International Journal of Economics and Financial Issues, 6(2), 435–441. [Google Scholar]
  13. Feng, G. C., Zhang, Y., Hu, Q., & Cheng, H. (2018). Performance of China’s advertising agencies: A time series cross-sectional analysis. Asia Pacific Business Review, 24(5), 656–674. [Google Scholar] [CrossRef]
  14. Gharios, R., Awad, A. B., Khalaf, B. A., & Seissian, L. A. (2024). The impact of board gender diversity on European firms’ performance: The moderating role of liquidity. Journal of Risk and Financial Management, 17(8), 359. [Google Scholar] [CrossRef]
  15. González, V. M. (2012). Leverage and corporate performance: International evidence. International Review of Economics & Finance, 25, 169–184. [Google Scholar] [CrossRef]
  16. Hantono, H. (2018). The effect of current ratio, debt to equity ratio, toward return on assets (case study on consumer goods company). Accountability, 7(02), 64. [Google Scholar] [CrossRef]
  17. Hasan, I., Kobeissi, N., Liu, L., & Wang, H. (2016). Corporate social responsibility and firm financial performance: The mediating role of productivity. Journal of Business Ethics, 149(3), 671–688. [Google Scholar] [CrossRef]
  18. Hashmi, S. D., Gulzar, S., Ghafoor, Z., & Naz, I. (2020). Sensitivity of firm size measures to practices of corporate finance: Evidence from BRICS. Future Business Journal, 6(1), 9. [Google Scholar] [CrossRef]
  19. Irman, M., & Purwati, A. A. (2020). Analysis on the influence of current ratio, debt to equity ratio and total asset turnover toward return on assets on the otomotive and component company that has been registered in Indonesia Stock Exchange within 2011–2017. International Journal of Economics Development Research (IJEDR), 1(1), 36–44. [Google Scholar] [CrossRef]
  20. Jati, D., Setiawan, H., Purnomo, S. D., Muntahanah, S., Zuhaena, F., & Arinastuti, A. (2023). Determinants of profitability: Evidence from construction companies listed on indonesian securities market. JAMPE (Journal of Asset Management and Public Economy), 2(2), 108–118. [Google Scholar] [CrossRef]
  21. Juliani, D. I., Karyatun, S., & Digdowiseiso, K. (2023). The effect of current ratio, total asset turnover and debt to equity ratio on the financial performance of manufacturing companies listed on the Indonesia Stock Exchange for the 2016–2020 period. Jurnal Syntax Admiration, 4(4), 630–643. [Google Scholar] [CrossRef]
  22. Kangari, R., Farid, F., & Elgharib, H. M. (1992). Financial Performance Analysis for construction industry. Journal of Construction Engineering and Management, 118(2), 349–361. [Google Scholar] [CrossRef]
  23. Kiymaz, H., Haque, S., & Choudhury, A. A. (2024). Working capital management and firm performance: A comparative analysis of developed and emerging economies. Borsa Istanbul Review, 24(3), 634–642. [Google Scholar] [CrossRef]
  24. Lehenchuk, S., Chyzhevska, L., Meluchová, J., Zdyrko, N., & Voskalo, V. (2023). Determinants of agricultural companies’ financial performance: The experience of Poland, Slovakia and Ukraine. Investment Management and Financial Innovations, 20(1), 99–111. [Google Scholar] [CrossRef]
  25. Lehenchuk, S., Serpeninova, Y., Zavalii, T., Juhaszova, Z., & Kordošová, A. (2022). The impact of financial performance on the profitability of advertising agencies in the Slovak Republic. Strategic Management, 28(1), 41–50. [Google Scholar] [CrossRef]
  26. Levin, E., Quach, T. N., & Thaichon, P. (2018). Enhancing client-agency relationship quality in the advertising industry—An application of project management. Journal of Business and Industrial Marketing, 34(2), 463–473. [Google Scholar] [CrossRef]
  27. Levin, E., Thaichon, P., Quach, S., & Lobo, A. (2017). The role of creativity and project management in enhancing service quality of Advertising Agencies: A Qualitative approach. Australasian Marketing Journal (AMJ), 26(1), 31–40. [Google Scholar] [CrossRef]
  28. Li, M. L., & Hwang, N. R. (2011). Effects of firm size, financial leverage and R&D expenditures on firm earnings: An analysis using quantile regression approach. Abacus, 47(2), 182–204. [Google Scholar] [CrossRef]
  29. Listiyono, A., Lau, E. A., & Dewi, C. K. (2022). Pengaruh current ratio, debt to equity ratio, total assets turnover terhadap pertumbuhan laba rumah sakit yang terdaftar di bursa efek Indonesia pada masa COVID 19. Exchall Economic Challenge, 4(1), 87–99. [Google Scholar] [CrossRef]
  30. Lopez-Valeiras, E., Gomez-Conde, J., & Fernandez-Rodriguez, T. (2016). Firm size and financial performance: Intermediate effects of indebtedness. Agribusiness, 32(4), 454–465. [Google Scholar] [CrossRef]
  31. Lynch, J. (2019). Advertising industry evolution: Agency creativity, fluid teams and diversity. An exploratory investigation. Journal of Marketing Management, 35(9–10), 845–866. [Google Scholar] [CrossRef]
  32. Madushanka, K. H. I., & Jathurika, M. (2018). The Impact of Liquidity Ratios on Profitability (With special reference to Listed Manufacturing Companies in Sri Lanka). International Research Journal of Advanced Engineering and Science, 3(4), 157–161. [Google Scholar] [CrossRef]
  33. Martini, S. B., Corvino, A., & Rigolini, A. (2012). Board diversity and structure: What implications for investments in innovation? Empirical evidence from Italian context. Corporate Ownership and Control, 10(1), 9–25. [Google Scholar] [CrossRef]
  34. Mazanec, J. (2023). Capital structure and corporate performance: An empirical analysis from central Europe. Mathematics, 11(9), 2095. [Google Scholar] [CrossRef]
  35. Nassim, I., & Benraïss, B. (2024). Capital structure and financial performance of Moroccan Agricultural Small-and Medium-Sized Enterprises: Moderating effects of Government subsidies. Journal of Risk and Financial Management, 17(7), 256. [Google Scholar] [CrossRef]
  36. Nguyen, T. T. C., Le, A. T. H., & Van Nguyen, C. (2024). The impact of liquidity and corporate efficiency on profitability. Emerging Science Journal, 8(1), 180–191. [Google Scholar] [CrossRef]
  37. Nyilasy, G., Canniford, R., & Kreshel, P. J. (2013). Ad agency professionals’ mental models of advertising creativity. European Journal of Marketing, 47(10), 1691–1710. [Google Scholar] [CrossRef]
  38. O’Connor, H., Kilgour, M., Koslow, S., & Sasser, S. (2017). Drivers of creativity within advertising agencies. Journal of Advertising Research, 58(2), 202–217. [Google Scholar] [CrossRef]
  39. Odhiambo, A., Koske, N., & Limo, P. (2022). Debt-Equity ratio, CEO power and financial performance of listed companies at the Nairobi Securities Exchange, Kenya. European Journal of Business Management and Research, 7(2), 330–338. [Google Scholar] [CrossRef]
  40. Patin, J., Rahman, M., & Mustafa, M. (2020). Impact of total asset turnover ratios on equity returns: Dynamic panel data analyses. Journal of Accounting Business and Management (JABM), 27(2), 19. [Google Scholar] [CrossRef]
  41. Rachman, S., Karyatun, S., & Digdowiseiso, K. (2023). The effect of current ratio, debt to equity ratio, debt to asset ratio, and total asset turnover on the financial performance of property and real estate companies listed in the IDX for the 2016–2020 period. Jurnal Syntax Admiration, 4(2), 361–377. [Google Scholar] [CrossRef]
  42. Ramnoher, L., & Seetah, K. (2020). The link between profitability and financial leverage, evidence from a small island economy. Asian Journal of Finance & Accounting, 12(1), 58. [Google Scholar] [CrossRef]
  43. Ratnaningtyas, H., & Nurbaeti, N. (2023). The effect of current ratio and total assets turnover on stock prices and return on assets as intervening variables. At-Tadbir Jurnal Ilmiah Manajemen, 7(1), 54. [Google Scholar] [CrossRef]
  44. Rizqullah, R., & Siregar, J. K. (2021). The determinant of financial performance based on good corporate governance and company size in the basic industrial and chemical sectors 2015–2019. In First international conference on science, technology, engineering and industrial revolution (ICSTEIR 2020). Atlantis Press. [Google Scholar] [CrossRef]
  45. Sharabati, A.-A. A., Ali, A. A. A., Allahham, M. I., Hussein, A. A., Alheet, A. F., & Mohammad, A. S. (2024). The impact of digital marketing on the performance of SMEs: An analytical study in light of modern digital transformations. Sustainability, 16(19), 8667. [Google Scholar] [CrossRef]
  46. Siminica, M., Ionașcu, C., & Sichigea, M. (2018). Corporate social performance versus financial performance of the romanian firms. Prague Economic Papers, 28(1), 49–69. [Google Scholar] [CrossRef]
  47. Supardi, H., Suratno, H. S. H., & Suyanto, S. (2018). Pengaruh current ratio, debt to asset ratio, total asset turnover dan inflasi terhadap return on asset. JIAFE (Jurnal Ilmiah Akuntansi Fakultas Ekonomi), 2(2), 16–27. [Google Scholar] [CrossRef]
  48. Szabo, R. Z., Herceg, I. V., Hanák, R., Hortovanyi, L., Romanová, A., Mocan, M., & Djuričin, D. (2020). Industry 4.0 implementation in B2B companies: Cross-country empirical evidence on digital transformation in the CEE region. Sustainability, 12(22), 9538. [Google Scholar] [CrossRef]
  49. Thuraisingam, R. (2015). The Effects of liquidity management on firm profitability: Evidence from Sri Lankan listed companies. Research Journal of Finance and Accounting, 6(5), 129–134. [Google Scholar]
  50. Tran, V. H., Van Nguyen, D., Tran, M. M., & Duong, K. D. (2023). Capital structure and profitability of listed firms in a transition market, Does debt maturity matter? Montenegrin Journal of Economics, 19(1), 161–171. [Google Scholar] [CrossRef]
  51. Uniamikogbo, E., Wogu, I. a. P., Aigienohuwa, O. O., Misra, S., & Kaushik, M. (2023). Corporate social responsibility and the financial performance of oil and gas entrepreneurial marketing firms. In futuristic technology perspectives on entrepreneurship and sustainable innovation (pp. 52–73). IGI Global. [Google Scholar] [CrossRef]
  52. Von Nordenflycht, A. (2010). Firm Size and Industry Structure Under Human Capital Intensity: Insights from the Evolution of the Global Advertising Industry. Organization Science, 22(1), 141–157. [Google Scholar] [CrossRef]
  53. Waddock, S., & Graves, S. (1997). The corporate social performance—Financial performance link. Strategic Management Journal, 18, 303–319. [Google Scholar] [CrossRef]
  54. Warrad, N. L., & Omari, N. R. A. (2015). The impact of turnover ratios on Jordanian services sectors’ performance. Journal of Modern Accounting and Auditing, 11(2), 77–85. [Google Scholar] [CrossRef]
  55. Weill, L. (2007). Leverage and corporate performance: Does institutional environment matter? Small Business Economics, 30(3), 251–265. [Google Scholar] [CrossRef]
  56. Wieczorek-Kosmala, M., Błach, J., & Gorzeń-Mitka, I. (2021). Does capital structure drive profitability in the energy sector? Energies, 14(16), 4803. [Google Scholar] [CrossRef]
  57. Xie, Q., Neill, M. S., & Schauster, E. (2018). Paid, earned, shared and owned media from the perspective of advertising and public relations agencies: Comparing China and the United States. International Journal of Strategic Communication, 12(2), 160–179. [Google Scholar] [CrossRef]
  58. Zavalii, T., Lehenchuk, S., Poyda-Nosyk, N., Ishchenko, Y., & Hrabchuk, O. (2024). Nexus between risk factors and financial performance: The case of Ukrainian advertising and marketing companies. Investment Management and Financial Innovations, 21(4), 349–360. [Google Scholar] [CrossRef]
Figure 1. ROA, ROE, and OPM trends in Czech, Polish, Slovak, and Ukrainian advertising and marketing companies in 2021–2023. Source: compiled by authors.
Jrfm 18 00141 g001
Figure 2. Correlation matrices. Note: Generated using the Gretl software package. Source: compiled by authors.
Jrfm 18 00141 g002
Table 1. Summary of all dependent, independent, and control variables, calculation methods, and abbreviations used in the study.
VariableCalculation MethodAbbreviation
Dependent Variables
Return on AssetsProfit before tax/Total assets × 100%ROA
Return on EquityProfit before tax/Shareholder funds × 100%ROE
Operating Profit MarginEBIT (Earnings Before Interest and Taxes)/Sales × 100%OPM
Independent Variables
Current RatioCurrent assets/Current liabilitiesCR
Debt to EquityTotal liabilities/Total equityDE
Total Asset TurnoverSales/Total assetsTAT
Control Variables
Company Size (1)Logarithm of total assets1_TA
Company Size (2)Logarithm of number of employees1_NE
LeverageTotal debt/Total assetsLEV
Dummy Variable for Joint-Stock Company0 for joint-stock company, 1 for non-joint-stock companyDJSC_1
Source: compiled by authors.
Table 2. Descriptive statistics (based on observations: 1:1—68:3 (Czech Republic); 1:1—405:3 (Poland); 1:1—141:3 (Slovak Republic); 1:1—171:3 (Ukraine)).
VariablesMeanMinimumMaximum
CZPLSKUKCZPLSKUKCZPLSKUK
ROA16.018.514.618.0−14.9−79.6−36.5−200.675.99389.3677.7547.60
ROE32.442.633.050.0−82.4−781.6−770.4−862.3116.57737.09171.7840.61
OPM8.28.08.36.3−25.8−94.8−53.3−100.063.3282.5390.891.22
CR3.62.92.53.60.20.00.00.225.0637.9738.490.95
DE1.44.16.64.90.0−37.90.00.022.09302.32563.3161.88
TAT2.32.82.33.00.00.00.00.08.7428.5820.025.59
1_TA7.57.67.26.63.84.34.31.710.4213.7710.512.97
1_NE2.572.872.013.330000.695.067.264.446.50
LEV58.148.542.443.14.30.40.20.699.7199.7297.899.88
DJSC_10.850.930.940.9900001111
Note: Calculated using the Gretl software package. Source: compiled by authors.
Table 3. Breusch–Pagan test results.
Czech RepublicPoland
ROAROEOPMROAROEOPM
p-value5.04085 × 10−251.26437 × 10−184.34511 × 10−273.93484 × 10−401.2328 × 10−161.78502 × 10−55
REM/FEM++++++
WLS
Slovak RepublicUkraine
ROAROEOPMROAROEOPM
p-value1.71764 × 10−375.24513 × 10−51.77955 × 10−282.02385 × 10−307.62612 × 10−191.86687 × 10⁻²⁴
REM/FEM++++++
WLS
Source: compiled by authors.
Table 4. Hausman test results.
Czech RepublicPoland
ROAROEOPMROAROEOPM
p-value0.1410.1850.0396.88317 × 10−100.00074.62999 × 10−14
REM++
FEM++++
Slovak RepublicUkraine
ROAROEOPMROAROEOPM
p-value0.00132.16466 × 10−111.34824 × 10−75.24264 × 10−83.64252 × 10−77.35781 × 10−10
REM
FEM++++++
Source: compiled by authors.
Table 5. Wooldridge test results.
Czech RepublicPoland
ROAROEOPMROAROEOPM
p-value0.2880.7280.1667.02787 × 10−54.12124 × 10−50.001
Slovak RepublicUkraine
ROAROEOPMROAROEOPM
p-value0.1534.92128 × 10−110.7890.1390.6670.274
Source: compiled by authors.
Table 6. Comparative analysis of the values of models’ information criteria.
REM/FEM *LAD
Akaike Information CriterionSchwarz Information CriterionHannan–Quinn Information CriterionAkaike Information CriterionSchwarz Information CriterionHannan–Quinn Information Criterion
M1CROA164316691653159716231608
M2CROE194619721956188119081892
M3COPM118214281282135813841368
M1PROA10,70912,80611,49810,19410,23510,209
M2PROE13,45315,55014,24212,39412,43512,410
M3POPM850710,6049296741274537427
M1SROA318337773418348835203500
M2SROE463852334873440544374418
M3SOPM304536403280314231753155
M1UROA497757285271474047744754
M2UROE610668576400584958835862
M3UOPM420349534497405840924071
Note: * According to the results of Table 4. Source: compiled by authors.
Table 7. Model 1–12 (ROA, ROE, OPM). LAD using the observations: 1–204 (Czech Republic); 1–1215 (Poland); 1–423 (Slovak Republic); 1–513 (Ukraine).
ConstCRDETAT1_TA1_NELEVDJSC_1
Model
M1CROA0.2120.6720.056 *0.0005 ***0.6850.1710.4070.880
M2CROE0.005 ***0.5820.026 **0.052 *0.3200.051 *0.0009 ***0.814
M3COPM0.091 *0.6800.7760.002 ***0.3190.065 *0.6580.729
M1PRO0.013 **0.007 ***1.17 × 10⁻⁶ ***1.49 × 10⁻¹¹ ***0.3590.9859.25 × 10−9 ***0.133
M2PROE0.093 *2.63 × 10−6 ***1.18 × 10⁻⁷ ***7.39 × 10⁻⁹ ***0.012 **0.1011.12 × 10−8 ***0.106
M3POPM5.17 × 10−8 ***8.27 × 10⁻¹¹ ***1.47 × 10−59 ***0.8480.9560.5050.002 ***0.366
M1SROA0.080 *0.8160.7480.010 ***0.3370.1037.67 × 10−6 ***0.004 ***
M2SROE0.3240.4640.9940.010 ***0.074 *0.023 **0.2160.003 ***
M3SOPM0.008 ***0.097 *0.8360.4630.0005 ***0.044 **0.061 *0.158
M1UROA0.073 *0.670.2290.0013 ***0.6930.093 *0.0003 ***0.0008 ***
M2UROE0.049 **0.4190.6190.019 **0.2820.1820.002 ***0.135
M3UOPM0.4350.5490.6840.002 ***0.014 **0.016 **0.009 ***0.289
Note: * Significant at the 10% level; ** Significant at the 5% level; *** Significant at the 1% level. Source: compiled by authors.
Table 8. Comparison of results of M1C, M1P, M1S, and M1U models for ROA.
CountryQuantityPeriodSectorCRDETAT1_TA1_NELEVDJSC_1
Czech Republic682021–2023Advertising and market researchInsign.Sign. *
Neg.
Sign. ***
Pos.
Insign.Insign.Insign.Insign.
Poland405Sign. ***
Pos.
Sign. ***
Pos.
Sign. ***
Pos.
Insign.Insign.Sign. ***
Pos.
Insign.
Slovak Republic141Insign.Insign.Sign. ***
Pos.
Insign.Insign.Sign. ***
Pos.
Sign. ***
Pos.
Ukraine171Insign.Insign.Sign. ***
Pos.
Insign.Sign. *
Neg.
Sign. ***
Pos.
Sign. ***
Pos.
Notes: Sign. *—significant at the 10% level; Sign. ***—significant at the 1% level; Insign.—insignificant; Pos.—positive; Neg.—negative. Source: compiled by authors.
Table 9. Comparison of the results of M2C, M2P, M2S, and M2U models for ROE.
CountryQuantityPeriodSectorCRDETAT1_TA1_NELEVDJSC_1
Czech Republic682021–2023Advertising and market researchInsign.Sign. **
Neg.
Sign. **
Pos.
Insign.Sign. **
Neg.
Sign. ***
Neg.
Insign.
Poland405Sign. ***
Pos.
Sign. ***
Pos.
Sign. ***
Pos.
Sign. **
Neg.
Insign.Sign. ***
Neg.
Insign.
Slovak Republic141Insign.Insign.Sign. ***
Pos.
Sign. *
Pos.
Sign. **
Neg.
Insign.Sign. ***
Pos.
Ukraine171Insign.Insign.Sign. **
Pos.
Insign.Insign.Sign. ***
Neg.
Insign.
Notes: Sign. *—significant at the 10 % level; Sign. **—significant at the 5% level; Sign. ***—significant at the 1% level; Insign.—insignificant; Pos.—positive; Neg.—negative. Source: compiled by authors.
Table 10. Comparison of the results of M3C, M3P, M3S, and M3U models for OPM.
CountryQuantityPeriodSectorCRDETAT1_TA1_NELEVDJSC_1
Czech Republic682021–2023Advertising and market researchInsign.Insign.Sign. ***
Neg.
Insign.Sign. *
Neg.
Insign.Insign.
Poland405Sign. ***
Pos.
Sign. ***
Pos.
Insign.Insign.Insign.Sign. ***
Pos.
Insign.
Slovak Republic141Sign. *
Pos.
Insign.Insign.Sign. ***
Pos.
Sign. **
Neg.
Sign. *
Pos.
Insign.
Ukraine171Insign.Insign.Sign. ***
Neg.
Sign. **
Pos.
Sign. **
Neg.
Sign. ***
Pos.
Insign.
Notes: Sign. *—significant at the 10% level; Sign. **—significant at the 5% level; Sign. ***—significant at the 1% level; Insign.—insignificant; Pos.—positive; Neg.—negative. Source: compiled by authors.
Disclaimer/Publisher’s Note: The statements, opinions and data contained in all publications are solely those of the individual author(s) and contributor(s) and not of MDPI and/or the editor(s). MDPI and/or the editor(s) disclaim responsibility for any injury to people or property resulting from any ideas, methods, instructions or products referred to in the content.

