1. Introduction
The cryptocurrency market has evolved significantly since the introduction of Bitcoin (BTC), the first and largest digital currency by market capitalization, which is commonly perceived as the dominant influence on the volatility of other cryptocurrencies. Given the increasing significance of digital asset class, researchers have investigated the Bitcoin’s relationships and interconnectedness with various markets, including equities (
Corbet et al., 2018), bonds (
Huynh et al., 2020;
Karim et al., 2022a,
2022b), commodities (
Ji et al., 2019;
Rehman & Apergis, 2019;
Naeem et al., 2022a,
2022d), investor sentiment (
Naeem et al., 2021c), and foreign exchange markets (
Baumöhl, 2019). However, as the cryptocurrency ecosystem has diversified, new digital assets such as Ethereum (ETH) have emerged with unique functionalities and use cases, contributing to the dynamic interdependencies observed within the market. In particular, the programmability of Ethereum’s blockchain has facilitated innovations such as automated market makers (AMMs), decentralized autonomous organizations (DAOs), and stablecoins, distinguishing it from other digital assets. Unlike Bitcoin, which plays an important role as a decentralized store of value, Ethereum underpins a vast ecosystem of decentralized applications (dApps), decentralized finance (DeFi) protocols, and smart contracts, creating distinctive volatility patterns that may influence the broader crypto market.
In this context, while most of the existing studies have predominantly highlighted Bitcoin as the primary transmitter of volatility within the cryptocurrency market (e.g.,
Ji et al., 2019;
Baur et al., 2018;
Corbet et al., 2019;
Naeem et al., 2022e;
Javed & Khan, 2024), some recent works (
Naeem et al., 2022b;
Antonakakis et al., 2019;
Akyildirim et al., 2021;
Mensi et al., 2020;
Chen et al., 2025) have started to acknowledge the growing influence of altcoins, without specifying the Ethereum’s pivotal role in DeFi and other blockchain applications. In such studies, this is clear from the fact that the Ethereum’s growing influence in crypto market is generally ignored.
1 To be more precise, the related literature largely views cryptocurrencies as speculative assets, emphasizing their volatility and correlations with traditional markets. However, Ethereum’s growing adoption in DeFi applications has introduced new economic dynamics, where its price movements are increasingly driven by on-chain activities, network congestion, and gas fees rather than macroeconomic factors alone.
The existing crypto-related studies generally investigate how the cryptocurrency market interacts and connects with different financial markets. However, not many studies in a high-frequency volatility setting specifically investigate interconnections within the cryptocurrency market, such as cryptocurrency volatility spillovers (
Koutmos, 2018;
Beneki et al., 2019;
Mensi et al., 2020;
Balli et al., 2020;
Hasan et al., 2021;
Ben Ameur et al., 2024). This study empirically investigates the realized volatility spillover effects among four major cryptocurrencies—BTC, ETH, Litecoin (LTC), and Ripple (XRP)—from 2018 to early 2023. These four cryptocurrencies are selected based on their significant market capitalization and the availability of high-frequency data over a longer time horizon. Together, they account for over 70% of the total market capitalization in the cryptocurrency ecosystem. Using the Time-Varying Parameter Vector Autoregression (TVP-VAR) model of the realized volatility (RV) to measure realized volatility spillovers, a Total Connectedness Index (TCI) is constructed to capture the overall degree of interdependence across these digital assets. Additionally, pairwise connectedness indices (PCI) are utilized to examine bilateral spillovers and directional connectedness for each cryptocurrency. By doing so, this work aims to provide a comprehensive evaluation of each digital asset’s impact on others.
The findings of this study make three key contributions to this evolving literature by providing some interesting empirical evidence. First, they provide a comprehensive analysis of the realized volatility connectedness among major cryptocurrencies, offering insights into the dynamic high frequency nature of these relationships over an extended period. Second, contrary to traditional expectations, the study highlights Ethereum’s role as a primary volatility transmitter, challenging the traditional view that Bitcoin dominates the cryptocurrency market’s volatility structure. This study builds upon prior findings by showing that Ethereum could surpass Bitcoin as a primary transmitter of realized volatility, emphasizing its critical role in DeFi. Unlike earlier research that often treated Ethereum as a secondary player, this study highlights how Ethereum influence crypto-market-wide volatility spillovers. As the DeFi space continues to expand, Ethereum’s role is expected to become even more explicit, further consolidating its standing as a major volatility transmitter. Lastly, this research employs a rolling-window TVP-VAR-RV model derived from high frequency data, enabling the detection of time-varying realized volatility patterns that reflect market conditions more precisely, allowing us to identify periods of heightened interdependence driven by external shocks.
The structure of this study is as follows:
Section 2 describes the data and methodology.
Section 3 and
Section 4 present the empirical results and their discussion, respectively. Lastly,
Section 5 concludes the study.
2. Data and Methodology
2.1. Data Description
This study employs high-frequency cryptocurrency data (Bitcoin, Ethereum, Litecoin, and Ripple) obtained from the “CryptoDataDownload” website, covering nearly five years from 15 May 2018 to 24 January 2023. The dataset comprises approximately 493,968 intraday observations at 5 min intervals.
Hol and Koopman (
2002) recommend using intervals between 5 and 30 min for accurately measuring realized volatility, a preference supported by
Liu et al. (
2015), who evaluated over 400 realized measures. Their findings highlight the robust performance of the 5 min realized variance, leading to its widespread acceptance as a standard for measuring target volatility. To manage the extensive dataset, the squared intraday returns at 5 min intervals are aggregated into daily realized variance values, resulting in 1716 daily observations.
![Jrfm 18 00111 i001]()
Table 1 provides summary statistics for the realized volatility of BTC, ETH, LTC, and XRP, highlighting distinct patterns. BTC demonstrates the lowest average (2.818) and median (1.377), suggesting relatively lower overall volatility. In contrast, XRP exhibits the highest average (6.597) and maximum value (286.50), indicating significantly higher realized volatility. This volatility is further reflected in the standard deviations, where XRP has the highest and BTC the lowest, emphasizing XRP’s status as the most volatile cryptocurrency among the four.
The 5% and 95% percentiles offer insights into the lower and upper extremes of realized volatility distributions. BTC has the smallest 5% percentile (0.147) and 95% percentile (9.297), pointing to lower extreme volatility relative to the other cryptocurrencies. Conversely, XRP has the largest 95% percentile (23.771), followed by LTC and ETH, indicating higher levels of extreme volatility at the upper end. These findings underscore the broad range of volatility in cryptocurrency markets, with XRP and LTC showing the highest tail risk.
2.2. Methodology
2.2.1. Realized Volatility
Volatility cannot be directly observed, necessitating the use of a proxy to approximate true volatility. For this reason, daily squared returns are commonly employed for this purpose. However,
Andersen and Bollerslev (
1998) highlight the limitations of this approach, demonstrating that daily squared returns are a suboptimal proxy compared to the cumulative squared intraday returns. Therefore, they introduce the concept of realized volatility,
RV, defined as follows:
where
refers to the log asset squared return on day
t.
intraday interval and where
, with
T the total number of trading days,
N the number of intraday intervals and
is the log asset price.
2.2.2. TVP-VAR-RV Model
This study employs the Time-Varying Parameter Vector Autoregressive (TVP-VAR) model of the realized volatility (RV) to analyze the dynamic connectedness among major cryptocurrencies over time. Unlike traditional VAR models, the TVP-VAR model allows for time-varying relationships, making it better suited for capturing evolving market dynamics. Therefore, the TVP-VAR-RV model is particularly well-suited for examining time-varying relationships in financial and economic systems, as it accounts for non-linearities and changes in the structure of relationships across variables. Based on the Bayesian Information Criterion (BIC), a first-order TVP-VAR model is specified as follows:
where
and
are
vectors representing observations at time
and
, and
denotes the error term. The matrices
and
represent time-varying coefficients and variance-covariance structures, respectively, while
is the dimensional matrix for the coefficients.
The generalized forecast error variance decomposition (GFEVD), developed by
Pesaran and Shin (
1998), is utilized to measure the impact of shocks from one variable on the forecast error variance of another. Unlike orthogonalized variance decomposition methods, GFEVD produces results that are independent of the variable ordering, making it especially effective for studying interconnected systems (
Diebold & Yilmaz, 2012). By employing the Wold representation theorem, the TVP-VAR model is reformulated into a time-varying moving average (TVP-VMA) process:
Afterwards, the GFEVD is computed as the following:
where
captures the contribution of shocks in variable
to the forecast error variance of variable
over a forecast horizon
. To ensure comparability across variables, the values are normalized so that each row sums to unity:
From the normalized GFEVD, directional connectedness metrics are derived, including net pairwise connectedness (NPDC):
where
indicates that variable
influences
more than the reverse. Total directional connectedness measures the cumulative influence transmitted to or received from other variables:
The net total directional connectedness is expressed as the following:
with
indicating that variable
i is a net transmitter of shocks.
The TCI illustrates the average impact that a shock in one index has on all the others. Therefore, higher TCI values indicate greater network interconnectedness and systemic risk. The derivation of the Total Connectedness Index (TCI) is based on generalized forecast error variance decomposition (GFEVD), which enables the measurement of directional and total volatility spillovers.
3. Empirical Results
Figure 1 presents the Total Connectedness Index (TCI) for BTC, ETH, LTC, and XRP from 2019 through early 2023, illustrating the degree of interdependence in the realized volatilities of these cryptocurrencies over time. The TCI fluctuates between 60 and 80, with pronounced peaks observed in early 2020, mid-2021, and mid-2022. These peaks represent periods of heightened connectedness among the cryptocurrencies, likely triggered by global market events or shared volatility shocks affecting all assets simultaneously. Overall, the trend suggests that the level of cross-crypto connectedness varies over time but generally remains high, indicating a substantial and ongoing volatility spillover effect among the major cryptocurrencies during the period 2018–2023.
Table 2 displays the realized volatility connectedness among major cryptocurrencies, including BTC, ETH, LTC, and XRP, as estimated by the Time-Varying Parameter Vector Autoregression (TVP-VAR-RV) model of the realized volatility between 2018 and 2023. This table details the realized volatility connectedness among BTC, ETH, LTC, and XRP, as estimated using a 200-day rolling-window TVP-VAR model with a 10-step-ahead forecast horizon. Diagonal values represent the proportion of each coin’s volatility attributed to its own past innovations, while off-diagonal values indicate the extent of realized volatility spillovers between cryptocurrencies. A high “FROM” value for a cryptocurrency suggests that its realized volatility is significantly influenced by other coins, whereas a high “TO” value indicates that the coin has a substantial impact on the volatility of others. The difference between the “TO” and “FROM” values represents “NET” spillovers: negative values denote a net receiver of realized volatility, while positive values indicate a net transmitter.
In
Table 2, the Total Connectedness Index (cTCI), which includes own volatility, is 73.91%, reflecting substantial interconnectedness among major cryptocurrencies. Excluding own volatility, the TCI drops slightly to 55.43%, indicating that while own influence strengthens connectedness, there is still significant volatility transmission between different cryptocurrencies.
The diagonal values represent each coin’s own past innovation, with BTC, ETH, LTC, and XRP accounting for their self-past-innovation percentages of 40.58%, 38.73%, 39.25%, and 59.71%, respectively. The “TO” and “FROM” columns illustrate the directional influence of each coin’s realized volatility. ETH exhibits the highest “TO” value at 68.59%, indicating its strong influence on other coins. Conversely, XRP has the lowest “TO” value at 32.05%, showing relatively lower influence on the coin market. Litecoin (LTC) plays a moderate role in the realized volatility transmission network. Its “TO” value (60.94%) suggests that it actively transmits realized volatility to other cryptocurrencies at a level similar to BTC but lower than ETH. When examining the “FROM” values, XRP also has the lowest at 40.29%, indicating a lesser degree of influence received from other cryptocurrencies compared to BTC, ETH, and LTC, which have “FROM” values of 59.42%, 61.27%, and 60.75%, respectively.
The NET values reveal the net transmission roles of each cryptocurrency. ETH shows the highest net transmission (7.32), identifying it as a net volatility transmitter, whereas XRP displays a negative net transmission (−8.24), suggesting it primarily absorbs volatility from other assets much more than it transmits. The Net Pairwise Transmission (NPT) values indicate the directional intensity of spillovers, with ETH showing the highest intensity at 3, followed by BTC, LTC, and XRP with values of 2, 1, and 0, respectively. This ranking underscores ETH’s central role in volatility transmission within this group of cryptocurrencies.
Figure 2 and
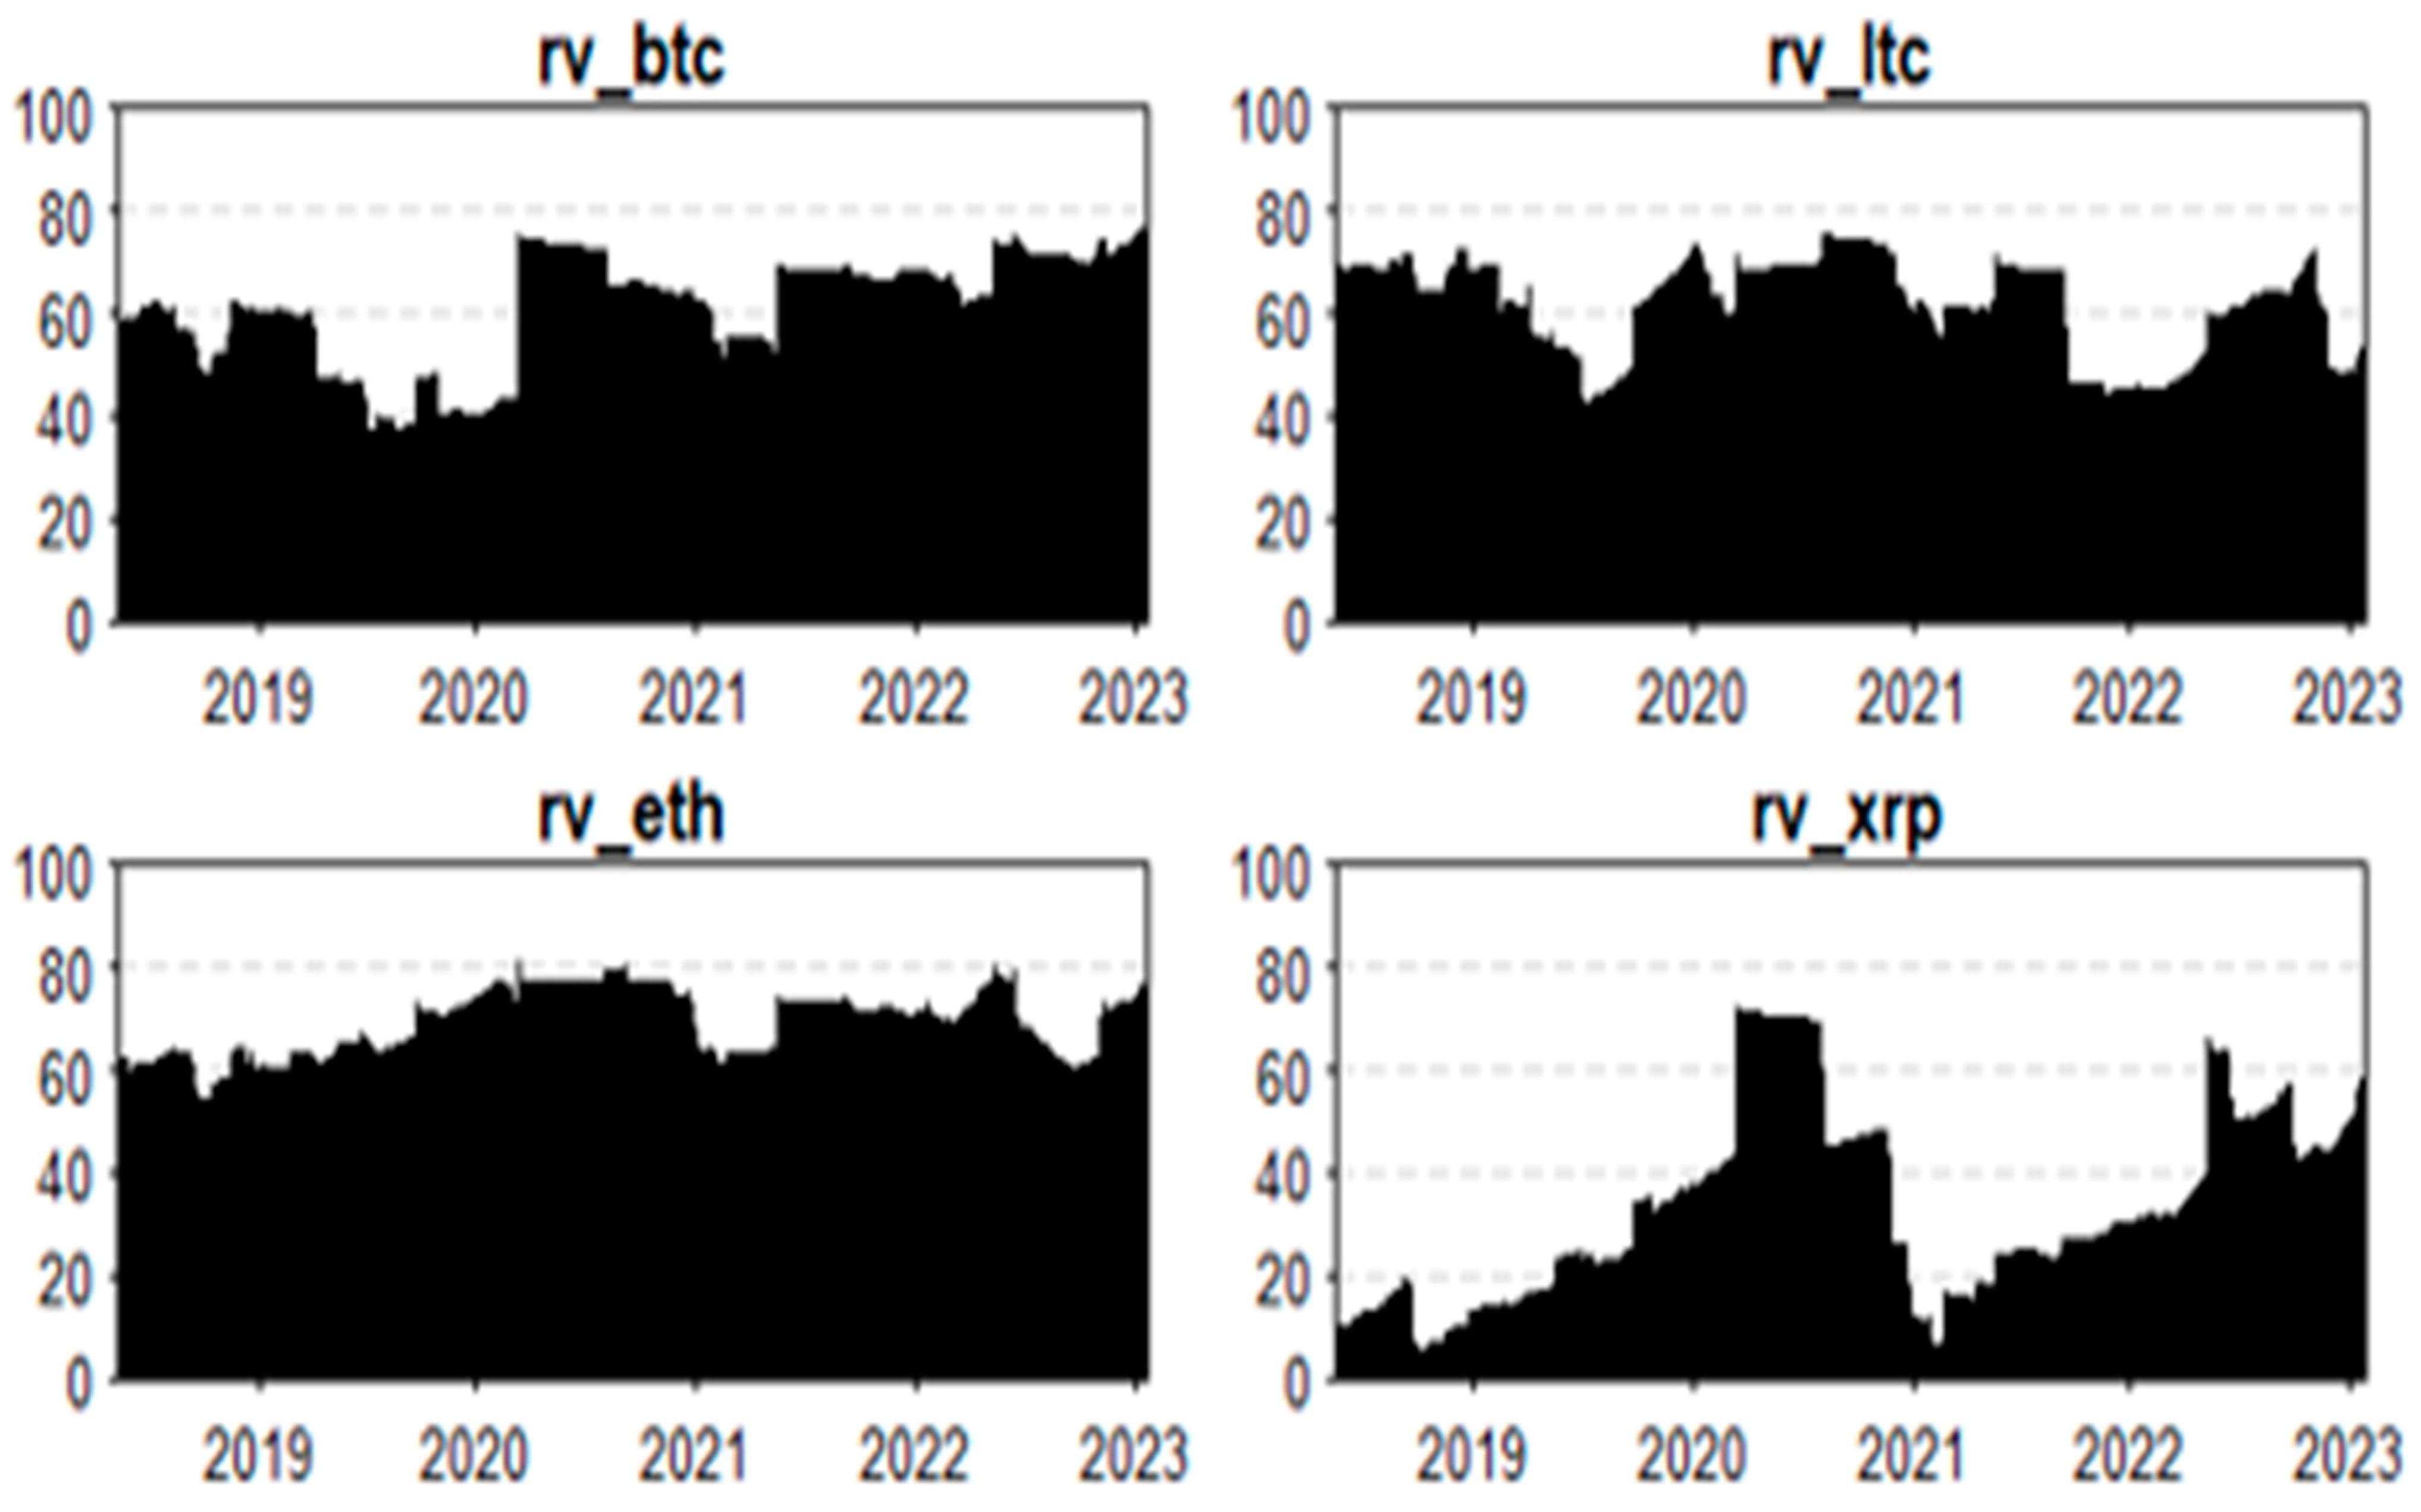
Figure 3 illustrate the time-varying movements of the “TO” and “FROM” values for each individual coin, covering the period from 2018 to early 2023. In
Figure 2, which shows the graph of “TO” values (indicating each coin’s impact on others), BTC, ETH, and LTC display relatively high and stable levels of interconnectedness, with slight fluctuations over the 50 per cent level. Notable peaks appear periodically, reflecting instances when these coins exerted higher influence on others, possibly due to market-wide events or volatility spikes. XRP, on the other hand, shows greater variability, indicating it occasionally contributes substantially to volatility spillover effects, though not consistently over time.
In
Figure 3, the “FROM” values (indicating each coin’s susceptibility to external influences) reveal that BTC, ETH, and LTC are generally exposed to a high degree of external impact (over the 50 per cent level), with slight increases observed during market volatility periods. However, XRP’s “FROM” graph does fluctuate more dramatically, suggesting that its volatility is more reactive to external market changes, especially in 2020 and late 2022. Overall, these graphs highlight the dynamic spillover relationships among the selected cryptocurrencies, with XRP being notably more unstable in both its influence on and sensitivity to other coins, reflecting its unique position in the interconnected crypto market.
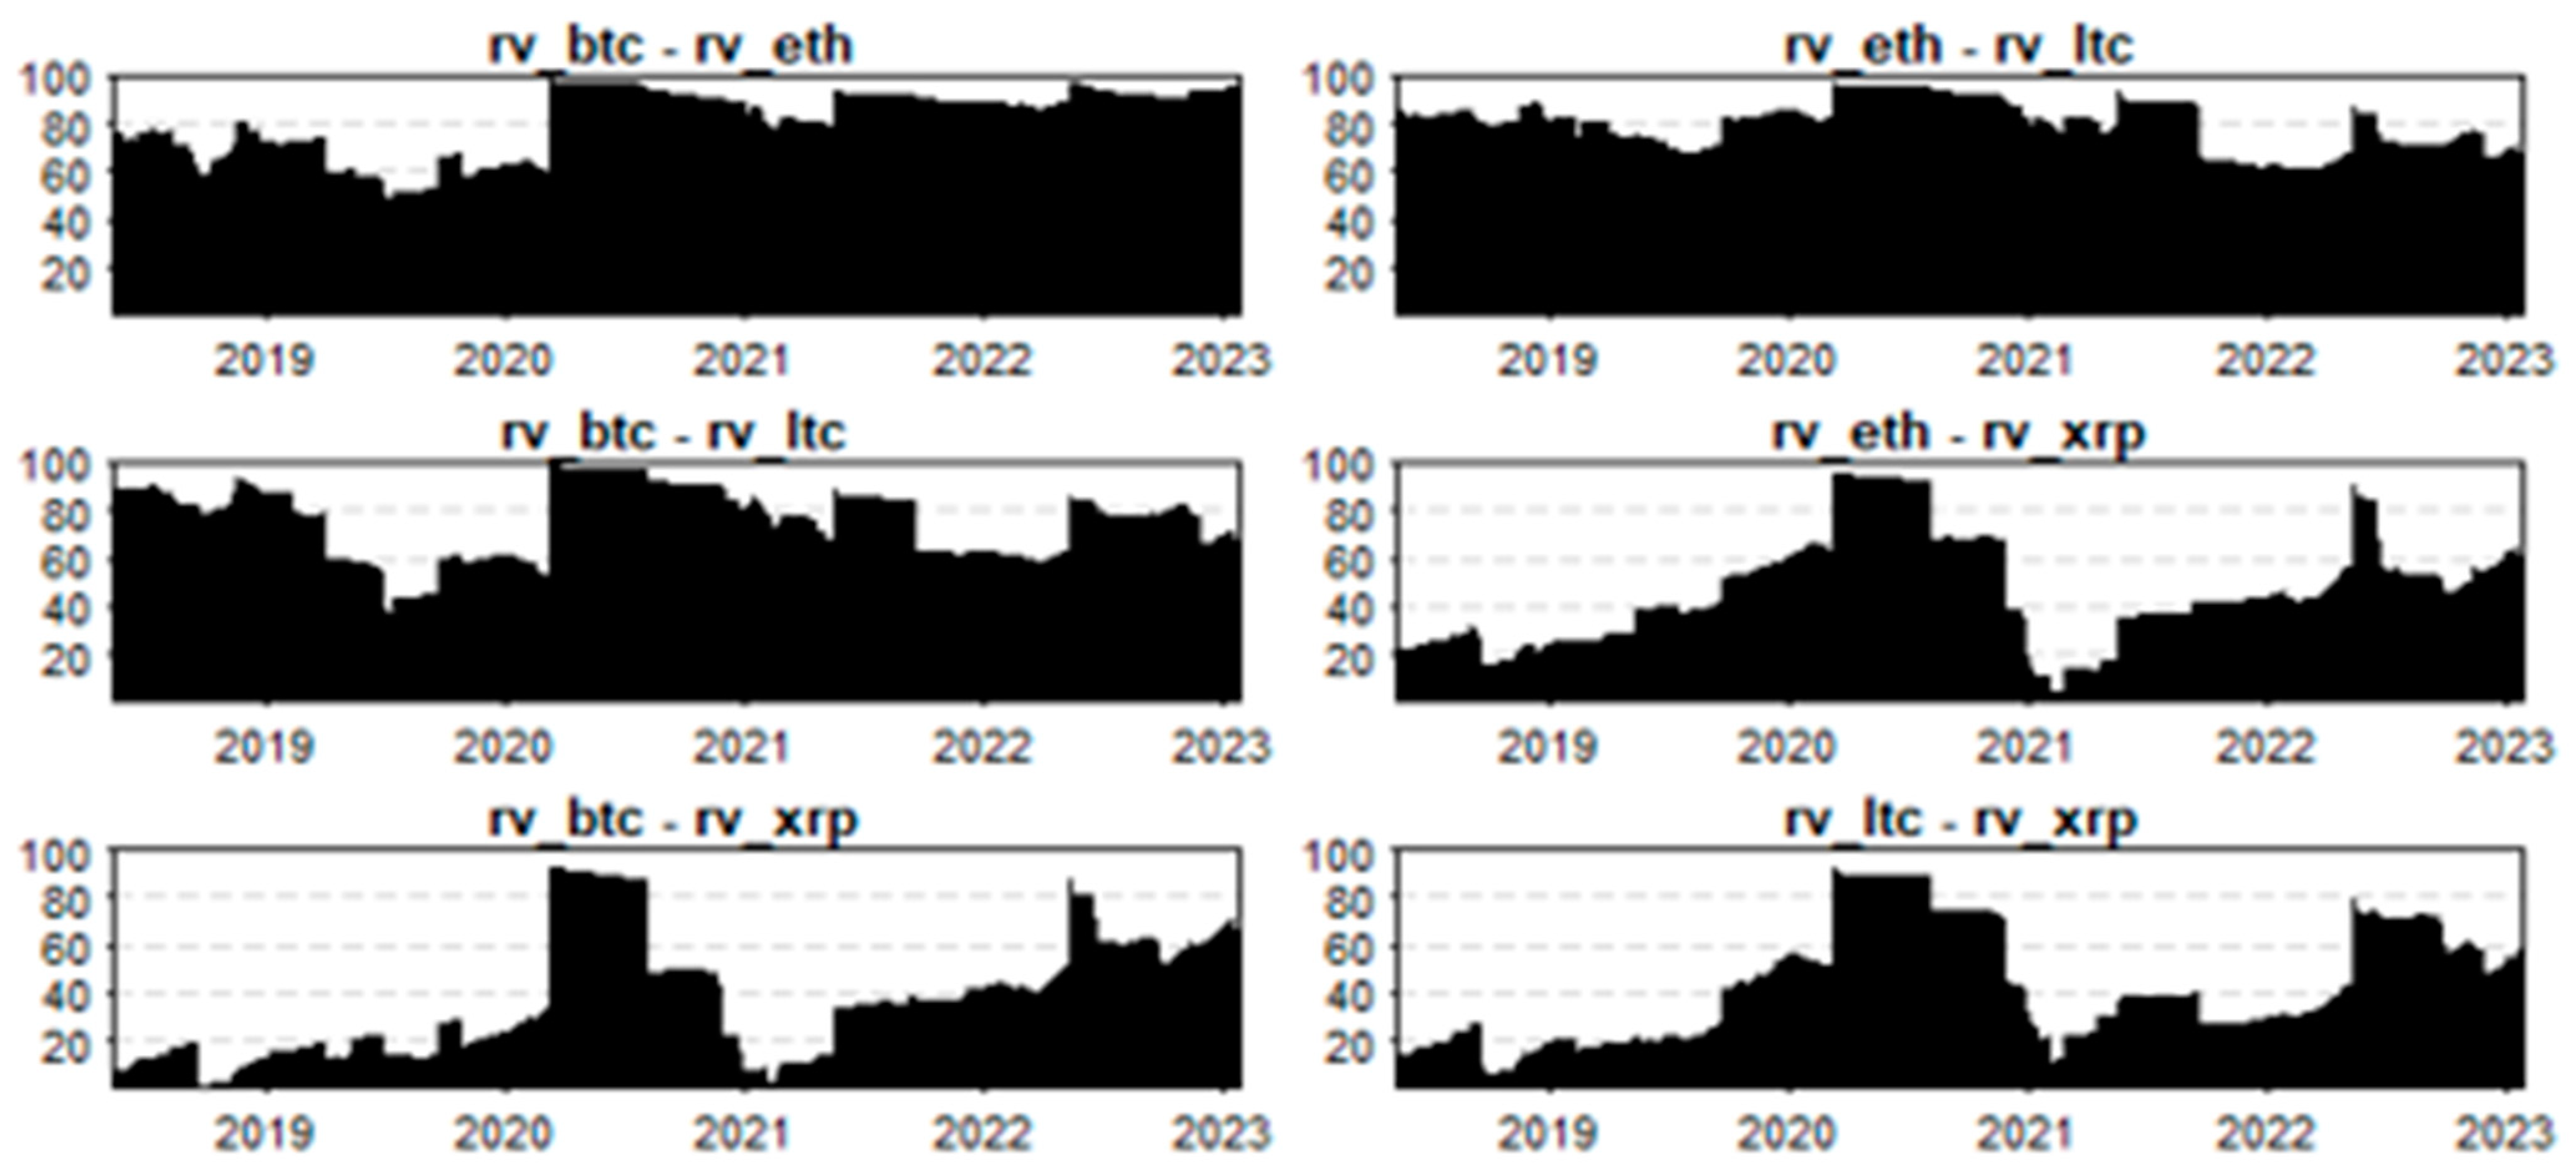
In
Figure 4, the Pairwise Connectedness Index graphs illustrate the bilateral volatility spillover relationships between BTC, ETH, LTC, and XRP over the time period. The values of the PCI range between 0 and 100. The BTC-ETH, ETH-LTC, and BTC-LTC pairs consistently display a relatively high level of connectedness, indicating a strong and steady interdependence between these leading cryptocurrencies. For the rest of the pairs (matching with XRP), while the PCI fluctuates, there are distinct periods where one cryptocurrency’s volatility spillover predominates. For instance, the BTC-XRP, ETH-XRP, and LTC-XRP pairs show significant variation, especially during turbulent market times. This pattern suggests that BTC, ETH, and LTC often lead in volatility transmission to XRP. Notably, during the COVID-19 market shock in early 2020, the pairwise panels in
Figure 4 experience a sharp increase, indicating intensified volatility spillovers to XRP. This pattern suggests that BTC, ETH, and LTC often lead in volatility transmission to XRP during the COVID-19 period. However, XRP in general is the least connected coin with others.
4. Discussion
The cryptocurrency market has undergone profound transformation, transitioning from a Bitcoin-dominated space to a diverse ecosystem where assets like Ethereum play pivotal roles. This study’s findings emphasize the evolving nature of volatility spillovers among cryptocurrencies, particularly highlighting Ethereum’s emergence as a central volatility transmitter. This shift challenges the traditional perspective that Bitcoin serves as the sole driver of market-wide volatility. Ethereum’s prominence in decentralized finance (DeFi) and decentralized applications (dApps) underpins this transformation. Its role in facilitating smart contracts, DeFi protocols, and tokenized applications creates unique exposure to sector-specific shocks, such as regulatory changes or fluctuations in DeFi market activity, amplifying its influence on the broader cryptocurrency market.
The substantial interconnectedness observed across the four cryptocurrencies—BTC, ETH, LTC, and XRP—further underscores the tightly knit nature of the crypto ecosystem. The high Total Connectedness Index (TCI), consistently surpassing 70%, reflects persistent volatility transmission, even during less turbulent periods. Peaks in connectedness coincide with significant market disruptions, suggesting that shared volatility shocks, whether global economic events or crypto-specific news, amplify interdependence among these assets.
Notably, Ethereum’s dominance as a net volatility transmitter aligns with its expanding ecosystem, which attracts heightened trading activity and investment. In contrast, Ripple (XRP) acts as a net receiver, indicating that its volatility is primarily driven by structural market factors, including regulatory developments and liquidity conditions. Unlike BTC, ETH, and LTC, which benefit from broader adoption and relatively stable market positioning, XRP has faced regulatory scrutiny (most notably the SEC lawsuit against Ripple in 2020) which may have contributed to its shifting role in the volatility network. During periods of regulatory uncertainty, XRP may experience external shocks more acutely, reinforcing its function as a volatility absorber rather than a transmitter. The bilateral relationships between BTC, ETH, and LTC further demonstrate that these assets move cohesively, reinforcing their centrality in the cryptocurrency market.
5. Conclusions
This study contributes to the growing body of literature on cryptocurrency markets by providing a nuanced understanding of realized volatility spillovers among BTC, ETH, LTC, and XRP. Using a Time-Varying Parameter Vector Autoregression (TVP-VAR-RV) model of the realized volatility, the research reveals significant interdependencies and dynamic volatility transmission patterns over time.
The findings underscore Ethereum’s pivotal role as a primary volatility transmitter, challenging the traditional dominance of Bitcoin in this regard. Ethereum’s centrality is driven by its unique functionalities within DeFi and dApps, which expose it to sector-specific shocks and amplify its influence on the market. These results suggest that Ethereum’s growing ecosystem not only diversifies market dynamics but also increases systemic interconnectedness.
The study also highlights the importance of monitoring volatility spillovers during periods of market disruption, as evidenced by the peaks in the Total Connectedness Index during global and crypto-specific crises. The consistent yet fluctuating interdependence among BTC, ETH, and LTC demonstrates the synchronized movement of major cryptocurrencies, while XRP’s unique position as a net volatility receiver emphasizes its greater exposure to external shocks, especially throughout the COVID-10 period.
For investors and risk managers, understanding these transmission dynamics can help in making more informed trading and risk management decisions in the evolving crypto ecosystem. Notably, the time-varying and asymmetric nature of the abovementioned findings highlights the need for diversification strategies.
Future research could expand on this analysis by incorporating DeFi-specific tokens to better understand their role in the cryptocurrency volatility network. As decentralized finance (DeFi) continues to grow, some DeFi-specific tokens such as UNI, AAVE, and LINK may exhibit unique spillover dynamics compared to traditional coins such as BTC and ETH.


