Systematic Review

Systematic Review of Financial Distress Prediction Models for Municipalities: Key Evaluation Criteria and a Framework for Model Selection

by
Nkosinathi Emmanuel Radebe
*,
Bomi Cyril Nomlala
and
Frank Ranganai Matenda
School of Accounting, Economics and Finance, College of Law and Management Studies, University of KwaZulu-Natal, Durban 4041, South Africa
*
Author to whom correspondence should be addressed.
J. Risk Financial Manag. 2025, 18(11), 624; https://doi.org/10.3390/jrfm18110624
Submission received: 21 July 2025 / Revised: 15 September 2025 / Accepted: 18 September 2025 / Published: 7 November 2025
(This article belongs to the Special Issue Public Budgeting and Finance)

Abstract

Municipalities are facing mounting fiscal pressures that contribute to financial distress, often resulting in reduced service delivery and economic instability. Despite extensive research on this topic, there is neither a framework nor established criteria to guide policymakers and practitioners in selecting appropriate models for financial distress prediction (FDP). This study employs a systematic review approach to identify key criteria for evaluating FDP models and proposes a framework to guide the selection of suitable models. Following PRISMA guidelines, 24 peer-reviewed papers published between 2000 and 2025 were identified through Google Scholar, Web of Science, ScienceDirect, Scopus, EBSCOhost, and ProQuest. The analysis revealed ten key criteria for evaluating FDP models in local government, which were organised into four overarching dimensions: performance, conceptual integrity, practical applicability, and contextual fit. Based on these insights, the study proposes a structured framework that assists practitioners in selecting the most appropriate FDP model. The framework enhances conceptual clarity, synthesises fragmented knowledge, and establishes a foundation for policy-relevant early warning systems to strengthen municipal financial management.

1. Introduction

Municipalities worldwide deliver essential public services, including water supply, electricity, sanitation, healthcare and education, which underpin citizens’ well-being and quality of life (Tran & Dollery, 2021; Ritonga & Buanaputra, 2022). Yet many local governments experience financial distress, with consequences that include reduced service quality, heightened health risks and local economic instability (Shiddiqy & Prihatiningtias, 2022; Reilly et al., 2023). The lingering effects of the 2008 financial crisis intensified fiscal pressures by lowering revenues while increasing demand for public services (McDonald & Maher, 2020; Padovani et al., 2021). Early identification of financial distress is therefore important for sustaining services and maintaining fiscal stability (Park et al., 2023; Ríos et al., 2024).
Research on the early identification of municipal financial distress intensified following the fiscal crises of the 1970s, notably in New York City and Cleveland (Trussel & Patrick, 2018; Reilly et al., 2023). Early ratio-based tools (e.g., Brown’s Ten-Point Test (Brown, 1993)) and composite-indicator financial distress prediction (FDP) models (e.g., Kloha et al., 2005) provided useful diagnostics but have been criticised for limited theoretical grounding and for downplaying socio-economic and macro-economic drivers (McDonald & Maher, 2020; Gorina et al., 2018a).
Subsequent work linked financial indicators with demographic and economic data (Cohen et al., 2012). Recent studies employ machine learning to improve predictive performance (Alaminos et al., 2018; Antulov-Fantulin et al., 2021), but implementation is hindered by model complexity, data limitations and regulatory variation (Leiser & Mills, 2019; Reilly et al., 2023).
Public-sector reforms imported corporate techniques into local government, such as accrual accounting and performance budgeting (Robbins et al., 2016). However, municipalities differ from corporate firms in mandate and revenue structure, including non-discretionary service obligations and reliance on intergovernmental transfers (Kooij & Groot, 2021), and legal regimes for fiscal failure vary across countries (McDonald & Maher, 2020). Consequently, corporate ratios (for instance, profitability, leverage and liquidity) do not fully capture municipal fiscal sustainability, where service-level solvency and transfer dependence are fundamental (Kooij & Groot, 2021). In practice, municipal failure often emerges as escalating fiscal stress, service-level cutbacks or higher-level interventions rather than liquidation (McDonald & Maher, 2020; Gorina et al., 2018a).
Three persistent barriers emerge in the literature. First, definitions and thresholds of municipal financial distress lack consensus, producing heterogeneous outcome measures (Gorina et al., 2018a; Shiddiqy & Prihatiningtias, 2022). Second, data availability and quality vary across jurisdictions, which complicates variable selection and hinders cross-study comparability (Antulov-Fantulin et al., 2021; Kooij & Groot, 2021). Third, there is no agreed framework for selecting among FDP models, resulting in inconsistent criteria and methods (Malinowska-Misiąg, 2018; Leiser & Mills, 2019). These gaps motivate a standardised, theoretically grounded selection framework for municipalities.
Selecting inappropriate models can misstate fiscal conditions (Skica et al., 2020) and delay corrective action (Rahayu et al., 2023), thereby increasing long-term risk (Zhuang & Wei, 2023). Therefore, meticulous model selection represents an important governance decision with direct implications for service continuity.
While corporate FDP has been extensively reviewed (Alaka et al., 2018; Matenda et al., 2021; Dasilas & Rigani, 2024), systematic evidence syntheses focused on municipalities remain limited. We identify three related literature reviews: Iacuzzi (2022) surveys indicators used by local governments; Kooij and Groot (2021) provides a non-systematic narrative framework for local government fiscal health measurement; and Darmawati et al. (2024) presents a bibliometric analysis of local government finance research trends. None of these studies offers a systematic evaluation of municipal FDP models. This gap motivates a systematic review of municipal FDP models and the development of criteria to guide model selection.
We address this gap by reviewing municipal FDP models and synthesising the evidence into actionable guidance for model selection. The objectives are to (i) identify the key criteria for assessing the effectiveness and applicability of municipal FDP models; (ii) evaluate existing tools through a systematic review; and (iii) develop a framework to support the selection of appropriate municipal FDP models. The review addresses the question: What are the key criteria for evaluating municipal FDP models, and how can these criteria inform a framework for selecting the most appropriate model?
We conducted a systematic review following PRISMA guidance across major academic databases; full details of search, screening and extraction are provided in Section 3.
The study is informed by three complementary theoretical lenses that guided the development of evaluation criteria and the proposed framework for selection of FDP models for local governments: Utilisation-Focused Evaluation (Patton, 2008), Design Science Research (Hevner et al., 2004), and Institutional Theory (DiMaggio & Powell, 1983).
The paper is organised as follows. Section 2 reviews the literature. Section 3 describes the methodology. Section 4 presents the results. Section 5 discusses the results, proposes the framework for the selection of FDP models and presents the conclusion.

2. Literature Review

2.1. Understanding Financial Distress in Municipalities

A municipality is financially distressed when it cannot meet obligations from recurrent resources without external assistance (Trussel & Patrick, 2009; Zafra-Gómez et al., 2009). Definitions of municipal ‘distress’ vary across jurisdictions with bailout regimes, reporting requirements and service mandates, so a clear working definition is essential for comparability (Iacuzzi, 2022; Leiser & Mills, 2019). We deliberately separate ‘financial distress’ from ‘crisis’ and legal ‘insolvency’: the former is a probabilistic, pre-failure condition relevant for early warning, whereas the latter are end-states or legal determinations (Wang et al., 2007; Trussel & Patrick, 2009).
Municipal financial distress entails broader social and governance consequences through disrupted services, deferred maintenance and declines in public trust (Trussel & Patrick, 2013). Furthermore, municipalities operate under statutory borrowing limits, externally approved borrowing, and legal obligations to continue service delivery even during fiscal stress (Reilly et al., 2023; Gorina et al., 2018a). These institutional features, together with restrictions on autonomous revenue-raising and expenditure cuts, should shape how distress is defined and modelled for the public sector (Gorina et al., 2018a; Reilly et al., 2023). These features call for predictive frameworks that are distinct from corporate predictive models.

2.2. Financial Distress Prediction and Measurement of Financial Condition

Financial distress prediction provides early warning of impending fiscal stress to support timely interventions such as debt restructuring, budget adjustments or conditional support (Zafra-Gómez et al., 2009; Cohen et al., 2017). It integrates fiscal indicators with socio-economic and governance context (Gorina et al., 2018b; Maher et al., 2020) and applies methods from regression to machine learning to analyse historical and current data for early warning (Trussel & Patrick, 2009; Antulov-Fantulin et al., 2021). By contrast, financial condition measurement assesses current or past fiscal health using constructs such as cash, budgetary, long-term and service-level solvency and ratio-based diagnostics (Wang et al., 2007). These assessments are largely descriptive with limited early-warning value (McDonald & Maher, 2020). Predictive models, including machine learning, can improve accuracy; combining ratios with predictive analytics clarifies current health and future risk (Alaka et al., 2018). The two approaches are complementary, yet conceptually distinct, and recent municipal applications show that forward-looking models capture rare distress events more effectively when institutional and socio-demographic features are combined with financial indicators (Antulov-Fantulin et al., 2021).

2.3. Existing FDP Models for Financial Distress Prediction

Early municipal FDP models employed ratio-based scorecards and composite indices to identify deteriorating financial conditions including the Financial Trend Monitoring System (Groves et al., 1981), Brown’s 10-Point Test (Brown, 1993) and the Michigan composite scale (Kloha et al., 2005), with later alert systems such as Zafra-Gómez et al. (2009). The strength of these models was their accessibility and ease of interpretation by the local government officials. However, the limitations inherent in these models cannot be overlooked. A significant weakness is their inability to capture complex dynamics, such as non-linear relationships and interactions among various financial indicators effectively. According to Liu et al. (2022) linear models often assume that relationships between variables are uniform, which can oversimplify the realities faced by local governments. Furthermore, the earlier models are prone to drift when fiscal rules or reporting change, which can render them less effective (Cohen et al., 2017).
The next wave introduced multivariate regression and survival FDP models to estimate the probability and timing of distress while incorporating economic and institutional drivers (Trussel & Patrick, 2009; Cohen et al., 2017). One of the primary strengths of these models is their transparency, which facilitates communication among stakeholders, including policymakers and the public (Rudin, 2019). For instance, Trussel and Patrick (2009) developed an FDP model that was able to highlight significant factors influencing fiscal conditions, such as revenue concentration and administrative costs, thereby allowing for effective resource allocation and management decisions. However, despite their interpretability and the valuable insights they offer, these models heavily rely on stable definitions of fiscal indicators and performance metrics (Wang et al., 2007; McDonald & Maher, 2020). Additionally, this dependency can complicate the models’ ability to detect rare events, such as sudden economic downturns or unique crises, that are not adequately represented within historical datasets (Cohen et al., 2017; Jones & Walker, 2007). Furthermore, Trussel and Patrick (2013) argue that weak data coverage or biased indicator choice can distort estimates of fiscal distress. Complementary work by Cohen et al. (2017) and Gorina et al. (2018a) underscores the need for periodic re-specification as fiscal and reporting environments change.
More recently, machine-learning (ML) studies report strong out-of-sample detection in municipal settings and show that socio-demographic and institutional variables can rank alongside core financial ratios among top predictors (Antulov-Fantulin et al., 2021). Liu et al. (2022) show that machine learning models improve the prediction of municipal financial distress by moving beyond accounting ratios to include socio-demographic and institutional features. Contrary to ratios and regression FDP models, these machine learning models have an ability to capture non-linear relationships and interactions and handle categorical and continuous inputs concurrently, improving the potential for early detection of financial issues (Antulov-Fantulin et al., 2021). While ML can improve out-of-sample detection, deployment in government requires explainability and audit controls (Aoki et al., 2024), and performance can degrade under class imbalance and distribution shifts (W. Chen et al., 2024), limiting portability without careful governance and recalibration (Delfos et al., 2024). Overall, interpretability favours ratio and regression models, whereas detection favours machine learning, but portability, governance and external validation remain binding constraints (Rudin, 2019; Antulov-Fantulin et al., 2021).

2.4. Importance of Selecting the Suitable FDP Tools

Selecting a suitable FDP tool is vital for enhancing early warning capability, allocation choices and public accountability. According to X. Li et al. (2022) the choice of FDP models in the public sector often stems from their ability to support early warning systems. Song et al. (2024) argue that FDP models serve as early warning systems to assist organisations avert potential financial challenges before they occur. Furthermore, the selection of unsuitable FDP models increases the risk of false negatives that delay corrective action and magnify fiscal and service-delivery costs (Trussel & Patrick, 2009; Song et al., 2024). Cohen et al. (2017) and Skica et al. (2020) also highlighted the importance of selecting suitable FDP models as being crucial for the effective allocation of governmental resources by focusing on citizens’ needs and efficient tax utilisation, reflecting a shift toward greater accountability in public management. This approach is supported by Chung and Williams (2020), who emphasise the necessity of fiscal stress labels as part of early warning systems to assist local governments in financial management.
Another compelling aspect of selecting suitable FDP models is their capacity to facilitate public transparency and accountability. According to Rahayu et al. (2023), FDP models that promote transparent dissemination of financial health metrics can foster proactive engagement from community members, as they are better informed about their local government’s fiscal status. Zhuang and Wei (2023) argue that optimising legal frameworks surrounding financial risk measures not only aids in risk detection but also supports the regulatory structures necessary for effective governance. Furthermore, to enhance accountability and transparency, FDP models must be explainable, auditable and governable within statutory oversight arrangements (Delfos et al., 2024; Zhuang & Wei, 2023).
Overall, the selection of appropriate FDP tools must weigh error costs asymmetrically, prioritise interpretability and auditability, and plan for governance, monitoring and recalibration. Therefore, municipalities seeking sustainable financial resilience need a well-organized dynamic framework for selecting their FDP models.

2.5. Criteria for Selecting Financial Distress Prediction Tools

The literature indicates that the selection of FDP models for local governments is shaped by several recurrent considerations, although studies emphasise different elements and remain fragmented. Core considerations are ease of use and interpretability (Gorina et al., 2018a; Maher et al., 2020), evidence of prior empirical validation in comparable settings (Trussel & Patrick, 2009; Cohen et al., 2012), the choice and construction of ratios and indicators used by the model (Brusca et al., 2015; Gorina et al., 2018b), and contextual applicability given legal, reporting and capacity conditions (Cohen et al., 2017; Galiński, 2023).
The literature shows three consistent requirements for municipal FDP model selection. Interpretability of an FDP model is essential. Models must be explainable and policy-legible to sustain accountability and oversight, otherwise legitimacy in public decisions is weak (Rudin, 2019; Delfos et al., 2024). Data realism is also essential. Evidence should be validated out of sample and, where possible, out of time or on later periods. Studies should state how class imbalance is handled and what assumptions underpin indicators and reporting regimes, since reported gains rarely survive deployment without these safeguards (McDonald & Maher, 2020; W. Chen et al., 2024). Cross-jurisdiction robustness is also needed. Portability is modest without recalibration, so models should show stability under policy, reporting and economic changes, and include governance controls for drift detection and updates (Gorina et al., 2018a; Delfos et al., 2024). Accuracy remains necessary but not sufficient. Without interpretability, governance readiness and external validity, tools risk brittle performance, low legitimacy and poor transferability (Alaka et al., 2018; Maher et al., 2020). Municipalities should therefore prioritise models that deliver auditable gains under realistic data constraints and include a clear plan for monitoring, recalibration and oversight.

2.6. Gaps in Existing Literature

Two structural gaps persist. First, municipalities lack a context-sensitive, standardised selection framework; studies vary in definitions, labels and indicator sets, which limits comparability and complicates early-warning design (Iacuzzi, 2022; Leiser & Mills, 2019). Second, compared with the corporate and banking domains, where frameworks like Altman’s Z-score and CAMELS have consolidated practice, municipal work remains fragmented, with sparse external validation and uncertain transferability across jurisdictions (Altman, 1968; Galán, 2021). These gaps motivate the framework developed in this study.

3. Methodology

This study employed a systematic review methodology to evaluate financial distress prediction (FDP) tools for municipalities, identify key evaluation criteria, and develop a framework for model selection. Systematic reviews collate, appraise, and synthesise relevant evidence using transparent and reproducible procedures (Clark et al., 2021). This approach enables an objective assessment of FDP tools and supports the development of a robust and well-grounded selection framework for municipal use.
We followed the seven-stage evidence-synthesis approach outlined by Tranfield et al. (2003): (1) define the research question, (2) develop the search strategy, (3) set eligibility criteria, (4) screen and select studies, (5) assess quality, (6) extract data, and (7) synthesise and report findings. This approach mitigates subjectivity and guards against bias, thereby ensuring that the framework is grounded in systematically derived evidence rather than individual interpretation.

3.1. Defining the Research Question

Researchers have posited that a clear research question defines the scope, informs study selection, and guides synthesis (Tranfield et al., 2003; Gusenbauer & Haddaway, 2020). Guided by Sauer and Seuring (2023), the research question of this study is framed using the PICO (Population, Intervention, Comparison, Outcome) framework shown in Table 1.
The primary research question of this study is as follows: What are the key criteria for evaluating municipal FDP models, and how can these criteria inform a framework for selecting the most appropriate model?

3.2. Developing a Search Strategy

To identify studies on financial distress prediction (FDP) models for municipalities, we designed a comprehensive search strategy based on established systematic review guidelines (Tranfield et al., 2003). Guided by PICO framework principles (Munn et al., 2021), we extracted keywords and synonyms relating to municipalities (“municipalities,” “local governments,” “councils”), financial distress (“financial distress,” “fiscal strain,” “financial condition”), and prediction methods (“prediction,” “modelling,” “measurement,” “assessment,” “estimation”). These were combined using Boolean operators (“AND,” “OR”) to create search strings (Appendix A).
The strategy was piloted and refined to ensure coverage across six databases: Google Scholar, Web of Science, ScienceDirect, Scopus, EBSCOhost, and ProQuest (Gusenbauer & Haddaway, 2020). Search execution commenced on 10 October 2024, with adjustments made where certain databases restricted the use of long search strings. To avoid omitting relevant work, we also conducted a hand search on 17 October 2024 (Munn et al., 2021).
During the initial search, each database yielded different numbers of studies (for instance, Scopus: 112; Google Scholar: 106; ScienceDirect: 34; ProQuest: 209; Web of Science: 14; EBSCOhost: 12) while the hand searching of databases yielded 14 papers, producing an initial total of 501 papers. A supplementary search was undertaken on 10 March 2025 (Munn et al., 2023), which identified additional publications totalling 245 but none from EBSCOhost or Web of Science. Search statements and outputs are documented in Appendix A.
All results were screened and synthesised following PRISMA protocols (Page et al., 2021), ensuring transparent, replicable selection. Regular updating of the strategy strengthened the credibility and topical relevance of the review findings.

3.3. Developing Eligibility Criteria for Study Selection

Systematic review methodology requires explicit eligibility criteria to ensure consistent and transparent study selection (Clark et al., 2021). In this study, we collaboratively developed, pretested, and refined the criteria to ensure alignment with the objectives of the review (Gusenbauer & Haddaway, 2020). The criteria were designed to identify studies that propose, test, or review financial distress prediction (FDP) models relevant to municipalities. Studies limited to descriptive assessments of financial condition were excluded, as these approaches, although useful for evaluating current fiscal health, lack predictive capacity and therefore do not function as early warning tools (McDonald & Maher, 2020). Only forward-looking studies employing statistical, or machine learning models were retained, consistent with the aim of identifying evaluation criteria for predictive tools (Alaka et al., 2018). The final inclusion and exclusion parameters are presented in Table 2.

3.4. Screening and the Selection of Studies

The screening and selection process was conducted using Covidence software to enhance transparency and reproducibility (Clark et al., 2021). Covidence facilitated the assignment of reviewer roles, application of eligibility criteria, and documentation of exclusion decisions at the full-text stage (Kolaski et al., 2023). Prior to the full review, the team piloted the process on a sample set of studies to ensure consistency in applying the criteria (Gusenbauer & Haddaway, 2020). Screening was performed in two stages: title and abstract screening, followed by full-text screening. At each stage, two reviewers independently assessed studies, with progression to the next stage requiring agreement from both. Disagreements were resolved through adjudication by a third reviewer (Sauer & Seuring, 2023). This structured procedure ensured a rigorous and transparent assessment of all identified studies.

3.5. Assessing the Quality of the Included Studies

Quality assessment was undertaken to ensure the robustness and credibility of findings of the study. We evaluated each study according to its design, potential bias, sample size, methodology, and its alignment to our research question (Munn et al., 2023). Our review focused on predictive modelling studies, rather than approaches designed for clinical or qualitative research. Following practices outlined in Alaka et al. (2018), selected studies were quality appraised based on the clarity of objectives, adequacy of data sources, transparency of model development, and the use of validation and accuracy reporting. Two reviewers independently conducted the assessments, with a third resolving disagreements. The quality appraisal guided interpretation of findings but did not serve as grounds for exclusion. This comprehensive approach ensured a reliable foundation for evaluating models and developing the selection framework.

3.6. Extraction of the Relevant Data

We developed and piloted a structured data extraction form (Munn et al., 2021). The form was designed to capture the study characteristics of each selected study including author, year of publication, country, study aim, methodology, tool type, sample size, data sources, and accuracy metrics. We automated the data extraction process by uploading the data extraction form into Covidence software.
Two reviewers independently extracted data from the 24 included studies, with disagreements resolved through consultation with a third reviewer. Challenges encountered were documented and adjustments made where necessary. The data extraction process resulted in a dataset that consolidates study-level information and is archived in an open-access repository [https://doi.org/10.17632/s3jwmnjm8t.1].

3.7. Synthesis and Reporting of Findings

The synthesis and reporting of the findings were central to this study, as it enabled the identification of the evaluation criteria for the evaluation and selection of the FDP models. A descriptive and comparative synthesis approach was followed. Research findings were organised thematically by predictive methodology, theoretical framework, accuracy metrics, tool type, contextual relevance, and data requirements. This approach aligns with the synthesis methodology applied by Alaka et al. (2018) in bankruptcy prediction research which culminated in a framework for the selection of FDP tools for the corporate sector.
Transparency was maintained by documenting all classification decisions and approaches to incomplete data (Gusenbauer & Haddaway, 2020). Visual and tabular presentations, including charts and matrices, supported cross-study comparisons and illustrated tool performance against the evaluation criteria. Reporting followed PRISMA guidelines (Page et al., 2021). The synthesis also highlighted differences in FDP models, contexts, and data requirements, enabling a nuanced assessment of factors influencing model outcomes (Lunny et al., 2018). The findings directly informed the development of the framework for the selection of FDP models for local governments.
The synthesis was further guided by three complementary theoretical lenses introduced in the Introduction. Utilisation-Focused Evaluation (Patton, 2008) was applied to emphasise usability and decision-orientation of the evaluation criteria. Design Science Research (Hevner et al., 2004) structured the process of developing the framework as a usable artefact, ensuring methodological rigour. Institutional Theory (DiMaggio & Powell, 1983) informed the contextual interpretation of findings by considering the influence of municipal rules, norms, and institutional environments. Together, these lenses provided a coherent analytical frame for coding, classifying, and synthesising studies, thereby ensuring that the framework was both theoretically grounded and practically applicable.
Ethical approval was not required for this study, as it is based exclusively on secondary data derived from publicly available research articles. No human participants, animals, or identifiable personal data were involved. No generative artificial intelligence (GenAI) tools were used to generate original data, perform analysis, or draw conclusions. All content and interpretations were developed and critically reviewed by the authors. To promote transparency, Figure 1 was included to illustrate the study selection process.

4. Results

This section presents the results of the systematic review, highlighting key trends and patterns in the selected studies on financial distress prediction (FDP) tools for municipalities. The findings are organised into four main areas: general study characteristics, key evaluation criteria, a summary of the reviewed studies, and the performance of the FDP tools against the identified evaluation criteria.

4.1. Characteristics of the Included Studies

4.1.1. Publication Trends

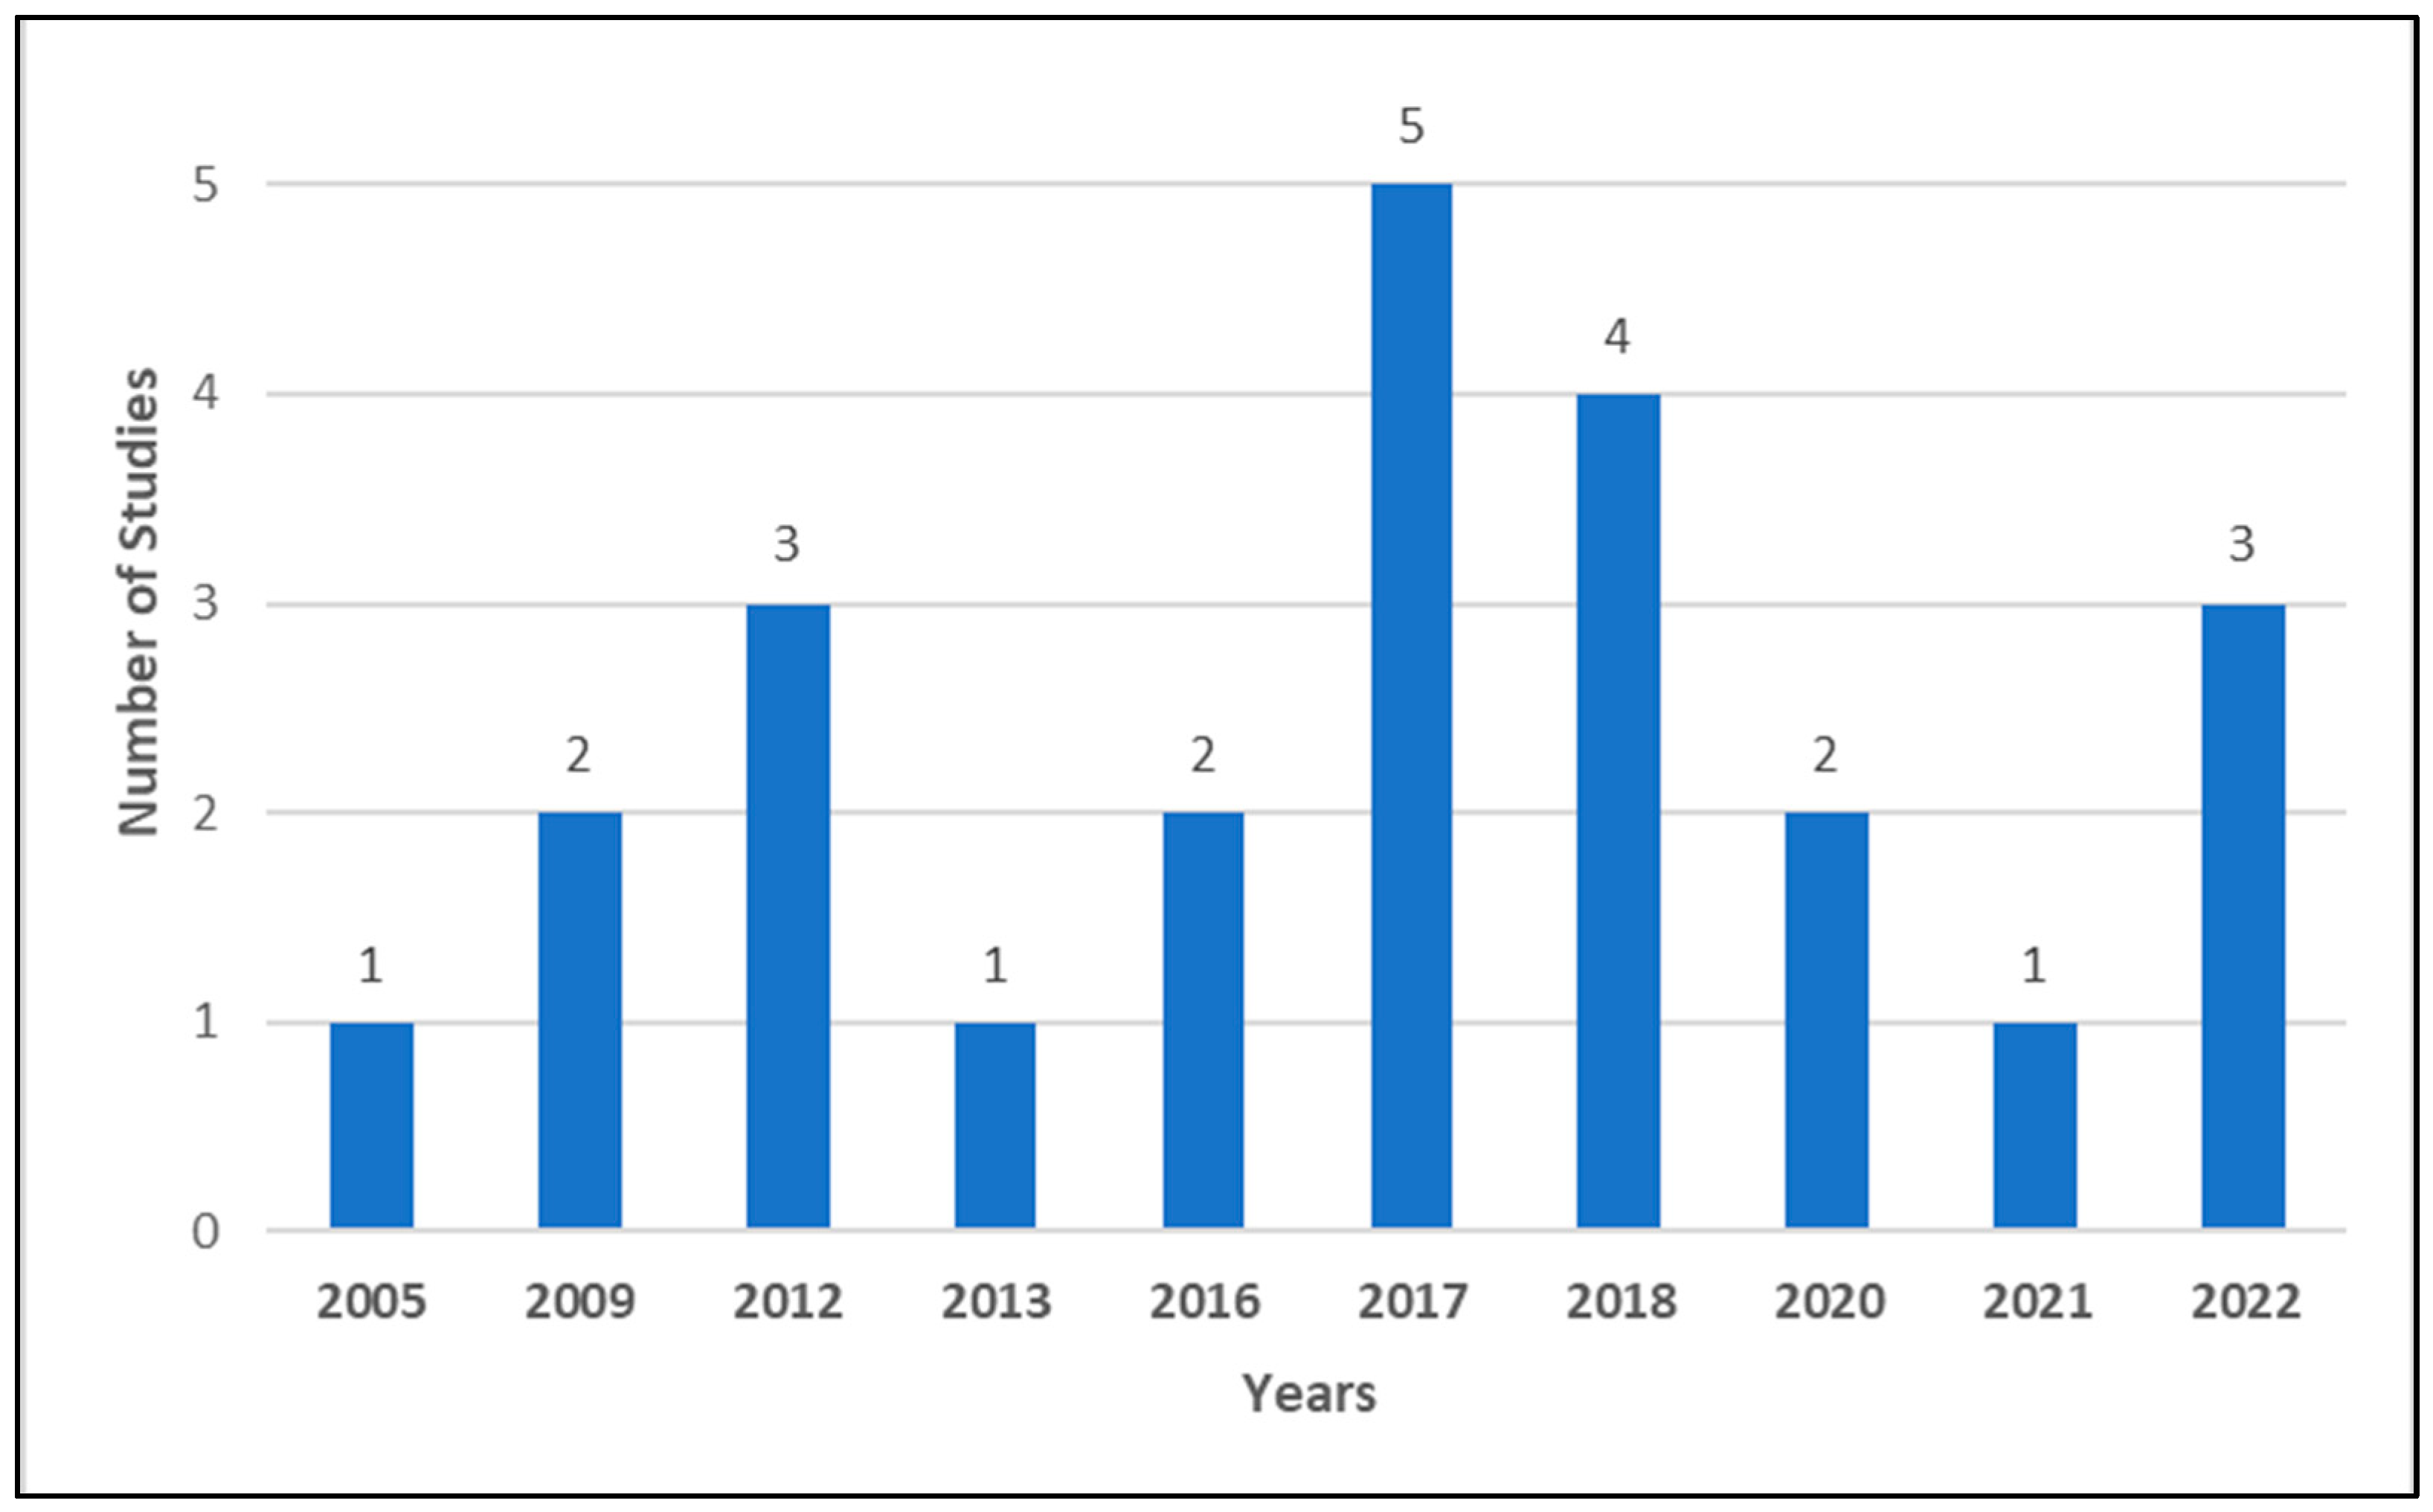
This review includes 24 studies published from 2005 to 2022, covering countries including the United States, Spain, Italy, Poland, China, and Indonesia. Figure 2 illustrates the progression of publication trends over this period.
The publication trends depicted in Figure 2 reveal a clear upward trajectory in research interest in municipal FDP during the last decade. Early contributions were sparse but formative, including Kloha et al. (2005), Trussel and Patrick (2009) and Zafra-Gómez et al. (2009) which laid the groundwork for subsequent research developments on the topic.
Research output increased substantially between 2017 and 2018 with nine studies published during this period. This growth reflected heightened concern with municipal solvency following the 2008 global financial crisis and the European debt crisis (Cohen et al., 2017). Amongst the studies published during the period is Alaminos et al. (2018) who introduced machine learning and hybrid techniques, signalling methodological broadening in the prediction of financial distress.
Publication outputs remained steady into 2020 and 2022, with five studies published during this period. This slowdown may reflect shifting scholarly priorities and pandemic-related disruptions. No studies were identified between 2023 and 2025. The absence of recent publications highlights an opportunity for further research on municipal financial distress prediction. Overall, Figure 2 shows that academic interest in this field has generally expanded in response to fiscal pressures and global economic events.

4.1.2. Geographic Distribution of the Selected Studies

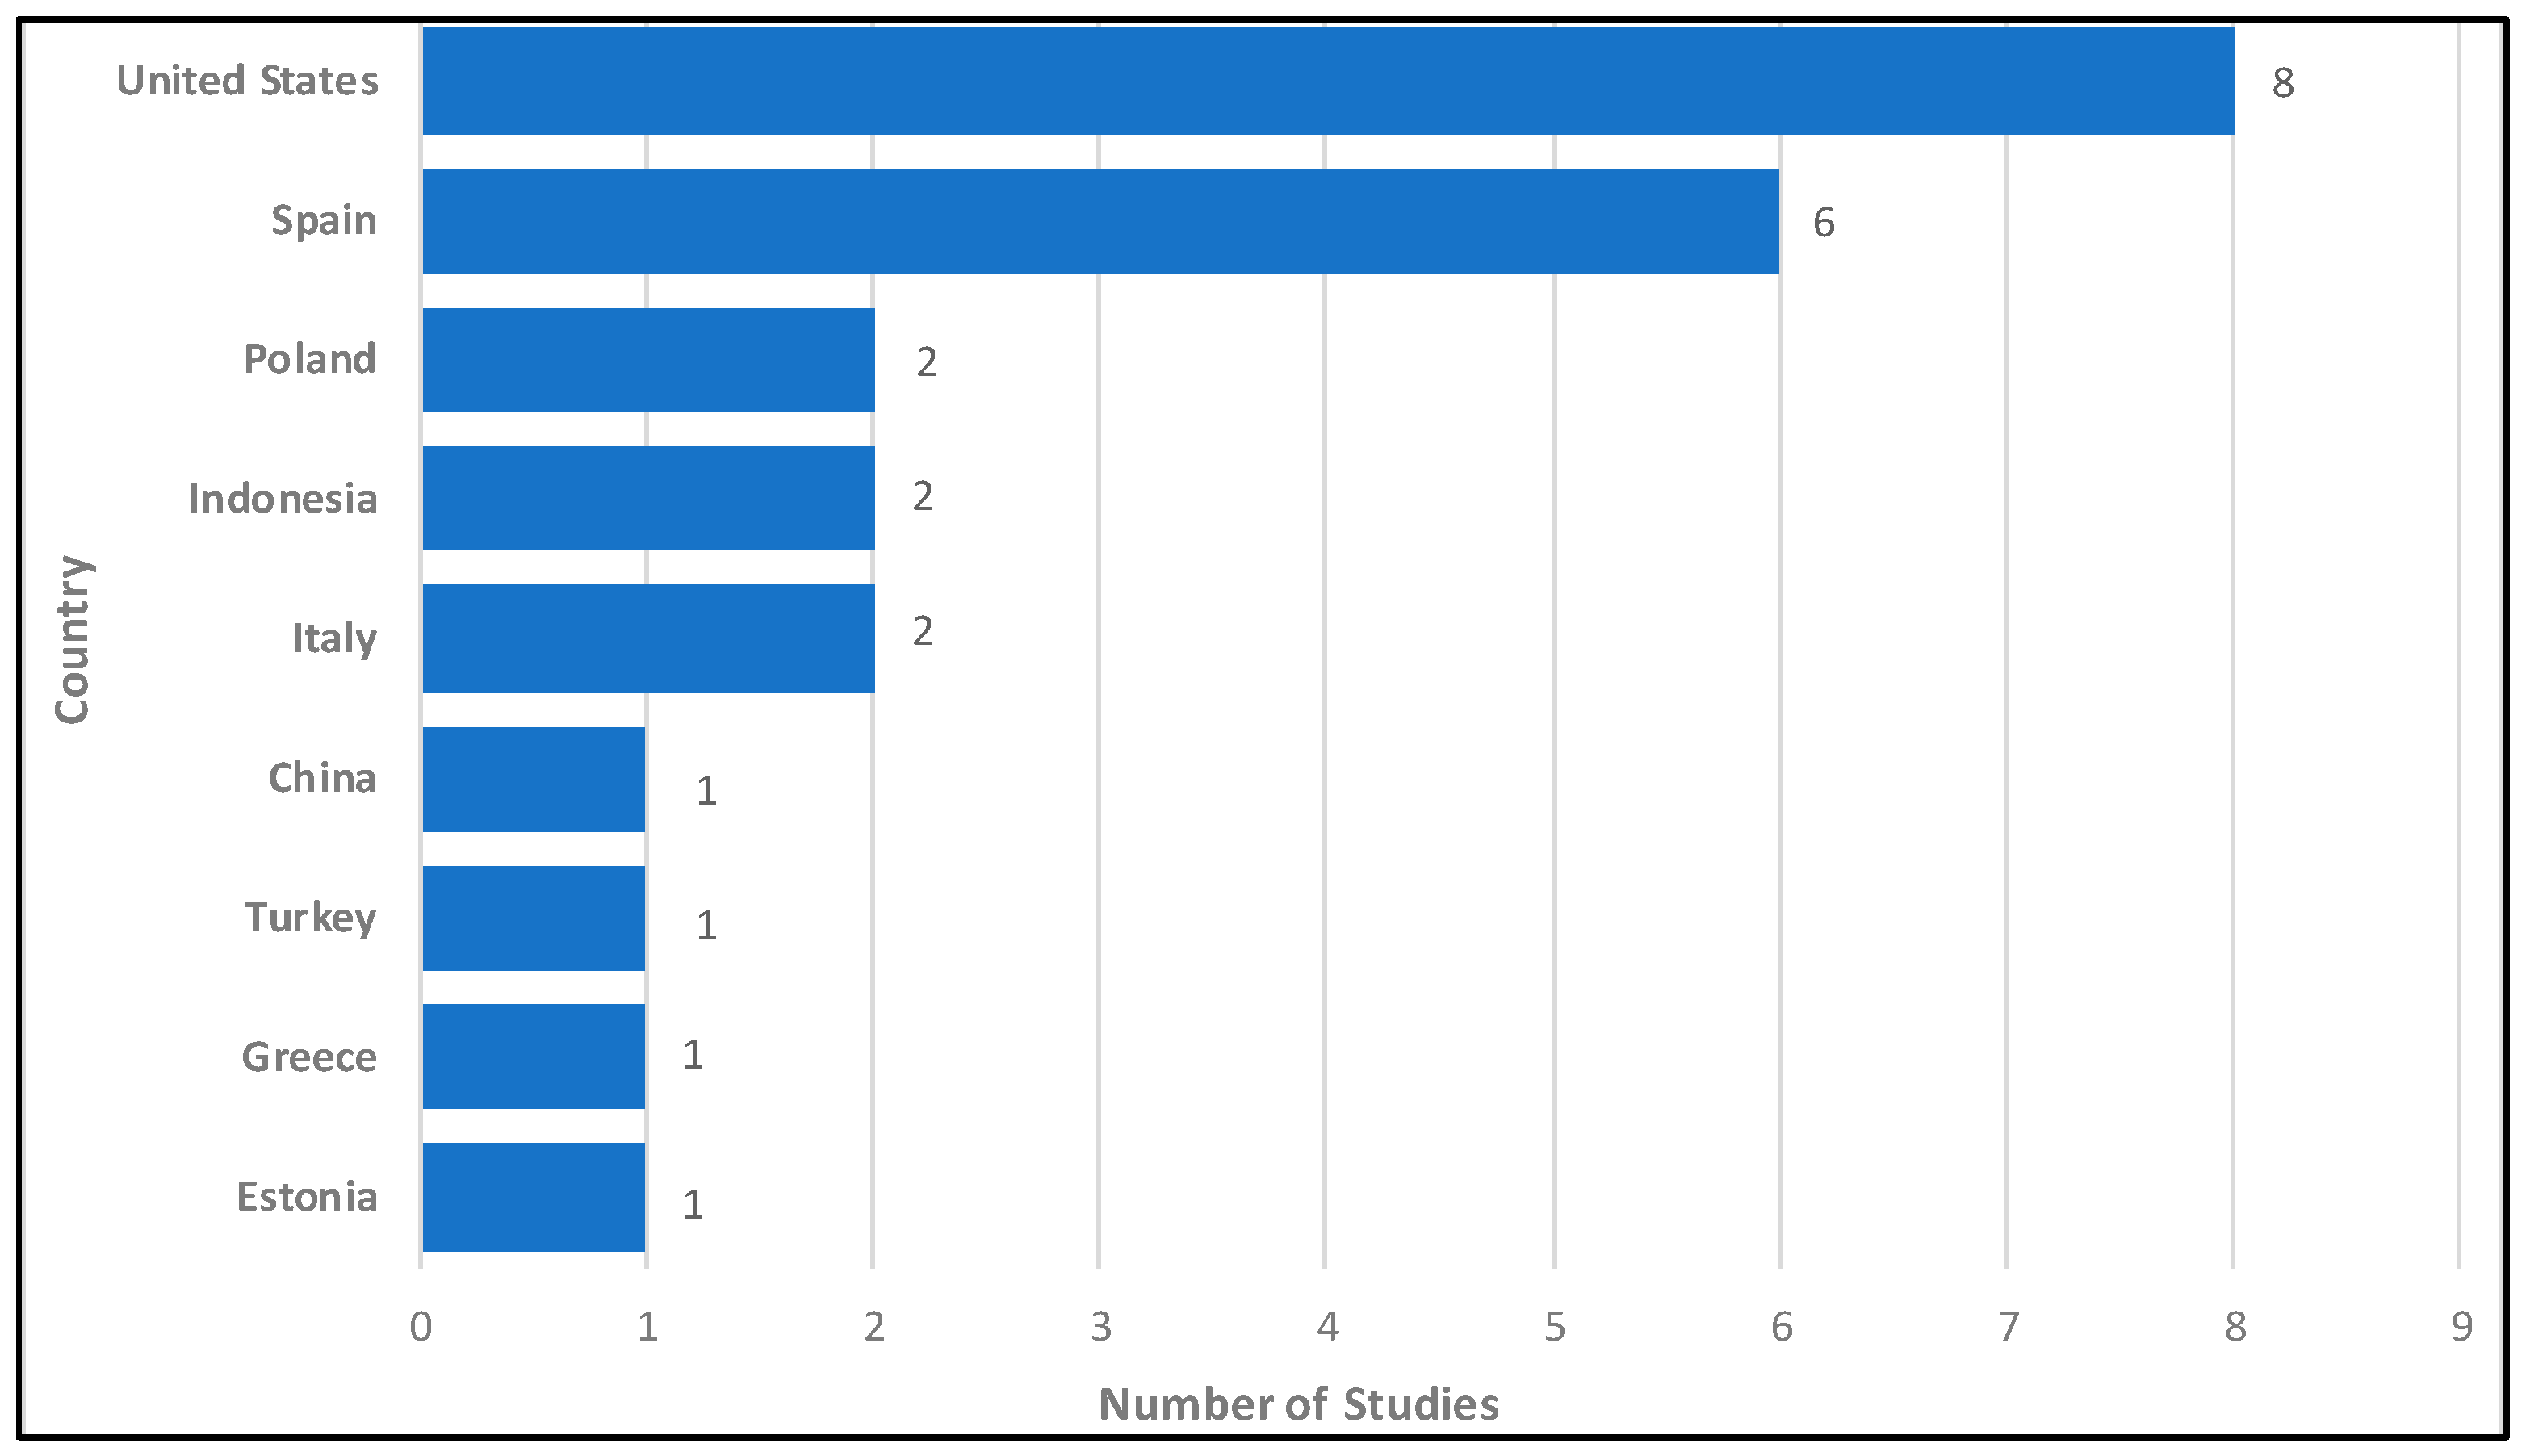
This review contains 24 studies which cover ten countries yet most research stems from two specific national settings. Figure 3 illustrates the geographic distribution of the reviewed studies.
As Figure 3 shows, the United States contributes eight studies employing varied modelling methods, while Spain accounts for six studies, primarily focused on financial health assessment and fiscal stress forecasting. Two studies each from Italy, Poland, and Indonesia demonstrate some attention to municipal FDP in emerging European and Southeast Asian contexts, though at a lower level. These contributions illustrate different governance systems and fiscal environments. No studies were found from African or Latin American municipalities. This absence is striking, given the prevalence of fiscal stress in these regions. The limited geographic distribution restricts the wider applicability of current FDP models and reduces their utility for preventive measures in vulnerable municipalities.

4.1.3. Publication Outlets of the Included Studies

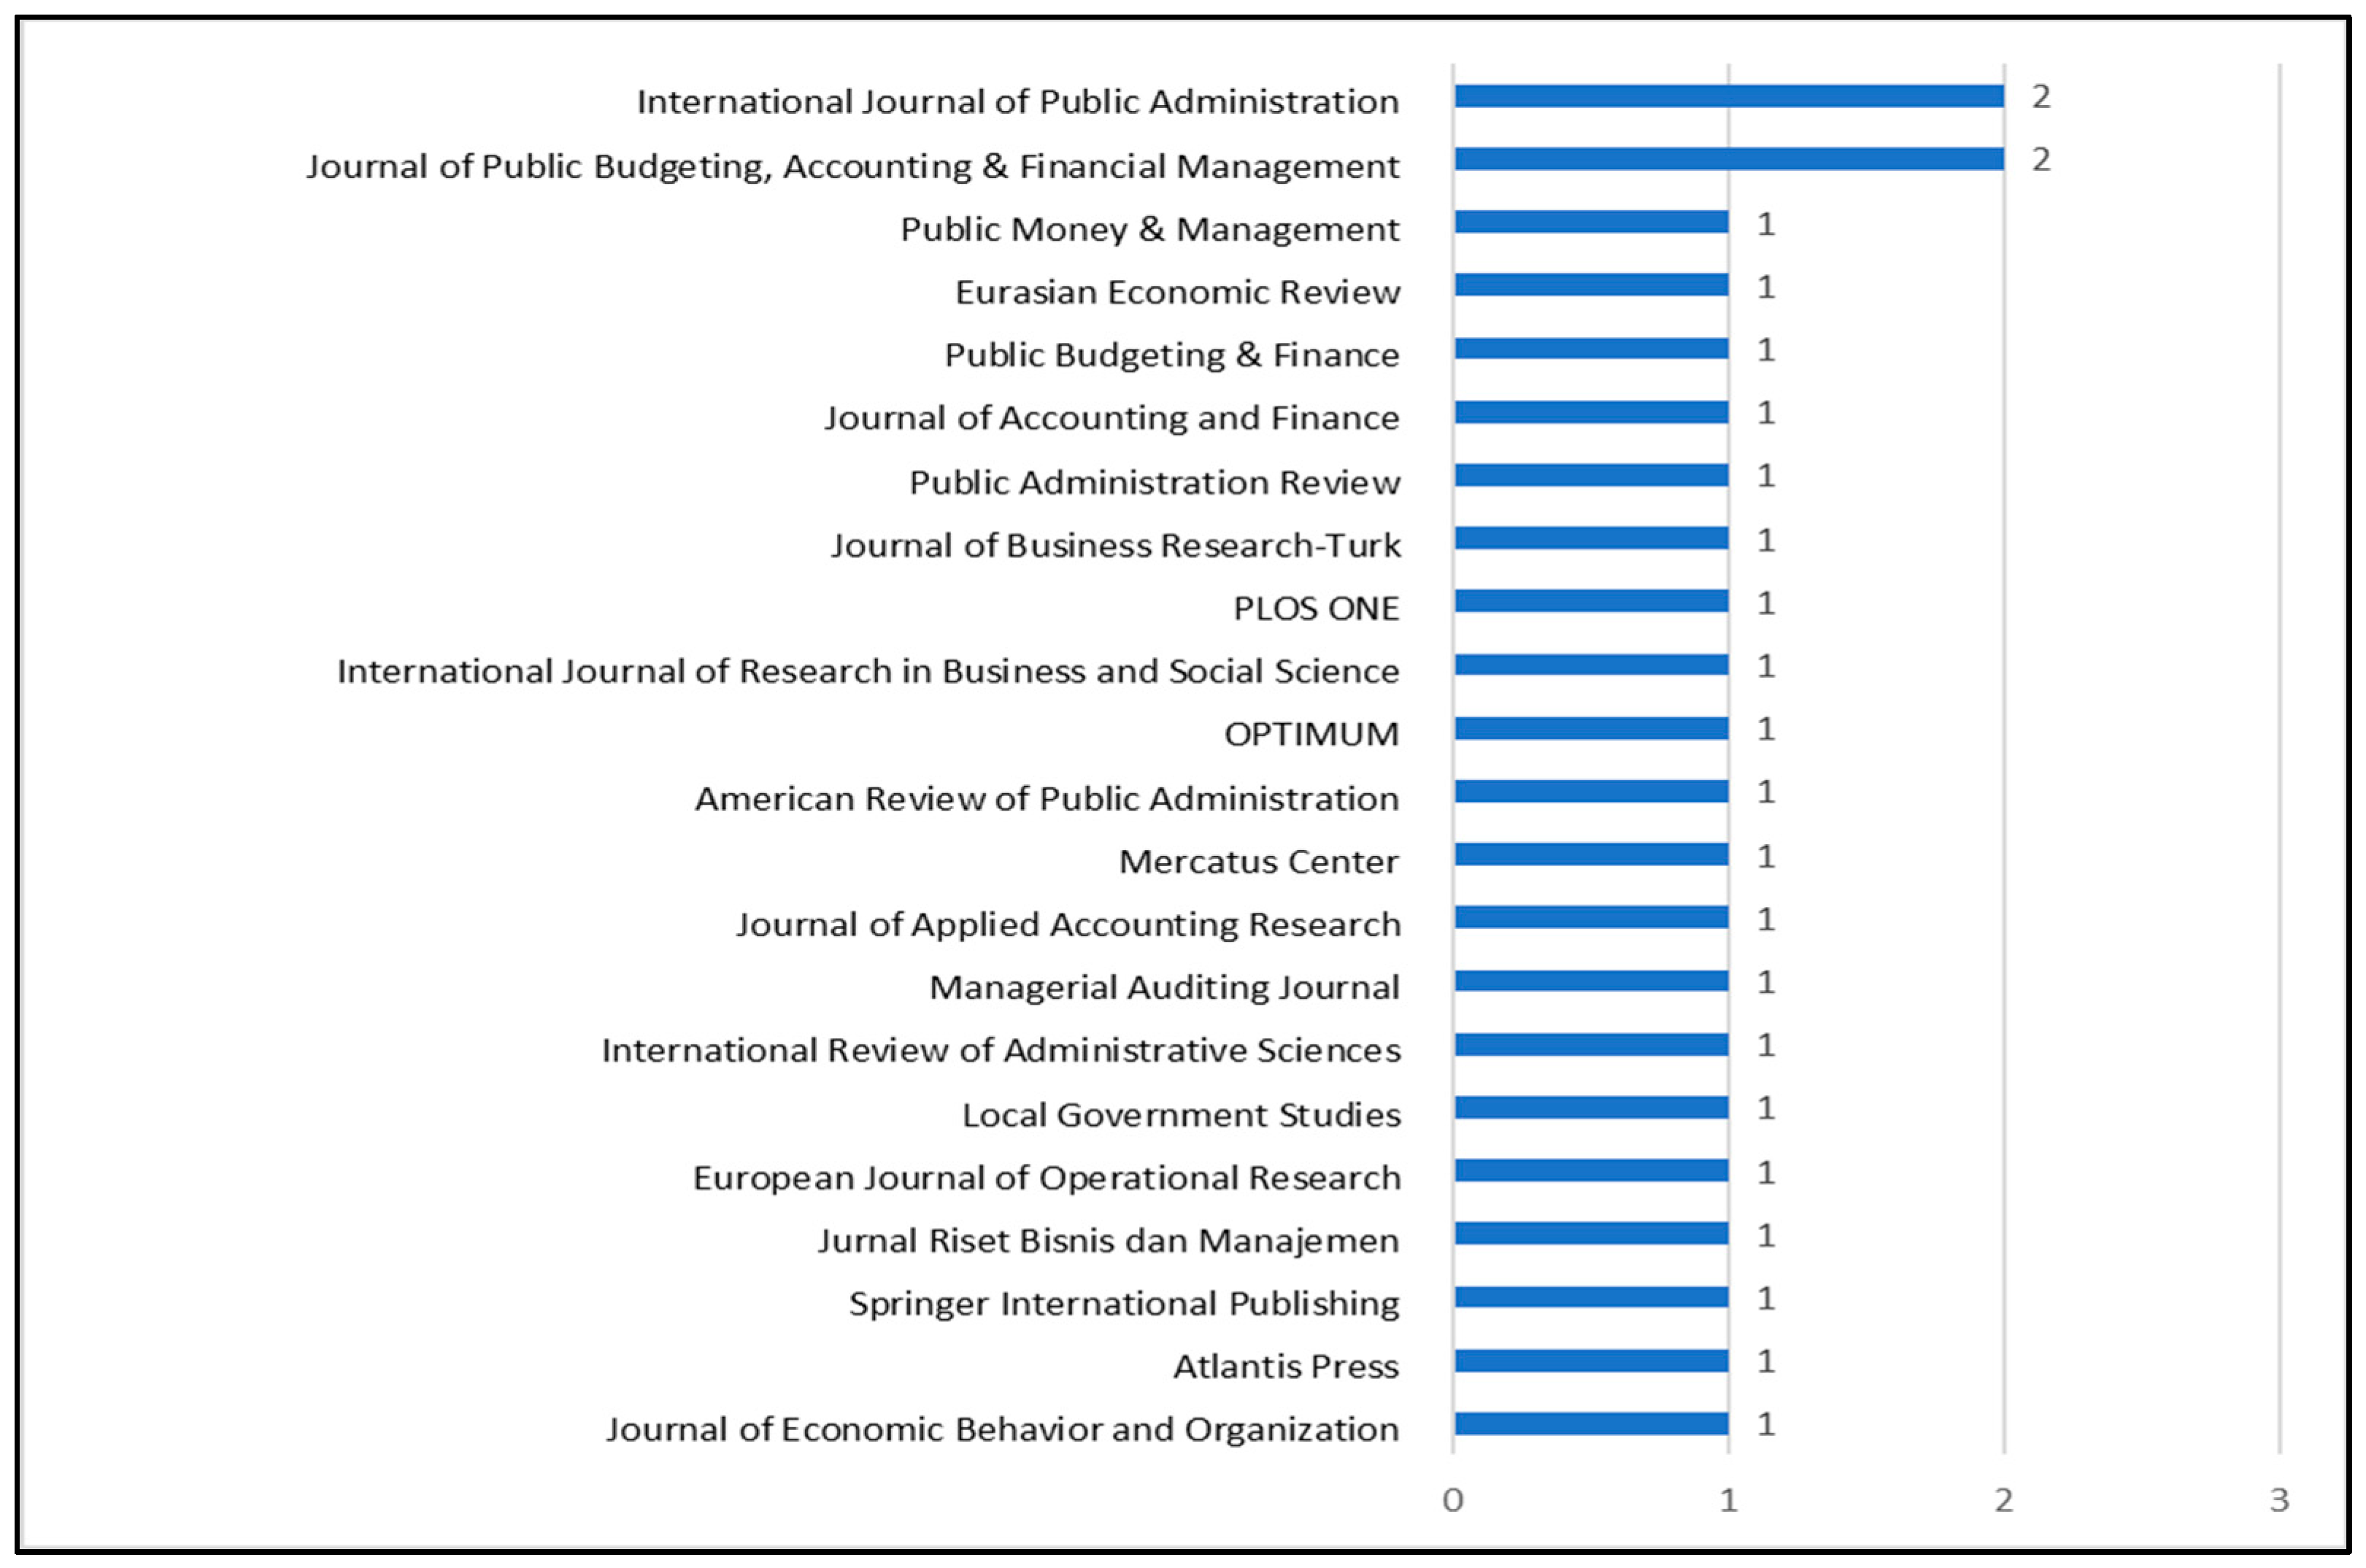
Figure 4 shows the distribution of publication outlets of the reviewed studies.
The International Journal of Public Administration and the Journal of Public Budgeting, Accounting & Financial Management published two studies each. All other journals contributed one publication, underscoring a wide dispersion of studies rather than concentration in a few specialist publication outlets.
The review also included papers from high-impact journals such as the European Journal of Operational Research, Public Administration Review, and Public Money & Management. Some of the studies also appeared in open-access platforms such as PLOS ONE and from research centres like the Mercatus Center. This blend indicates growing academic recognition of FDP research while also enhancing access for practitioners.
The inclusion of a range of disciplines such as public administration, accounting, finance, economics, and operations research, highlights the multidimensional character of FDP model development and evaluation. This diversity strengthens the conceptual base of the field while also revealing its fragmented disciplinary spread.

4.1.4. Summary of the Included Studies

The summary of the 24 studies is presented in Appendix B. The reviewed studies applied diverse methodologies and modelling approaches. Logistic regression approach was widely used to classify distressed and non-distressed municipalities based on financial indicators and operating deficits. Survival analysis, particularly Cox regression, was employed to examine the timing of fiscal distress (Trussel & Patrick, 2013; López-Hernández et al., 2018).
Other prediction modelling approaches included discriminant analysis (Lohk & Siimann, 2016), panel data regression (Rodríguez-Bolívar et al., 2016), and composite scales such as the fiscal distress index (Kloha et al., 2005). Recent studies introduced approaches such as decision trees, neural networks, gradient boosting, and support vector machines (Antulov-Fantulin et al., 2021; X. Li et al., 2022). These machine learning applications improved predictive accuracy through ensemble methods (Antulov-Fantulin et al., 2021). Furthermore, hybrid approaches such as Data Envelopment Analysis (Kluza, 2017) and multicriteria decision analysis (Cohen et al., 2012) further broadened the methodological scope of financial distress prediction.
The studies varied widely in terms of geographic spread and municipal type. Some studies targeted large cities or provincial capitals (see, López-Hernández et al., 2018), while others combined urban and rural municipalities (see, Cohen et al., 2012). Several studies included all municipalities in a national system in their samples, whereas others focused narrowly on specific regions (Alaminos et al., 2018; Islamiyah et al., 2022).
Studies utilised data sources such as audited financial statements, audit reports, census data, and national or regional databases. Sample sizes ranged from small to large panel datasets covering thousands of observations (see, Trussel & Patrick, 2013; Antulov-Fantulin et al., 2021).
Model validation approaches also varied across studies. Some studies reported accuracy rates, while others used alternative fit measures such as Hosmer–Lemeshow tests, hazard ratios, or pseudo-R2 values (see, Shiddiqy & Prihatiningtias, 2022). Recent studies measured predictive accuracy of their models using AUC and ROC curves.
Overall, the reviewed studies show a clear methodological evolution from traditional statistical tools to advanced machine learning and hybrid approaches, while retaining wide variation in scope, sample size, and data sources.

4.1.5. Thematic Classification of Variable Indicators

This subsection presents the results of a thematic analysis of the variable indicators extracted from the reviewed studies. Thematic analysis of variable indicators revealed four broad categories: Financial, Socio-Economic, Political/Institutional, and Contextual/External risks. Figure 5 shows the distribution of these themes across all extracted indicators.
Financial indicators dominated across the reviewed studies, comprising 167 (74%) of all extracted variables. These included debt ratios, fund balances, solvency indices, expenditure ratios, and liquidity measures (Alaminos et al., 2018; Gorina et al., 2018a; Kloha et al., 2005; Trussel & Patrick, 2013; Zafra-Gómez et al., 2009).
Socio-economic indicators accounted for 17% of variables, including unemployment rates, income levels, population growth, dependency ratios, and GDP per capita (López-Hernández et al., 2018; X. Li et al., 2022).
Political and institutional factors accounted for 6% of the total variables, focusing on political affiliation, mayoral characteristics, party fragmentation, and budgetary control (Antulov-Fantulin et al., 2021; Navarro-Galera et al., 2017).
Contextual and external risks accounted for 5% of the total variables, covering macroeconomic vulnerabilities, regional disparities, and spillover effects from past crises (X. Li et al., 2022; López-Hernández et al., 2018).
Figure 5 shows that while financial variables dominate FDP modelling, broader socio-economic, political, and contextual dimensions remain underutilised, undermining the multifaceted nature of municipal fiscal distress.

4.2. Evaluation Criteria Identified Across Studies

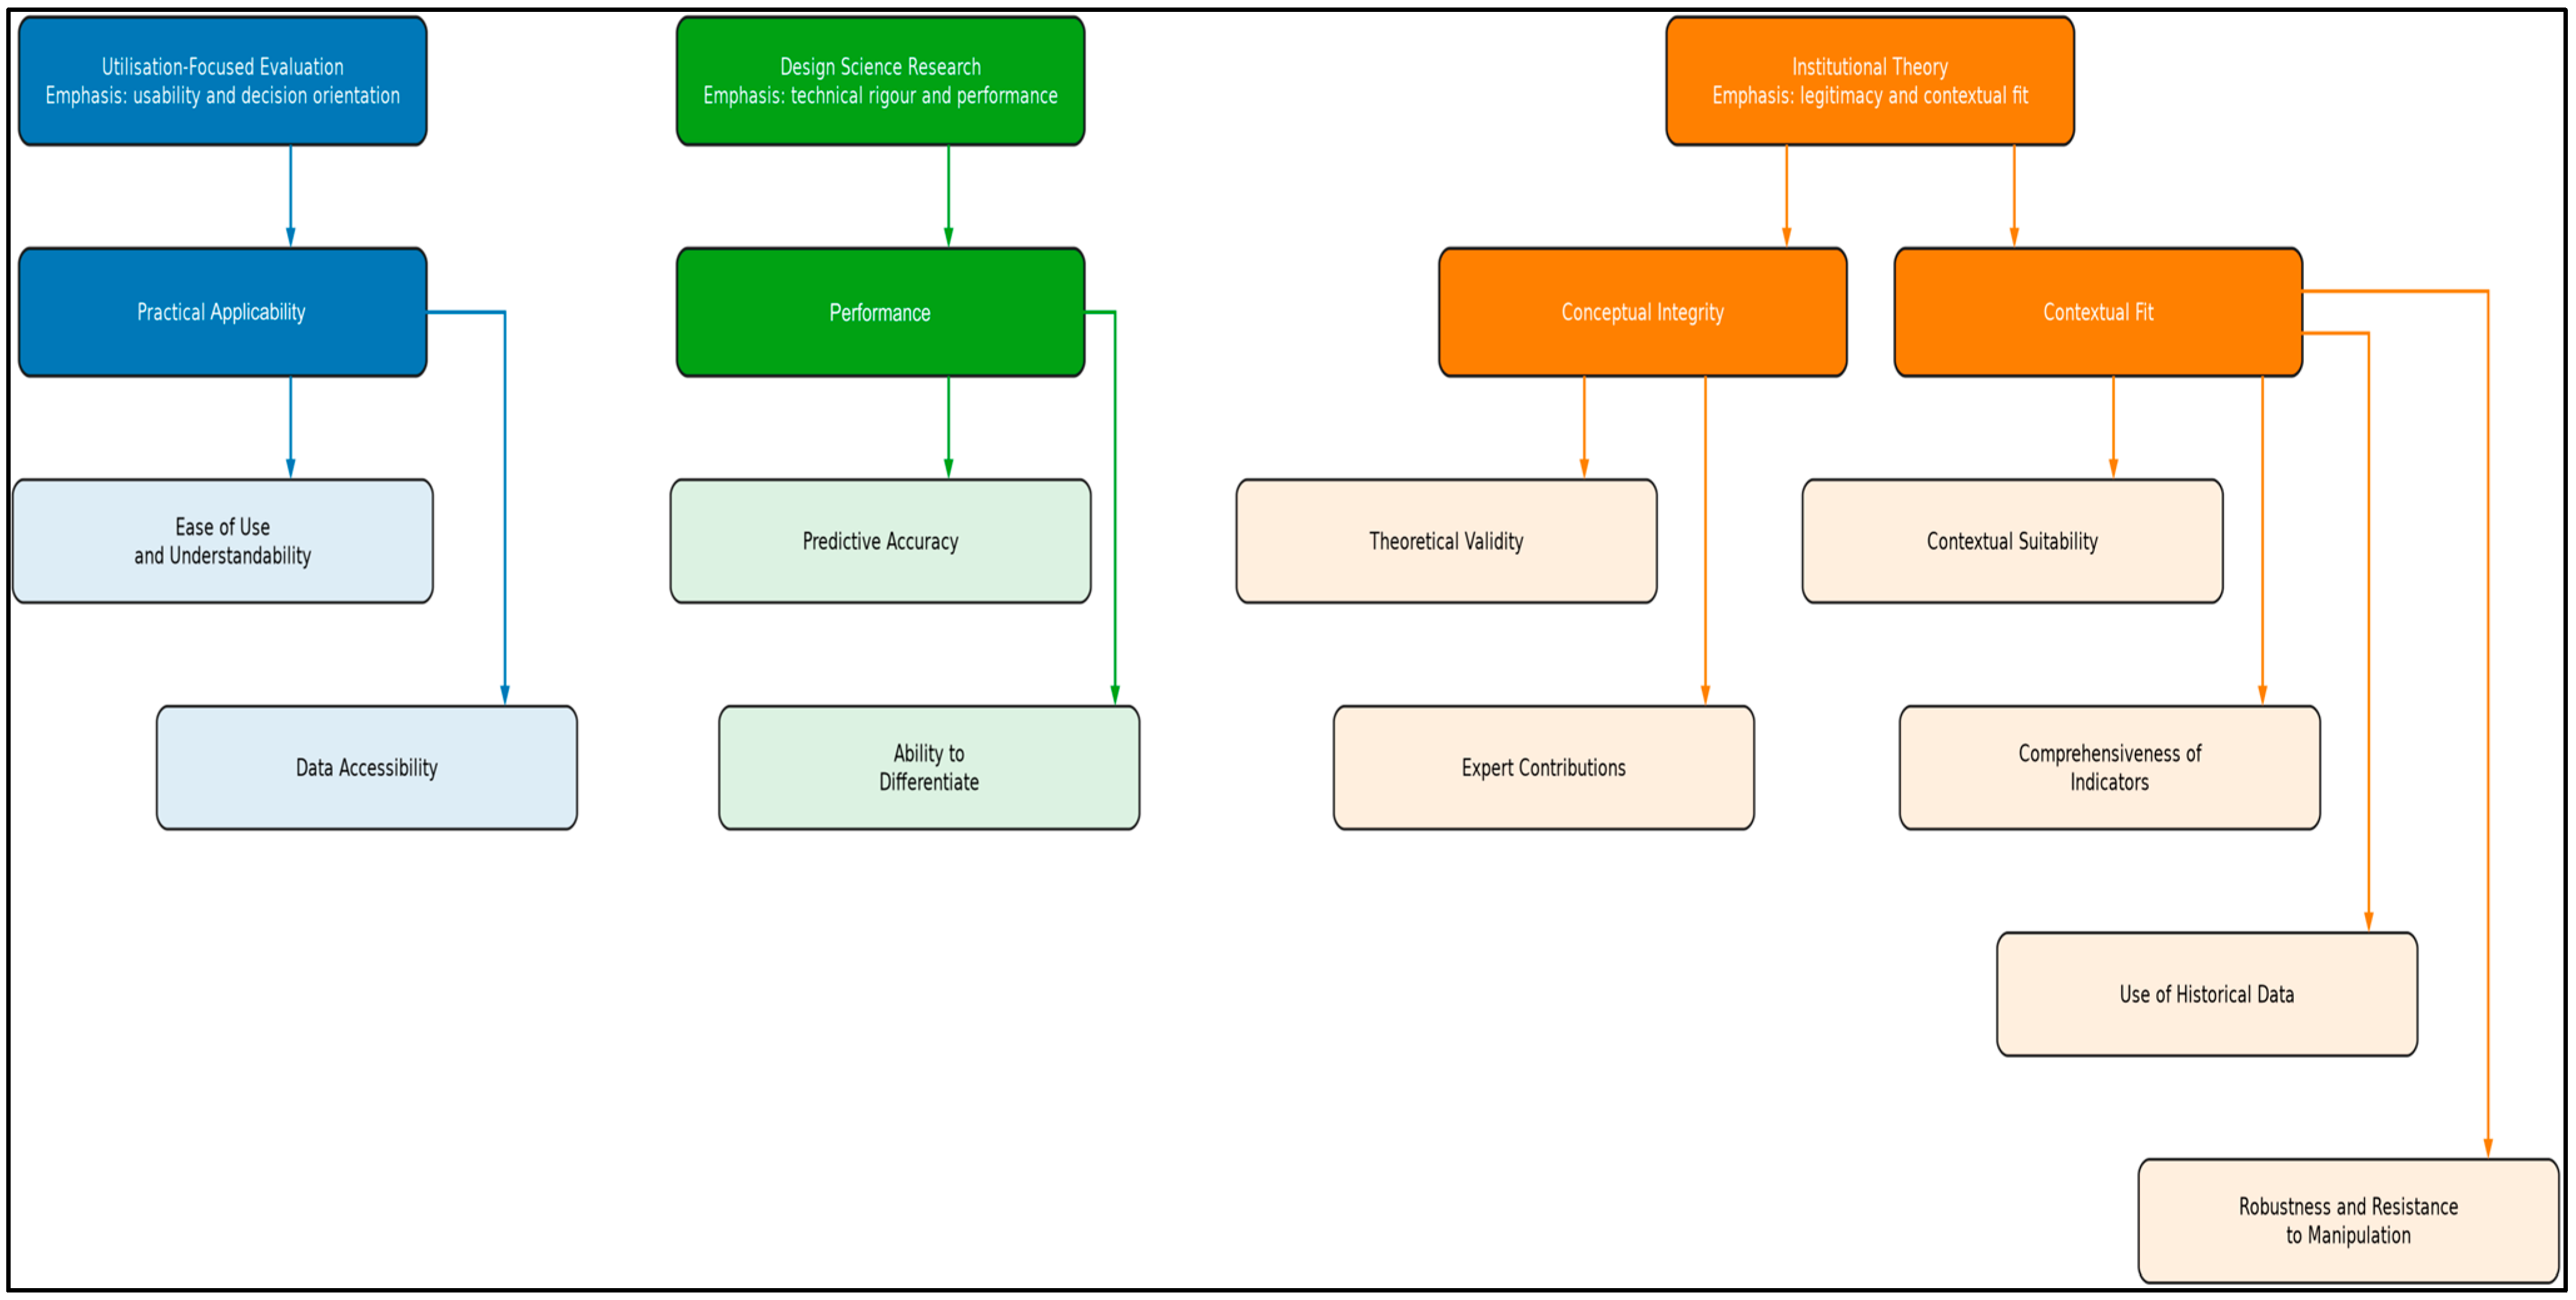
Table 3 presents the ten key evaluation criteria identified, either explicitly discussed or inferred through methodological choices of the 24 reviewed studies.
The distribution of criteria shows that predictive accuracy was the most widely applied measure (70.8% of studies), followed by comprehensiveness of indicators (66.7%), contextual suitability (41.7%), and use of historical data (41.7%). Practical considerations such as ease of use and data accessibility received less consistent attention, while conceptual dimensions such as theoretical validity (12.5%) and expert contributions (8.3%) were rarely incorporated. This uneven distribution highlights a literature overly focused on predictive metrics at the expense of theory, expert insight, and contextual adaptation.
To enhance conceptual clarity, these ten criteria were organised into four thematic domains: (1) Performance, (2) Conceptual integrity, (3) Practical applicability, and (4) Contextual fit. These domains are conceptually grounded in, and closely aligned with, the theoretical framework guiding this study. The Performance theme used metrics that evaluated accuracy and ability to differentiate between distressed and healthy municipalities in a manner that corresponds with Design Science Research theory (Hevner et al., 2004). The soundness of the model’s theoretical validity and expert contributions under the Conceptual integrity theme establishes its alignment to the Institutional Theory (DiMaggio & Powell, 1983). The Practical applicability theme consists of usability standards and simplicity requirements because of their basis in Utilisation Focused Evaluation theory (Patton, 2008). Finally, the FDP model demonstrates strong contextual relevance and indicator comprehensiveness through the Contextual fit domain based on the Institutional Theory (DiMaggio & Powell, 1983). Figure 6 presents the key evaluation criteria per themes.
The organisation of evaluation criteria into four domains also underscores distinctions between municipal and corporate FDP models. Corporate prediction studies often prioritise predictive accuracy, model transparency, and statistical performance, with less attention to contextual or institutional factors (Alaka et al., 2018; Sun et al., 2014). By contrast, the municipal context demands additional emphasis on institutional legitimacy, data accessibility, and contextual suitability, since municipalities operate under political mandates, intergovernmental transfers, and service delivery obligations (Kooij & Groot, 2021; McDonald & Maher, 2020). Whereas corporate models can rely on standardised financial ratios, municipal frameworks must integrate diverse indicators spanning socio-economic, political, and contextual dimensions (X. Li et al., 2022; Shiddiqy & Prihatiningtias, 2022). Corporate studies increasingly test governance and CSR indicators and advanced hybrid ML models for performance on unbalanced datasets, yet these remain primarily firm focused (H. Li et al., 2024; Ainan et al., 2024). In municipal settings, additional emphasis must be placed on interpretability and transparency given their public-sector application (Rudin, 2019; Delfos et al., 2024). These distinctions demonstrate why corporate frameworks cannot simply be transferred to municipalities without adaptation. A dedicated evaluative framework for municipal FDP models is therefore required, one that moves beyond corporate-focused criteria while balancing predictive accuracy with conceptual grounding, expert involvement, and contextual fit.

4.3. Model Performance of the Included Studies

This section reports the findings from the analysis of the 24 included studies against the ten evaluation criteria for municipal FDP models.

4.3.1. Performance

Across the 24 reviewed studies, the predictive performance was assessed using diverse accuracy metrices including AUC scores with ROC interpretation, precision–recall curves, pseudo-R2 values, and the Hosmer–Lemeshow goodness-of-fit test. In addition to overall accuracy, several studies also examined the models’ ability to differentiate between distressed and non-distressed municipalities.
Prediction Success Rates
The reviewed studies demonstrated consistently strong predictive capability. Reported accuracies include 99% for Trussel and Patrick (2018), 93.91% for Alaminos et al. (2018), and 93.6% for Shiddiqy and Prihatiningtias (2022). Antulov-Fantulin et al. (2021) achieved an AUC of 0.983 using Gradient Boosting Machines, while Trussel and Patrick (2009, 2013) reported 93.4% and 91%, respectively. Models based on discriminant analysis and logit also produced reliable results, for instance Lohk and Siimann (2016) with 88%. Lower but still substantial accuracies were observed in Navarro-Galera et al. (2017) (76.01%) and Cohen et al. (2017) (75%, with 77% predictive power).
Other studies did not report classification accuracy directly but used alternative indicators that supported the robustness of their models. Islamiyah et al. (2022) found that financial independence reduced distress probability by 35.9%, while decentralisation increased it by 40.6%, through logistic regression validated with the Hosmer–Lemeshow test. Gorina et al. (2018a, 2018b) applied rare-event logistic regression and scoring models to identify municipalities with elevated risk levels.
Several studies demonstrated policy relevance by implementing thresholds or categorical frameworks. Kablan (2020) used a Z-Score to group municipalities into safe, grey, and distress zones. Kloha et al. (2005) validated their predictions against actual state interventions, while Zafra-Gómez et al. (2009) and Malinowska-Misiąg (2018) applied percentile rankings and comparative measures to generate financial alerts.
FDP models for municipalities show strong predictive performance, although the choice of metrics varied according to the intended use of the model. Some studies employed classification approach, while others focused on early warning systems or policy thresholds.
Ability to Differentiate (False Positives and Negatives)
The models in the reviewed studies varied in their ability to distinguish between financially distressed and non-distressed municipalities. Several studies presented strong statistical evidence of discriminatory power. Antulov-Fantulin et al. (2021), Trussel and Patrick (2018), and Cohen et al. (2017) reported low false positive rates, high AUC values, and strong cutoff thresholds, with Cohen et al. (2017) achieving 75% detection accuracy. Earlier studies by Trussel and Patrick (2009, 2013) also demonstrated reliable differentiation, although some errors were attributed to revenue volatility. Shiddiqy and Prihatiningtias (2022) recorded solid classification performance but acknowledged limitations in capturing non-financial distress.
Limited transparency was observed in studies such as Alaminos et al. (2018) and Navarro-Galera et al. (2017), which reported high overall accuracy without disclosing the breakdown of misclassifications. Other contributions validated discriminatory capacity through regression or scoring approaches. For instance, García-Sánchez et al. (2012) and Gorina et al. (2018a, 2018b) applied regression-based methods and confirmed strong separation between risk levels, although Gorina et al. (2018a) noted occasional false positives when rare events occurred.
Beyond statistical evidence, some studies assessed differentiation through fiscal behaviour and contextual indicators. Islamiyah et al. (2022), X. Li et al. (2022), Kloha et al. (2005), and López-Hernández et al. (2018) relied on fiscal behaviour patterns to demonstrate model validity, thereby extending insights beyond quantitative metrics. Zafra-Gómez et al. (2009) and Kluza (2017) implemented scoring and financial alert systems, such as the Data Envelopment Analysis (DEA), to stratify municipalities by risk levels, which indicated effective classification even when formal measures of error rates were not provided. Rodríguez-Bolívar et al. (2016) highlighted strong relationships between distress levels, unemployment, and dependency rates, though without presenting explicit classification outputs. Trussel (2020) and Malinowska-Misiąg (2018) contributed through regression analyses and indicator-specific assessments, demonstrating nuanced distinctions in financial health trajectories.
Across the reviewed studies, the ability to differentiate between distressed and non-distressed municipalities was generally strong, although the level of detail reported on misclassification varied.

4.3.2. Conceptual Integrity

Financial distress prediction models were examined for conceptual integrity, focusing on the theoretical foundations and expert contributions that guided their development and implementation.
Theoretical Frameworks
The reviewed models demonstrated reliance on diverse theoretical frameworks, which strengthens their predictive credibility while also reflecting the multidisciplinary nature of municipal FDP research.
Fiscal distress theory featured prominently. Trussel and Patrick (2009, 2013, 2018) built their models on this theory, incorporating financial indicators, survival analysis, and budgetary solvency to design early warning systems. Similarly, Kloha et al. (2005) employed fiscal distress theory to assess short-term liquidity and long-term sustainability, in collaboration with the Michigan Department of Treasury. Other models adopted broader fiscal health perspectives. Zafra-Gómez et al. (2009) and Rodríguez-Bolívar et al. (2016) integrated financial sustainability into their frameworks, while Gorina et al. (2018a, 2018b) included socio-economic conditions, cash flow, and debt burden ratios in their models.
Early warning system approaches expanded further through integration with institutional and corporate finance theories. Antulov-Fantulin et al. (2021) combined socio-demographic and institutional indicators while X. Li et al. (2022) developed a hybrid system that merged statistical modelling, network theory, and machine learning. Cohen et al. (2017) used multi-criteria models and supplementary indicators to enhance early detection of municipal fiscal risks.
Some studies adapted well-known FDP models from the corporate sector. Kablan (2020) employed Altman’s Z-Score, Navarro-Galera et al. (2017) applied Basel II principles, and Kluza (2017) developed a hybrid framework using DEA for fiscal risk evaluation. Comparative approaches were also used by García-Sánchez et al. (2012) to enhance previous fiscal models through relative and absolute measurement integration while Malinowska-Misiąg (2018) tested the compatibility of international FDP models in Poland.
Other studies drew on institutional and organisational theories to capture governance and behavioural dynamics. Islamiyah et al. (2022) applied Agency Theory and Resource Dependence Theory to assess financial independence and decentralisation. Shiddiqy and Prihatiningtias (2022) incorporated Signalling and Legitimacy Theory in the Indonesian context. López-Hernández et al. (2018) employed Public Choice and Organisational Theory to examine fiscal stress and contracting-out decisions under crisis conditions.
Expert Contributions
Several studies demonstrated the role of expert involvement in the design and refinement of municipal FDP models. Cohen et al. (2012) incorporated input from financial and operational specialists to develop a decision model suited to municipal institutions. Cohen et al. (2017) extended this approach by enabling public sector professionals to identify risks in auditing practices before they occurred. Alaminos et al. (2018) introduced a new financial distress indicator within the Spanish legal framework through collaboration with researchers in finance, economics, and computer science.
Collaboration between researchers and policymakers further enhanced the relevance of models. Kloha et al. (2005) co-developed a fiscal distress framework with the Michigan Department of Treasury, while Rodríguez-Bolívar et al. (2016) incorporated macroeconomic and demographic indicators reflecting fiscal policy concerns. Gorina et al. (2018a, 2018b) refined their models using empirical data from government datasets, aligning measurement protocols with policy practice.
Expert input also supported methodological innovation. López-Hernández et al. (2018) combined survival analysis with data on outsourcing behaviour during the Great Recession. Kluza (2017) applied DEA to fiscal risk evaluation, while X. Li et al. (2022) merged statistical modelling, machine learning, and network theory in a hybrid early warning system. Antulov-Fantulin et al. (2021) and Kablan (2020) integrated demographic and institutional data into national frameworks in Croatia, and Turkey, respectively.
Contributions from governance and local expertise were evident in Southeast Asia, where Islamiyah et al. (2022) and Shiddiqy and Prihatiningtias (2022) incorporated regional governance experiences into their models. These adaptations confirmed the importance of tailoring frameworks to specific institutional and cultural contexts.

4.3.3. Practical Ability

The practical ability of a municipal FDP model hinges on its predictive capacity, data accessibility, and its usability by policymakers, auditors, and analysts. This section reports findings from the reviewed studies on data sources, accessibility challenges, historical coverage, and user interaction.
Data Sources and Accessibility Challenges
The reviewed studies drew on a wide range of financial and statistical data. Common sources included municipal financial statements, government audit reports, and national or regional statistical databases. Other studies combined municipal financial records with census and socio-economic data (Gorina et al., 2018b; Cohen et al., 2012). Most studies obtained data from their central government institutions (Trussel & Patrick, 2013; Kloha et al., 2005; X. Li et al., 2022).
Despite utilising data from these institutions, almost all studies reported difficulties in accessing consistent and reliable information. For instance, Cohen et al. (2017) identified gaps arising from uneven compliance with reporting requirements. Rodríguez-Bolívar et al. (2016) noted problems with standardisation and historical coverage, particularly for smaller municipalities. Shiddiqy and Prihatiningtias (2022) reported limited access to municipal debt data, while Islamiyah et al. (2022) pointed to non-standardised reporting practices in Indonesia.
In some studies, researchers supplemented incomplete data with estimation techniques. Gorina et al. (2018a, 2018b) and López-Hernández et al. (2018) employed geolocation methods and proxy variables to address missing fiscal and demographic information. These challenges highlight the uneven quality and accessibility of data across countries, which constrains the broader application of FDP models.
Use of Historical Data
The reviewed studies drew on historical data of varying length. García-Sánchez et al. (2012) employed the longest series, analysing more than 20 years of municipal records to identify fiscal trends and crisis indicators. For instance, Trussel and Patrick (2013) used a 13-year dataset, while several studies relied on ten years of data (Trussel & Patrick, 2012; Gorina et al., 2018a; López-Hernández et al., 2018).
Other studies worked with medium-length datasets. For instance, Malinowska-Misiąg (2018), Zafra-Gómez et al. (2009), Kluza (2017), Shiddiqy and Prihatiningtias (2022), and Trussel and Patrick (2009) used between six and eight years of data. At the shorter end, Alaminos et al. (2018), Navarro-Galera et al. (2017) and Trussel and Patrick (2018) based their models on four-year series, while Cohen et al. (2012) employed two to five years. Although these shorter periods were useful for these studies, they may limit generalisability of these FDP when applied to different timeframes or fiscal contexts.
Ease of Use and Understandability
The reviewed studies varied in ease of use reflecting differences in technical complexity. Some FDP models required advanced knowledge of machine learning and econometric modelling (Antulov-Fantulin et al., 2021; X. Li et al., 2022). As a result, practitioners and policy makers may face challenges interpreting the findings from the advanced models due to their reliance on specialised technical expertise.
A larger group of studies produced models that, while still statistically demanding, were found more suited to financial analysts and policymakers (see, Gorina et al., 2018a; Kluza, 2017; Rodríguez-Bolívar et al., 2016; Shiddiqy & Prihatiningtias, 2022; Trussel & Patrick, 2013). These frameworks required moderate to advanced statistical skills, particularly for interpreting regression outputs, hazard ratios, and pseudo-R2 values.
Several studies provided more accessible approaches. For instance, Kloha et al. (2005) designed composite scoring tool that state officials and local governments could apply without specialist training. Trussel and Patrick (2012), and Zafra-Gómez et al. (2009) also described their models as usable by municipal managers, as they were designed to align with existing budgeting and reporting instruments.

4.3.4. Contextual Fit

This section presents results from the analysis of the FDP models from reviewed studies, focusing on their alignment with municipal contexts, the safeguards they incorporate against manipulation, and the comprehensiveness of their indicators.
Contextual Suitability and Relevance
Most studies described how their FDP models operated within particular municipal frameworks and considered their potential for broader application. In Spain, Alaminos et al. (2018) and López-Hernández et al. (2018) developed models tailored to municipal structures, with possible adaptation across regional or local settings. Cohen et al. (2012) designed tools for municipalities in Greece based on financial models suitable for comparable jurisdictions.
In the United States, Trussel and Patrick (2013) and Kloha et al. (2005) created monitoring instruments for state and local governments, including early warning systems and applications for special districts. Gorina et al. (2018a) also focused on U.S. municipalities, emphasising their use in credit evaluations and fiscal oversight.
In developing country contexts, Islamiyah et al. (2022) and Shiddiqy and Prihatiningtias (2022) produced models for Indonesian local governments that could be adapted to other countries with similar budget systems. Kablan (2020) designed an instrument for Turkish municipalities, while X. Li et al. (2022) developed a model for Chinese local government debt systems. Malinowska-Misiąg (2018) provided evidence that the direct transfer of international models to Polish municipalities posed challenges.
Robustness and Resistance to Manipulation
Several studies addressed the robustness of FDP models by designing safeguards against data manipulation and subjective classification. Cohen et al. (2017) and López-Hernández et al. (2018) enhanced assessment objectivity by relying on official municipal data. Trussel and Patrick (2013) reduced subjectivity through the use of audited financial reports and predefined thresholds to ensure consistency in classification.
Other studies also relied on official or audited sources. Gorina et al. (2018b) used public budgetary data, while Gorina et al. (2018a) incorporated audited reports to improve credibility. Lohk and Siimann (2016) built their model on official data sources, though they noted that reporting inconsistencies remained.
Additional measures included validation and weighting procedures. Antulov-Fantulin et al. (2021) employed model comparison and cross-validation, while X. Li et al. (2022) applied objective weighting criteria to avoid expert-driven bias. Kluza (2017) used Data Envelopment Analysis to strengthen classification reliability, and Cohen et al. (2012) conducted simulation tests to examine performance in different distress scenarios.
Despite these safeguards, some studies still reported vulnerabilities. Kablan (2020) and Malinowska-Misiąg (2018) highlighted the continuing risks posed by inaccuracies in financial reporting.
Comprehensiveness of Indicators
The reviewed models employed a wide range of indicators to capture the complexity of municipal fiscal health. Many studies combined financial ratios with political, socio-economic, and institutional variables. Antulov-Fantulin et al. (2021), X. Li et al. (2022), and Navarro-Galera et al. (2017) integrated demographic, regional, and institutional characteristics alongside financial metrics. Islamiyah et al. (2022) and Shiddiqy and Prihatiningtias (2022) included decentralisation and autonomy measures specific to Indonesian local governments.
Several studies focused on fiscal structure and sustainability. Trussel and Patrick (2009, 2012, 2013, 2018) examined revenue stability, debt burden, and expenditure management. García-Sánchez et al. (2012) and Zafra-Gómez et al. (2009) applied financial flexibility ratios, while Gorina et al. (2018b) applied pension obligations and debt composition in combination with socio-economic indicators in their model.
Other contributions included López-Hernández et al. (2018), who considered long-term health through economic shock resilience, workforce patterns, and investment capacity. Cohen et al. (2012) used revenue and expenditure ratios, while Cohen et al. (2017) extended the model by including ratios on external funding patterns. Kluza (2017) combined solvency and performance measures, whereas Kablan (2020) focused on working capital, retained earnings, and operational indicators.
Models developed by Malinowska-Misiąg (2018) and Rodríguez-Bolívar et al. (2016) prioritised performance, liquidity, and long-term sustainability, with Rodríguez-Bolívar et al. adding service delivery capacity. Kloha et al. (2005), although employing a simpler classification model, used tax base data alongside financial metrics to enhance comprehensiveness.

5. Discussion: Towards a Framework for the Evaluation and Selection of Municipal FDP Models

The results collectively reveal recurring gaps and tensions in existing municipal FDP models. The following section addresses these by proposing a structured, multi-criteria framework for their evaluation and selection. The analysis of the 24 studies confirms that while research on municipal FDP has expanded since 2005, it remains fragmented in methodological approach. Guided by the theoretical lenses underpinning this study the UFE (Patton, 2008), DSR (Hevner et al., 2004), and Institutional Theory (DiMaggio & Powell, 1983), we evaluated model performance, gaps, and practical applicability, and propose a structured framework for FDP model selection. The following subsections interpret these findings through the four thematic domains of evaluation criteria: performance, conceptual integrity, practical applicability, and contextual fit.

5.1. Reconciling Predictive Accuracy with Broader Model Quality

While predictive accuracy dominates FDP literature, it must be balanced with broader quality metrics (Antulov-Fantulin et al., 2021; Trussel & Patrick, 2018). Alaka et al. (2018) and Altman (1968) emphasised that high in-sample accuracy does not necessarily translate into reliable decision tools in practice. Kadkhoda (2024) cautioned that an overemphasis on metrics such as ROC-AUC neglects practical challenges, including the misdirection of resources caused by false positives. In municipal applications, where misclassification can result in the misallocation of scarce resources or delayed interventions (Cohen et al., 2017), the absence of diagnostic transparency is particularly concerning. Comparable debates in corporate bankruptcy prediction similarly underline that accuracy metrics alone are insufficient; interpretability and decision relevance are equally important (Mishra et al., 2021). Moreover, high-performing FDP models such as those based on machine learning (X. Li et al., 2022) often require technical expertise and robust data, which limits usability in resource-constrained municipalities (Chan & Abdul Aziz, 2017). Thus, focusing solely on predictive accuracy in FDP model selection can produce tools that are technically proficient but operationally impractical. For municipalities, especially in developing countries with fragmented data, FDP models that balance predictive strength with usability and transparency are more likely to support financial decisions.

5.2. Theoretical Validity and Conceptual Gaps

The results showed that the majority of the reviewed FDP models lack robust theoretical grounding, reducing their legitimacy and generalizability. Trussel and Patrick (2009) and Gorina et al. (2018a) argued that municipal fiscal health models grounded in theory are better positioned to capture the dynamics of service obligations, intergovernmental transfers, and socio-economic context. The neglect of theoretical foundations in most municipal FDP studies therefore undermines internal validity and limits comparability across jurisdictions. Although a handful of studies incorporated explicit theoretical foundations, these remained fragmented across different traditions. Fiscal distress theory (e.g., Kloha et al., 2005; Trussel & Patrick, 2009, 2013; Trussel, 2020) provided the most direct grounding but was applied inconsistently and rarely extended beyond the U.S. context. Financial sustainability frameworks (Zafra-Gómez et al., 2009; Rodríguez-Bolívar et al., 2016) expanded attention to broader economic drivers, yet their adoption was limited. More recent contributions drew on institutional perspectives (Islamiyah et al., 2022; Shiddiqy & Prihatiningtias, 2022; López-Hernández et al., 2018), highlighting the role of governance and legitimacy in shaping fiscal outcomes. Finally, several studies imported corporate-sector approaches (Kablan, 2020; Kluza, 2017; Navarro-Galera et al., 2017), though these often lacked conceptual compatibility with public-sector realities. The lack of theoretical foundations underscores the absence of a unifying conceptual base for municipal FDP, weakening cross-study comparability and limiting the legitimacy of the FDP models for policy adoption. The Institutional Theory highlights the need for theoretical validity to align models with public sector norms (DiMaggio & Powell, 1983). Without clear frameworks, stakeholder trust and cross-jurisdictional applicability diminish, particularly in diverse governance contexts (Park et al., 2023). This reinforces the need for the structured framework proposed later in this study, which seeks to integrate theoretical validity as a central criterion for evaluating municipal FDP models.

5.3. Contextual Fit: Geographic and Institutional Relevance

The review confirmed that most FDP models were developed in high-income countries and validated against datasets from the United States, Spain, or Italy. This concentration undermines global applicability, given the institutional, legal, and economic differences across municipalities (Maher et al., 2020; Rahayu et al., 2023). For example, Gorina et al. (2018a) demonstrated that U.S. pension obligations are critical indicators of fiscal stress, while such variables are irrelevant in low-income contexts where intergovernmental transfers dominate (Maher et al., 2020). Cohen et al. (2017) likewise noted that municipalities with tourism-based economies require different financial indicators than those reliant on manufacturing. Similarly, Malinowska-Misiąg (2018) and Lukáč et al. (2021) emphasised that Western European based FDP models must be recalibrated for Polish municipalities by incorporating demographic dynamics and the historical context of governance. An explicit assessment of geographic and institutional fit should therefore be mandatory in FDP model selection and adaptation. The Institutional Theory reinforces this need, emphasising the alignment of FDP models with local governance systems which is essential for legitimacy and adoption (DiMaggio & Powell, 1983).

5.4. Operational Considerations: Usability, Data, and Manipulation Risk

Real-world effectiveness of FDP models depends heavily on three critical practical factors including operational usability of tools (Elhoseny et al., 2022), data quality (C. Chen et al., 2020) and risks of manipulation (Ainan et al., 2024). However, the results of the review showed that tools used for FDP have inconsistent usability quality (Shiddiqy & Prihatiningtias, 2022; Islamiyah et al., 2022). Ratio-based models (for instance, Kloha et al., 2005) were found to be user-friendly but lacked depth (Shiddiqy & Prihatiningtias, 2022). In contrast, advanced models such as those by X. Li et al. (2022) and Antulov-Fantulin et al. (2021) delivered excellent accuracy scores but may require technical expertise unavailable in many municipalities. The accessibility of data also emerged as a continual obstacle. Several FDP models depended on financial statements, census data and ministry reports which proved unreliable or incomplete due to inconsistent reporting, particularly in developing contexts (Shiddiqy & Prihatiningtias, 2022; Islamiyah et al., 2022). Robustness against manipulation also varied; with FDP models using audited data (Trussel & Patrick, 2013) outperforming those using self-reported data while those that depended on self-reported data or discretionary thresholds were more vulnerable to manipulation of outcomes (X. Li et al., 2022). In line with the UFE theory, FDP models must not only be statistically sound but also operationally viable in developing countries by relying on accessible data and simplified indicators (Patton, 2008).

5.5. Towards a Multi-Criteria Evaluation Paradigm

The systematic review highlights the urgent need for a multi-criteria evaluation paradigm that extends beyond predictive accuracy to ensure the holistic development and selection of FDP models. No single model addressed all ten identified criteria, with most studies focusing narrowly on accuracy and variable choice (Cohen et al., 2017; Gorina et al., 2018a; Park et al., 2023), while neglecting usability, theoretical grounding, contextual suitability, and practitioner involvement (Maher et al., 2020; Rahayu et al., 2023). Many models borrowed from corporate bankruptcy frameworks such as the Altman Z-score with minimal adaptation to municipal realities, overlooking intergovernmental transfers, statutory obligations, and governance dynamics (Malinowska-Misiąg, 2018; Lukáč et al., 2021). These shortcomings are particularly acute in developing countries, where weak reporting systems, poor data quality, and limited technical capacity hinder the application of complex models (Ritonga & Buanaputra, 2022; Shiddiqy & Prihatiningtias, 2022). Consequently, municipalities require an evaluation approach that balances predictive power with usability and transparency, incorporates public sector-specific variables, and engages practitioners to improve operational feasibility (Padovani et al., 2021; Reilly et al., 2023). This need motivates the framework outlined in the next subsection, which operationalises the identified criteria through a context-sensitive rubric and decision tree.

5.5.1. Assessment Checklist for Model Evaluation

To operationalise the framework, a structured scoring rubric was developed and is presented in Appendix C. The rubric provides a transparent and repeatable method for assessing FDP models against the ten evaluation criteria. Each criterion is scored on a three-point scale (0–2), where 0 denotes absence, 1 indicates presence without proof, and 2 reflects presence supported by evidence such as validation tests or documented application.
Recognising that municipalities differ in their institutional capacity and data environments, the rubric also incorporates context-specific weightings. These weights ensure that criteria most critical to a particular setting, such as Ease of Use and Data Accessibility in low-capacity municipalities, or Predictive Accuracy and Robustness in data-rich contexts, are given proportionally greater influence in the overall assessment. The weighting scheme follows principles of multi-criteria decision analysis (Belton & Stewart, 2012) and reflects the theoretical foundations of Utilisation-Focused Evaluation (Patton, 2008), Design Science Research (Hevner et al., 2004), and Institutional Theory (DiMaggio & Powell, 1983). Weights should be validated with a practitioner panel (workshop/Delphi) to support adoption.
The resulting composite score, calculated as the weighted sum of individual criterion scores, enables municipalities to compare alternative models systematically while tailoring the evaluation to their own circumstances. Appendix C therefore provides the operational link between the framework’s conceptual foundations and its practical application.
To ensure consistent application of the rubric, the following step-by-step protocol is proposed:
  • Gather model details and evidence. Collect information on predictive performance, theoretical grounding, and contextual features from published studies or pilot applications.
  • Assign scores using the rubric. Rate each criterion on the 0–2 scale. Evidence examples include validation tests (e.g., AUC > 0.8, cross-validation), government adoption, or expert endorsement.
  • Determine weights. Conduct a small Delphi round (3–5 experts) to align weights with municipal capacity. Round 1: independent ranking; Round 2: group discussion; Round 3: consensus.
  • Calculate composite score. Multiply each criterion score by its assigned weight and sum across all ten criteria. Apply the tie-break rule where needed.
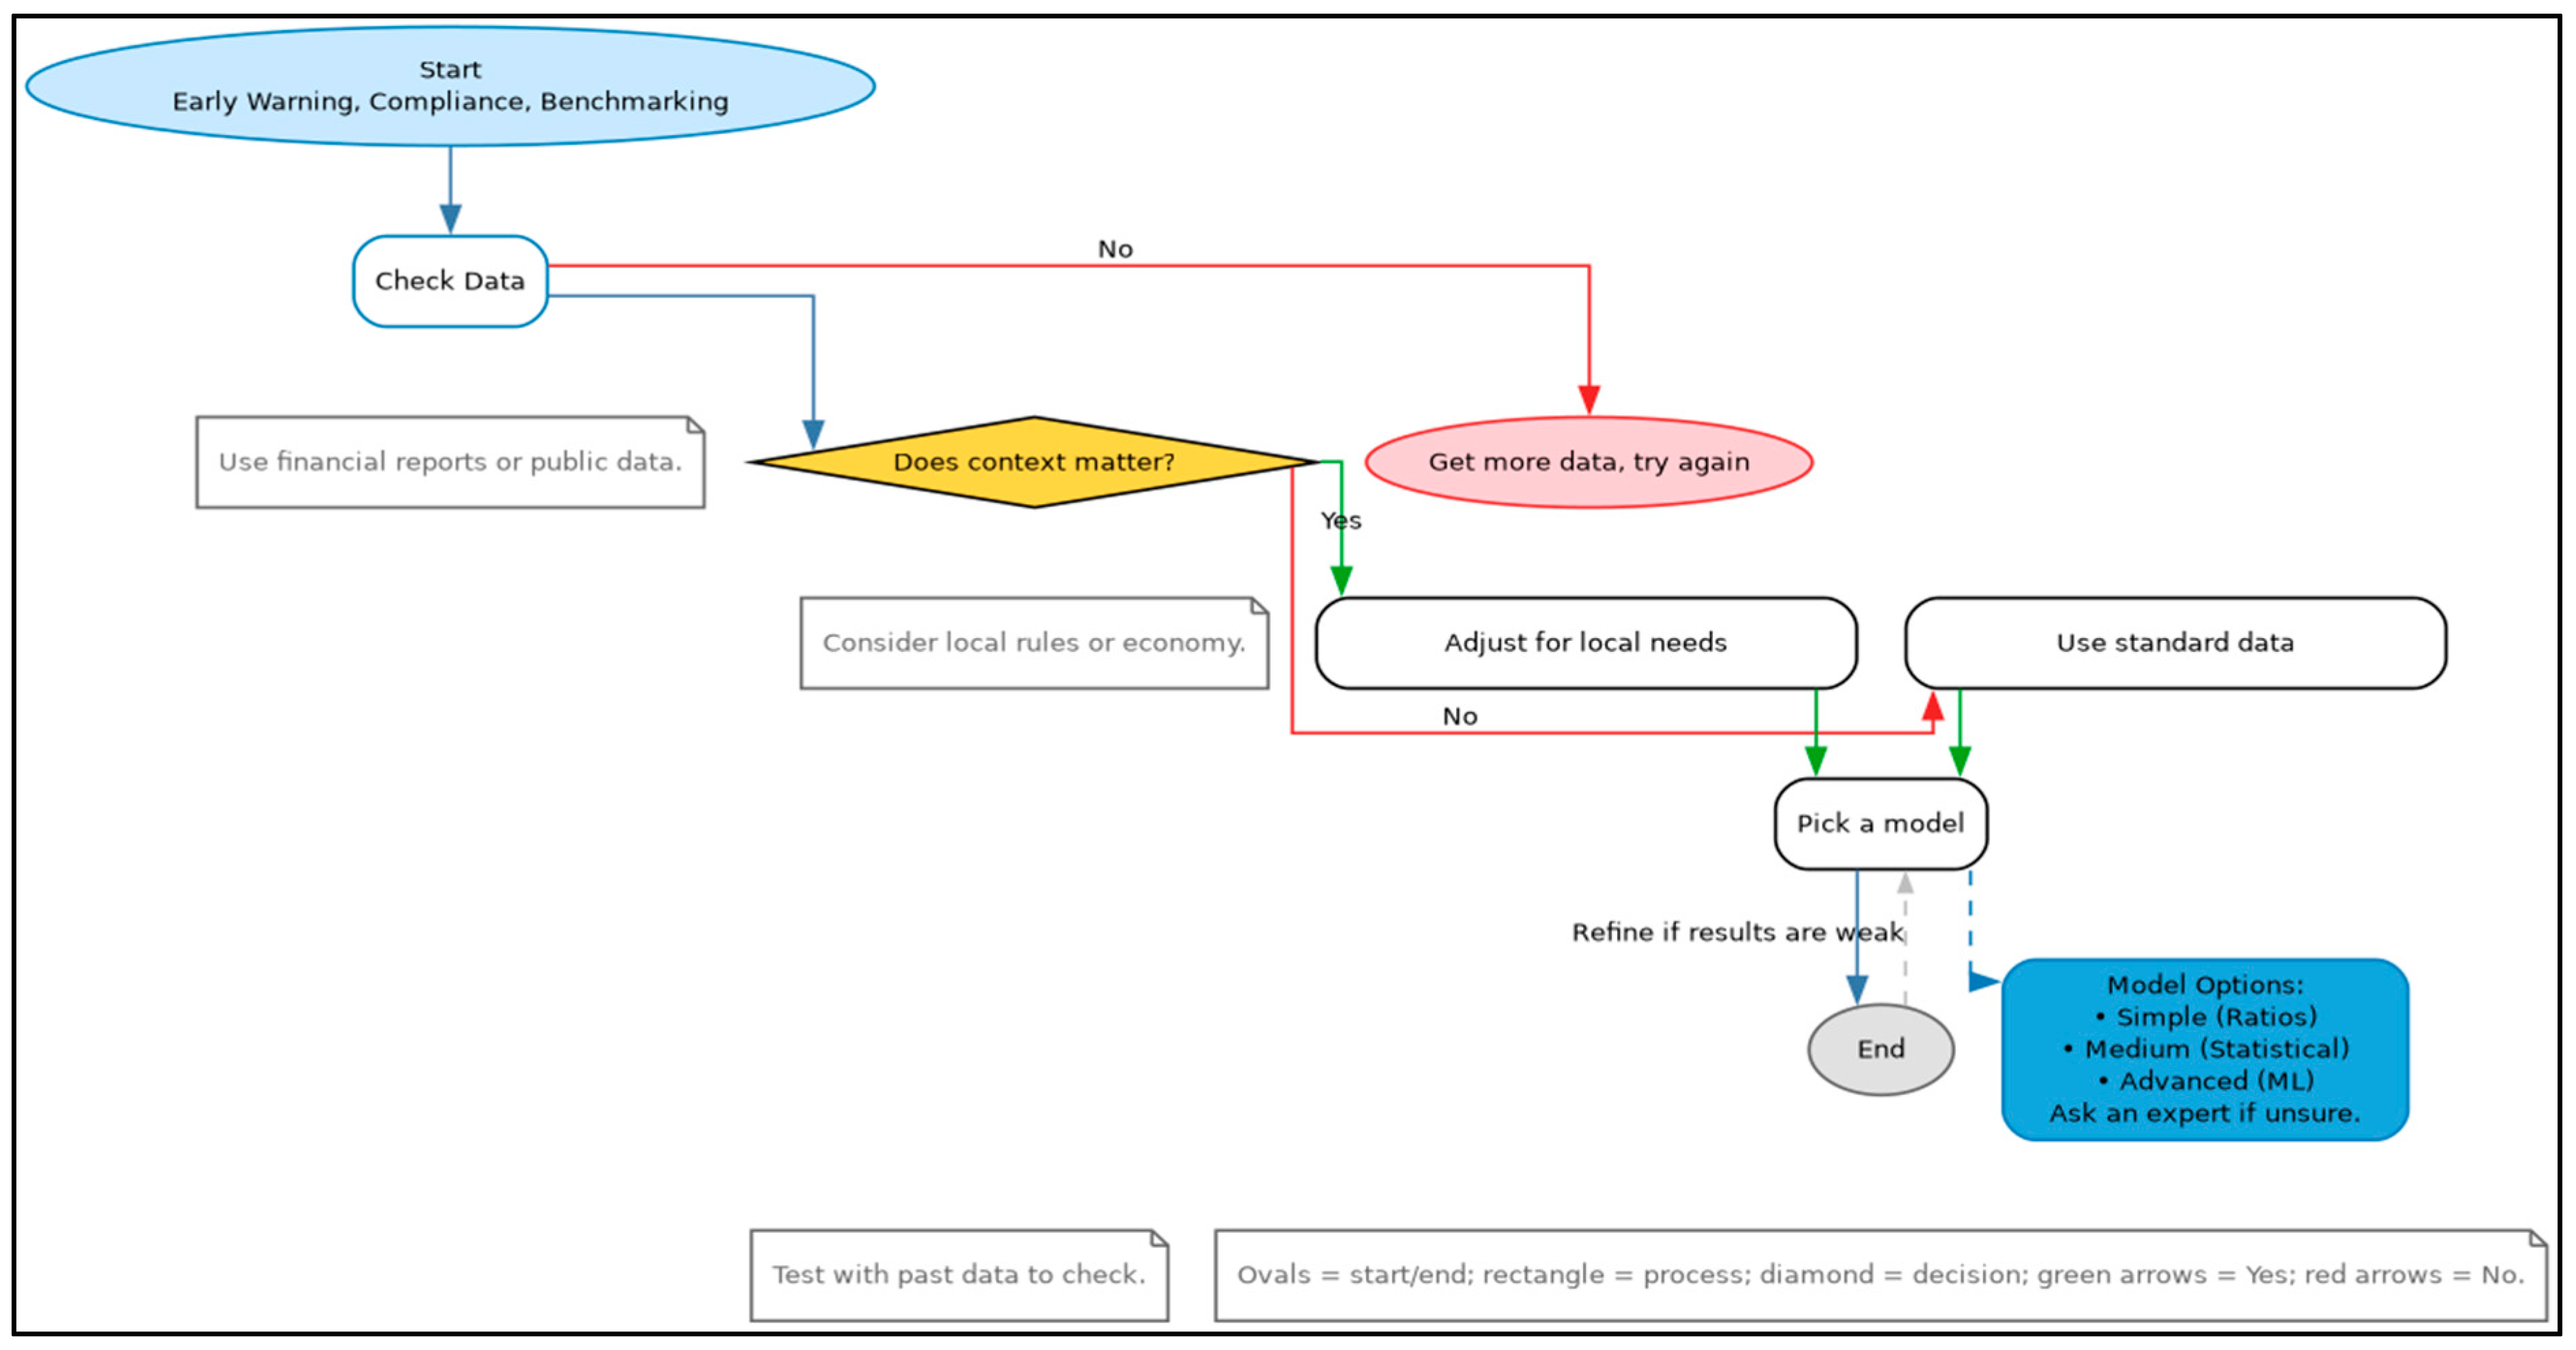
  • Interpret results. Map the composite score to the decision tree (Figure 7) or directly compare models, as shown in Table 4, to identify the most suitable option for the municipal context.
To demonstrate how the rubric in Appendix C functions in practice, two hypothetical models were scored using the 0–2 scale. Model A scored highly on Ease of Use and Data Accessibility but only moderately on Predictive Accuracy and Robustness. By contrast, Model B had weaker usability but stronger predictive performance and robustness. Composite scores were calculated by multiplying each score by the relevant weights and summing the results, following the formula:
C o m p o s i t e   S c o r e = i = s i × w i
where si is the score (0–2) for criterion i and wi is the assigned weight.
This worked example as per Table 4 illustrates how the same raw scores can lead to different model selections depending on municipal capacity, underscoring the flexibility of the framework.
Scenario 1 (Low-capacity municipality): Using the low-capacity weighting scheme [P1 = 0.10, P2 = 0.05, CI1 = 0.05, CI2 = 0.05, PA1 = 0.20, PA2 = 0.15, PA3 = 0.20, CF1 = 0.10, CF2 = 0.05, CF3 = 0.05], Model A achieved a composite score of 1.60, while Model B achieved 1.40. Model A is therefore preferred, as its stronger performance on Ease of Use (PA3) and Data Accessibility (PA1) aligns more closely with the needs of a resource-constrained municipality.
Scenario 2 (High-capacity municipality): Using the high-capacity weighting scheme [P1 = 0.25, P2 = 0.15, CI1 = 0.10, CI2 = 0.05, PA1 = 0.05, PA2 = 0.05, PA3 = 0.05, CF1 = 0.15, CF2 = 0.10, CF3 = 0.05], Model B achieved a composite score of 1.75, compared to 1.25 for Model A. Model B is therefore preferred, reflecting the ability of technically advanced municipalities to prioritise Predictive Accuracy (P1), Ability to Differentiate (P2), and Robustness (CF1).
Tie-break rule: In the rare event of equal composite scores, the framework recommends selecting the model with the higher score on the most heavily weighted criterion. If equality persists, decision-makers should consider secondary factors such as training burden, data requirements, or conduct a short pilot before scaling.

5.5.2. Design Guide for Model Development

The framework also serves as a design guide for developing new financial distress prediction (FDP) models. A step-by-step decision tree is presented in Figure 7, which translates the ten evaluation criteria into sequential diagnostic questions. The tree begins with institutional and data constraints, progresses to local contextual considerations, and concludes with model selection options. This structure bridges theoretical evaluation metrics with real-world decision-making by helping practitioners navigate trade-offs in data availability, technical skills, and contextual relevance.
The decision tree starts with a review of available data. If audited financial statements or reliable financial reports are missing, the process advises municipalities to first strengthen their data systems before selecting a model. When data are available, the tree considers whether local rules, institutional factors, or economic conditions require adjustments. If context matters, data should be adapted for local needs before moving to model selection; if not, standard data can be used.
At the model selection stage, users are guided to choose between simple ratio-based models, medium-complexity statistical approaches, or advanced machine learning techniques, depending on their institutional and technical capacity. A built-in refinement loop ensures that results can be revisited and improved if predictive performance is weak.
Worked path example:
  • If audited years < 3 or data completeness < 80%: adopt a transparent baseline model using a small indicator set and simple thresholds, documenting assumptions and handling of missing data.
  • If audited years ≥ 3 and completeness ≥ 80% but technical capacity is limited: use logistic regression with appropriate constraints, ensuring diagnostics and calibration are reported.
  • If audited years ≥ 3, completeness ≥ 85% and capacity is adequate: apply more advanced techniques such as gradient boosting or support vector machines, with calibration and explainability tools, while retaining a logistic regression benchmark.
The decision tree reflects the theoretical foundations of the framework. Branches that emphasise usability and weightings are consistent with Utilisation-Focused Evaluation (Patton, 2008). Model calibration and design constraints draw on Design Science Research (Hevner et al., 2004). Contextual adjustments for local rules and institutional realities align with the Institutional Theory (DiMaggio & Powell, 1983).

5.5.3. Application of the Framework in Practice

The framework can be applied both ex ante, to guide the selection of an appropriate model, and ex post, to evaluate existing tools. It is relevant for oversight institutions at national or provincial level, as well as for researchers seeking to structure comparative reviews or design new models. By applying the ten criteria in context, users improve the precision, transparency, and policy utility of financial distress prediction (FDP) models.
Figure 7 provides a step-by-step decision tree that guides practitioners through diagnostic questions on data availability, contextual constraints, and technical capacity. Once these pathways are navigated, Table 5 supports the final decision by comparing representative model types against the ten evaluation criteria. Together, the decision tree and decision matrix operationalise the framework by showing both how to choose (process) and what to compare (options).
To demonstrate this in practice, three illustrative cases highlight how municipalities with different capacities might apply the framework:
  • Small developing municipality: Prioritises data accessibility and ease of use (PA1, PA3). The decision tree guides the user to ratio-based models, with Table 5 showing examples such as Kloha et al. (2005).
  • Medium-sized municipality: Balances predictive accuracy and robustness (P1, CF1). The decision tree points to medium-complexity statistical approaches, with Table 5 indicating logistic regression as a suitable option (see, Trussel & Patrick, 2018; Gorina et al., 2018b).
  • Large developed: Emphasises predictive accuracy and comprehensiveness (P1, CF3). The decision tree directs towards advanced techniques, while Table 5 highlights machine learning hybrids (see, X. Li et al., 2022; Antulov-Fantulin et al., 2021).

5.6. Conclusions and Implications

This systematic review advances the research of financial distress prediction for local governments by identifying the ten criteria for evaluation and selection of FDP models, by proposing a multi-criteria framework that is adaptable to diverse governance contexts, addressing gaps in developing economies (Islamiyah et al., 2022), and by operationalising the selection of FDP models by providing a decision tree and matrix to bridge academic theory and public practice (Hevner et al., 2004). These contributions enhance data-driven fiscal governance in local governments (Cohen et al., 2012; Alaminos et al., 2018).
Despite the careful design of this review, some limitations remain. Publication bias may have excluded insights from government reports and case studies; cross-country variation in financial reporting reduces comparability; incomplete diagnostics limited evaluation of predictive performance; and the exclusion of studies that focused only on fiscal condition narrows the scope of findings. Furthermore, the proposed framework has not yet been validated through a case application or practitioner testing. These constraints should be recognised when interpreting the results.
The proposed framework carries important implications for practice and policy. Practitioners and policymakers should assess FDP models not only on predictive accuracy but also on usability, contextual fit, and robustness. Developing countries require FDP models adapted to their data and regulatory environments. Auditors and oversight bodies should also be involved in validation of the FDP models to enhance both legitimacy and applicability.
Future research, should strengthen the theoretical foundations of FDP models in the public sector, expand empirical testing in developing economies, and integrate expert judgment with data-driven methods to improve interpretability and predictive power. Comparative studies applying the ten criteria across diverse settings are especially needed to identify adaptable best practices and to test the proposed framework in different national contexts. Future research should also include pilot applications with municipalities to validate the proposed framework in real-world decision-making environments.

Author Contributions

Conceptualization, N.E.R., B.C.N. and F.R.M.; methodology, N.E.R. and F.R.M.; software, N.E.R.; validation, N.E.R., B.C.N. and F.R.M.; formal analysis, N.E.R., B.C.N. and F.R.M.; resources, B.C.N.; data curation, N.E.R., B.C.N. and F.R.M.; writing—original draft preparation, N.E.R.; writing—review and editing, B.C.N. and F.R.M.; visualization, N.E.R.; supervision, B.C.N. and F.R.M.; project administration, N.E.R. All authors have read and agreed to the published version of the manuscript.

Funding

This research received no external funding.

Institutional Review Board Statement

Not applicable.

Informed Consent Statement

Not applicable.

Data Availability Statement

The dataset generated and analysed during this systematic review is publicly available in the Mendeley Data repository. It includes structured information on study characteristics, model types, indicators, methodologies, theoretical frameworks, and evaluation criteria for the 24 studies reviewed. The link is https://doi.org/10.17632/s3jwmnjm8t.1.

Conflicts of Interest

The authors declare no conflicts of interest.

Appendix A. Search Strategy

Table A1. Databases searched and full query strings.
DatabaseSearch StringInitial SearchInitial
Results
Follow-Up SearchFollow-Up Results
Google Scholar(“Municipality” OR “municipal” OR “local governments” OR “councils”) AND (“Financial distress” OR “Financial crisis” OR “Financial strain” OR “Financial condition”) AND (“Prediction” OR “Forecasting” OR “Assessment” OR “Modelling” OR “Estimation” OR “Measurement”)10 October 2024106
papers
10 March
2025
91 papers
Web of Science(“Municipalities” OR “local governments” OR “councils”) AND (“Financial distress” OR “Fiscal strain” OR “Financial condition”) AND (“Prediction” OR “Modelling” OR “Measurement”)10 October 202414
papers
10 March
2025
0 papers
ScienceDirect(“Municipalities” OR “local governments” OR “councils”) AND (“Financial distress” OR “Fiscal strain” OR “Financial condition”) AND (“Prediction” OR “Modelling” OR “Measurement”)10 October 202434
papers
10 March
2025
45 papers
Scopus(“Municipality” OR “municipal” OR “local governments” OR “councils”) AND (“Financial distress” OR “Financial crisis” OR “Financial strain” OR “Financial condition”) AND (“Prediction” OR “Forecasting” OR “Assessment” OR “Modelling” OR “Estimation” OR “Measurement”)10 October 2024112
papers
10 March
2025
16 papers
EBSCOHOST(“Municipalities” OR “local governments” OR “councils”) AND (“Financial distress” OR “Fiscal strain” OR “Financial condition”) AND (“Prediction” OR “Modelling” OR “Measurement”)10 October 202412
Papers
10 March
2025
0 papers
ProQuest(“Municipalities” OR “local governments” OR “councils”) AND (“Financial distress” OR “Fiscal strain” OR “Financial condition”) AND (“Prediction” OR “Modelling” OR “Measurement”)10 October 2024209
papers
10 March
2025
93 papers

Appendix B. An Overview Summary of the Reviewed Studies

Table A2. Overview of reviewed municipal financial distress prediction studies.
No.AuthorsCountryFDP Tool TypeSummary
1Kloha et al. (2005)United StatesComposite Fiscal
Distress Scale
Developed a 10-point fiscal distress scale using demographic and financial indicators. Validated with historical distress cases.
2Trussel and Patrick (2009)United StatesLogistic RegressionUsed municipal data to predict fiscal distress from sustained operating deficits. Achieved up to 91% accuracy.
3Zafra-Gómez et al. (2009)SpainFinancial Ratio
Analysis, Cluster
Analysis
Combined financial ratio and cluster analysis to develop a financial condition index and classify municipalities by distress risk.
4Cohen et al. (2012)GreeceMulticriteria
Decision Analysis
Applied SMAA with disaggregation to assess viability in Greek municipalities using accrual financial data. Validated with ROC and AUROC.
5García-Sánchez et al. (2012)SpainLogistic RegressionUsed panel data and logistic regression to classify municipalities over 20 years. Tested predictive accuracy using Wilcoxon test.
6Trussel and Patrick (2012)United StatesSurvival Analysis (Cox Regression)Used Cox regression to model fiscal distress likelihood. Evaluated via hazard ratios and baseline hazard on over 25,000 observations.
7Trussel and Patrick (2013)United StatesSurvival Analysis (Cox Regression)Extended Cox regression to special district governments. Model achieved up to 93.4% accuracy and was validated with a holdout sample.
8Lohk and Siimann (2016)EstoniaDiscriminant Analysis, Logit RegressionDeveloped predictive models for Estonian municipalities. Achieved 88% (Discriminant) and 87% (Logit) classification accuracy.
9Rodríguez-Bolívar et al. (2016)SpainPanel Data
Regression
Used pooled OLS and fixed-effects to assess financial sustainability. Validated with R2, significance levels, and Wald tests.
10Cohen et al. (2017)ItalyLogistic
Regression
Used financial ratios and logistic regression to classify municipalities pre-bankruptcy. Achieved 77% predictive power.
11Gorina et al. (2018b)United StatesLogistic
Regression
Developed action-based model of fiscal distress using financial and socio-economic factors. Validated using pseudo R2 and parameter estimates.
12Kluza (2017)PolandRatio Analysis, DEACombined corporate finance ratios with DEA to evaluate
fiscal efficiency. Validated using DEA scores and debt limit correlations.
13López-Hernández et al. (2018)SpainSurvival
Analysis,
Hazard
Modeling
Used dynamic survival analysis to study effects of fiscal stress on contracting out. Identified key hazard ratios.
14Navarro-Galera et al. (2017)SpainLogistic
Regression
Used random-effects logistic regression to predict default risk. Assessed via odds ratios, Wald tests, and ROC curves.
15Alaminos et al. (2018)SpainMachine
Learning
Used classifiers like Decision Trees and Deep Belief Networks to predict fiscal distress. Evaluated with classification accuracy and RMSE.
16Gorina et al. (2018a)United StatesLogistic
Regression
Applied relogit model to national sample predicting defaults. Validated with pseudo R2, likelihood ratios, and robust errors.
17Malinowska-Misiąg (2018)PolandRatio Analysis, Relative
Ranking
Assessed applicability of foreign models to Polish municipalities using ranking models and quartile classification.
18Trussel and Patrick (2018)United StatesLogistic
Regression
Ranked financial risk using logistic regression. Achieved up to 99% accuracy across 10,248 municipality-years.
19Kablan (2020)TurkeyAltman’s
Z-Score
Applied Altman Z-Score model to Turkish municipalities, creating risk maps and categorising municipalities into distress zones.
20Trussel (2020)United StatesLogistic
Regression
Used logistic regression with financial and socio-economic data to predict operating deficits. Validated using pseudo R2.
21Antulov-Fantulin et al. (2021)ItalyMachine learningUsed GBM, RF, LASSO, and Neural Networks to predict bankruptcy. Validated with ROC, PRC, and AUC metrics.
22Islamiyah et al. (2022)IndonesiaLogistic
Regression
Analysed financial independence and decentralisation effects using logistic regression. Evaluated with Hosmer-Lemeshow test.
23X. Li et al. (2022)ChinaMachine LearningDeveloped EWS using Markov-switching, SVM, GBM, RF, and network analysis. Assessed with ROC-AUC and switching probabilities.
24Shiddiqy and Prihatiningtias (2022)IndonesiaLogistic RegressionUsed binary logistic regression on financial ratios to classify distress in East Java. Achieved 93.6% classification accuracy.

Appendix C. Scoring Rubric and Application

Table A3. Scoring rubric for evaluating municipal FDP tools.
CriterionShort CodeScoring (0–2)Example WeightingIllustrative Scenario
Predictive AccuracyP10 = absent; 1 = descriptive only; 2 = predictive tests reported0.15–0.25Weighted higher in data-rich municipalities with technical expertise.
Ability to Differentiate (False Positives & Negatives)P20 = absent; 1 = implied only; 2 = clear false positive/negative rates0.10Ensures the model can distinguish distressed vs. healthy municipalities.
Theoretical ValidityCI 10 = absent; 1 = weak/implicit; 2 = grounded in theory0.10Adds credibility by linking to established financial/economic theories.
Expert InvolvementCI 20 = absent; 1 = ad hoc; 2 = systematic inclusion0.10Higher weight in politically sensitive contexts to secure legitimacy.
Data AccessibilityPA 10 = absent; 1 = present, limited; 2 = present, open/easy0.20 Prioritised where financial/operational data are scarce or fragmented.
Use of Historical DataPA 20 = absent; 1 = short series (<5 years); 2 = long series (≥10 years)0.10Weighted more in contexts where past fiscal trends are critical.
Ease of Use/UnderstandabilityPA 30 = absent; 1 = present, unclear; 2 = present with clear steps0.20Favoured in low-capacity municipalities with limited staff skills.
Robustness/Resistance to ManipulationCF 10 = absent; 1 = claimed only; 2 = tested/validated0.15Weighted higher where manipulation risk or poor data quality is high.
Comprehensiveness of IndicatorsCF 20 = financial ratios only; 1 = some socio-economic; 2 = broad (financial, socio-economic, governance)0.10–0.15Prioritised in municipalities with diverse socio-economic pressures.
Contextual Suitability/RelevanceCF 30 = absent; 1 = partially adapted; 2 = fully adapted to local context0.10–0.20Especially important when applying models developed in other countries.
To calculate the Composite score: Multiply each criterion’s score by its weight, then sum the results. Report alongside a short narrative note (for example, “High score in usability suits our limited staff, though predictive accuracy was moderate”).

References

  1. Ainan, U. H., Por, L. Y., Chen, Y., Yang, J., & Ku, C. S. (2024). Advancing bankruptcy forecasting with hybrid machine learning techniques: Insights from an unbalanced Polish dataset. IEEE Access, 12, 9369–9381. [Google Scholar] [CrossRef]
  2. Alaka, H. A., Oyedele, L. O., Owolabi, H. A., Kumar, V., Ajayi, S. O., Akinade, O. O., & Bilal, M. (2018). Systematic review of bankruptcy prediction models: Towards a framework for tool selection. Expert Systems with Applications, 94, 164–184. [Google Scholar] [CrossRef]
  3. Alaminos, D., Fernández, S., García, F., & Fernández, M. (2018). Data mining for municipal financial distress prediction. In P. Perner (Ed.), Advances in data mining: Applications and theoretical aspects (Vol. 10933, pp. 296–308). Springer. Lecture Notes in Computer Science. [Google Scholar] [CrossRef]
  4. Altman, E. I. (1968). Financial ratios, discriminant analysis and the prediction of corporate bankruptcy. Journal of Finance, 23(4), 589–609. [Google Scholar] [CrossRef]
  5. Antulov-Fantulin, N., Lagravinese, R., & Resce, G. (2021). Predicting bankruptcy of local government: A machine learning approach. Journal of Economic Behavior & Organization, 183, 681–699. [Google Scholar] [CrossRef]
  6. Aoki, N., Tatsumi, T., Naruse, G., & Maeda, K. (2024). Explainable AI for government: Does the type of explanation matter to the accuracy, fairness, and trustworthiness of an algorithmic decision as perceived by those who are affected? Government Information Quarterly, 41(4), 101965. [Google Scholar] [CrossRef]
  7. Belton, V., & Stewart, T. (2012). Multiple criteria decision analysis: An integrated approach. Springer Science & Business Media. [Google Scholar]
  8. Brown, K. W. (1993). The 10 point test of financial condition: Toward an easy to use assessment tool for smaller cities. Government Finance Review, 9(6), 21–26. [Google Scholar]
  9. Brusca, I., Rossi, F. M., & Aversano, N. (2015). Drivers for the financial condition of local government: A comparative study between Italy and Spain. Lex Localis, 13(2), 161–184. [Google Scholar] [CrossRef] [PubMed]
  10. Chan, T. K., & Abdul Aziz, A. R. S. (2017). Financial performance and operating strategies of Malaysian property development companies during the global financial crisis. Journal of Financial Management of Property and Construction, 22(2), 174–191. [Google Scholar] [CrossRef]
  11. Chen, C., Chen, C., & Lien, D. (2020). Financial distress prediction model: The effects of corporate governance indicators. Journal of Forecasting, 39(8), 1238–1252. [Google Scholar] [CrossRef]
  12. Chen, W., Yang, K., Yu, Z., Shi, Y., & Chen, C. L. P. (2024). A survey on imbalanced learning: Latest research, applications and future directions. Artificial Intelligence Review, 57, 137. [Google Scholar] [CrossRef]
  13. Chung, I. H., & Williams, D. (2020). Local governments’ responses to the fiscal stress label: The case of New York. Local Government Studies, 47(5), 808–835. [Google Scholar] [CrossRef]
  14. Clark, W. R., Clark, L. A., Raffo, D. M., & Williams, R. I. (2021). Extending Fisch and Block’s tips for a systematic review in management and business literature. Management Review Quarterly, 71, 215–231. [Google Scholar] [CrossRef]
  15. Cohen, S., Costanzo, A., & Manes Rossi, F. (2017). Auditors and early signals of financial distress in local governments. Managerial Auditing Journal, 32(3), 234–250. [Google Scholar] [CrossRef]
  16. Cohen, S., Doumpos, M., Neofytou, E., & Zopounidis, C. (2012). Assessing financial distress where bankruptcy is not an option: An alternative approach for local municipalities. European Journal of Operational Research, 218(1), 270–279. [Google Scholar] [CrossRef]
  17. Darmawati, D., Mediawati, E., & Rasyid, S. (2024). New trends and directions in local government finance research: A bibliometric analysis. Public and Municipal Finance, 13(1), 137–149. [Google Scholar] [CrossRef]
  18. Dasilas, A., & Rigani, A. (2024). Machine learning techniques in bankruptcy prediction: A systematic literature review. Expert Systems with Applications, 255, 124761. [Google Scholar] [CrossRef]
  19. Delfos, J., Zuiderwijk, A. M. G., & Van Cranenburgh, S. (2024). Integral system safety for machine learning in the public sector: An empirical account. Government Information Quarterly, 41(3), 101963. [Google Scholar] [CrossRef]
  20. DiMaggio, P. J., & Powell, W. W. (1983). The iron cage revisited: Institutional isomorphism and collective rationality in organizational fields. American Sociological Review, 48(2), 147–160. [Google Scholar] [CrossRef]
  21. Elhoseny, M., Metawa, N., Sztano, G., & El-Hasnony, I. M. (2022). Deep learning-based model for financial distress prediction. Annals of Operations Research, 345(2), 885–907. [Google Scholar] [CrossRef]
  22. Galán, J. (2021). CREWS: A CAMELS-based early warning system of systemic risk in the banking sector (Occasional Paper No. 2132). Banco de España. [Google Scholar]
  23. Galiński, P. (2023). Determinants of the financial liquidity of local governments: Empirical evidence from Poland. Argumenta Oeconomica, 2(51), 329–351. [Google Scholar] [CrossRef]
  24. García-Sánchez, I. M., Cuadrado Ballesteros, B., Frías Aceituno, J. V., & Mordan, N. (2012). A new predictor of local financial distress. International Journal of Public Administration, 35(11), 739–748. [Google Scholar] [CrossRef]
  25. Gorina, E., Joffe, M., & Maher, C. (2018a). Using fiscal ratios to predict local fiscal distress. SSRN Electronic Journal. [Google Scholar] [CrossRef]
  26. Gorina, E., Maher, C., & Joffe, M. (2018b). Local fiscal distress: Measurement and prediction. Public Budgeting & Finance, 38(1), 72–94. [Google Scholar] [CrossRef]
  27. Groves, S. M., Godsey, W. M., & Shulman, M. A. (1981). Financial indicators for local government. Public Budgeting & Finance, 1(2), 5–19. [Google Scholar] [CrossRef]
  28. Gusenbauer, M., & Haddaway, N. R. (2020). Which academic search systems are suitable for systematic reviews or meta-analyses? Evaluating retrieval qualities of Google Scholar, PubMed, and 26 other resources. Research Synthesis Methods, 11(2), 181–217. [Google Scholar] [CrossRef]
  29. Hevner, A. R., March, S. T., Park, J., & Ram, S. (2004). Design science in information systems research. MIS Quarterly, 28(1), 75–105. [Google Scholar] [CrossRef]
  30. Iacuzzi, S. (2022). An appraisal of financial indicators for local government: A structured literature review. Journal of Public Budgeting, Accounting & Financial Management, 34(6), 69–94. [Google Scholar] [CrossRef]
  31. Islamiyah, M. T., Ratifah, I., & Firdaus, F. (2022). Do financial ratio predicting financial distress in local government? Jurnal Riset Bisnis dan Manajemen, 15(1), 56–60. [Google Scholar] [CrossRef]
  32. Jones, S., & Walker, R. G. (2007). Explanators of local government distress. Abacus, 43(3), 396–418. [Google Scholar] [CrossRef]
  33. Kablan, A. (2020). Altman’s Z”-score to predict accounting-based financial distress of municipalities: Bankruptcy risk map for metropolitan municipalities in Turkey. İşletme Araştırmaları Dergisi, 12(1), 498–509. [Google Scholar] [CrossRef]
  34. Kadkhoda, S. (2024). A hybrid network analysis and machine learning model for enhanced financial distress prediction. IEEE Access, 12, 52759–52777. [Google Scholar] [CrossRef]
  35. Kloha, P., Weissert, C. S., & Kleine, R. (2005). Developing and testing a composite model to predict local fiscal distress. Public Administration Review, 65(3), 313–323. [Google Scholar] [CrossRef]
  36. Kluza, K. (2017). Risk assessment of the local government sector based on the ratio analysis and the DEA method: Evidence from Poland. Eurasian Economic Review, 7(3), 329–351. [Google Scholar] [CrossRef]
  37. Kolaski, K., Romeiser Logan, L., & Ioannidis, J. P. A. (2023). Guidance to best tools and practices for systematic reviews. Journal of Pediatric Rehabilitation Medicine, 16(2), 241–273. [Google Scholar] [CrossRef]
  38. Kooij, J., & Groot, T. (2021). Towards a comprehensive assessment system of local government fiscal health. Maandblad voor Accountancy en Bedrijfseconomie, 95(7/8), 233–244. [Google Scholar] [CrossRef]
  39. Leiser, S., & Mills, S. (2019). Local government fiscal health: Comparing self-assessments to conventional measures. Public Budgeting & Finance, 39(3), 75–96. [Google Scholar] [CrossRef]
  40. Li, H., Sun, T., & Zhang, J. (2024). Prediction of corporate financial distress based on corporate social responsibility: New evidence from DANP, VWP and MEOWA weights methodologies. Accounting & Finance, 64(5), 4537–4565. [Google Scholar] [CrossRef]
  41. Li, X., Ge, X., & Chen, C. (2022). Several explorations on how to construct an early warning system for local government debt risk in China. PLoS ONE, 17(2), e0263391. [Google Scholar] [CrossRef]
  42. Liu, L., Chen, C., & Wang, B. (2022). Predicting financial crises with machine learning methods. Journal of Forecasting, 41(5), 871–910. [Google Scholar] [CrossRef]
  43. Lohk, P., & Siimann, P. (2016, December 8–9). Predicting the risk of encountering financial difficulties by the example of Estonian municipalities [Paper presentation]. 5th International Conference on Accounting, Auditing, and Taxation (ICAAT) (pp. 297–306), Tallinn, Estonia. [Google Scholar] [CrossRef]
  44. López-Hernández, A. M., Zafra-Gómez, J. L., Plata-Díaz, A. M., & de la Higuera-Molina, E. J. (2018). Modeling fiscal stress and contracting out in local government: The influence of time, financial condition, and the Great Recession. American Review of Public Administration, 48(6), 565–583. [Google Scholar] [CrossRef]
  45. Lukáč, J., Teplická, K., Čulková, K., & Hrehová, D. (2021). Evaluation of the financial performance of the municipalities in slovakia in the context of multidimensional statistics. Journal of Risk and Financial Management, 14(12), 570. [Google Scholar] [CrossRef]
  46. Lunny, C., Brennan, S. E., McDonald, S., & McKenzie, J. E. (2018). Toward a comprehensive evidence map of overview of systematic review methods: Paper 2—Risk of bias assessment; synthesis, presentation and summary of the findings; and assessment of the certainty of the evidence. Systematic Reviews, 7, 159. [Google Scholar] [CrossRef]
  47. Maher, C. S., Oh, J. W., & Liao, W. J. (2020). Assessing fiscal distress in small county governments. Journal of Public Budgeting, Accounting & Financial Management, 32(4), 691–711. [Google Scholar] [CrossRef]
  48. Malinowska-Misiąg, E. (2018). Possibilities of using in Poland the foreign models of predicting the fiscal distress in local government units. Optimum Economic Studies, 93(3), 115–125. [Google Scholar] [CrossRef]
  49. Matenda, F. R., Sibanda, M., Chikodza, E., & Gumbo, V. (2021). Bankruptcy prediction for private firms in developing economies: A scoping review and guidance for future research. Management Review Quarterly, 72(4), 927–966. [Google Scholar] [CrossRef]
  50. McDonald, B. D., III, & Maher, C. S. (2020). Do we really need another municipal fiscal health analysis? Assessing the effectiveness of fiscal health systems. Public Finance Management, 19(4), 270–296. [Google Scholar] [CrossRef]
  51. Mishra, N., Ashok, S., & Tandon, D. (2021). Predicting financial distress in the Indian banking sector: A comparative study between the logistic regression, LDA and ANN models. Global Business Review, 25(6), 1540–1558. [Google Scholar] [CrossRef]
  52. Munn, Z., Dias, M., Tufanaru, C., Porritt, K., Stern, C., Jordan, Z., Aromataris, E., & Pearson, A. (2021). The “quality” of JBI qualitative research synthesis: A methodological investigation into adherence of meta-aggregative systematic reviews to reporting standards and methodological guidance. JBI Evidence Synthesis, 19(5), 1119–1139. [Google Scholar] [CrossRef]
  53. Munn, Z., Stone, J. C., Aromataris, E., Klugar, M., Sears, K., Leonardi Bee, J., & Barker, T. H. (2023). Assessing the risk of bias of quantitative analytical studies: Introducing the vision for critical appraisal within JBI systematic reviews. JBI Evidence Synthesis, 21(3), 467–471. [Google Scholar] [CrossRef]
  54. Navarro-Galera, A., Lara Rubio, J., Buendía Carrillo, D., & Rayo Cantón, S. (2017). What can increase the default risk in local governments? International Review of Administrative Sciences, 83(2), 397–419. [Google Scholar] [CrossRef]
  55. Padovani, E., Iacuzzi, S., Jorge, S., & Pimentel, L. (2021). Municipal financial vulnerability in pandemic crises: A framework for analysis. Journal of Public Budgeting, Accounting & Financial Management, 33(4), 387–408. [Google Scholar] [CrossRef]
  56. Page, M. J., McKenzie, J. E., Bossuyt, P. M., Boutron, I., Hoffmann, T. C., Mulrow, C. D., Shamseer, L., Tetzlaff, J. M., Akl, E. A., Brennan, S. E., Chou, R., Glanville, J., Grimshaw, J. M., Hróbjartsson, A., Lalu, M. M., Li, T., Loder, E. W., Mayo-Wilson, E., McDonald, S., … Moher, D. (2021). The PRISMA 2020 statement: An updated guideline for reporting systematic reviews. BMJ, 372, n71. [Google Scholar] [CrossRef]
  57. Park, S., Maher, C. S., & Liao, W. J. (2023). Revisiting the (lack of) association between objective and subjective measures of local fiscal condition. Public Budgeting & Finance, 43(3), 39–54. [Google Scholar] [CrossRef]
  58. Patton, M. Q. (2008). Utilisation-focused evaluation (4th ed.). Sage Publications. [Google Scholar]
  59. Rahayu, S., Yudi, Y., & Rahayu, R. (2023). Local government performance: Financial condition perspective. Jurnal Perspektif Pembiayaan Pembangunan Daerah, 10(6), 395–408. [Google Scholar] [CrossRef]
  60. Reilly, T., Coordes, L. N., Reinisch, E., & Schlinkert, D. (2023). Uncovering municipal fiscal distress in the United States. Public Finance Management, 21(2), 86–113. [Google Scholar] [CrossRef]
  61. Ritonga, I. T., & Buanaputra, V. G. (2022). Developing rules of thumb for the financial conditions of city livability: A study of municipal governments in Indonesia. Cogent Business & Management, 9(1), 2101327. [Google Scholar] [CrossRef]
  62. Ríos, A. M., Guillamón, M. D., & Benito, B. (2024). The influence of local government transparency on the implementation of the Sustainable Development Goals in municipalities. Journal of Public Budgeting, Accounting & Financial Management, 36(4), 417–444. [Google Scholar] [CrossRef]
  63. Robbins, G., Turley, G., & McNena, S. (2016). Benchmarking the financial performance of local councils in Ireland. Administration, 64(1), 1–27. [Google Scholar] [CrossRef]
  64. Rodríguez-Bolívar, M. P., Navarro Galera, A., Alcaide Muñoz, L., & López Subirés, M. D. (2016). Risk factors and drivers of financial sustainability in local government: An empirical study. Local Government Studies, 42(1), 29–51. [Google Scholar] [CrossRef]
  65. Rudin, C. (2019). Stop explaining black box machine learning models for high-stakes decisions and use interpretable models instead. Nature Machine Intelligence, 1(5), 206–215. [Google Scholar] [CrossRef]
  66. Sauer, P. C., & Seuring, S. (2023). How to conduct systematic literature reviews in management research: A guide in 6 steps and 14 decisions. Review of Managerial Science, 17(5), 1899–1933. [Google Scholar] [CrossRef]
  67. Shiddiqy, R. A., & Prihatiningtias, Y. W. (2022). The prediction of financial distress probability in East Java province governments. International Journal of Research in Business and Social Science, 11(1), 152–160. [Google Scholar] [CrossRef]
  68. Skica, T., Rodzinka, J., & Zaremba, U. (2020). The application of a synthetic measure in the assessment of the financial condition of LGUs in Poland using the TOPSIS method approach. Economics and Sociology, 13(4), 297–317. [Google Scholar] [CrossRef]
  69. Song, Y., Jiang, M., Li, S., & Zhao, S. (2024). Class imbalanced financial distress prediction with machine learning: Incorporating financial, management, textual, and social responsibility features into an index system. Journal of Forecasting, 43(3), 593–614. [Google Scholar] [CrossRef]
  70. Sun, J., Li, H., Huang, Q.-H., & He, K.-Y. (2014). Predicting financial distress and corporate failure: A review from the state of the art definitions, modeling, sampling, and featuring approaches. Knowledge-Based Systems, 57, 41–56. [Google Scholar] [CrossRef]
  71. Tran, C. D. T. T., & Dollery, B. (2021). All in the mind: Citizen satisfaction and financial performance in the Victorian local government system. Australian Accounting Review, 31(1), 51–64. [Google Scholar] [CrossRef]
  72. Tranfield, D., Denyer, D., & Smart, P. (2003). Towards a methodology for developing evidence informed management knowledge by means of systematic review. British Journal of Management, 14(3), 207–222. [Google Scholar] [CrossRef]
  73. Trussel, J. M. (2020). Predicting significant operating deficits in municipalities using economic indicators. Journal of Accounting and Finance, 20(8), 65–76. [Google Scholar] [CrossRef]
  74. Trussel, J. M., & Patrick, P. A. (2009). A predictive model of fiscal distress in local governments. Journal of Public Budgeting, Accounting & Financial Management, 21(4), 578–616. [Google Scholar] [CrossRef]
  75. Trussel, J. M., & Patrick, P. A. (2012). A survival analysis of U.S. municipalities in fiscal distress. International Journal of Public Administration, 35(9), 620–633. [Google Scholar] [CrossRef]
  76. Trussel, J. M., & Patrick, P. A. (2013). Predicting fiscal distress in special district governments. Journal of Public Budgeting, Accounting & Financial Management, 25(4), 589–616. [Google Scholar] [CrossRef]
  77. Trussel, J. M., & Patrick, P. A. (2018). Assessing and ranking the financial risk of municipal governments: The case of Pennsylvania. Journal of Applied Accounting Research, 19(1), 81–101. [Google Scholar] [CrossRef]
  78. Wang, X., Dennis, L., & Tu, Y. S. (2007). Measuring financial condition: A study of US states. Public Budgeting & Finance, 27(2), 1–21. [Google Scholar] [CrossRef]
  79. Zafra-Gómez, J. L., López Hernández, A. M., & Hernández Bastida, A. (2009). Developing an alert system for local governments in financial crisis. Public Money & Management, 29(3), 175–181. [Google Scholar] [CrossRef]
  80. Zhuang, Y., & Wei, H. (2023). Early warning model and prevention of regional financial risk integrated into legal system. PLoS ONE, 18(6), e0286685. [Google Scholar] [CrossRef] [PubMed]
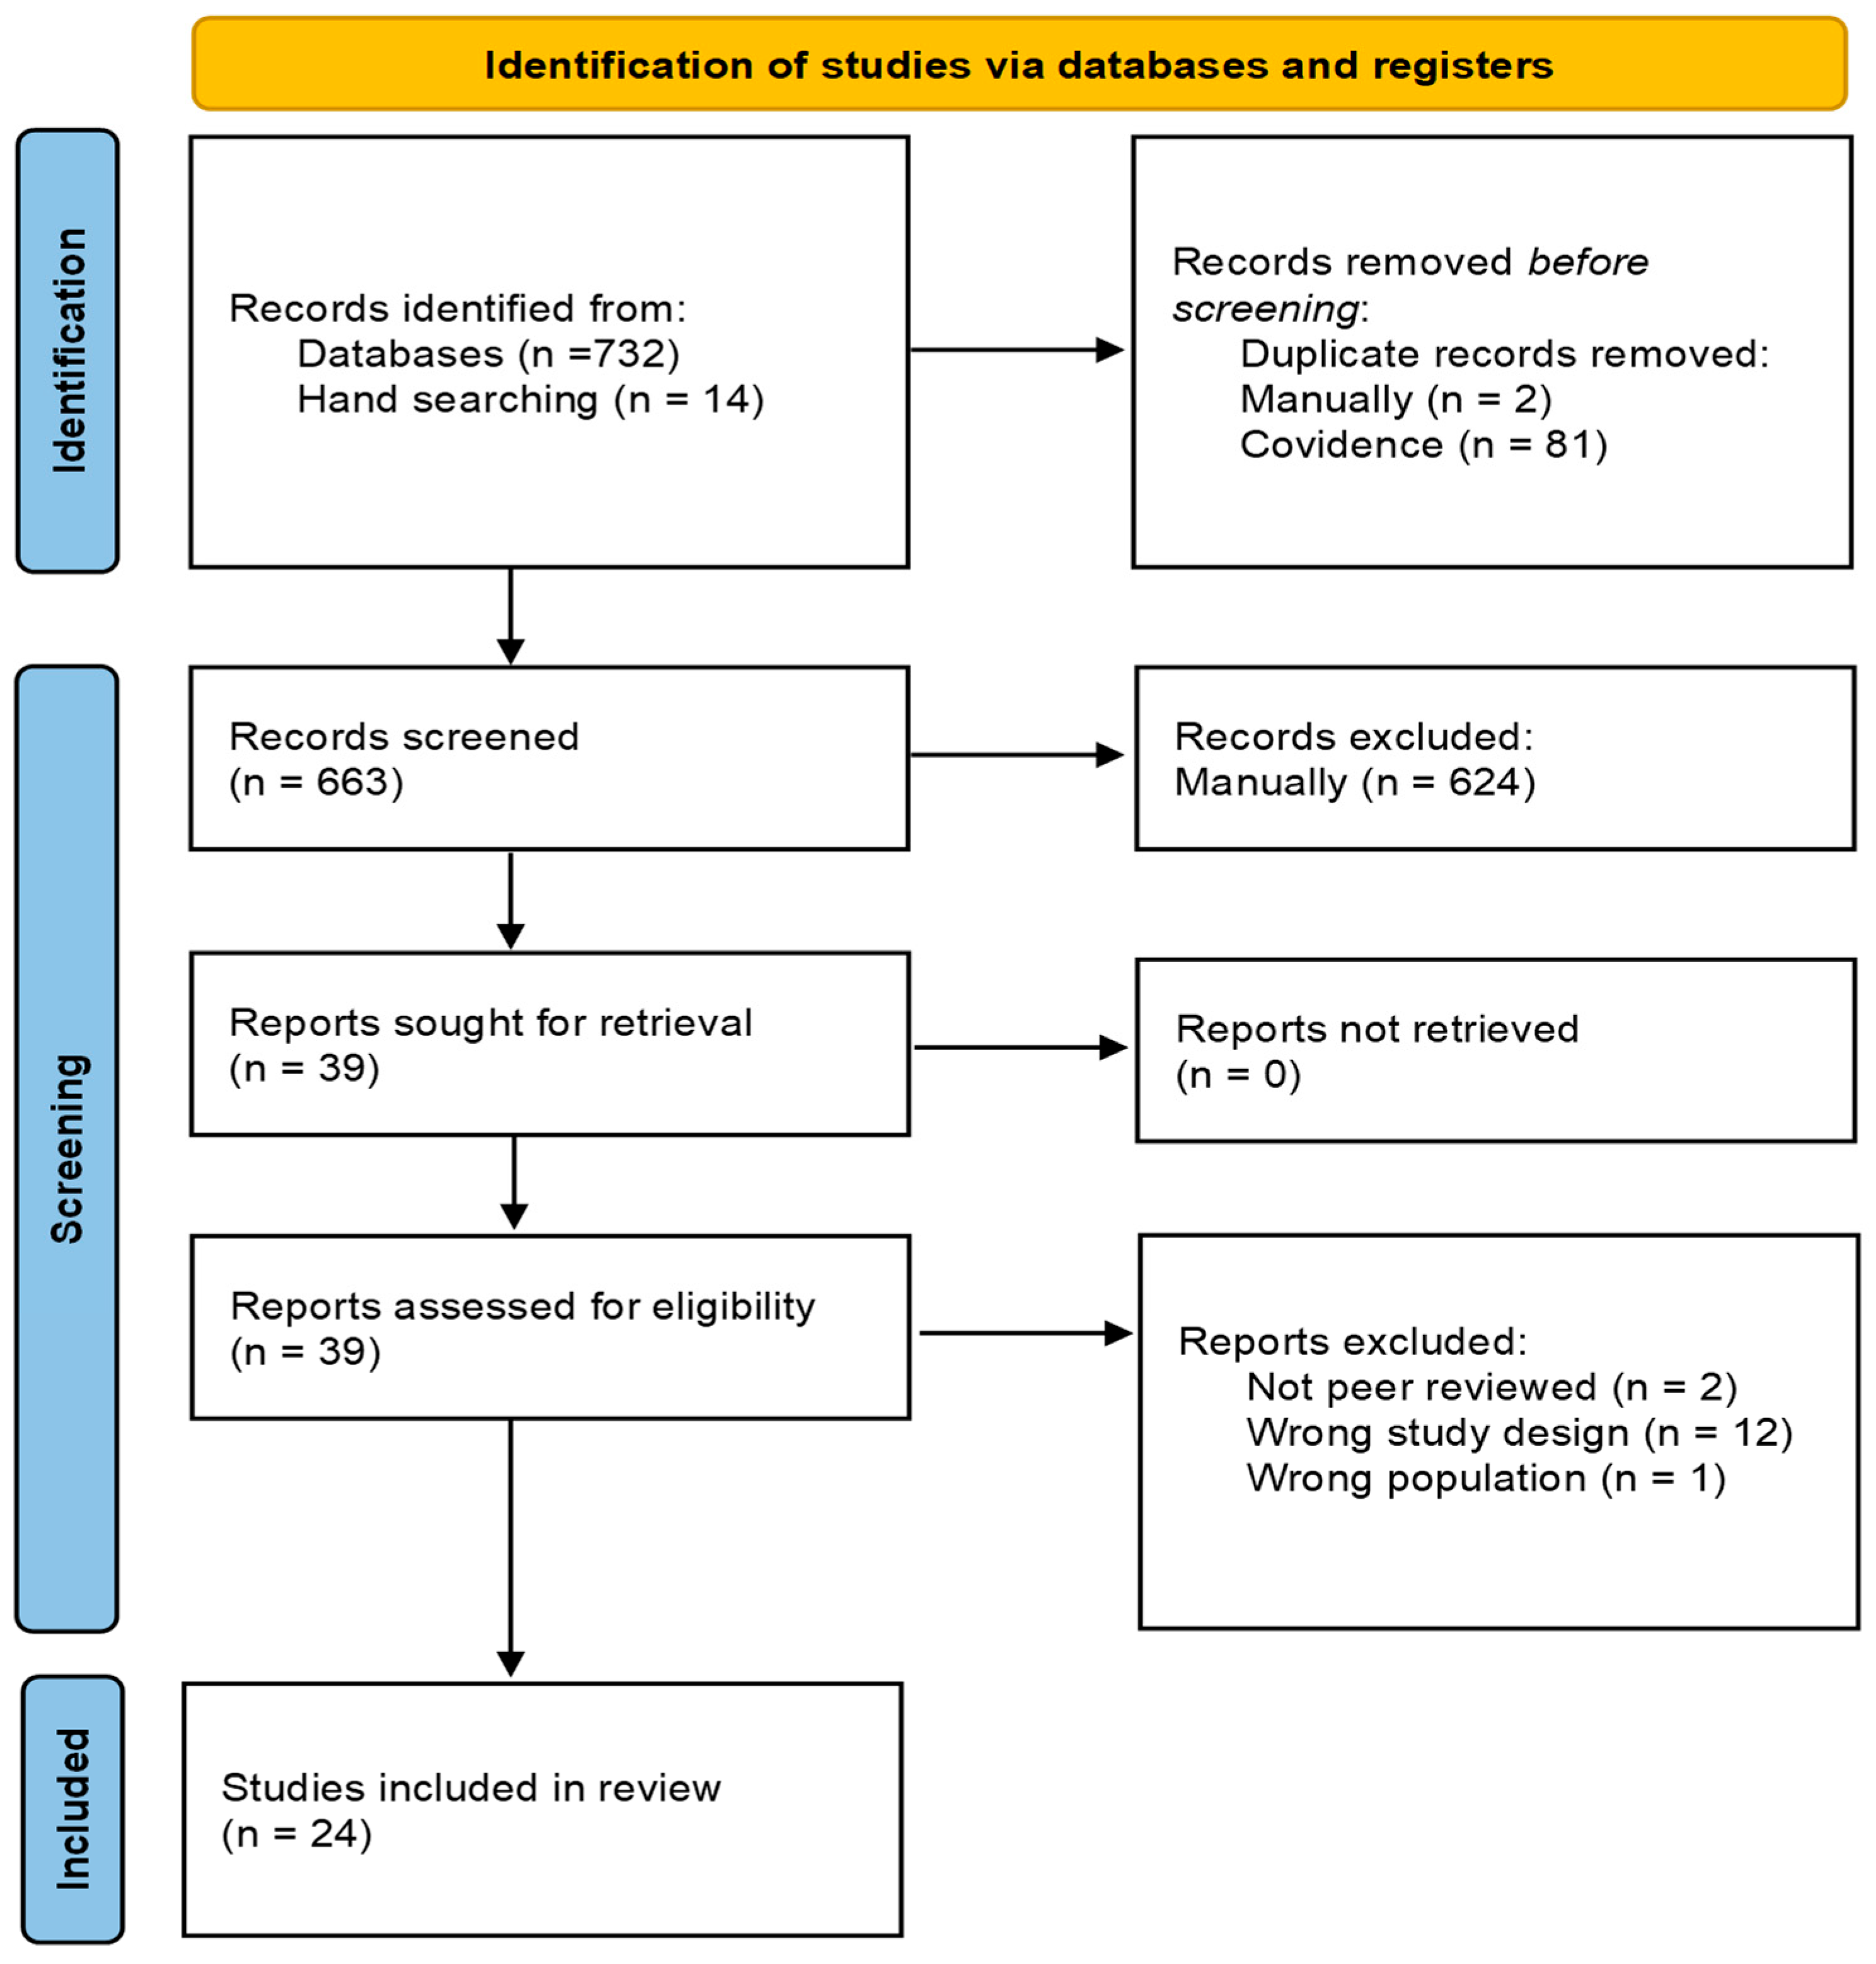
Figure 1. PRISMA systematic review study selection process.
Jrfm 18 00624 g001
Figure 2. Publication years of the reviewed studies. Source: Authors’ illustration.
Jrfm 18 00624 g002
Figure 3. Geographical distribution of the studies. Source: Authors’ illustration.
Jrfm 18 00624 g003
Figure 4. Journal distribution of the reviewed studies. Source: Authors’ illustration.
Jrfm 18 00624 g004
Figure 5. Distribution of variable indicators by theme. Source: Authors’ illustration.
Jrfm 18 00624 g005
Figure 6. Key criteria for evaluating financial distress prediction tools for municipalities. Source: Authors’ illustration.
Jrfm 18 00624 g006
Figure 7. Step-by-Step Decision Tree for Selecting an FDP model Source: Authors’ illustration.
Jrfm 18 00624 g007
Table 1. PICO Framework for the Study.
ComponentDescription
P (Population)Municipalities
I (Intervention)Financial distress prediction tools
C (Comparison)Different prediction tools
O (Outcome)Framework for selecting appropriate financial distress prediction tools
Source: Authors’ illustration.
Table 2. Inclusion and exclusion criteria.
Criteria CategoryInclusion CriteriaExclusion Criteria
Study TypePeer-reviewed journal articles, conference proceedings, and systematic reviews Opinion pieces, editorials, non-peer-reviewed reports, and studies that do not propose predictive models
Publication Date2000–2025Publications outside the 2000–2025 range
ScopeStudies focusing on financial distress
prediction models applicable to
municipalities and local governments
Studies focusing solely on corporate or private-sector financial distress models without municipal relevance
MethodologyEmpirical, theoretical, or review
Studies that propose, or test financial
distress prediction models (not mere
measurement of financial distress)
Studies focused only on the measurement of financial distress without predictive intent
Geographic CoverageNo geographic restriction.None specifically (as long as other criteria are met)
LanguageEnglish (or with high-quality translations available)Literature written in languages other than English without available translations
Source: Authors’ illustration.
Table 3. Key Evaluation Criteria identified from the reviewed studies.
CriterionDescriptionNumber of StudiesPercentage of Studies (%)
Predictive AccuracyAbility of a model to correctly classify distressed vs. non-distressed municipalities.1770.8
Comprehensiveness of
Indicators
Inclusion of diverse dimensions (e.g., financial, economic,
political, demographic) to ensure multidimensional assessment.
1666.7
Contextual SuitabilityAbility of a model to account for country-specific fiscal, legal, and institutional conditions.1041.7
Use of Historical DataThe extent to which models incorporate longitudinal or time-series data to identify financial distress patterns.1041.7
Ease of Use/
Understandability
The model’s practical usability by government officials, auditors, or policymakers.937.5
Robustness/Resistance to
Manipulation
The model’s capacity to withstand reporting bias or accounting
manipulation.
833.3
Data AccessibilityAvailability of required data inputs in practical or real-world
municipal settings.
416.7
Ability to DifferentiatePrecision in distinguishing distressed from non-distressed cases
(Type I and Type II error handling).
416.7
Theoretical ValidityDegree to which the model aligns with or is grounded in relevant
theoretical frameworks.
312.5
Expert ContributionsWhether domain experts were involved in model development
or validation.
28.3
Source: Authors’ illustration.
Table 4. Scoring of Two FDP Models under different Capacity Weighting Scenarios.
PerformanceConceptual IntegrityPractical ApplicabilityContextual FitComposite Low CapacityComposite High Capacity
P1P2C1C2PA1PA2PA3CF1CF2CF3
Model A11212221111.601.25
Model B22121112221.401.75
Source: Authors’ illustration.
Table 5. Decision Matrix for Selecting FDP Models.
CriterionLogistic Regression
(e.g., Trussel & Patrick, 2018)
Machine Learning Hybrid
(e.g., X. Li et al., 2022)
Ratio-Based
(e.g., Kloha et al., 2005)
Predictive AccuracyHigh (90%+ in stable data)Very High (>90%+ with large datasets)Moderate (80–85%, transparent)
ComprehensivenessModerate (financial ratios focus)High (adds socio-economic indicators)Moderate (limited ratios)
Contextual SuitabilityGood for developed countriesAdaptable but data-intensiveExcellent for data-scarce settings
Use of Historical DataStrong (10+ years)Strong (large datasets)Moderate (5–8 years)
Ease of UseModerate (statistical software)Low (requires data science)High (simple calculations)
RobustnessHigh (audited data)Moderate (sensitive to quality)High (transparent metrics)
Data AccessibilityModerate (standardised reports)Low (diverse sources needed)High (basic financial data)
Ability to DifferentiateHigh (low false positives)High (AUC metrics)Moderate (simpler classification)
Theoretical ValidityStrong (fiscal distress theory)Moderate (less theory-driven)Strong (policy-aligned)
Expert ContributionsModerate (auditors, officials)Moderate (technical experts)High (simple calculations)
Source: Authors’ illustration.
Disclaimer/Publisher’s Note: The statements, opinions and data contained in all publications are solely those of the individual author(s) and contributor(s) and not of MDPI and/or the editor(s). MDPI and/or the editor(s) disclaim responsibility for any injury to people or property resulting from any ideas, methods, instructions or products referred to in the content.