Abstract
This study examines risk transmission between the United States and China using integrated economic policy uncertainty (EPU) and geopolitical risk (GPR) indices. We employ a dual methodology that combines Vector Autoregressive (VAR) and Granger causality in quantiles tests to analyze interactions during systemic leadership transitions, a dimension that is currently under-explored. Our dataset covers the period from June 2000 to June 2023. Results indicate that China is narrowing the economic influence gap and strengthening its role as a regional anchor. The U.S., however, maintains predominant global leadership. This dynamic reframes bilateral tensions as a “status dilemma” rather than a security conflict. Crucially, we identify asymmetric spillover effects: the U.S. uncertainty shocks spread globally, while China’s volatility remains regional. Our findings contribute to the understanding of financial stability by demonstrating that leadership asymmetries are critical determinants, providing valuable insights for designing systemic risk monitoring tools and contagion mitigation policies during periods of heightened uncertainty.
Keywords:
risk transmission; economic policy uncertainty; geopolitical risk; U.S.–China relations; financial stability JEL Classification:
C32; G15; F51; F52; F62
1. Introduction
Geopolitical risk is recognized by the Bank of England as a critical factor within the broader context of economic policy uncertainty, forming an “uncertainty trinity” with substantial economic implications (Carney, 2016). Recent crises, including COVID-19, the Russia-Ukraine conflict, and tensions in the Middle East, have challenged global financial stability. In response, academic and policy discussions have intensified around how geopolitical risks and financial uncertainty influence markets. This growing body of literature now encompasses topics such as asset pricing (Caldara & Iacoviello, 2022), stock price crash risk (M. Choi et al., 2025), and capital structure (Chowdhury et al., 2025).
Yet, little is known about how geopolitical risk (GPR) and economic policy uncertainty (EPU) affect risk transmission, especially between major powers. Our research examines how shifts in EPU and GPR drive risk transmission between the U.S. and China and influence regional sub-core economies. We leverage the U.S.–China competition to fill this gap. As China has rapidly grown in economic and global stature, friction with the U.S., epitomized by the trade war, has become inevitable. Crucially, a comparison of these nations must consider their profound historical and demographic differences: the U.S. is a mature, globally entrenched democracy with demographic stability, while China is a rapidly developing, state-capitalist country now facing demographic challenges from its one-child policy. These divergent backgrounds shape the character and evolution of the uncertainty each nation generates. Building upon the complex dynamics previously outlined, it is important to note that, despite extensive policy debates, rigorous empirical analysis of how EPU (Berna et al., 2016; Guo et al., 2018) and GPR (M. Choi et al., 2025) affect the relative hegemonic stability and financial leadership of the U.S. and China remains under-developed.
To fill this empirical gap, our study examines the evolving systemic leadership roles of the U.S. and China through the dual lenses of EPU and GPR. We use a dual methodology framework integrating VAR and Granger causality in quantiles analysis. This captures both system-wide spillover and directional dynamics, especially in extreme conditions. Our analysis distinguishes “core countries” (the U.S. and China) from “sub-core” economies to highlight how systemic leaders propagate shocks globally and regionally. Our “core countries” framework posits the U.S. and China as primary sources of global and regional uncertainty. We examine their spillover effects on four sub-core economies: Japan, as a developed financial hub; India, a major emerging market; Hong Kong, an international financial gateway; and Macao, reflecting regional sentiment towards China. Due to data constraints in mainland China, Hong Kong and Macao serve as economic proxies.
This study makes significant contributions to the literature on international relations and financial stability. First, it presents a theoretical framework that reconceptualizes U.S.–China frictions through a “status dilemma” (Pu, 2022; Schweller & Pu, 2011), suggesting that core rivalry arises from competition over hierarchical standing and prestige, which is reflected in the competing transmissions of uncertainty. Second, it provides empirical evidence of a fundamental asymmetry in systemic risk propagation: The U.S.-originated uncertainty shocks have a global impact through deep capital markets and dollar hegemony, while Chinese volatility remains regionally confined, reinforcing its role as a regional anchor rather than a global leader. Finally, we present a dual methodology framework that integrates VAR model with Granger causality in quantiles tests, improving the analysis of complex financial interdependencies and providing deeper insights into the relationships among financial variables.
These findings are relevant for policymakers and financial institutions. Understanding the origin, magnitude, and channels of financial contagion is essential for developing effective macro-prudential regulations and targeted risk monitoring. Regulators in globally connected economies should prioritize monitoring the U.S.-related economic policy and geopolitical uncertainty, while those in the Asia-Pacific must design systems capable of tracking both global (the U.S.) and regional (Chinese) shocks. Such targeted approaches enable timely and effective responses to periods of volatility or heightened geopolitical tensions.
The remainder of this paper is structured as follows. Section 2 reviews the literature on systemic leadership, and the contextual divergences between the U.S. and China, establishing the theoretical foundation for analyzing the spillover effects of EPU and GPR, and culminating in our testable hypotheses. Section 3 details the empirical methodology, including data sources, and the dual methodology approach. Section 4 presents empirical results and discusses the identified spillover dynamics and causal relationships. Finally, Section 5 concludes by synthesizing the key findings and outlining their theoretical and policy implications.
2. Literature Review and Hypothesis Development
2.1. Literature Review
2.1.1. Systemic Leadership in a Transitional Era
The study of systemic leadership, rooted in hegemonic stability and power transition theories, has focused on the dominant state’s role in providing global public goods and upholding the rules-based order (Organski & Kugler, 1980; Gilpin, 1988). Yet, the rise of China and power diffusion now challenge these views (Allison, 2017; Nye, 2022). Leadership is moving from monopolistic to competitive and dyadic forms (Mastro, 2019; Amr, 2025). As a result, research now explores how established and rising powers interact, reshaping norms and addressing transnational challenges (Ikenberry, 2020; Garba, 2025). In this context, the interplay between EPU and GPR has emerged as a critical analytical framework for understanding the tangible manifestations of systemic leadership in a rapidly transforming world.
2.1.2. Economic Policy Uncertainty (EPU) as a Metric of Economic Stewardship
The concept of EPU, developed by Baker et al. (2016), measures market perceptions of unpredictable fiscal, regulatory, and monetary policies. High EPU lowers investment, consumption, and growth. Global EPU indices allow cross-country comparisons and show large economies’ significant spillover effects (Ahir et al., 2022). From a systemic leadership view, a nation’s EPU extends beyond its borders as a global externality. For the U.S., as issuer of the main reserve currency, domestic policy uncertainty brings volatility to advanced and emerging economies (Kido, 2018; Kwon, 2025), showing the U.S.’s strong impact on global finance. Managing domestic EPU is crucial, promoting global stability through predictable, transparent governance.
Parallel to this, China’s deepening integration into global financial markets and the expansive reach of initiatives like the Belt and Road Initiative (BRI) and Asian Infrastructure Investment Bank (AIIB) mean that uncertainty surrounding its economic policies now carries substantial international implications (Huang & Luk, 2020; Sheng & Nascimento, 2021). The transmission mechanisms of Chinese EPU, however, are distinct, filtered through its state-capitalist model and unique political institutions (Pan, 2019). A growing body of research thus leverages the EPU paradigm to argue that a comparative analysis of U.S. and Chinese EPU spillovers serves as a crucial barometer of their competing economic leadership and the stability they respectively engender or disrupt within the global system (Biljanovska et al., 2021).
2.1.3. Geopolitical Risk (GPR) and the Securitization of Commerce
Complementing the economic focus of EPU, the Geopolitical risk (GPR) index developed by Caldara and Iacoviello (2022) quantifies risks from wars, terrorism, and inter-state tensions that disrupt international relations. Elevated GPR affects global supply chains, triggers energy price shocks, and drives capital flight to safe-haven assets, threatening macroeconomic stability. Historically, the U.S. has acted as a security guarantor, mitigating these risks to maintain a stable environment for commerce (Ikenberry, 2011). A significant shift is evident, as contemporary scholarship identifies U.S. foreign policy and its competition with China as primary drivers of global GPR. This rivalry, manifest in the Indo-Pacific, technological decoupling, and global institutions, creates a pervasive layer of systemic risk (Allison, 2017). Concurrently, China’s assertive foreign policy and territorial claims, particularly in the South China Sea, are recognized as key contributors to elevated GPR (Johnston, 2013; Y. Zhang, 2024).
This reflexivity, where systemic powers act as both managers and sources of geopolitical risk, characterizes the current transitional era. Thus, a nation’s “GPR footprint,” or the extent to which its actions elevate the global risk index, serves as a measurable gauge of its role in fostering or undermining international peace and security, a core aspect of systemic leadership.
2.1.4. The Imperative of Contextual and Historical Nuance
Comparing the U.S. and China requires attention to their significant differences. Overlooking these risks can lead to oversimplification or misleading conclusions. Their unique histories and demographics shape their economies, priorities, and innovation (Y. Zhang, 2024).
The U.S., a market-oriented democracy, shaped the post-WWII liberal order and benefited from early technological advantages. In contrast, China’s rise began only recently, evolving from colonialism and revolution into central planning, and then state-guided integration post-1978 (Wei, 1995; Zheng & Li, 2022). This difference puts the U.S. and China at different development stages and under distinct political-economic systems, shaping policy uncertainty and global impacts (Gilpin, 1987).
The population contrast is also marked. The U.S. has a mature, slow-growing population, supported by immigration and a consumption-based economy. China reaped a “demographic dividend” that fueled export-led growth but now faces aging and a shrinking workforce (Can & Chan, 2022). These trends create different fiscal, social, and growth constraints, which are essential control variables for comparing spillovers (Yaqoob et al., 2024). Critically, the international transmission of the U.S. and Chinese EPU and GPR is not a uniform process but is filtered through these distinct historical and demographic lenses.
2.2. Hypothesis Development
Recently, economic policy uncertainty (EPU) has become a significant factor influencing global economic outcomes. This is largely driven by escalating incidents of political and economic instability (Baker et al., 2016). EPU, now attracting increased scholarly interest, plays a crucial role in shaping economic activities. Its impact on the economy has been examined primarily from two perspectives: economic outcomes and corporate strategies.
Prior research has shown that EPU negatively affects economic outcomes. It diminishes real investments (Bernanke, 1983; Bloom, 2009), reduces economic growth (Bloom, 2009), and elevates the unemployment rate (Fontaine et al., 2020). Another stream of literature explores the influence of EPU on corporate operations. During heightened EPU, companies typically face substantial limits in securing external financing. This affects both stock markets (Çolak et al., 2017) and loan markets. EPU also inhibits corporate capital investments (Gulen & Ion, 2016) and mergers and acquisitions (M&A) activities (Nguyen & Phan, 2017).
Geopolitical instability and policy unpredictability heavily impact financial markets and real economies (Mawusi, 2020). Abrupt moves, such as proposed U.S. tariffs, amplify global uncertainty and strain relations. Biljanovska et al. (2021) found that EPU reduces output growth, consumption, and investment. These works stress two points: uncertainty has a negative impact, and stability is valuable for growth.
Drawing from the theoretical and empirical foundations above, and controlling for key historical and demographic contexts, the following hypotheses are advanced. They form a logical sequence: from a core economic principle to testing whether China is now a systemic risk source, and then to examining persistent structural asymmetry between the two powers.
H1.
Within-Country Effect: Heightened domestic economic policy uncertainty (EPU) exerts a negative effect on domestic economic performance, as measured by GDP growth, consumer price index (CPI), unemployment rate, and stock market indices for all studied economies (the U.S., China, Japan, India, Hong Kong, and Macao).
H1 establishes a baseline, grounded in the well-established principle that uncertainty induces precautionary savings and delays irreversible investment decisions, thereby reducing aggregate output (Bernanke, 1983; Bloom, 2009; Baker et al., 2016; Tam, 2020).
Second, international transmission of uncertainty is hierarchical. Evidence shows that major economies have a larger impact on peripheral markets (Berna et al., 2016; Das et al., 2019; S. Y. Choi, 2022). If China matches the U.S. in systemic influence, then shocks from both “core” economies should spill over to “sub-core” economies (e.g., Japan, India), with minimal reverse transmission. This hypothesis tests China’s role in global risk. Recent research finds that the connection between uncertainty and financial links changes over time and is sensitive to crises (Leone et al., 2025). In China, EPU shapes foreign direct investment (FDI) by affecting risk perceptions. L. Zhang and Colak (2022) showed China’s EPU restrains outbound FDI but does not significantly deter inflows. Conversely, Dong et al. (2025) suggested that both domestic and global EPU may affect FDI into China, but financial development and political stability can reduce these impacts. Wu and Shao (2023) emphasized that uncertainties in both home and host countries shape outward FDI decisions of Chinese firms, showing varied impacts on international investment behavior.
H2.
Core-Periphery Spillover: EPU and GPR shocks originating in systemic core economies (U.S. and China) spill over directionally to sub-core economies (e.g., Japan, India, Hong Kong, and Macao), with no significant reverse transmission.
H2 tests the hierarchical nature of international uncertainty transmission. Major “core” economies disproportionately impact smaller, interconnected “peripheral” markets (Berna et al., 2016; Kido, 2018). If supported, this would signal that China has reached a level of systemic influence. Its domestic shocks would have external effects comparable to those of the U.S.
Over the past decade, China has become the world’s second-largest economy. This rise came with increased geopolitical and economic tensions with major powers, especially the U.S. These frictions span trade, technology, security, and human rights, raising systemic risks in Asia-Pacific financial markets and global capital flows. Sino-U.S. relations, now more about strategic competition, have seen trade wars, sanctions, and disputes over Taiwan, the South China Sea, and other flashpoints. Such conflicts create EPU and GPR, disrupting investment, asset pricing, and financial stability. Welsh (2019) argues that China’s move from economic actor to assertive military power challenges U.S. interests and regional stability. This dynamic fits with the “Thucydides Trap,” which warns of conflict when a rising power confronts an established hegemon (Beckley, 2021; Yoder, 2019; Cole, 2023).
Recognizing the historical depth and structural power of the U.S. dominance in global finance and security (Ikenberry, 2020; Mastanduno, 2019), H3 posits a persistent asymmetry. Hegemonic stability theory suggests that uncertainties from the dominant power have outsized international effects. Even if China causes significant spillovers (as tested in H2), the U.S. financial system’s influence may cause a unidirectional effect: from the U.S. to China. This would confirm the ongoing structural power of American hegemony.
H3.
Asymmetric Hegemonic Transmission: The U.S. EPU and GPR shocks are a significant causal driver of fluctuations in China’s EPU and GPR, with no significant reverse transmission, confirming the persistent hegemonic influence of the U.S. within the global financial system.
3. Data and Methods
3.1. Data
This study uses two primary indices to measure uncertainty. For economic uncertainty, we utilize global and country-specific economic policy uncertainty (EPU) indices from Baker et al. (2016), which analyze newspaper coverage of economic policy and public sentiment regarding future policies. For geopolitical risk, we employ the GPR index (Caldara & Iacoviello, 2022), which tracks risks associated with wars, terrorism, and international tensions. Since Macao is not included in the standard EPU index, we adopt a Macao-specific version from Luk (2018). This monthly index, available from June 2000, uses a similar text-based method and correlates strongly with Macao’s key macroeconomic indicators. As Macao lacks a comprehensive stock market index, we construct one using the stock prices of its six largest casino firms listed in Hong Kong. We apply weighted summation and statistical adjustments to make the index comparable internationally.
Although the EPU and GPR indices start before 2000, we use data from June 2000 to June 2023 to ensure consistent periods across the U.S., China, Japan, India, Hong Kong, and Macao. We process all data using Python (version 3.8.10) and SPSSAU (2023). For macroeconomic variables such as GDP growth, CPI, unemployment rate, and stock market indices, we source data from WIND and CEIC. We use the NYSE Composite Index for the U.S. For China, we convert quarterly macroeconomic data to a monthly frequency using EViews (version 12).
Limited monthly unemployment data for China leads the quantile causality regression to focus on extreme GPR cases: the top tercile (high risk, above the 67th percentile) and the bottom tercile (low risk, below the 33rd percentile). This approach examines causality across varying levels of geopolitical risk.
3.2. Methods
3.2.1. The Vector Autoregressive (VAR) Model
We first implement a standard Vector Autoregressive (VAR) model to test for Granger causality in the conditional mean. This model provides a baseline assessment of average relationships and captures dynamic interdependencies among multiple time series variables. Through the VAR framework, we assess reciprocal feedback mechanisms that support empirically robust macroeconomic analysis (Sims, 1980).
Following Lutkepohl (2005), the VAR(p) model is specified as:
where
yt = a vector of endogenous variables,
xt = a vector of exogenous variables,
A1yt−1 +···+ A1yt−p + Bxt = coefficient matrices,
εt = a vector of serially uncorrelated innovations.
To achieve stationarity, logarithmic transformations and differencing are applied where necessary, and unit roots are formally tested using the Augmented Dickey–Fuller (ADF) test. A VAR(1) system (a vector autoregression model with one lag) is specified as:
where ut and vt are white noise error terms. The coefficients β11, β12, β21, and β22 are estimated using ordinary least squares (OLS). To investigate dynamic interrelationships between the variables, we employ both Engle–Granger cointegration tests and Granger causality tests. If a variable Granger-causes another, its past values contribute useful information for predicting the other variable, beyond what is contained in that variable’s own history.
yt = α1 + β11 yt−1 + β12xt−1 + ut
xt = α2 + β21yt−1 + β22xt−1 + vt
Lag length selection is crucial for model accuracy. We minimize Akaike Information Criterion (AIC), Bayesian Information Criterion (BIC), Final Prediction Error (FPE), and Hannan-Quinn information criteria (HQIC), all pointing to a lag order of 1. Model stability is checked using an autoregressive root graph. Analysis focuses on the top 90% high-risk and bottom 10% low-risk groups. We exclude more extreme quantiles to ensure at least 20 data points for reliable results.
Impulse response functions trace how endogenous variables react to exogenous shocks. For example, a political risk shock shows dynamic effects on macro variables like GDP, inflation, unemployment, and stock prices, guiding policy to mitigate short-term shocks and consider long-term effects.
3.2.2. Granger Causality in Quantile Tests
To capture nonlinear state-dependent causal relationships that a VAR model alone may miss, we supplement our analysis with Granger causality tests in quantiles. Following Troster et al. (2018), this approach allows us to examine causality across different market conditions, such as bearish, normal, and bullish states, and identify whether the direction of influence varies along the economic distribution.
Following Granger (1969) and Chuang et al. (2009), we define that the random variable x does not Granger-cause the random variable y if:
where Fyt (⋅∣F) denotes the conditional distribution of yt, and (Y, X)t−1 represents the information set generated by past values of yi and xi up to time t − 1. If this equality fails for any η, x is said to Granger-cause y. A necessary (but not sufficient) condition for (3) is:
Fyt (η|(Y, X)t−1) = Fyt (η|Yt−1), ∀η ∈ R,
E[yt|(Y, X)t−1] = E(yt|Yt−1).
Let E(yt∣F) denote the mean of the conditional distribution Fyt (⋅∣F). We say that x does not Granger-cause y in mean if condition (3) holds; otherwise, x Granger-causes y in mean. This is typically tested by estimating a linear model for E[yt|(Y, X)t−1]:
where rejecting the null hypothesis βj = 0 for all j = 1,…,q implies Granger causality from x to y. Granger non-causality can also be defined in terms of conditional quantiles. Let Qyt (τ | F) denotes the τ-th quantile of Fyt (·|F). Condition (3) is equivalent to:
yt = α0 + ∑pi=1 αi yt−1 + ∑qj=1 βj xt−1 + ϵt,
Qyt (τ|(Y, X)t−1) = Qyt (τ|Yt−1), ∀τ ϵ (0,1).
If Equation (6) holds, x does not Granger-cause y across any quantile. Alternatively, one may test non-causality at a specific quantile τ by evaluating (6) for a given τ.
This study examines the two-way interactions between the GPR and EPU indices of the U.S. and China, while simultaneously assessing their spillover effects on four Asian economies: Japan, India, Hong Kong, and Macao.
Building on the methodological approaches of Guo et al. (2018) and Kannadhasan and Das (2020), we specify two parallel quantile regression models to capture these dynamics:
For EPU transmission:
Qyt (τ|(Y, X)t−1) = Qτ (yt|Yt−1, EPUt)
= αi (τ) + ∑pi=1 βj (τ) yt−1 + γi (τ) yt−1 I (yt−1|> yq) + θi EPUt + et
For GPR transmission:
Qyt (τ|(Y, X)t−1) = Qτ (yt|Yt−1, GPRt)
= αi (τ) + ∑pi=1 βj (τ) yt−1 + γi (τ) yt−1 I (yt−1|> yq) + θi GPRt + et
The variable yt measures index or macroeconomic changes across countries. We first examine U.S. leadership by regressing its EPU/GPR (log-differenced) on China’s indices and regional variables, then reverse the analysis. Yt−1 denotes lagged values, with βj(τ) showing lagged effects and γi(τ) capturing extreme shocks via indicator I(|yt−1| > yq) (threshold: 95th quantile). The coefficient θi(τ) captures the impacts of EPUt and GPRt on other countries’ indices or economic variables, which are critical for testing our hypotheses.
Although sensitivity analysis of composite methods is limited, our dual VAR-quantile approach aligns with data mining literature on method-specific performance dependencies (Ruiz & Nieto, 2000), integrating VAR with quantile causality, as shown by Oztekin et al. (2013) and Sevim et al. (2014).
y = f (x1, x2, …, xn)
Our EPU/GPR prediction model employs a linear regression framework:
f (x1, x2, …, xn) = β + ∑ ai xi
For neural networks, this generalizes to:
where Φ is the activation function and wi are weights. The fusion model combines m predictors:
f (x1, x2, …, xn) = Φ (w0 + ∑ wi xi)
yf = ψ (yi, j) = ψ (f1,(x), f2 (x),…, fm (x))
For simplicity, this study assumes that the operator ψ is linear, thereby transforming the equation into a “composite model” which can be expressed as:
where ωi represents the weights assigned to each model fi (x). The normalized weights (∑ωi = 1) reflect each model’s predictive accuracy, prioritizing superior performers. For this study, we treat the VAR model and Granger causality in quantiles as equally weighted components (ω1 = ω2 = 0.5), suggesting their joint efficiency in forecasting EPU/GPR dynamics. Following Sevim et al. (2014), we employ sensitivity analysis to optimize Granger causality tests. The sensitivity measure for variable n combines inputs from m models, is expressed as:
where Si,n represents the i-th model’s sensitivity to variable n, weighted by ωi. This aggregated measure evaluates each variable’s comprehensive influence. In our framework (m = 2 models, n = 4 variables), this approach identifies the most impactful economic indicators for uncertainty transmission analysis.
yf = ∑ ωi fi (x) = ω1 f1 (x) + ω2 f2 (x) + … + ωm fm (x)
Sn,f = ∑im ωi Si,n = ω1 S1, n + ω2 S2, n + … + ωm Sm,n
4. Empirical Results and Discussion
4.1. Empirical Results
The following subsections report empirical findings from the previously introduced econometric framework. To improve inference reliability, this framework is specifically calibrated to address potential biases stemming from endogeneity, heteroscedasticity, and multicollinearity. Results and analysis are structured to build logically from domestic impacts through to global transmission.
4.1.1. The Domestic Impact of Economic Policy Uncertainty
Empirical results demonstrate that elevated domestic EPU consistently depresses macroeconomic performance across all studied economies. Table 1’s descriptive statistics illustrate this broad deterioration. A rise in domestic EPU coincides with a statistically significant unemployment rate increase (SD: China 0.147, U.S. 0.271, Japan 0.011, India 0.003, Hong Kong 0.105, and Macao 0.002), after adjusting for other factors. EPU shocks also disrupt consumer price stability, raising price volatility. The consumer price index (CPI) standard deviation rises sharply in the U.S. (0.007), China (0.006), Japan (0.030), India (0.206), Hong Kong (0.995), and Macao (0.115). These results establish the domestic role of EPU before analyzing international transmissions.

Table 1.
Descriptive statistics.
Financial markets react negatively to policy uncertainty, as indicated by a causal deterioration in investor sentiment. Table 1 reports negative skewness in China’s (−0.125) and the U.S.’s (−0.992) stock markets, reflecting a higher probability of extreme negative returns due to EPU-induced shocks. India’s stock market, in turn, responds with higher return volatility (SD = 0.119). Granger causality tests within the VAR framework confirm that increases in domestic EPU cause these negative effects. In China, a rise in domestic EPU Granger-causes GDP declines. Additionally, the Granger causality in quantiles test shows that domestic EPU’s effect is stronger in lower quantiles (e.g., during downturns) than in median or upper quantiles, underscoring that policy uncertainty is especially critical during stress periods.
4.1.2. The International Transmission of Uncertainty and GPR
Moving from the domestic channel, the analysis identifies a hierarchical and uneven pattern in the transmission of uncertainty globally. The U.S. and China primarily shape these flows. Table 2a details a hierarchy of vulnerability: sub-core economies (SD: Japan 32.3, India 46.9, Hong Kong 72.3, and Macao 76.9) have lower EPU volatility than China (SD = 114.2), whose volatility is over 150% above that of the U.S. (SD = 45.3). This hierarchy is also supported by cross-country EPU correlations. The clear positive relationship between U.S. and Chinese EPU (ρ = 0.244, Table 2b) is a major driver of global co-movement, connecting to the subsequent discussion of spillovers.

Table 2.
(a). Pearson correlation among countries (EPU-level). (b). Pearson test of major countries (Changes in EPU).
Spillovers of uncertainty are asymmetric, as Granger causality in quantiles tests reveal one-way causal influence: shocks to the U.S. EPU cause changes in China’s macroeconomic variables, but not the reverse. This spillover reaches its peak when Chinese markets decline. Conversely, China’s GPR can causally transmit shocks upstream, impacting the U.S. variables directly. The diagnostic tests for model adequacy, presented in Table 3, confirm the robustness of these findings.

Table 3.
Portmanteau test results.
GPR transmission patterns confirm the global causal hierarchy. Table 4’s correlation analysis shows that the U.S. exerts the strongest causal links with other nations, such as 0.587 with China, 0.546 with Japan, and 0.456 with India, establishing the U.S. as the main node in the global GPR network. The interrelationship between geopolitical risk and economic policy uncertainty within each country is further detailed in Table 5, which presents the correlation of GPR and EPU for China, the U.S., Japan, and India. The coupling of economic and geopolitical forces creates “asymmetric interdependence”: the U.S. primarily exports EPU, while China causally drives GPR independently. These empirical findings are supported by stationary time series data, as confirmed by the Augmented Dickey-Fuller test results in Table 6. The detailed outcomes of the Granger causality in quantiles tests that underpin the analysis of asymmetric spillovers are presented in Table 7.

Table 4.
Correlation of the geopolitical risk of China, the U.S., Japan, and India.

Table 5.
Correlation of the GPR and EPU of China, the U.S., Japan, and India.

Table 6.
Augmented Dickey–Fuller (ADF) test results.

Table 7.
Granger causality in quantiles test results.
4.1.3. Robustness Checks and Model Validation
A Variance Inflation Factor (VIF) check shows severe multicollinearity among some explanatory variables. Out of thirty-seven variables, thirteen, primarily CPI, EPU, and stock market indicators, exhibited VIF values exceeding the critical threshold of 10 (Belsley et al., 1980), ranging from 10.99 to 245.67 (see Table A1 in Appendix C). This aligns with global economic and financial synchronization. To address this, we used Principal Component Analysis (PCA), as proposed by Stock and Watson (2002). PCA transforms highly correlated variables into orthogonal components that capture shared variance. By retaining only the most informative components, we reduce multicollinearity while preserving key economic details.
We tested for endogeneity using the Durbin–Wu–Hausman test (Hausman, 1978). The test strongly rejects exogeneity (p = 0.0046) (Table 8), indicating clear causal endogeneity in the USA-EPU variable. This aligns with theoretical views on how policy uncertainty and financial markets influence each other. To address this and obtain unbiased causal parameter estimates, we employed an Instrumental Variables (IV) method with Two-Stage Least Squares (2SLS) estimation. The endogenous USA-EPU is instrumented with Global-EPU and Japan-EPU. Table A2 in Appendix C shows that these instruments are causally associated with the endogenous regressor (correlations: 0.645 and 0.598), satisfying the relevance condition. Their much lower correlations with the US financial outcome, USA-STOCK (0.234 and 0.267), tentatively fulfill the exclusion restriction. Both instruments pass validity checks: the first-stage F-statistic is 28.45 (well above the threshold of 10 established by Staiger and Stock (1997)), and the Sargan test (p = 0.2663) confirms they are not correlated with the error term, supporting the validity of the IV model for causal inference.

Table 8.
Comprehensive diagnostic test results and methodological implications.
The White test for heteroscedasticity shows it is present across many model types (p-values: 0.0032 to 0.0108; Table 8). This fits the common pattern of volatility clustering in financial time series (Engle, 1982). As a result, we do not use ordinary least squares standard errors. Instead, we report results using the White (1980) heteroscedasticity-consistent estimator. This yields strong t-statistics, confidence intervals, and p-values even when the variance is not constant. Additionally, the Ramsey RESET test and initial quantile analyses reveal possible nonlinearity (Ramsey, 1969). This supports the use of quantile regression to capture changes that may be missed by mean models.
The integrity and reliability of the dynamic models are confirmed through extensive validation checks. The stability of each VAR system, essential for valid impulse response analysis, is verified via AR root graphs (see Appendix A, Figure A1, Figure A2, Figure A3 and Figure A4), confirming that all eigenvalues for China, the U.S., Hong Kong, and Macao lie within the unit circle. The model specification is refined by selecting the optimal lag length based on established information criteria. Residual diagnostics indicate no autocorrelation through Portmanteau tests (e.g., Hong Kong: χ2 = 33.570, p-value = 0.117), as shown in Table 3, and confirm stationarity across all variables using Augmented Dickey–Fuller tests (p < 0.01) in Table 6.
Robustness in correlation and regression analyses is ensured through methodological safeguards. Correlation analyses between EPU and GPR, detailed in Table 5, reveal cross-country heterogeneity, showing a strong positive correlation in China (ρ = 0.208), a moderate correlation in the U.S. (ρ = 0.086), and a negative association in India (Kendall’s τ = −0.084), indicating that the analyses remain free from specification biases. Heteroscedasticity-robust standard errors are used for regression-based inferences to correct for non-constant variance. The orthogonal impulse response functions, illustrated in Figure A5, Figure A6, Figure A7, Figure A8, Figure A9 and Figure A10 in Appendix B, quantify the dynamic impact of shocks across the system.
4.1.4. Global Financial Landscape and Risk Analysis
Bringing together all empirical findings reveals a multilayered global structure of uncertainty transmission that links the domestic and international vulnerabilities of the modern economy. First, as demonstrated in previous sections, domestic EPU universally imposes systemic risk by undermining macroeconomic stability through suppressed output, higher unemployment, and financial market stress. This persistent effect, observed in all economies studied, underscores the broad economic costs of policy ambiguity that impede decision-making.
The international analysis further highlights a core-periphery hierarchy. The U.S. emerges as the main transmitter of economic policy shocks, while China acts both as a recipient of the U.S.-induced shocks and as a source of geopolitical risk. This asymmetric interdependence, detailed in earlier sections, creates a multi-tiered global risk structure. Shocks from central economies can be amplified by financially interconnected hubs. Therefore, global investors must consider the influence of the U.S. EPU and China’s GPR distinctly, linking empirical evidence to risk management strategies for regional and sectoral exposures.
4.2. Discussion of the Results
4.2.1. The Domestic Channel: EPU as a Systemic Risk Factor
Domestic economic policy uncertainty (EPU) undermines macroeconomic stability in both advanced and emerging economies. This validates the “cognitive rigidity” channel caused by policy ambiguity (Bloom, 2009; Baker et al., 2016). This represents a causal relationship: an opaque policy environment prompts widespread caution. When policy is unclear, firms delay investments, hiring, and capital spending (Dixit & Pindyck, 1994). Households spend less and save more (Bernanke, 1983). This hesitation lowers GDP, increases unemployment, and creates price instability. Financially, asset pricing and risk management must account for increased volatility and negative skewness in returns (Table 1), as investors demand a higher risk premium for EPU (Engle, 2002). Granger causality tests show that EPU has a stronger impact at lower quantiles, revealing that risk rises much more during downturns. This state-dependent effect means risk models must be nonlinear; constant-volatility models miss tail risk.
4.2.2. The International Channel: A Hierarchy of Asymmetric Interdependence
The international spillover results reveal a core-periphery system (Forbes & Warnock, 2012) defined by asymmetric interdependence. Unidirectional spillovers from the U.S. EPU to China position the U.S. as the global financial anchor. The U.S. spreads uncertainty through supply chains, financial markets, and dollar dominance. In contrast, China can now project GPR upstream to influence the U.S., demonstrating its evolution into a geostrategic shaper. This reflects a modern reality: economic leadership and geopolitical influence are now distinct global risk channels. Asymmetric interdependence creates a complex environment by diversifying sources of systemic risk. Financial stability now depends not just on the policies of traditional core economies but also on geopolitical events from rising powers.
The financial implications of this asymmetry are significant. Addressing them requires a two-step approach to global risk. For top-down allocation, use the EPU of core countries, particularly the U.S., as a primary leading indicator. When the U.S. EPU rises, it reduces risk in vulnerable markets with strong trade and financial ties. For bottom-up regional or sector planning, rely on the GPR of core countries and the EPU of peripheral ones. China’s GPR is important for pricing assets in sectors like commodities, defense, and shipping, as well as for evaluating companies linked to Asian supply chains. High EPU volatility in major emerging markets like China and India (Table 2a) justifies applying higher country-risk premiums in their equity and bond markets. This adjustment reflects added, non-diversifiable risk for investors.
5. Conclusions and Policy Implications
This study has developed and validated a hierarchical framework for analyzing how EPU and GPR move through the global economy. Using a robust econometric approach, we find three key results. First, higher domestic EPU consistently hurts macroeconomic performance. It is linked to higher unemployment, increased price volatility, and less stable financial markets in both advanced and emerging economies. This indicates that EPU is a powerful, unavoidable risk stemming from national policies.
Second, our analysis shows that uncertainty between countries does not spread evenly in both directions but follows a core-periphery pattern. Shocks from core economies, especially the U.S., primarily flow into peripheral countries. A key detail is the “asymmetric interdependence” between the U.S. and China. The U.S. is the main sender of EPU, but China has become a significant source of GPR and can transmit shocks back that affect U.S. economic outcomes.
The study makes three primary contributions. Methodologically, it demonstrates the effectiveness of combining VAR modeling with quantile-based Granger causality tests to capture both average and dynamic transmission patterns. Theoretically, it elucidates the complex, nonlinear nature of international spillovers and introduces the concept of asymmetric interdependence between economic and geopolitical risks to the existing literature. Practically, it identifies key transmission nodes and offers a refined map of risk pathways for enhanced management.
These findings carry significant implications for both policy and investment strategies. Policymakers in peripheral countries must contend with the risk of imported uncertainty from core nations. They should closely monitor trends in core-country EPU and implement fiscal and monetary protections to bolster their economies. Investors and asset managers are encouraged to adopt a multi-layered risk approach, utilizing U.S. EPU for global decisions and GPR alongside peripheral-country EPU for regional and sectoral considerations. This strategy facilitates more accurate pricing of risk.
Despite these contributions, this study is subject to limitations that suggest avenues for future research. The geographical focus on the U.S., China, and select Asian economies may restrict the generalizability of the findings to other regions, such as Europe or Latin America. Methodologically, while robust, the framework could be expanded through network analysis or dynamic spatial econometric models to better elucidate the complex topology and time-varying nature of the identified contagion networks. Additionally, as noted by Chen et al. (2024), using keywords to construct EPU and GPR indices can introduce errors. Future research could employ more advanced methods to obtain more accurate measures. Finally, investigating sector-specific vulnerabilities to these spillovers would provide valuable micro-level insights for corporate and financial risk management.
Author Contributions
Conceptualization, J.Y.-C.S. and U.L.L.; methodology, J.Y.-C.S. and U.L.L.; software, J.Y.-C.S. and U.L.L.; validation, J.Y.-C.S. and U.L.L.; formal analysis, J.Y.-C.S. and U.L.L.; investigation, J.Y.-C.S. and U.L.L.; resources, J.Y.-C.S. and U.L.L.; data curation, J.Y.-C.S. and U.L.L.; writing—original draft preparation, J.Y.-C.S. and U.L.L.; writing—review and editing, J.Y.-C.S. and U.L.L.; visualization, J.Y.-C.S. and U.L.L.; supervision, J.Y.-C.S. and U.L.L.; project administration, J.Y.-C.S. and U.L.L.; funding acquisition, J.Y.-C.S. and U.L.L. All authors contributed equally to this work. All authors have read and agreed to the published version of the manuscript.
Funding
This research received no external funding.
Institutional Review Board Statement
Not applicable.
Informed Consent Statement
Not applicable.
Data Availability Statement
Data available on request due to restriction.
Acknowledgments
We thank the discussants and the audience for comments and suggestions and Shuai YAO for the excellent computer work. The authors are solely responsible for any errors in this study.
Conflicts of Interest
The authors declare no conflicts of interest.
Abbreviations
The following abbreviations are used in this manuscript:
| ADF | Augmented Dickey–Fuller |
| AIC | Akaike Information Criterion |
| AIIB | Asian Infrastructure Investment Bank |
| BIC | Bayesian Information Criterion |
| BRI | Belt and Road Initiative |
| CPI | Consumer Price Index |
| EPU | Economic Policy Uncertainty |
| FDI | Foreign Direct Investment |
| FPE | Final Prediction Error |
| GDP | Gross Domestic Product |
| GPR | Geopolitical Risk |
| HQIC | Hannan-Quinn Information Criterion |
| IV | Instrumental Variables |
| OLS | Ordinary Least Squares |
| PCA | Principal Component Analysis |
| SD | Standard Deviation |
| UNEMPLOYMENT | Unemployment Rate |
| VAR | Vector Autoregressive |
| VIF | Variance Inflation Factor |
| 2SLS | Two-Stage Least Squares |
Appendix A. Inverse Roots of AR Characteristic Polynomial (for China, the U.S., Hong Kong, and Macao)
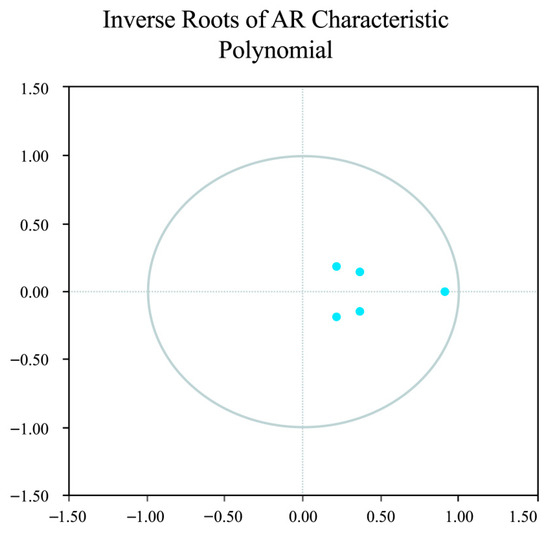
Figure A1.
China’s EPU and macroeconomic variables. Source: Prepared by the authors according to econometric data. Notes: All eigenvalues lie within the unit circle, indicating that the constructed VAR models exhibit good stability.
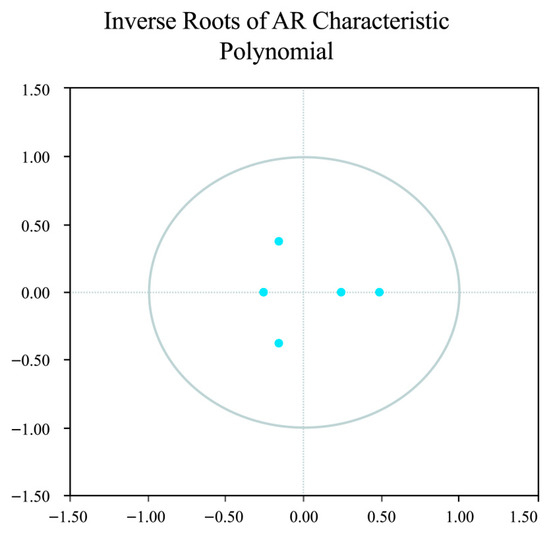
Figure A2.
The U.S. EPU and macroeconomic variables. Source: Prepared by the authors according to econometric data. Notes: All eigenvalues lie within the unit circle, indicating that the constructed VAR models exhibit good stability.
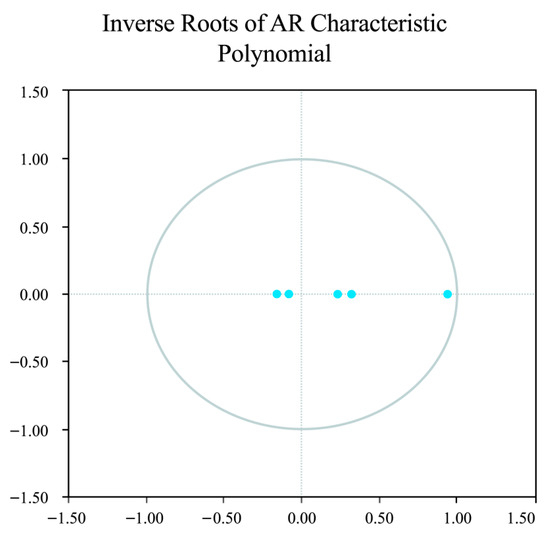
Figure A3.
Hong Kong’s EPU and macroeconomic variables. Source: Prepared by the authors according to econometric data. Notes: All eigenvalues lie within the unit circle, indicating that the constructed VAR models exhibit good stability.
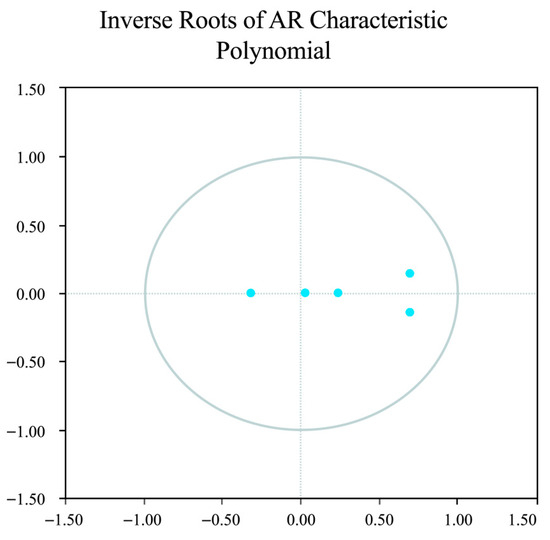
Figure A4.
Macao’s EPU and macroeconomic variables. Source: Prepared by the authors according to econometric data. Notes: All eigenvalues lie within the unit circle, indicating that the constructed VAR models exhibit good stability.
Appendix B. Orthogonal Impulse Response from EPU (for China, the U.S., Japan, India, Hong Kong, and Macao)
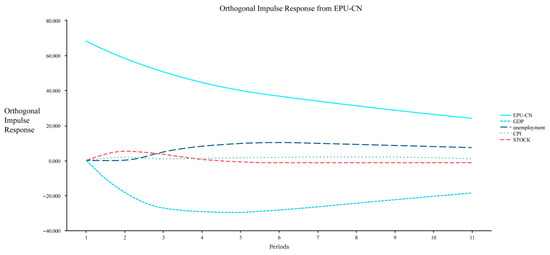
Figure A5.
Orthogonal Impulse Response from EPU—China. Source: Prepared by the authors according to econometric data.
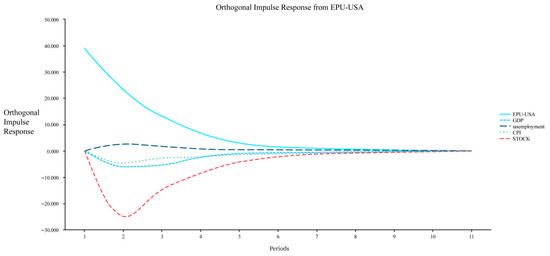
Figure A6.
Orthogonal Impulse Response from EPU—the United States. Source: Prepared by the authors according to econometric data.
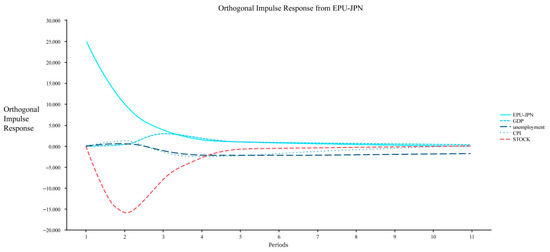
Figure A7.
Orthogonal Impulse Response from EPU—Japan. Source: Prepared by the authors according to econometric data.
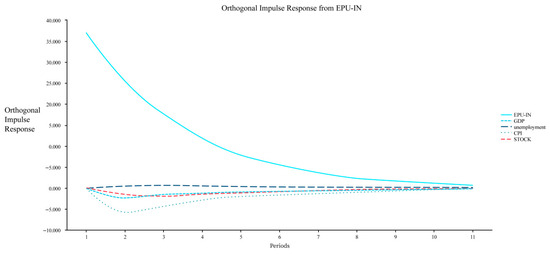
Figure A8.
Orthogonal Impulse Response from EPU—India. Source: Prepared by the authors according to econometric data.
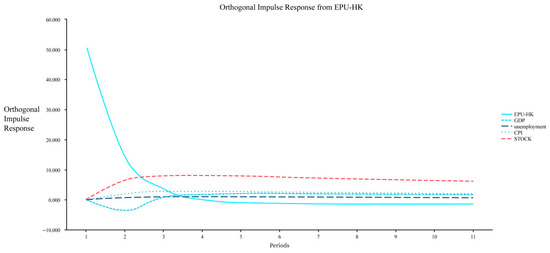
Figure A9.
Orthogonal Impulse Response from EPU—Hong Kong. Source: Prepared by the authors according to econometric data.
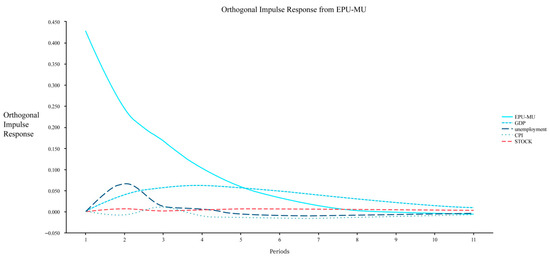
Figure A10.
Orthogonal Impulse Response from EPU—Macao. Source: Prepared by the authors according to econometric data.
Appendix C. Robustness Test Results

Table A1.
Analysis of the Variance Inflation Factor (VIF).
Table A1.
Analysis of the Variance Inflation Factor (VIF).
| Variable Category | Number of Variables | VIF Range | Severity Level | Economic Interpretation |
|---|---|---|---|---|
| CPI | 5 | 98.65–245.67 | Extreme | Global inflation synchronization and price transmission mechanisms |
| STOCK | 5 | 18.54–32.65 | Severe | Financial market integration and contagion effects |
| EPU | 3 | 10.99–15.88 | Moderate | Cross-country policy uncertainty spillovers |
| Other variables | 24 | 2.11–9.88 | Acceptable | No significant multicollinearity concerns |
Source: Prepared by the authors based on econometric data.

Table A2.
Correlations matrix for Endogeneity Diagnostics.
Table A2.
Correlations matrix for Endogeneity Diagnostics.
| Variable | USA- STOCK | USA-EPU (Endogenous) | Global-EPU (Instrument) | Japan-EPU (Instrument) | USA-GPR | USA- CPI | USA- UNEMPLOYMENT | China-EPU |
|---|---|---|---|---|---|---|---|---|
| USA-STOCK | 1.000 | |||||||
| USA-EPU | −0.345 | 1.000 | ||||||
| Global-EPU | 0.234 | 0.645 | 1.000 | |||||
| Japan-EPU | 0.267 | 0.598 | 0.723 | 1.000 | ||||
| USA-GPR | −0.289 | 0.567 | 0.456 | 0.445 | 1.000 | |||
| USA-CPI | −0.456 | 0.389 | 0.298 | 0.321 | 0.412 | 1.000 | ||
| USA-UNEMPLOYMENT | −0.412 | 0.276 | 0.198 | 0.223 | 0.309 | 0.432 | 1.000 | |
| China-EPU | 0.198 | 0.523 | 0.678 | 0.589 | 0.387 | 0.254 | 0.167 | 1.000 |
Source: Prepared by the authors based on econometric data.
References
- Ahir, H., Bloom, N., & Furceri, D. (2022). The world uncertainty index. NBER. [Google Scholar]
- Allison, G. T. (2017). Destined for war? The National Interest. [Google Scholar]
- Amr, N. (2025). China’s rise and a new perspective on hegemonic stability theory. International Journal on Culture, History, and Religion, 7, 92–112. [Google Scholar] [CrossRef]
- Baker, S. R., Bloom, N., & Davis, S. J. (2016). Measuring economic policy uncertainty. The Quarterly Journal of Economics, 131(4), 1593–1636. [Google Scholar] [CrossRef]
- Beckley, M. (2021). America is not ready for a war with China. Available online: https://www.foreignaffairs.com/articles/united-states/2021-06-10/america-not-ready-war-china (accessed on 2 August 2023).
- Belsley, D. A., Kuh, E., & Welsch, R. E. (1980). Regression diagnostics; identifying influence data and source of collinearity. Wiley. [Google Scholar]
- Berna, O., Gnabo, J.-Y., & Guilmin, G. (2016). Economic policy uncertainty and risk spillovers in the Eurozone. Journal of International Money and Finance, 65, 24–45. [Google Scholar] [CrossRef]
- Bernanke, B. S. (1983). Irreversibility, uncertainty and cyclical investment. The Quarterly Journal of Economics, 98(1), 85–106. [Google Scholar] [CrossRef]
- Biljanovska, N., Grigoli, F., & Hengge, M. (2021). Fear thy neighbor: Spillovers from economic policy uncertainty. Review of International Economics, 29(2), 409–438. [Google Scholar] [CrossRef]
- Bloom, N. (2009). The impact of uncertainty shock. Econometrica, 77(3), 623–685. [Google Scholar] [CrossRef]
- Caldara, D., & Iacoviello, M. (2022). Measuring geopolitical risk. American Economic Review, 112(4), 1194–1225. [Google Scholar] [CrossRef]
- Can, C. M., & Chan, A. (2022). Preventive or revisionist challenge during power transition? The case of China–USA strategic competition. Journal of Asian Security and International Affairs, 9(1), 7–25. [Google Scholar] [CrossRef]
- Carney, M. (2016). Uncertainty, the economy and policy—Speech by Mark Carney. Available online: https://www.bankofengland.co.uk/-/media/boe/files/speech/2016/uncertainty-the-economy-and-policy.pdf (accessed on 2 August 2023).
- Chen, C.-C., Huang, Y.-L., & Yang, F. (2024). Semantics matter: An empirical study on economic policy uncertainty index. International Review of Economics & Finance, 89, 1286–1302. [Google Scholar]
- Choi, M., Han, S. H., & Kim, D. (2025). Geopolitical risk, CEO war experience, and stock price crash risk: Evidence from Korea. Economics Letters, 255, 112560. [Google Scholar] [CrossRef]
- Choi, S. Y. (2022). Evidence from a multiple and partial wavelet analysis on the impact of geopolitical concerns on stock markets in North-East Asian countries. Finance Research Letters, 46, 102465. [Google Scholar] [CrossRef]
- Chowdhury, M. S. R., Aram, M., Javadi, S., & Nejadmalayeri, A. (2025). Geopolitical risk and corporate capital structure. Journal of Corporate Finance, 2025, 102796. [Google Scholar] [CrossRef]
- Chuang, C.-C., Kuan, C.-M., & Lin, H.-Y. (2009). Causality in quantiles and dynamic stock return-volume relations. Journal of Banking & Finance, 33(7), 1351–1360. [Google Scholar]
- Cole, D. (2023). Graham Allison & Thucydides trap. Overview & History. Available online: https://study.com/learn/lesson/thucydides-trap-overview-theory-historical-examples.html (accessed on 28 November 2023).
- Çolak, G., Durnev, A., & Qian, Y. (2017). Political uncertainty and IPO activity: Evidence from U.S. gubernatorial elections. Journal of Financial and Quantitative Analysis, 52, 2523–2564. [Google Scholar] [CrossRef]
- Das, D., Kannadhasan, M., & Bhattacharyya, M. (2019). Do the emerging stock markets react to international economic policy uncertainty, geopolitical risk and financial stress alike? North American Journal of Economics and Finance, 48, 1–19. [Google Scholar] [CrossRef]
- Dixit, A. K., & Pindyck, R. S. (1994). Investment under uncertainty. Princeton University Press. [Google Scholar]
- Dong, L., Hidthiir, M. H. B., & Mansur, M. B. (2025). Economic policy uncertainty and China’s FDI inflows: Moderating effects of financial development and political stability. Journal of Risk and Financial Management, 18(7), 354. [Google Scholar] [CrossRef]
- Engle, R. F. (1982). Autoregressive conditional heteroscedasticity with estimates of the variance of United Kingdom inflation. Econometrica, 50(4), 987–1007. [Google Scholar] [CrossRef]
- Engle, R. F. (2002). Dynamic conditional correlation: A simple class of multivariate generalized autoregressive conditional heteroskedasticity models. Journal of Business & Economic Statistics, 20(3), 339–350. [Google Scholar]
- Fontaine, I., Gálvez-Iniesta, I., Gomes, P., & Vila-Martin, D. (2020). Labour market flows: Accounting for the public sector. Labour Economics, 62, 101770. [Google Scholar] [CrossRef]
- Forbes, K. J., & Warnock, F. E. (2012). Capital flow waves: Surges, stops, flight, and retrenchment. Journal of International Economics, 88(2), 235–251. [Google Scholar] [CrossRef]
- Garba, M. K. (2025). Power, protectionism, and the global economy: A political economy analysis of the United States of America–China tariff conflict between 2020 and 2025. Spring Journal of Arts, Humanities and Social Sciences, 4(7), 22–27. [Google Scholar] [CrossRef]
- Gilpin, R. (1987). The political economy of international relations. Princeton University Press. [Google Scholar]
- Gilpin, R. (1988). The theory of hegemonic war. The Journal of Interdisciplinary History, 18(4), 591–613. [Google Scholar] [CrossRef]
- Granger, C. W. J. (1969). Investigating causal relations by econometric models and cross spectral methods. Econometrica, 37(3), 424–438. [Google Scholar] [CrossRef]
- Gulen, H., & Ion, M. (2016). Policy uncertainty and corporate investment. Review of Financial Studies, 29, 523–564. [Google Scholar] [CrossRef]
- Guo, P., Zhu, H., & You, W. (2018). Asymmetric dependence between economic policy uncertainty and stock market returns in G7 and BRIC: A quantile regression approach. Finance Research Letters, 25(C), 251–258. [Google Scholar] [CrossRef]
- Hausman, J. (1978). Specification tests in econometrics. Econometrica, 46, 1251–1271. [Google Scholar] [CrossRef]
- Huang, Y., & Luk, P. (2020). Measuring economic policy uncertainty in China. China Economic Review, 59, 101367. [Google Scholar] [CrossRef]
- Ikenberry, G. J. (2011). Liberal Leviathan: The origins, crisis, and transformation of the American world order. Princeton University Press. [Google Scholar]
- Ikenberry, G. J. (2020). A world safe for democracy: Liberal internationalism and the crises of global order. Yale University Press. [Google Scholar]
- Johnston, A. I. (2013). How new and assertive is China’s new assertiveness? International Security, 37(4), 7–48. [Google Scholar] [CrossRef]
- Kannadhasan, M., & Das, D. (2020). Do Asian emerging stock markets react to international economic policy uncertainty and geopolitical risk alike? A quantile regression approach. Finance Research Letters, 34, 101276. [Google Scholar] [CrossRef]
- Kido, Y. (2018). The transmission of US economic policy uncertainty shocks to Asian and global financial markets. The North American. Journal of Economics and Finance, 46, 222–231. [Google Scholar] [CrossRef]
- Kwon, D. (2025). Oil shocks, US uncertainty, and emerging corporate bond markets. Journal of Risk Financial Management, 18(1), 25. [Google Scholar] [CrossRef]
- Leone, M., Manelli, A., & Pace, R. (2025). Dynamic connectedness among energy markets and EUA climate credit: The role of GPR and VIX. Journal of Risk and Financial Management, 18(8), 462. [Google Scholar] [CrossRef]
- Luk, P. (2018). Economic policy uncertainty index for Macao. Macao Monetary Research Bulletin, 50, 75–88. [Google Scholar]
- Lutkepohl, H. (2005). New introduction to multiple time series analysis. Springer. [Google Scholar]
- Mastanduno, M. (2019). Liberal hegemony, international order, and US foreign policy: A reconsideration. British Journal of Politics & International Relations, 21(3), 136914811879196. [Google Scholar]
- Mastro, O. S. (2019). The costs of conversation: Obstacles to peacemaking in Asia. Cornell University Press. [Google Scholar]
- Mawusi, C. (2020). Economic policy uncertainty and international trade: A gravity model approach. License: CC BY 4.0. Available online: https://www.researchsquare.com/article/rs-129375/v1 (accessed on 28 November 2023). [CrossRef]
- Nguyen, N. H., & Phan, H. V. (2017). Policy uncertainty and mergers and acquisitions. Journal of Financial and Quantitative Analysis, 52(2), 613–644. [Google Scholar] [CrossRef]
- Nye, J. S. (2022). Do morals matter? Presidents and foreign policy from FDR to trump. Oxford University Press. [Google Scholar]
- Organski, A. F. K., & Kugler, J. (1980). The war ledger. University of Chicago Press. [Google Scholar]
- Oztekin, A., Delen, D., Turkyilmaz, A., & Zaim, S. (2013). A machine learning-based usability evaluation method for eLearning systems. Decision Support Systems, 56, 63–73. [Google Scholar] [CrossRef]
- Pan, C. (2019). Rethinking Chinese power: A conceptual corrective to the “Power Shift” narrative. Asian Perspective, 38(3), 387–410. [Google Scholar] [CrossRef]
- Pu, X. (2022). The status dilemma in world politics: An anatomy of the China–India asymmetrical rivalry. The Chinese Journal of International Politics, 15(3), 227–245. [Google Scholar] [CrossRef]
- Ramsey, J. B. (1969). Tests for specification errors in classical linear least squares regression analysis. Journal of the Royal Statistical Society Series B, 31, 350–371. [Google Scholar] [CrossRef]
- Ruiz, E., & Nieto, F. H. (2000). A note on linear combination of predictors. Statistics and Probability Letters, 47(4), 351–356. [Google Scholar] [CrossRef]
- Schweller, R. L., & Pu, X. (2011). After unipolarity: China’s visions of international order in an era of U.S. decline. International Security, 36(1), 41–72. [Google Scholar] [CrossRef]
- Sevim, C., Oztekin, A., Bali, O., Gumus, S., & Guresen, E. (2014). Developing an early warning system to predict currency crises. European Journal of Operational Research, 237(3), 1095–1104. [Google Scholar] [CrossRef]
- Sheng, L., & Nascimento, D. F. (2021). The belt and road initiative in south–south cooperation: The impact on world trade and geopolitics. Springer. [Google Scholar]
- Sims, C. A. (1980). Macroeconomics and reality. Econometrica, 48(1), 1–48. [Google Scholar] [CrossRef]
- Staiger, D., & Stock, J. H. (1997). Instrumental variables regression. Econometrica, 65, 557–586. [Google Scholar] [CrossRef]
- Stock, J. H., & Watson, M. W. (2002). Forecasting using principal components from a large number of predictors. Journal of the American Statistical Association, 97(460), 1167–1179. [Google Scholar] [CrossRef]
- Tam, P. S. (2020). Global impacts of China-US trade tensions. Journal of International Trade and Economic Development, 29, 510–545. [Google Scholar] [CrossRef]
- Troster, V., Shahbaz, M., & Uddin, G. S. (2018). Renewable energy, oil prices, and economic activity: A Granger-causality in quantiles analysis. Energy Economics, 70, 440–452. [Google Scholar] [CrossRef]
- Wei, S. J. (1995). The open door policy and China’s rapid growth. NBER Working Paper. Available online: https://www.nber.org/system/files/chapters/c8545/c8545.pdf (accessed on 2 August 2023).
- Welsh, S. (2019). Can China continue to rise peacefully? (pp. 1–9) E-International Relations. Available online: https://www.e-ir.info/2019/02/21/can-china-continue-to-rise-peacefully/ (accessed on 2 August 2023).
- White, H. (1980). A heteroscedasticity-consistent covariance matrix estimator and a direct test for heteroscedasticity. Econometrica, 48(4), 817–838. [Google Scholar] [CrossRef]
- Wu, W.-L., & Shao, C. (2023). How does home and host-country policy uncertainty affect outward FDI? Firm-level evidence from China. Economia Politica, 40, 495–515. [Google Scholar] [CrossRef]
- Yaqoob, M., Bani, Y., Ishak, S., & Rosland, A. (2024). Impact of demographic dividend on economic growth in developing countries. Thailand and The World Economy, 42(3), 236–252. [Google Scholar]
- Yoder, B. K. (2019). Uncertainty, shifting power and credible signals in US-China Relations: Why the “Thucydides Trap” is real, but limited. Journal of Chinese Political Science, 24, 87–104. [Google Scholar] [CrossRef]
- Zhang, L., & Colak, G. (2022). Foreign direct investment and economic policy uncertainty in China. Economic and Political Studies, 10(3), 279–289. [Google Scholar] [CrossRef]
- Zhang, Y. (2024). The United States, China, and planetary solidarity. Georgetown Journal of International Affairs, 25(1), 144–150. [Google Scholar] [CrossRef]
- Zheng, Y., & Li, J. (2022). The third wave of China’s open door policy. ARPE, 1(1), 2. [Google Scholar] [CrossRef]
Disclaimer/Publisher’s Note: The statements, opinions and data contained in all publications are solely those of the individual author(s) and contributor(s) and not of MDPI and/or the editor(s). MDPI and/or the editor(s) disclaim responsibility for any injury to people or property resulting from any ideas, methods, instructions or products referred to in the content. |
© 2025 by the authors. Licensee MDPI, Basel, Switzerland. This article is an open access article distributed under the terms and conditions of the Creative Commons Attribution (CC BY) license (https://creativecommons.org/licenses/by/4.0/).