1. Introduction
The outbreak of COVID-19 was first detected in December 2019, following reports of an unidentified pneumonia in Wuhan, China. By early January 2020, Chinese officials confirmed that a novel coronavirus—subsequently named SARS-CoV-2—was responsible for the illness. Toward the end of January, the World Health Organization (WHO) declared a public health emergency, and by March, it had formally recognized the outbreak as a global pandemic (
WHO, 2020). Over the following months, countries worldwide implemented strict lockdowns and travel restrictions to contain the virus, while healthcare systems faced unprecedented challenges (
McKibbin & Fernando, 2020).
The outbreak of COVID-19 caused substantial disruptions in global financial markets and exchange rate dynamics, leading to heightened volatility worldwide (
Ghosh, 2020). In the early stages of the crisis, investors flocked to safe-haven assets like the US dollar (USD), Japanese yen (JPY), and Swiss franc (CHF), leading to sharp fluctuations in currency values (
Ghosh, 2020). Central banks worldwide, including the Federal Reserve, the European Central Bank (ECB), and the Bank of England (BoE), lowered interest rates to historically low levels to stimulate economic activity, which, in turn, had a depreciating effect on their respective currencies (
Cook et al., 2021). According to the October 2021 edition of the World Economic Outlook by the International Monetary Fund (IMF), the global economy contracted by approximately 3.2% in 2020 (
CRS, 2021). Between 14 February and 23 March 2020, the Dow Jones Industrial Average (DJIA), along with other major indices, lost approximately one-third of its value (
CRS, 2021). However, starting in March, the index began a steady recovery, gaining momentum through the fall. On 9 November 2020, the DJIA surged by nearly 3% following reports that a COVID-19 vaccine had been developed (
CRS, 2021).
The currency of Mauritania is the Ouguiya (MRU), and its official exchange rate regime is floating (
IMF, 2020). The Central Bank of Mauritania (BCM) intervenes to stabilize the exchange rate and maintain its official reserves, publishing daily on its website the total market bids and asks, the amounts settled at the fixing rate, and a summary of market turnover. Since May 2020, the MRU has appreciated within a 2% band against the US dollar, making the de facto exchange rate regime a “crawl”-type system (
IMF, 2020).
In 2021, Mauritania returned to growth (+2.4%), supported by consumption, investment, and the recovery of the services sector, despite a decline in gold production at Taziast (
World Bank, 2020). Inflation rose to 3.5%, mainly due to food prices, while the exchange rate remained stable and government measures helped reduce extreme poverty. The pandemic had a significantly lower impact than in 2020 (
World Bank, 2020).
In the context of the Mauritanian economy, the COVID-19 pandemic has negatively affected economic activity worldwide, both in terms of global supply and global demand (
Ministry of Commerce and Tourism, 2022). Mauritania, like other countries, was also impacted by COVID-19, causing a contraction in economic activity, which spread to all sectors (
Ministry of Commerce and Tourism, 2022). At the level of the primary sector, growth stood at −5.4% (
Ministry of Commerce and Tourism, 2022).
At the level of the tertiary sector, which represents more than 42% of overall GDP, the preventive measures taken by the authorities to stem the pandemic have contributed greatly to the underperformance of the sector (
Ministry of Commerce and Tourism, 2022).
Services which constitute the most important sub-sector in terms of weight (nearly 20% of GDP). It experienced a decline compared to 2019 to stand at 0.7% (
Ministry of Commerce and Tourism, 2022).
Inspired by this context, we investigate the impact of the COVID-19 pandemic on currency markets, with a particular focus on the Mauritanian Ouguiya. This study analyzes the effects of COVID-19 on the exchange rate volatility of the euro and the US dollar against the Ouguiya.
The reported findings are based on a comparison between two distinct periods: one before the onset of COVID-19 and another after its emergence. We analyze these two periods to identify the key changes in volatility parameters. The first period spans from January 2017 to December 2019, a time unaffected by the COVID-19 pandemic, while the second period, covering the COVID-19 era, extends from January 2017 to December 2021. Both symmetric and asymmetric models are employed in this study to conduct the analysis. First, we will outline the theoretical basis of each model. Then, we will assess essential model characteristics, including stationarity, ARCH effects, and autocorrelation. Following this, we will estimate the parameters of the standard GARCH model and subsequently those of the asymmetric models, emphasizing a comparison between the pre-COVID and post-COVID-19 periods. Lastly, we will examine the stylized facts and interpret the findings.
Numerous studies have addressed this topic, producing rich findings that have significantly advanced our understanding of the challenges encountered in empirical analyses of exchange rate dynamics.
The modeling of exchange rate volatility has been a central topic in empirical finance, with ARCH and GARCH-type models providing robust frameworks to capture the persistence and clustering of volatility.
One of the earliest uses of the ARCH model in the context of exchange rates was by
Hsieh (
1989), in his paper
Modeling Heteroscedasticity in Daily Foreign-Exchange Rates. He analyzed daily exchange rate data over a ten-year period for five major currencies to capture time-varying volatility.
Dritsaki (
2019) investigated monthly returns of the EUR/USD exchange rate from August 1953 to January 2017, using 763 observations. By applying ARCH, GARCH, and EGARCH models, she found that the ARIMA(0,0,1)-EGARCH(1,1) specification provided the best fit for modeling both return behavior and leverage effects. The study also noted that this model’s static forecasting method yielded better results than its dynamic form. In Vietnam,
Thuy and Thuy (
2019) conducted an empirical analysis on exchange rate volatility using 330 monthly observations from January 1990 to June 2017. Their findings indicated that the ARMA(1,0)-GARCH(1,2) model effectively captured the average behavior and volatility of USD/VND and GBP/VND exchange rates, while the ARMA(1,0)-GARCH(1,1) model was more suitable for JPY/VND and CAD/VND.
Epaphra (
2017) studied exchange rate fluctuations in Tanzania using daily TZS/USD rates from 4 January 2009, to 27 July 2015. By employing ARCH, GARCH(1,1), and EGARCH models, the study concluded that the GARCH(1,1) model most effectively captured volatility dynamics and exhibited strong forecasting performance.
Yunusa (
2020) investigated the impact of exchange rate volatility on Nigeria’s crude oil exports to several trading partners—including the UK, USA, Italy, France, Spain, Canada, and Brazil—using monthly data from January 2006 to December 2019. The findings confirmed that exchange rate volatility had a significant impact on oil export volumes across all partners, albeit with varying intensities.
Ciftci and Durusu-Ciftci (
2021) analyzed the impact of exchange rate volatility on Turkey’s exports to key partners such as Belgium, France, Germany, Italy, Netherlands, Russia, Spain, the UK, and the USA over the 2002–2019 period. The results suggested an inverse effect of volatility depending on the timeframe: while low volatility supported short-term export growth, high volatility was linked to a long-term decline in exports.
Benzid (
2020) used a GARCH(1,1) model to assess the impact of COVID-19 cases and deaths on exchange rate volatility in the United States. Her findings revealed a positive relationship between rising pandemic indicators and the volatility of the USD/EUR, USD/CNY, and USD/GBP exchange rates. Finally,
Enumah and Adewinbi (
2022) used symmetric GARCH and asymmetric GJR-GARCH(1,1) and EGARCH(1,1) models to analyze PLN/EUR and PLN/USD exchange rate volatility in Poland between January 2015 and July 2022. The study concluded that USD exchange rates were more sensitive to market events than the EUR, and that volatility effects tended to persist longer after crises, especially for the euro.
These studies on exchange rate volatility provide a foundation for understanding time-varying risk, and similar GARCH-type methodologies have also been applied extensively in the context of stock markets to assess market reactions and volatility patterns.
Endri et al. (
2021) evaluated the behavior of stock prices on the Indonesia Stock Exchange during the COVID-19 pandemic using an event study approach combined with a GARCH model. By analyzing the Composite Stock Price Index (JCI) and LQ-45 component stocks from 6 January to 16 March 2020, the study showed that returns reacted negatively to the COVID-19 outbreak, and market volatility spiked dramatically.
Chen (
2023) explored the volatility of S&P 500 returns by applying several GARCH-type models to compare the effects of the 2008 Global Financial Crisis and the COVID-19 crisis. The results highlighted that the GJR-GARCH model performed more effectively during the 2008 period, whereas the EGARCH model performed better amid the COVID-19 crisis.
Wang et al. (
2021) focused on the Chinese stock market’s volatility by analyzing returns from the Shanghai Composite Index and Shenzhen Component Index. Their findings showed that the ARMA(4,4)-GARCH(1,1) model with a Student’s t-distribution gave the most accurate forecasts for Shanghai, while ARMA(1,1)-TGARCH(1,1) was best suited for Shenzhen’s volatility patterns.
Overall, the literature provides strong evidence that exchange rate and stock market volatilities exhibit persistence, asymmetry, and sensitivity to external shocks. While stock market studies highlight the broader implications of crises on financial stability, the exchange rate literature offers a direct perspective on currency dynamics, making the latter particularly relevant to the Mauritanian context. The present study contributes to this line of research by analyzing the volatility of the Mauritanian Ouguiya exchange rates against the euro and the US dollar before, during, and after the COVID-19 pandemic.
2. Materials and Methods
In 1986, Tim Bollerslev introduced the GARCH model, as an extension of the ARCH model. This model allows the variance dynamics to depend on its own past values and past squared errors. A process
satisfies the GARCH(p, q) representation if
where the conditional variance
is defined as
Here, denotes weak white noise such that and . The term represents the conditional variance, with the following conditions: , for , for , and .
The coefficients for must be positive to ensure a positive variance.
If an upward or downward shock occurs at time , it is highly likely that the value of will be affected in the same direction, either upwards or downwards.
If for , this indicates that the series does not exhibit time-varying variance.
This model incorporates lags of the variance as autoregressive terms.
The conditional variance depends on past shocks, represented by the squared errors , as well as on its own past values at time .
2.1. Exponential GARCH Model
Asymmetric GARCH models incorporate asymmetry in the response to price variations. These models are designed to capture the asymmetric responses of changing variance to shocks while ensuring that the variance remains positive. This specification adapts the GARCH model by allowing for negative parameters, thereby lifting the non-negativity constraints typically imposed on the coefficients.
Unlike the classic GARCH model, which directly models , the EGARCH model uses the logarithm of the conditional variance. This ensures positivity of without requiring explicit constraints on the parameters.
Parameters:
: Constant representing the baseline level of volatility.
: Coefficients capturing he effect of past past shocks (ARCH terms), measuring the magnitude of past innovations.
: Coefficients reflecting the persistence or memory effect of volatility through lagged log-variances (GARCH terms).
: Asymmetry parameters important for modeling the leverage effect.
p: Number of ARCH terms (lags of past shocks).
q: Number of GARCH terms (lags of past conditional variances).
r: Number of asymmetric terms.
The term captures the asymmetry in how shocks affect volatility. When , it means that negative shocks (bad news) cause volatility to rise more than positive shocks of the same magnitude.
2.2. Glosten-Jagannathan-Runkle Model (GJR-GARCH)
The GJR-GARCH model is designed to capture the asymmetric behavior of financial market returns. This model posits that investors respond more strongly to losses than to gains, highlighting the concept of leverage.
A process
satisfies the GJR-GARCH(p, q) representation if and only if
where the conditional variance
is defined as
In this expression, the normalized residual
is weak white noise, and
denotes the indicator function so that
The constant represents the coefficient of leverage.
In this study, the GARCH models are estimated using the logarithmic returns of the EUR/MRU and USD/MRU exchange rates rather than the raw levels. This approach ensures the stationarity of the series, which is essential for correctly applying conditional volatility models.
We define the logarithmic returns of the exchange rate series as
where:
is the logarithmic return at time t,
is the exchange rate (EUR/MRU or USD/MRU) at time t,
is the exchange rate at time .
These returns are used as the dependent variable in all GARCH-type models (GARCH(1,1), EGARCH, GJR-GARCH) to ensure stationarity and proper modeling of conditional volatility. This transformation is standard in financial econometrics and allows the interpretation of shocks in relative terms, facilitating the comparison of volatility dynamics across periods, including pre-COVID and COVID-19.
In this study, the model parameters were estimated using **maximum likelihood estimation (MLE)**, assuming a **conditional normal distribution** for the residuals. Robust standard errors (Bollerslev–Wooldridge) were computed for all model parameters to provide reliable inference in the presence of heteroskedasticity, although only the results with conventional standard errors are presented in the table.
2.3. Data
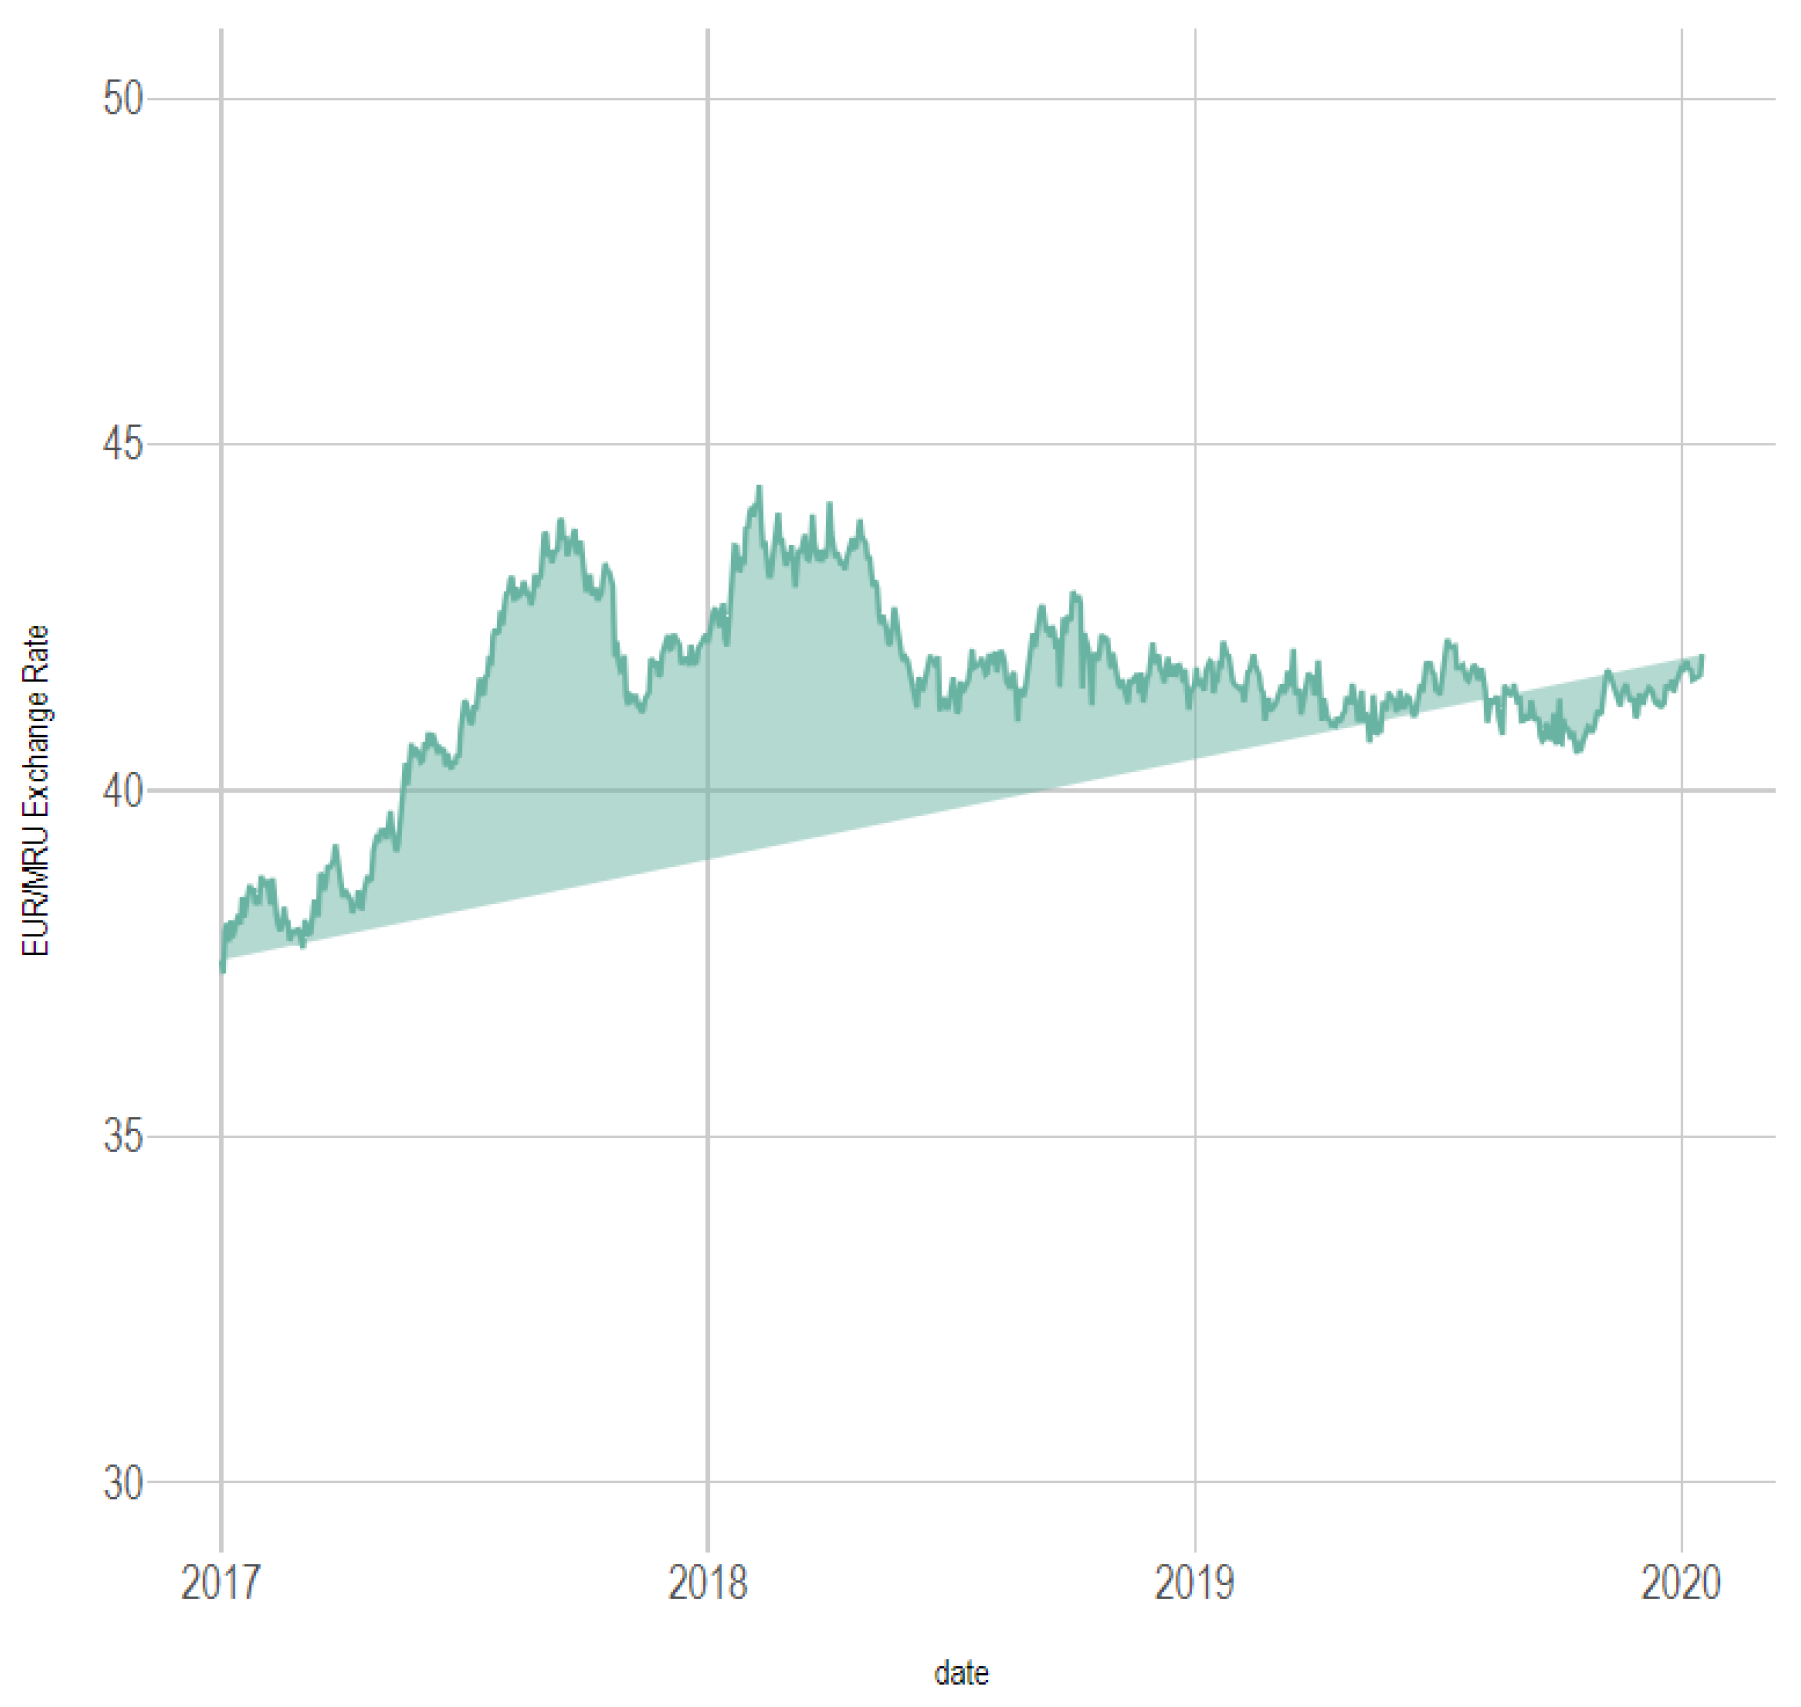
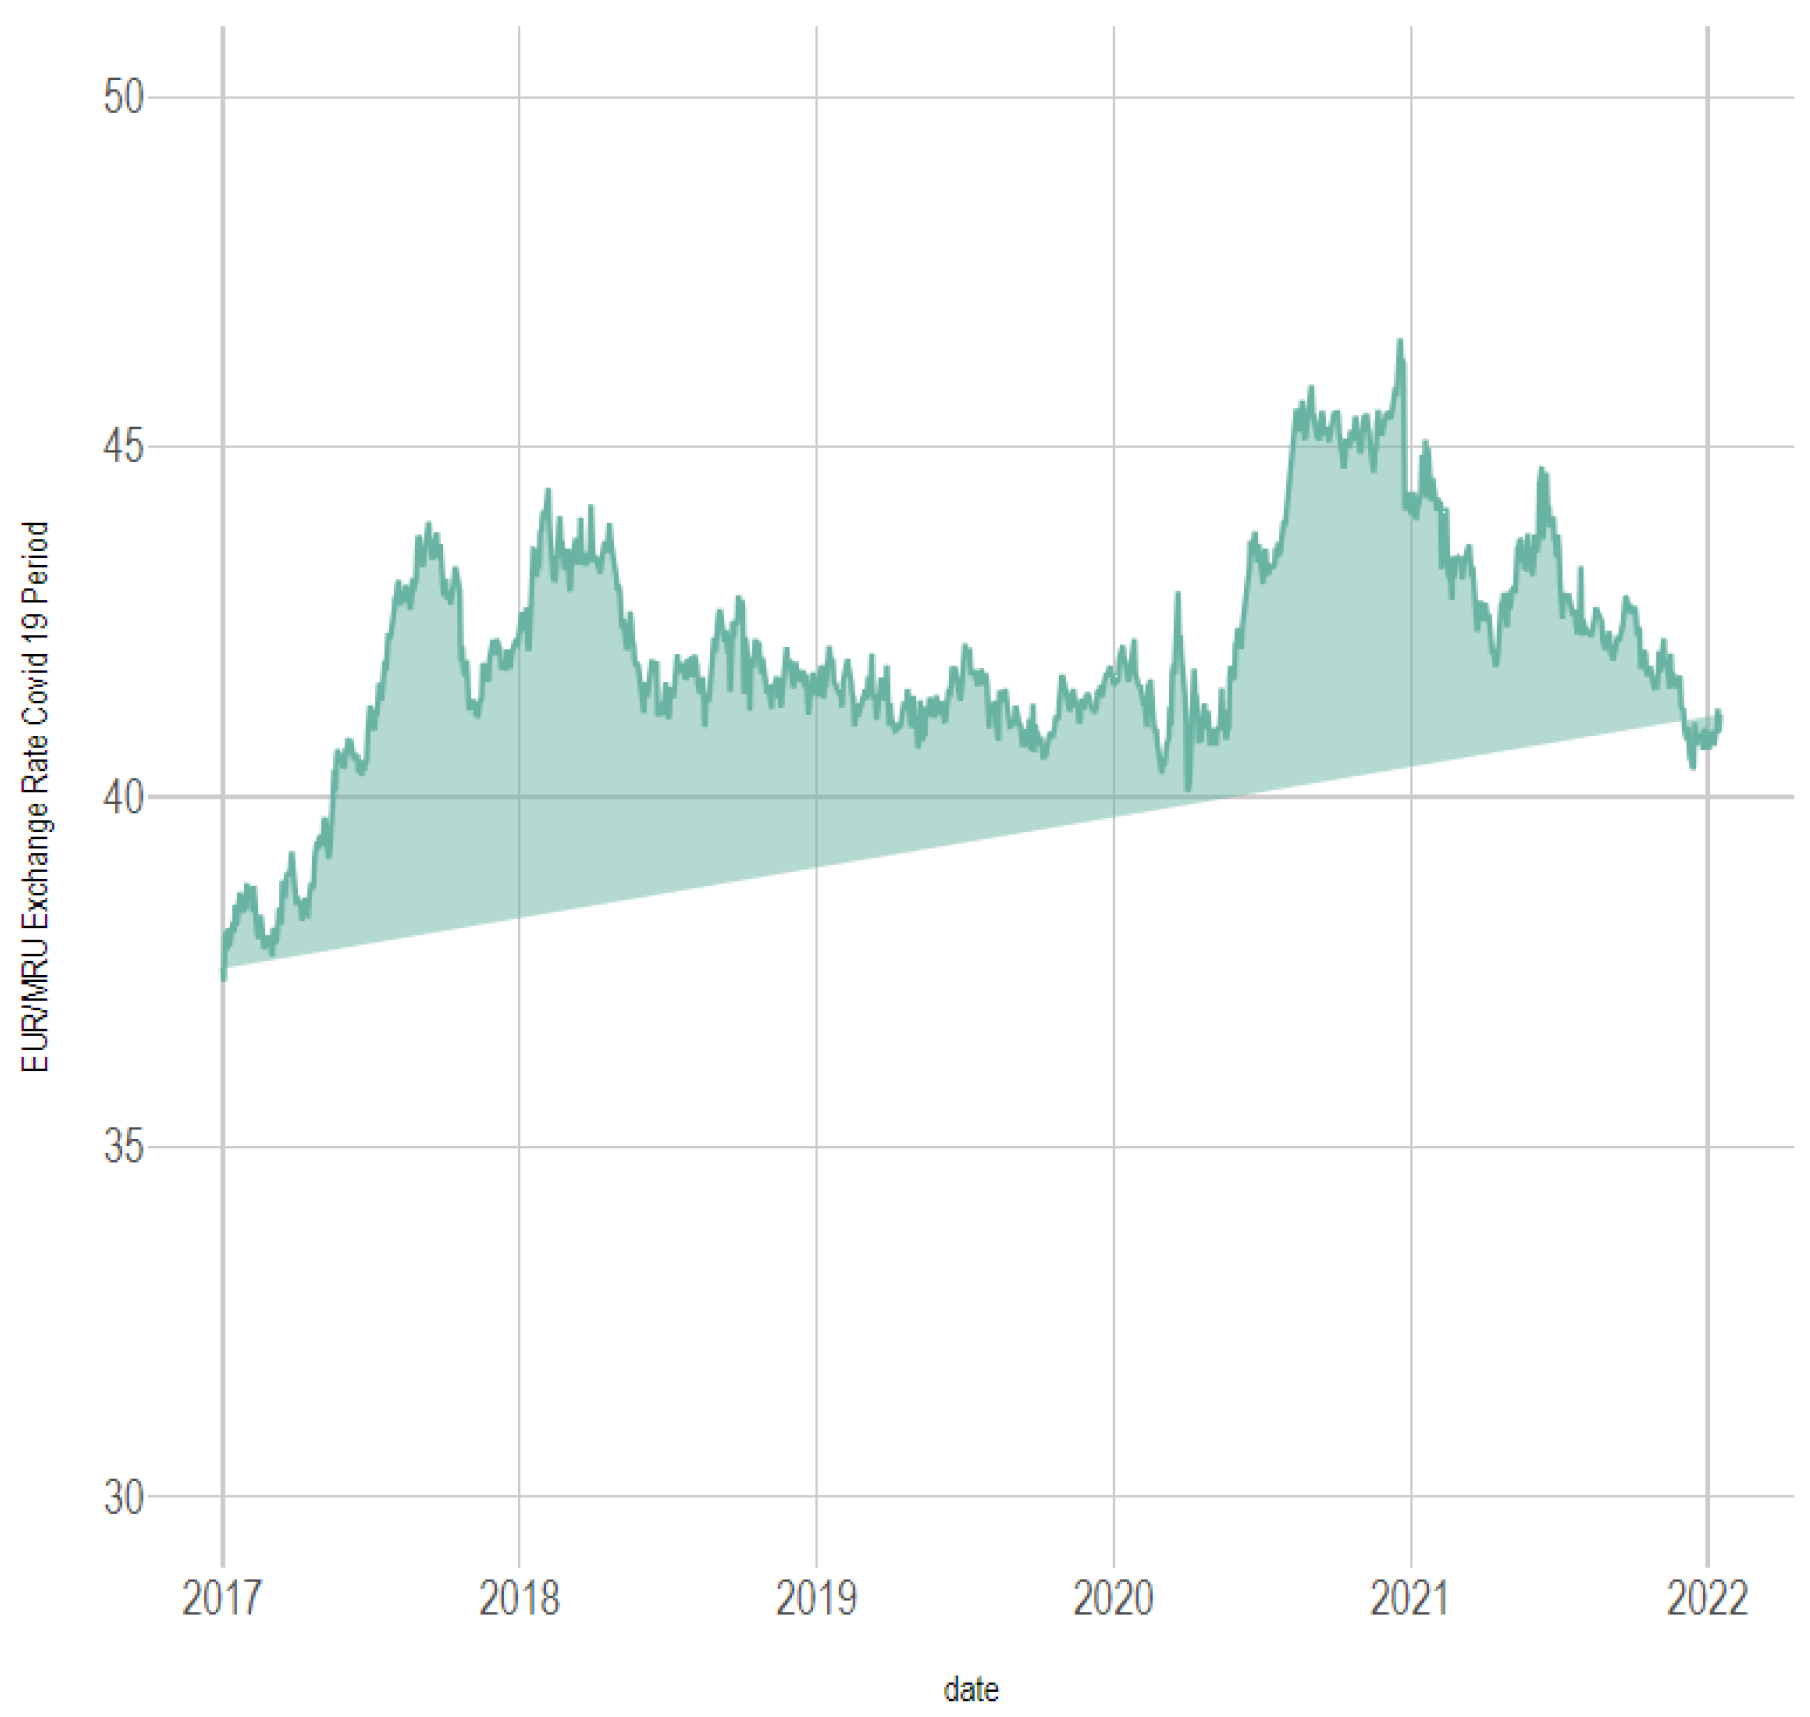
The analysis in this study is based on daily exchange rates of the euro and the US dollar relative to the Mauritanian Ouguiya (EUR/MRU and USD/MRU), sourced from the Central Bank of Mauritania, which provides open-access data. The dataset was inspected for missing entries and irregularities, and any gaps were filled using linear interpolation to ensure the continuity of the time series.
For volatility analysis, the exchange rate series were converted into logarithms, and returns were calculated using successive log differences.
To assess the effects of the COVID-19 pandemic, the dataset is split into two distinct periods:
Pre-COVID period: January 2017–December 2019, representing a period unaffected by the pandemic.
COVID period: January 2017–December 2021, encompassing the period before, during, and after the COVID-19 crisis.
This segmentation facilitates a comparative examination of exchange rate behavior across the two periods, with particular attention to the stability of the Mauritanian Ouguiya against both the euro and the US dollar.
Use of R Software
All empirical analyses in this study were performed using the R statistical software (version 4.x). R was chosen for its flexibility, reproducibility, and the availability of advanced econometric and visualization tools. The main package employed for volatility modeling was rugarch, which provides a comprehensive framework for specifying and estimating GARCH-type models through functions such as ugarchspec, ugarchfit, ugarchforecast, and ugarchroll. The forecast package was used for forecasting diagnostics.
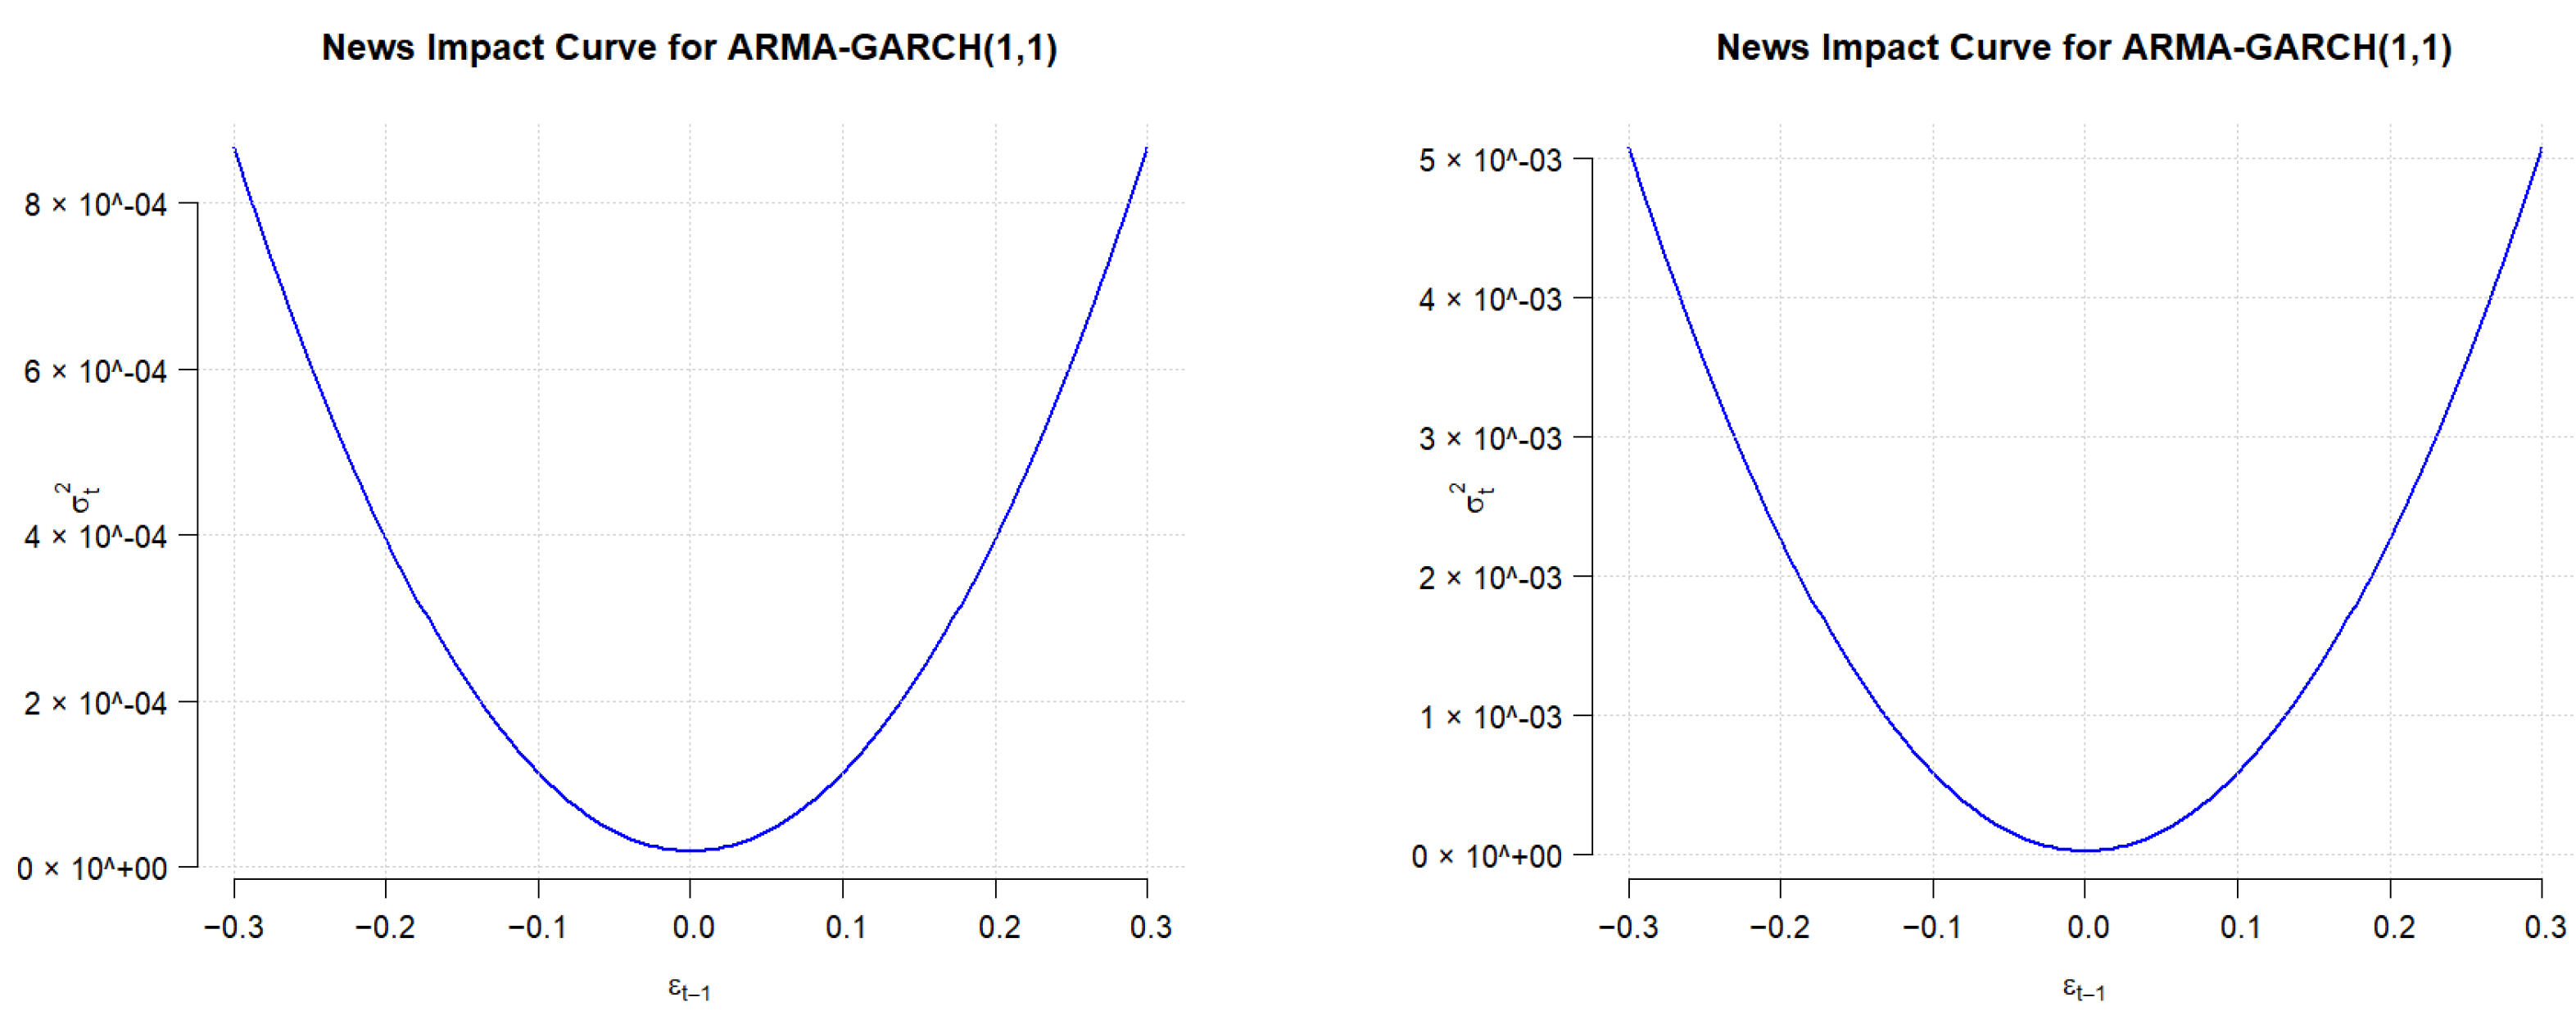
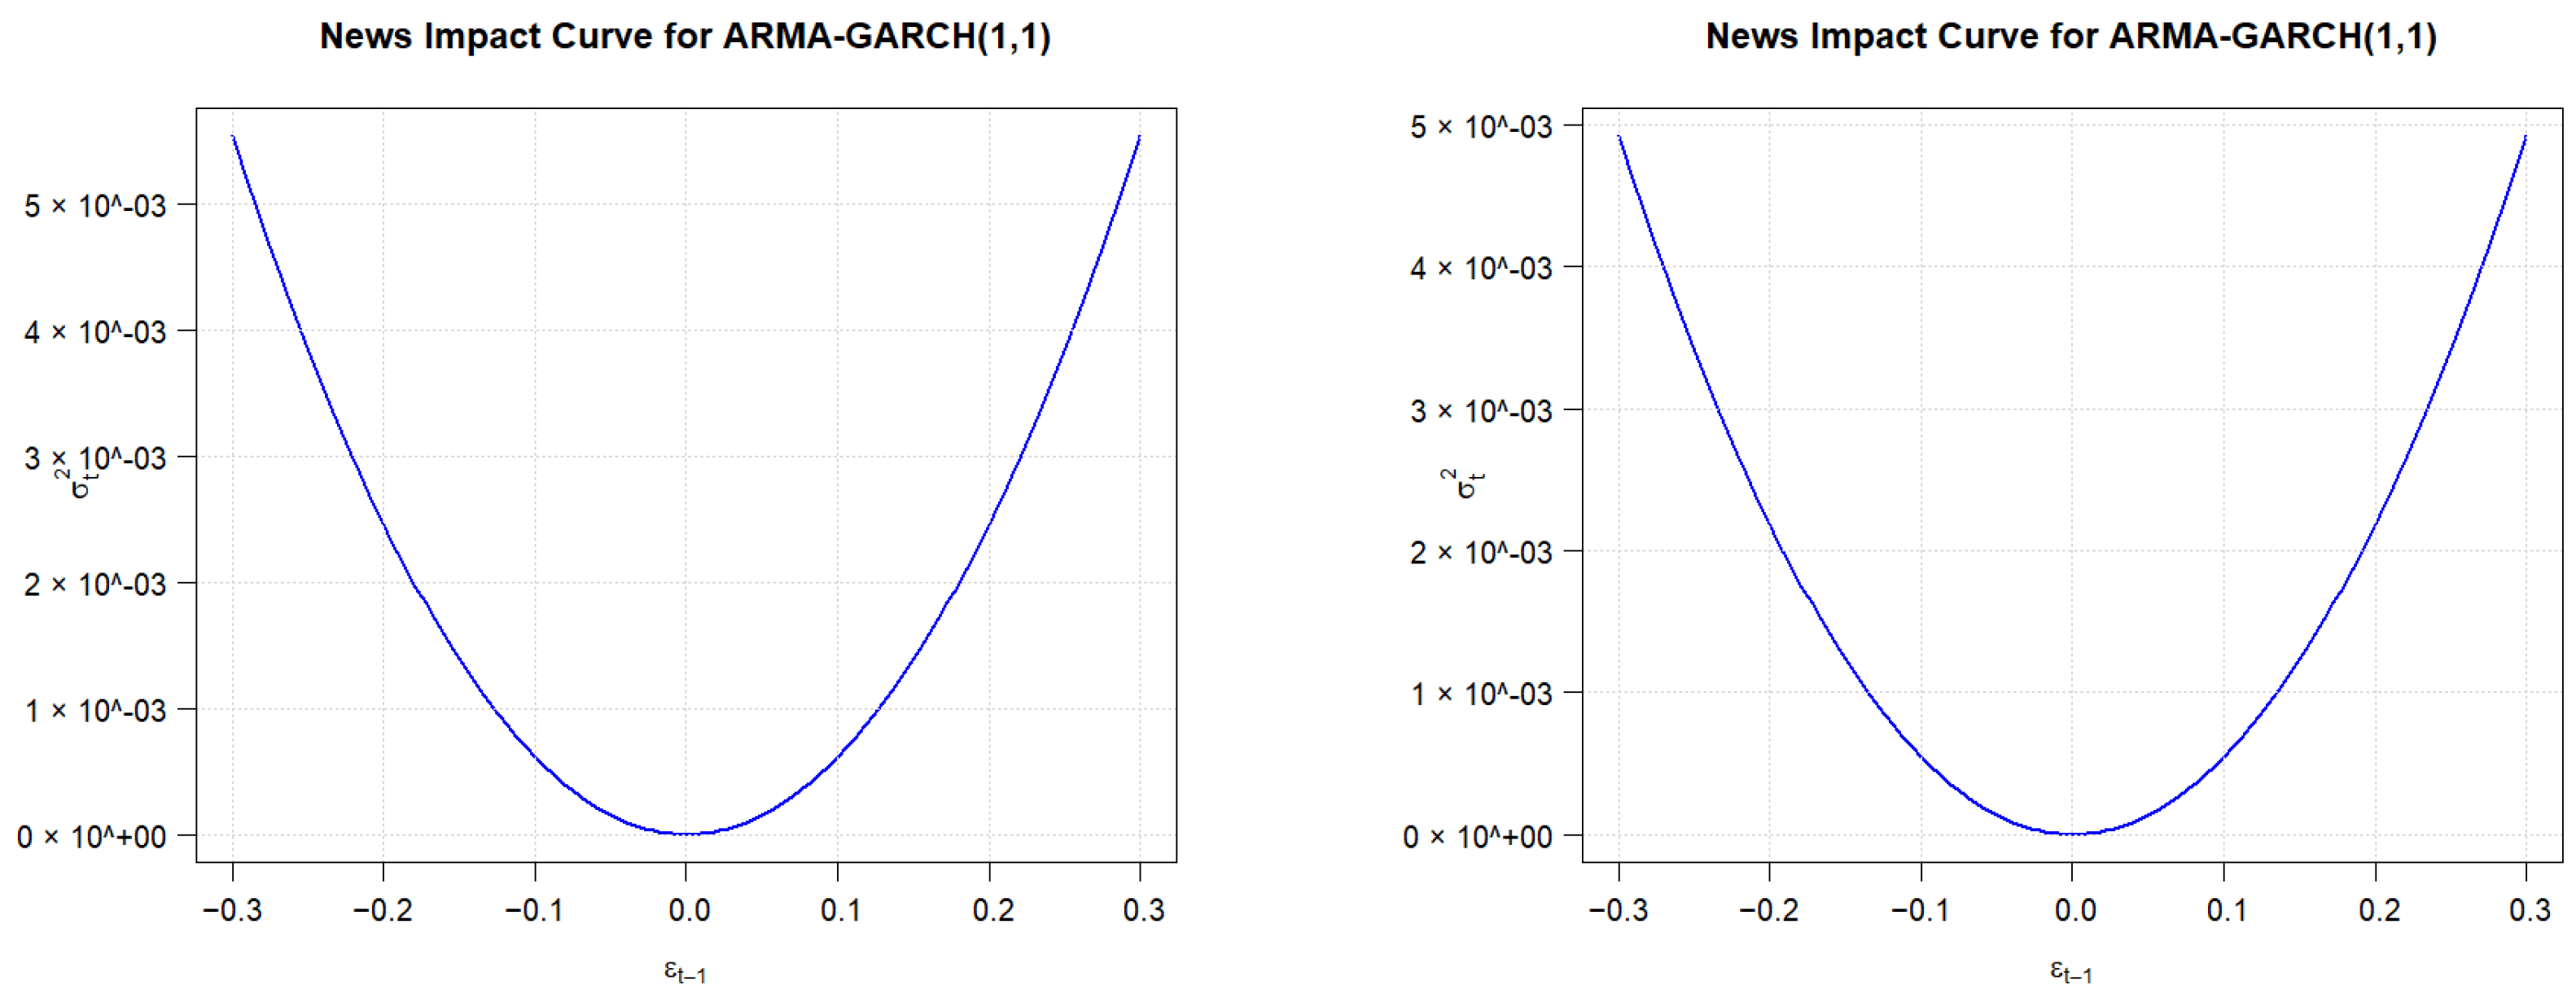
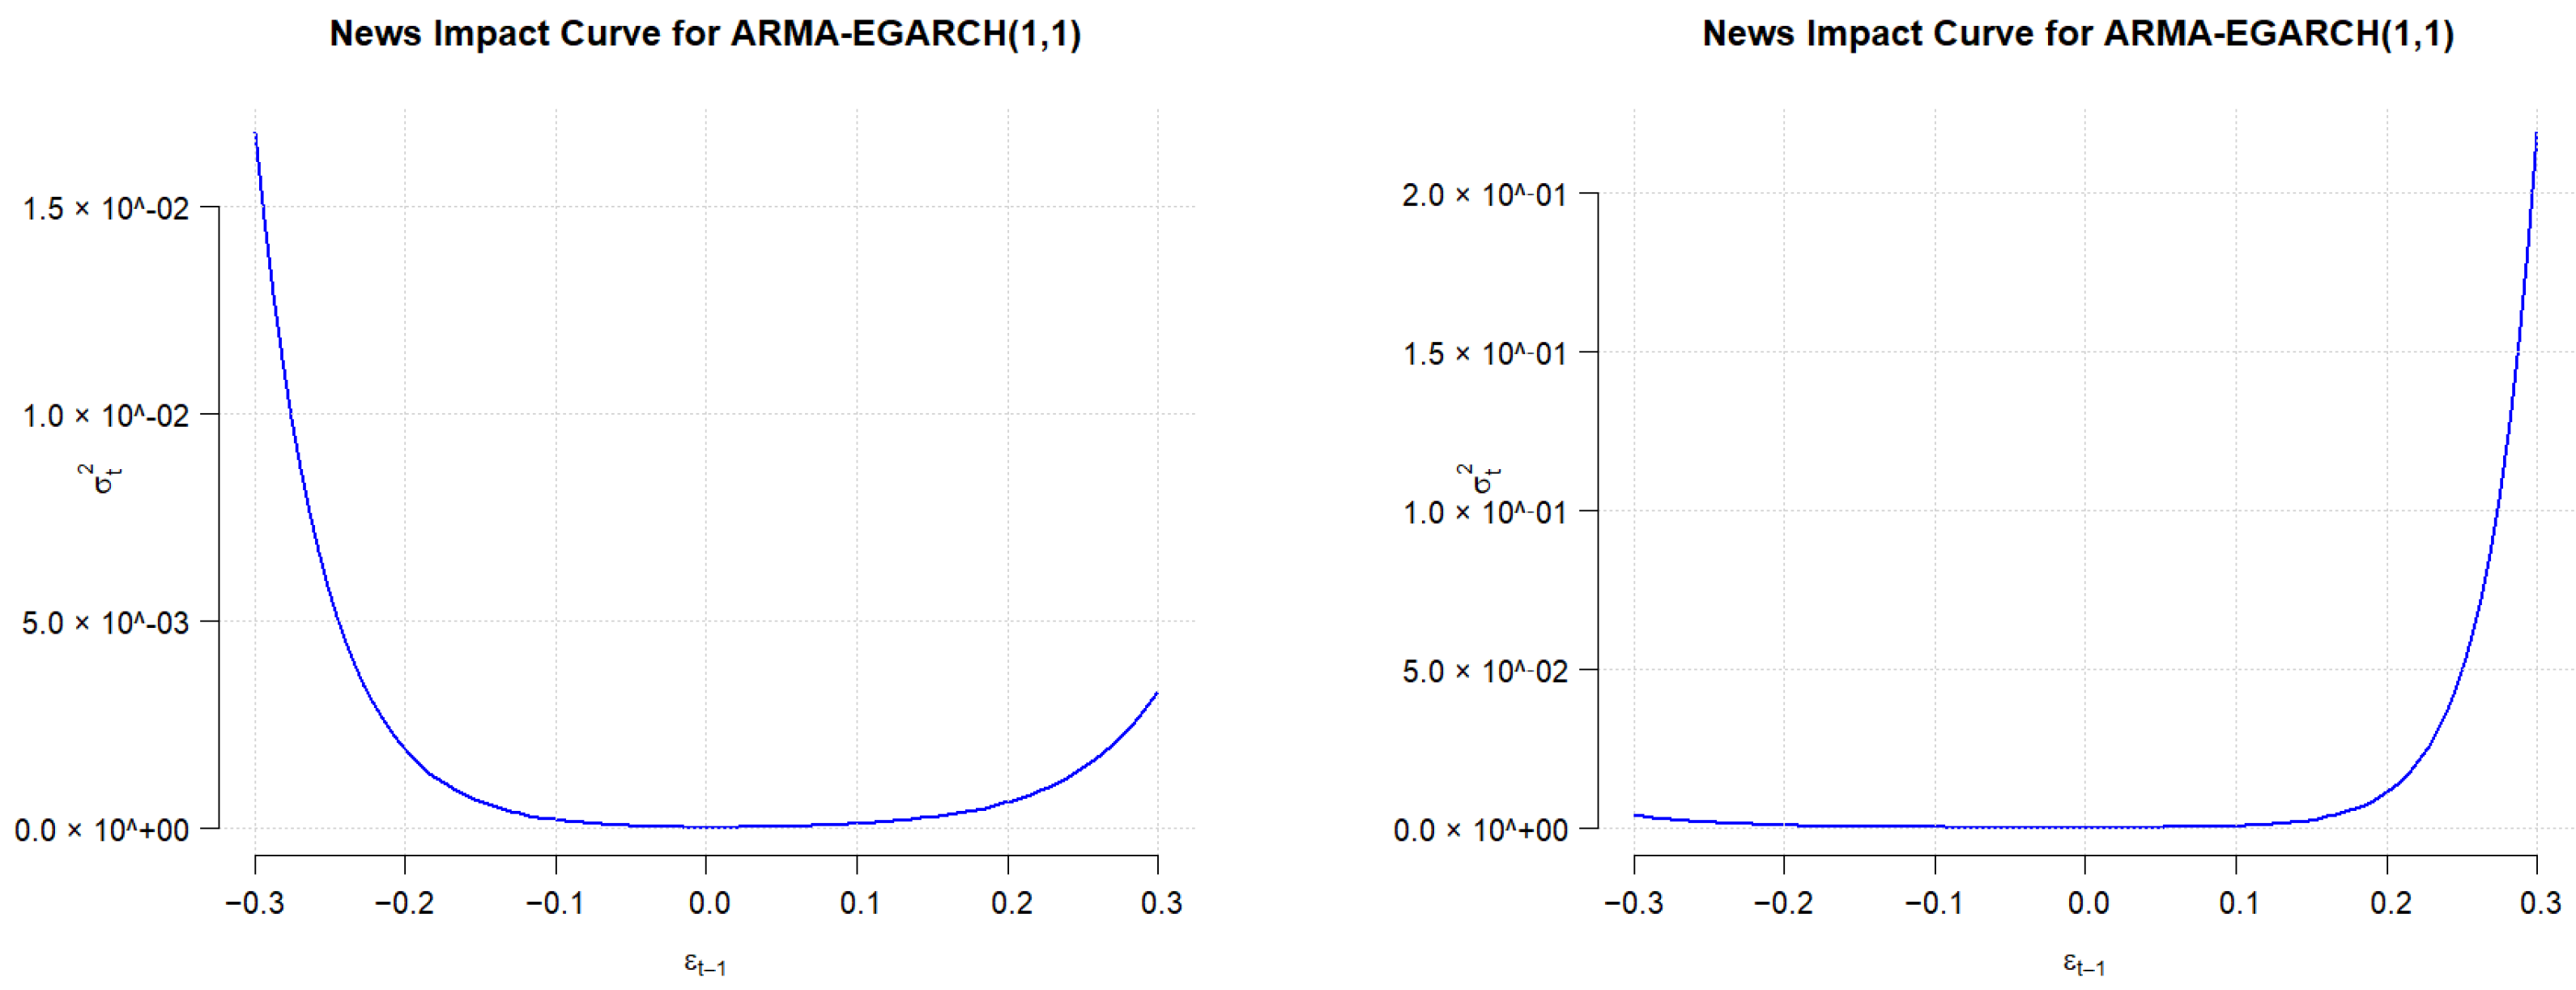
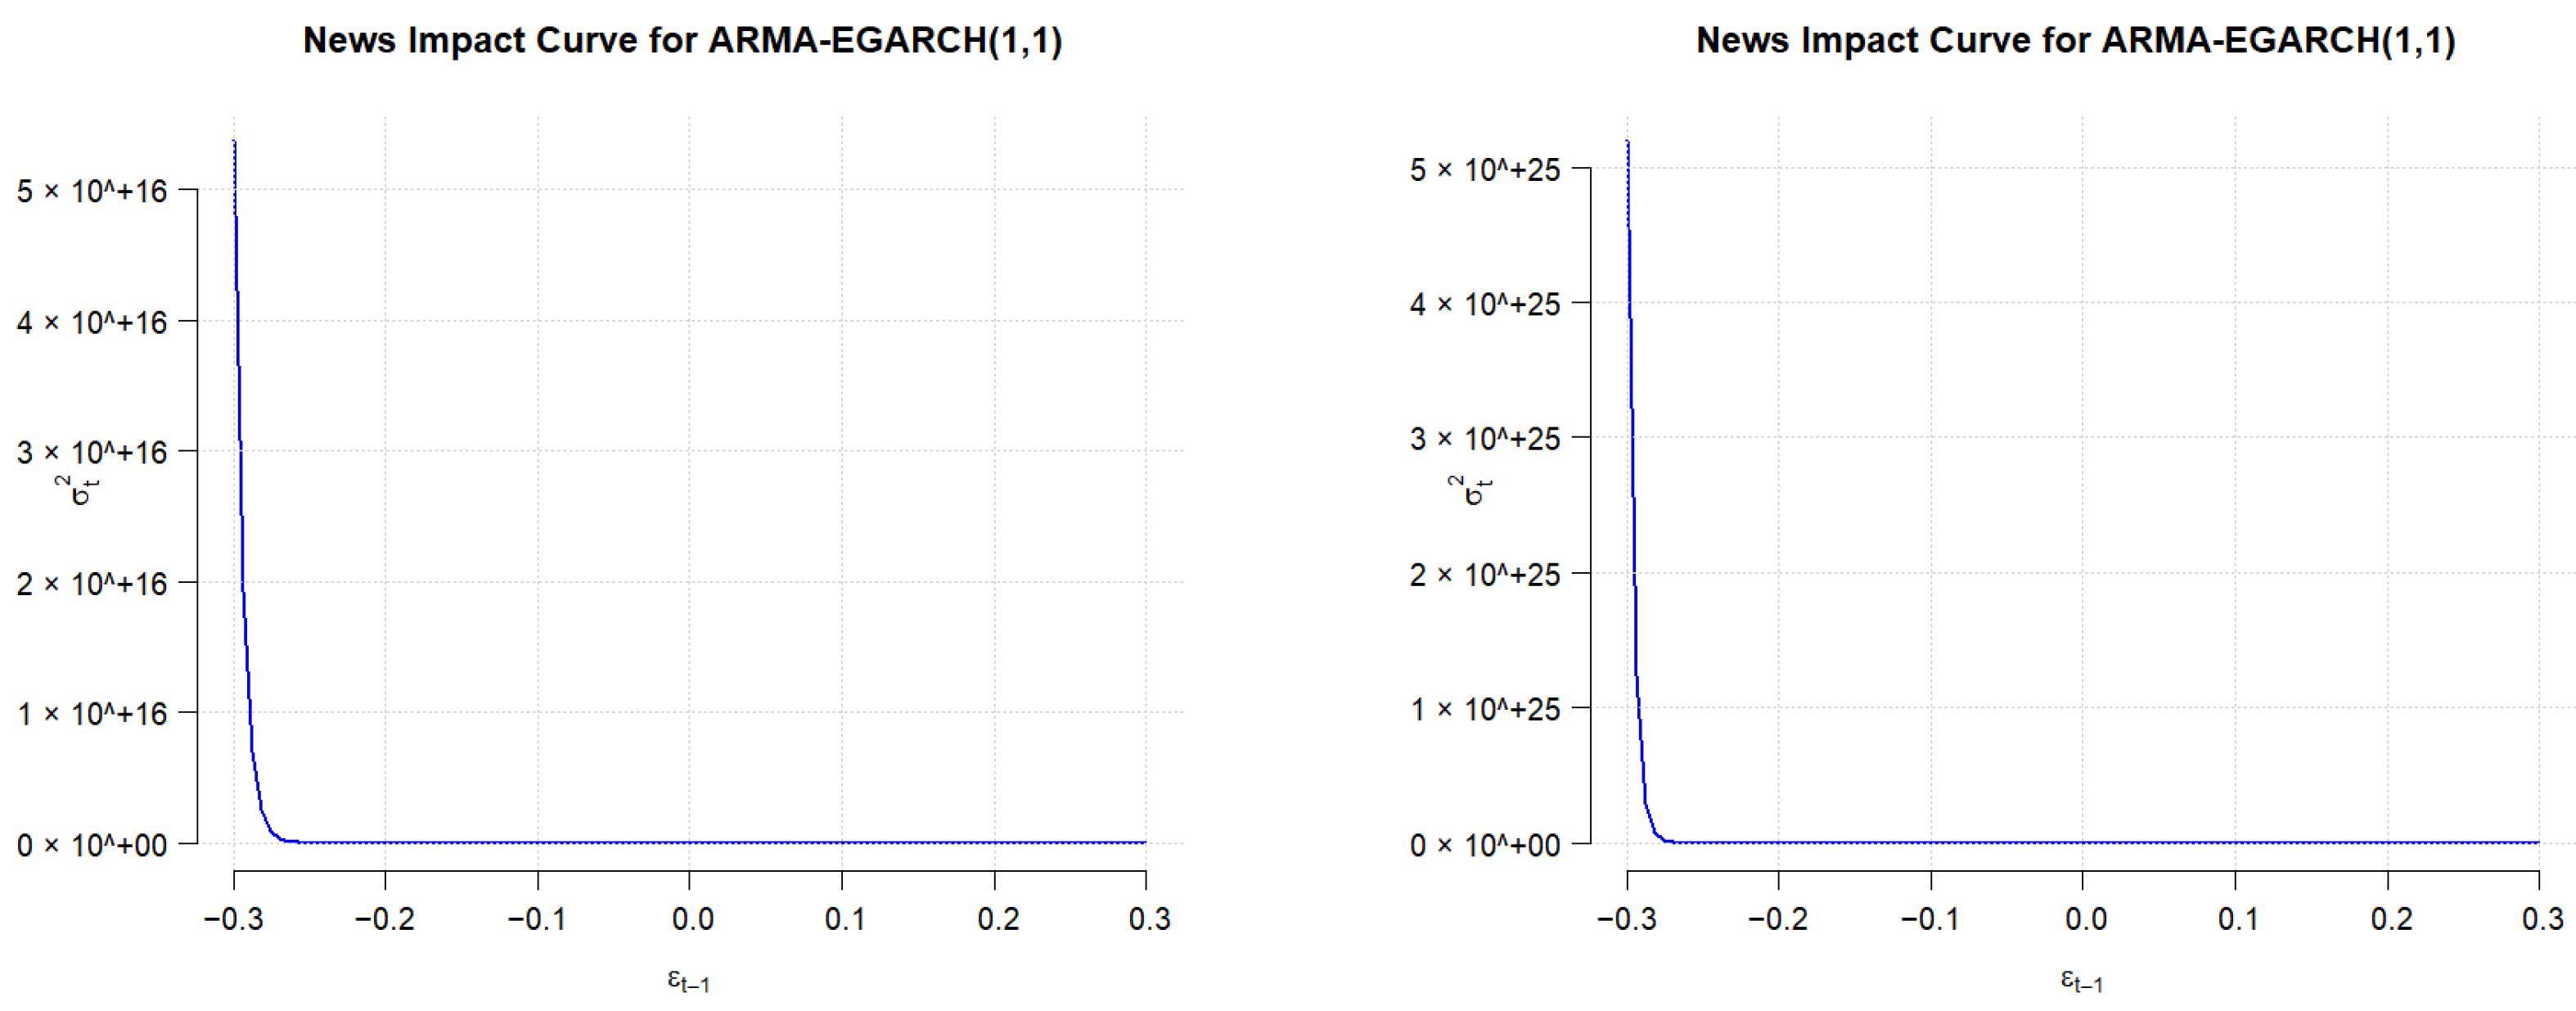
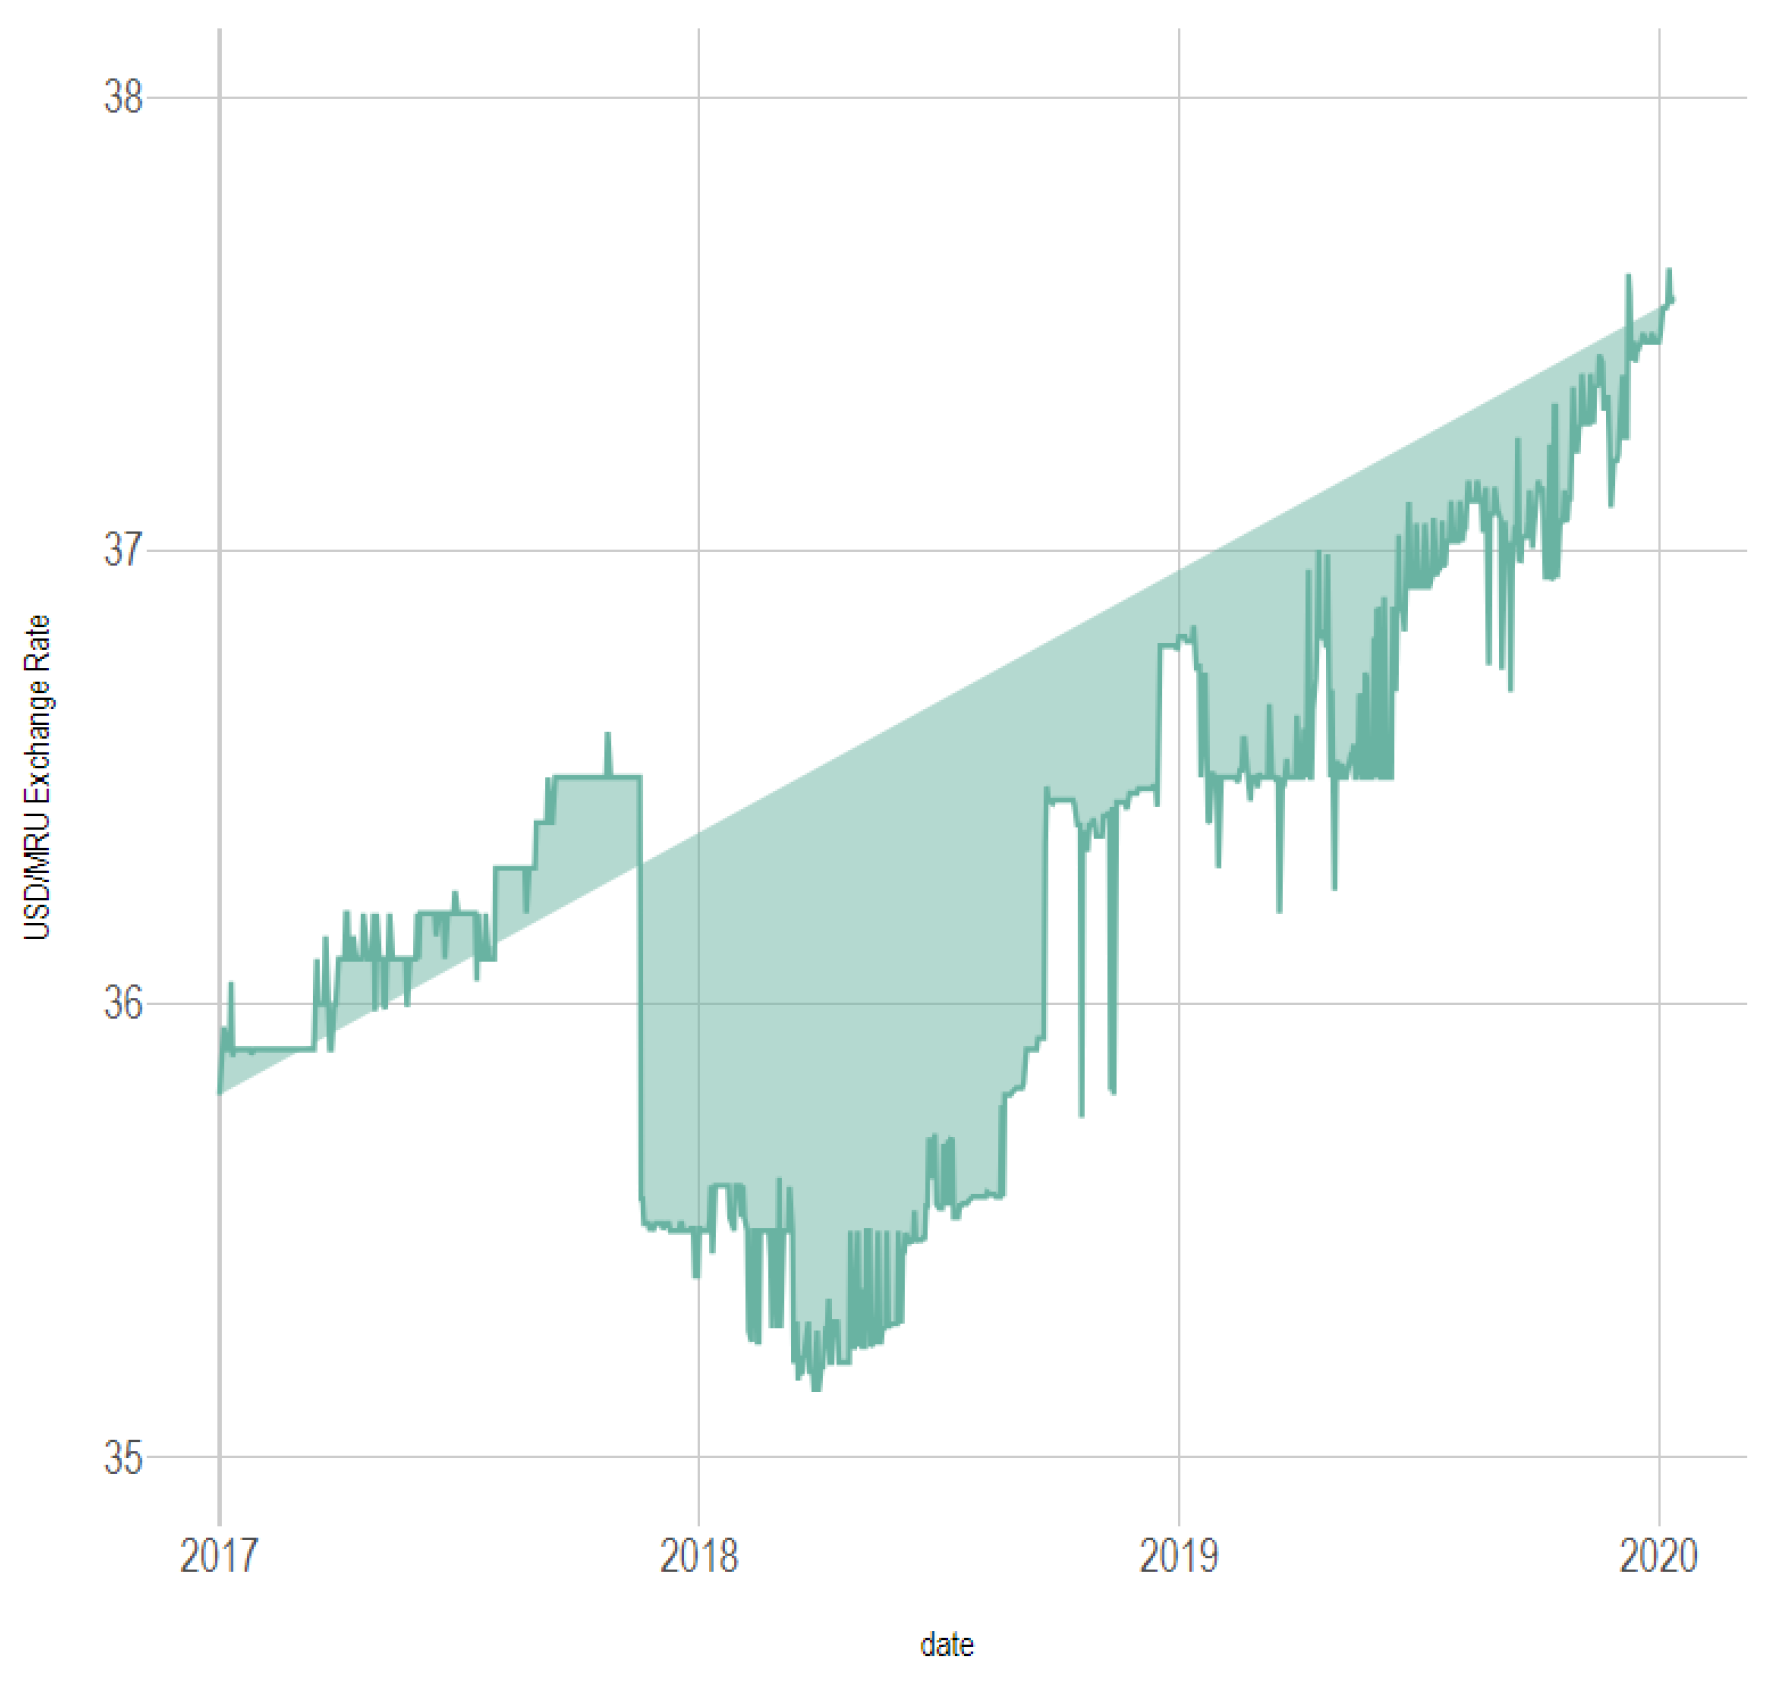
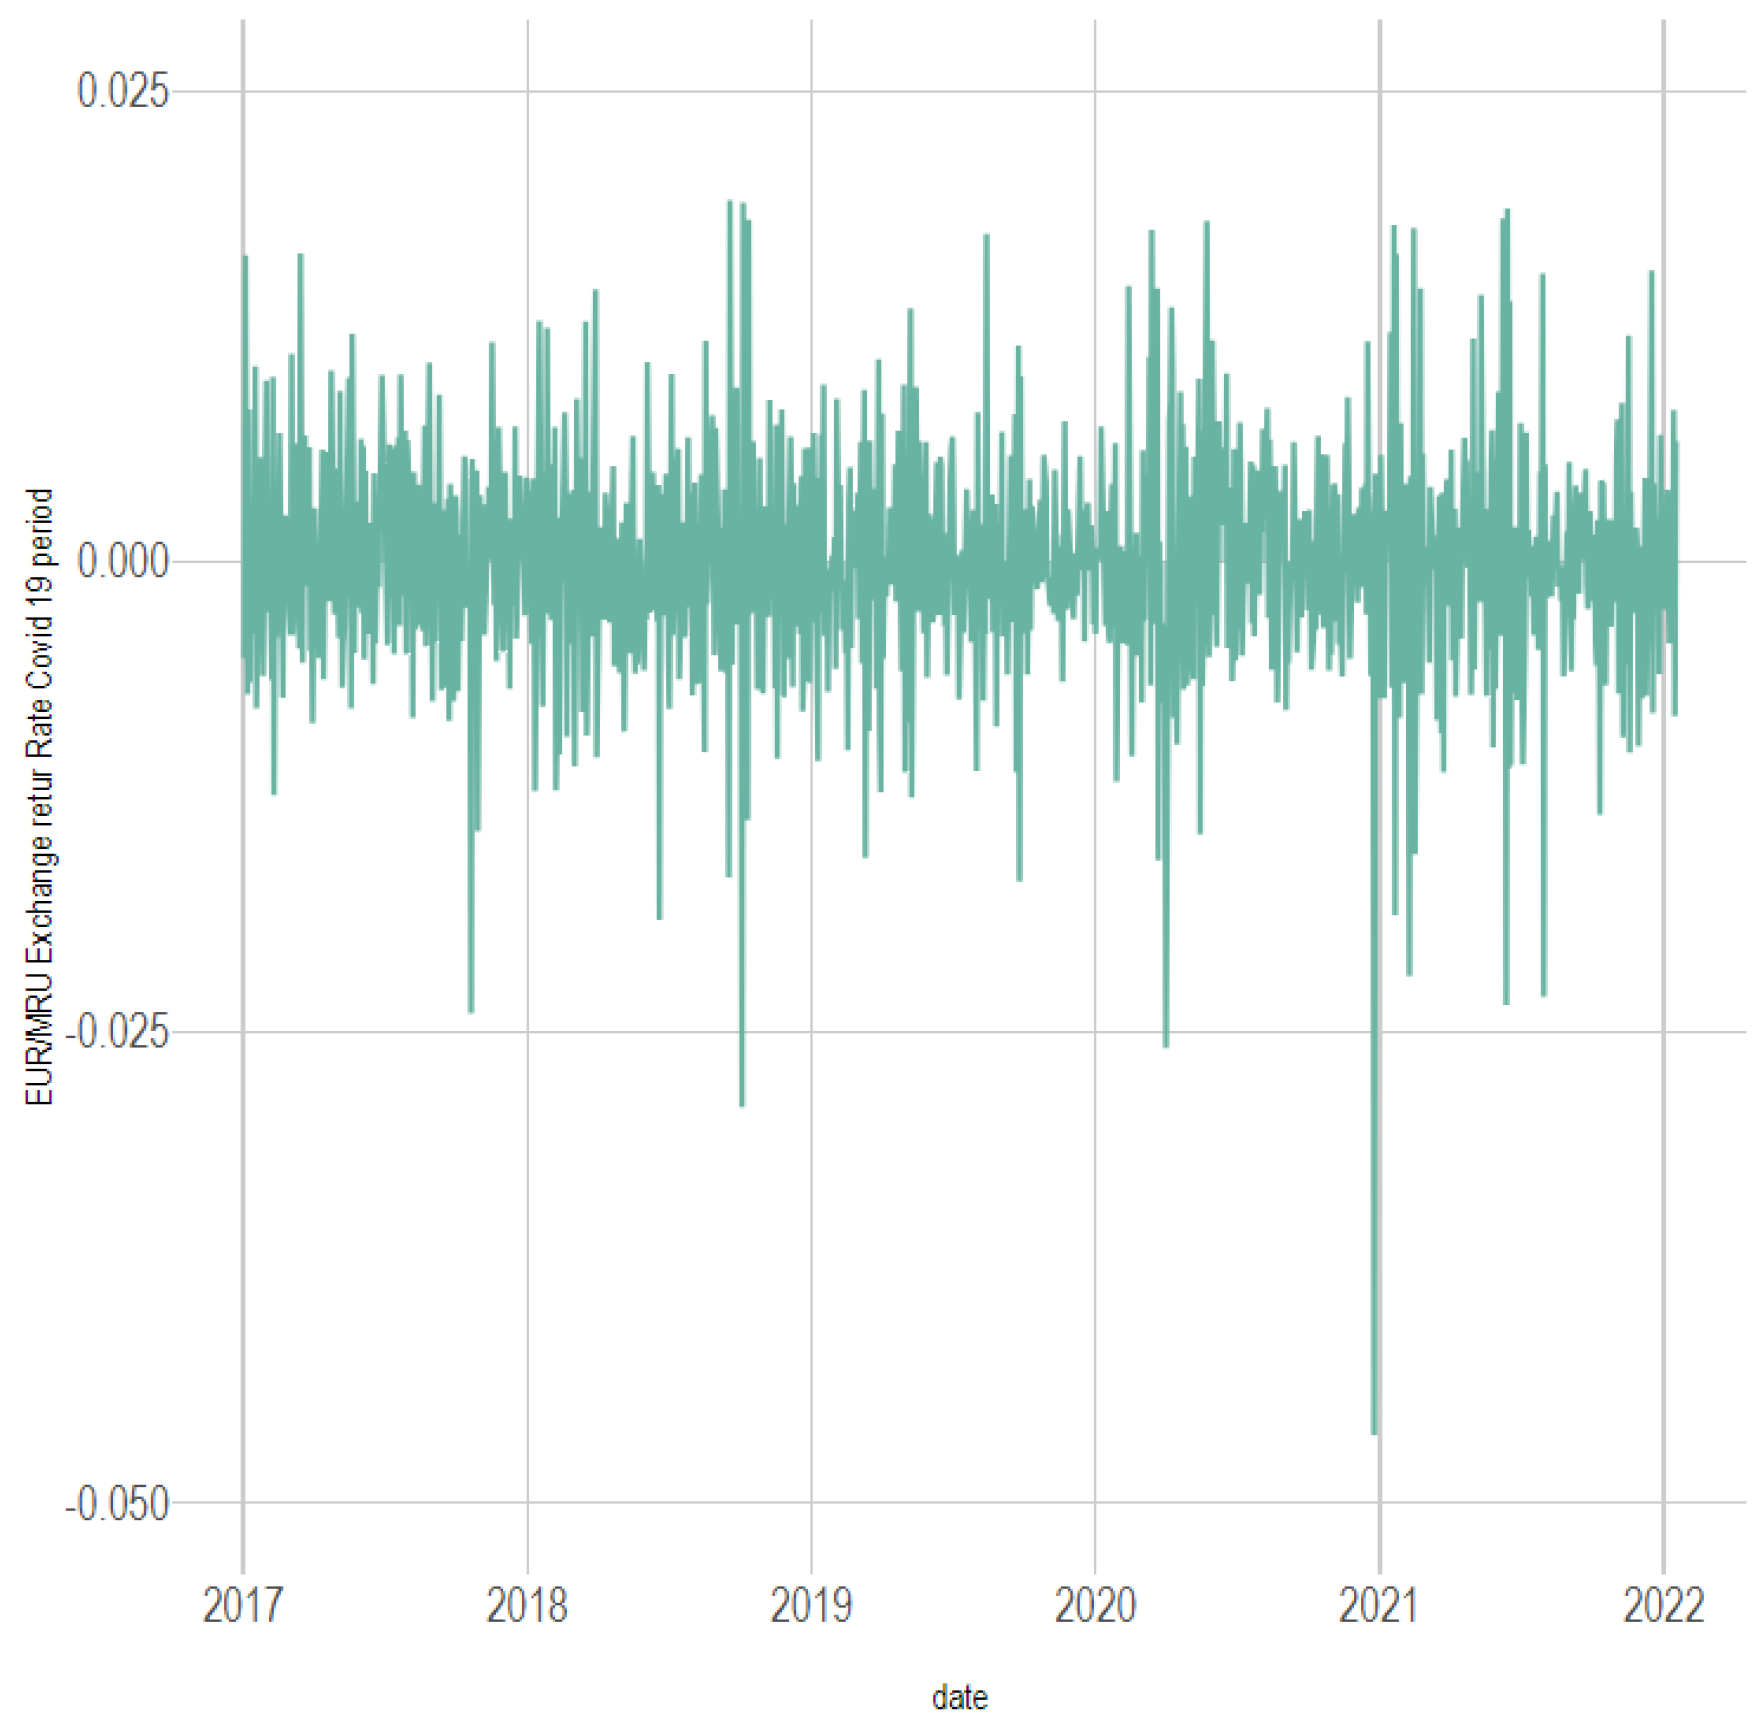
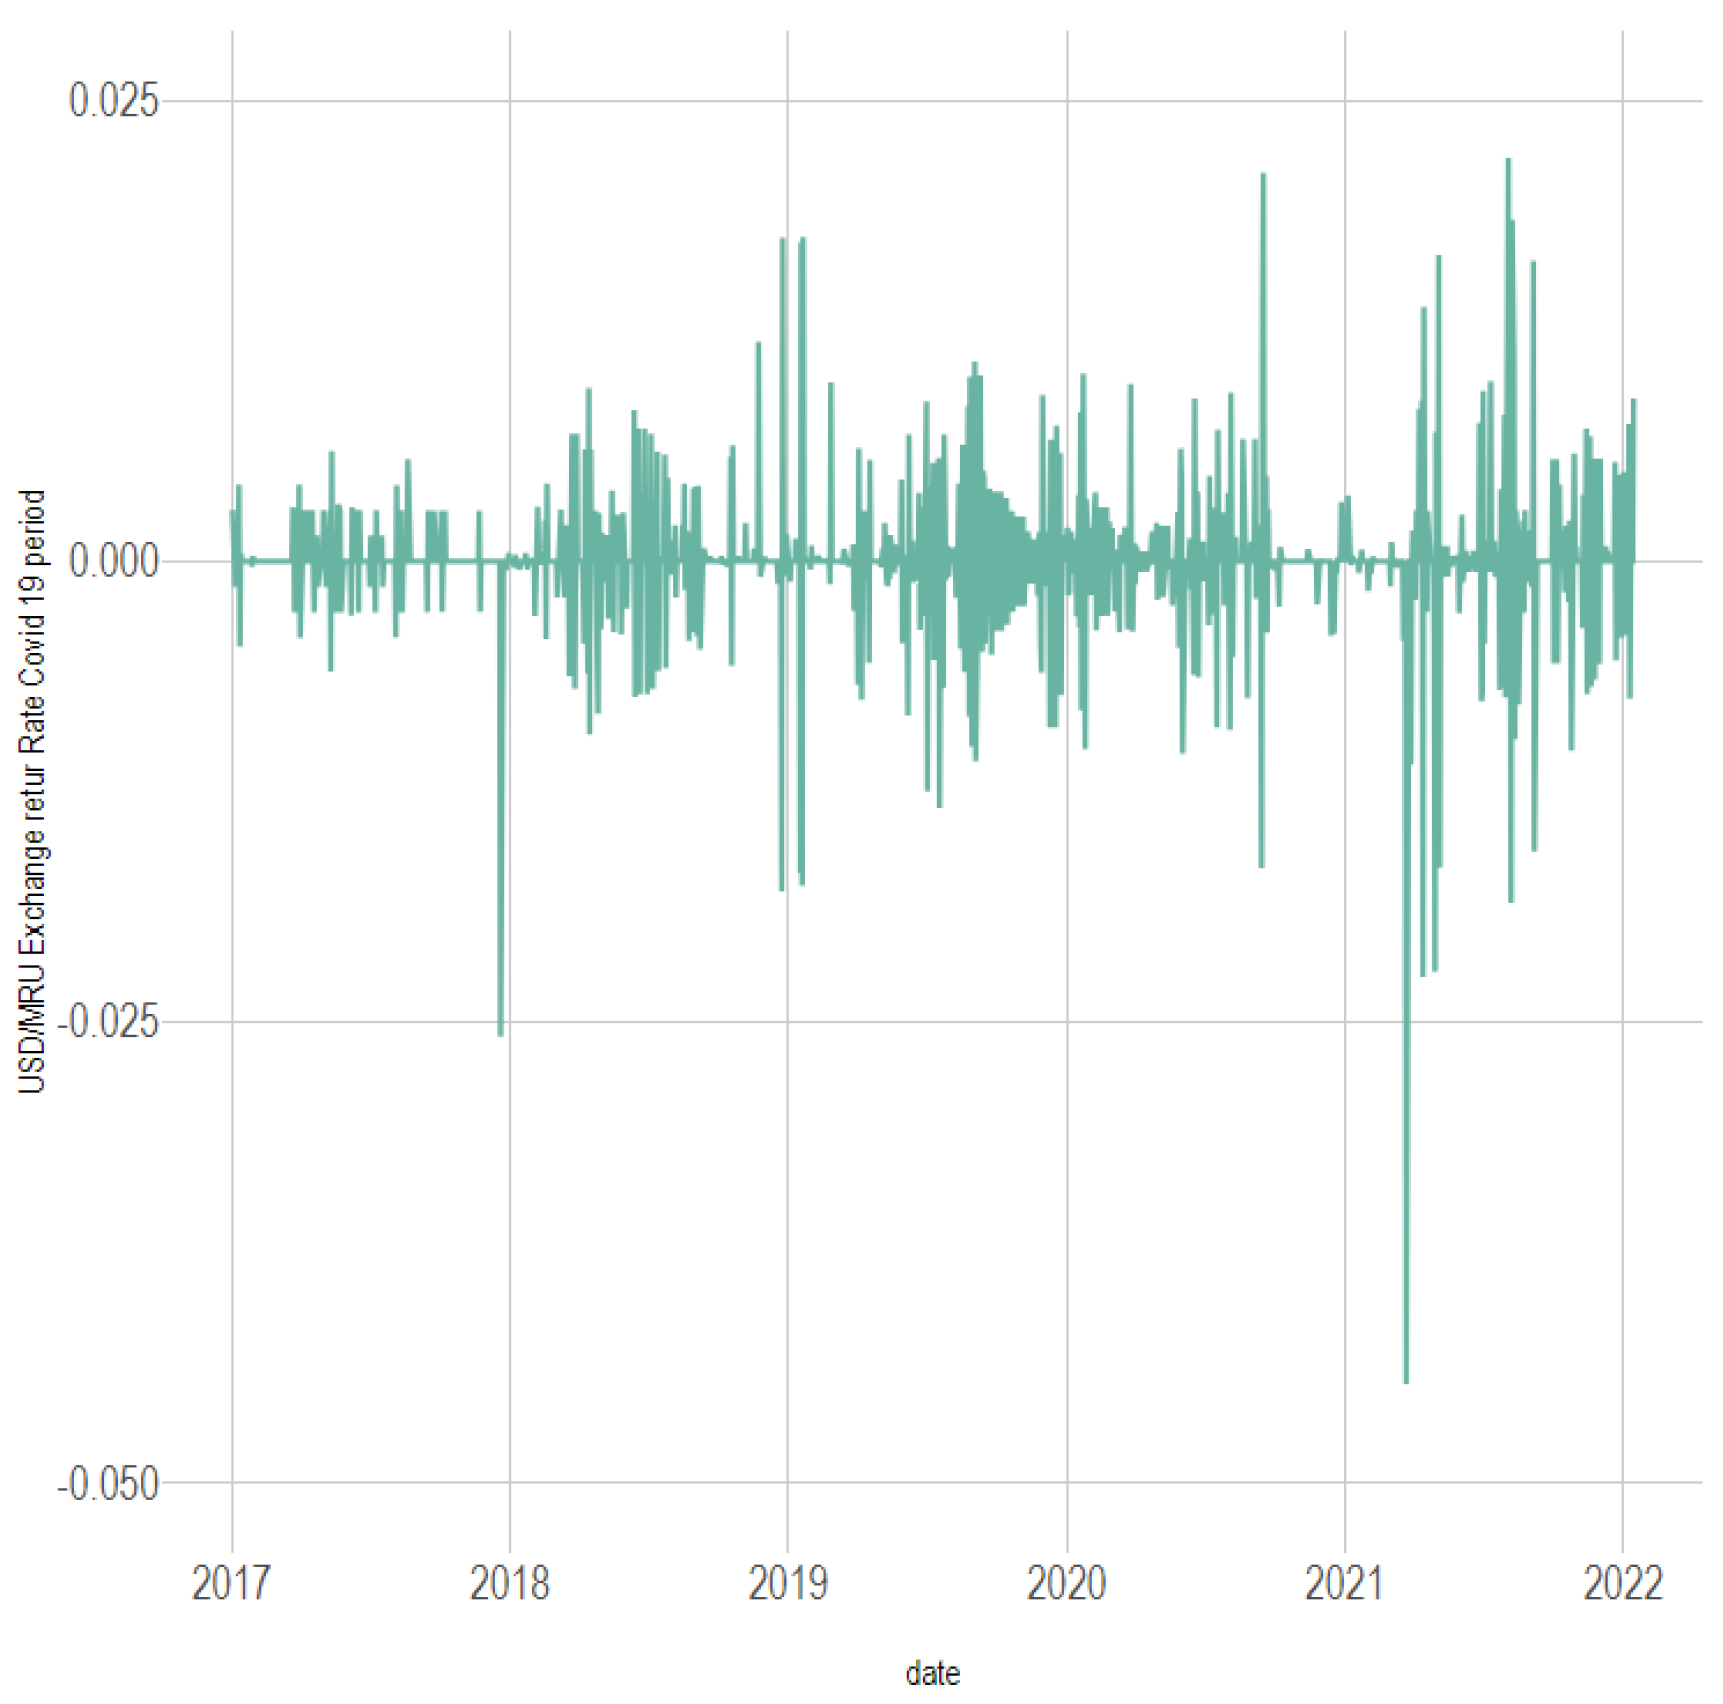
All codes and estimations were executed within R, ensuring full transparency and reproducibility of the empirical results. The exchange rate of the EURO and the USD, respectively, against Ouguiya are presented in the following graphics (
Figure 1,
Figure 2,
Figure 3,
Figure 4,
Figure 5 and
Figure 6):
4. Discussion
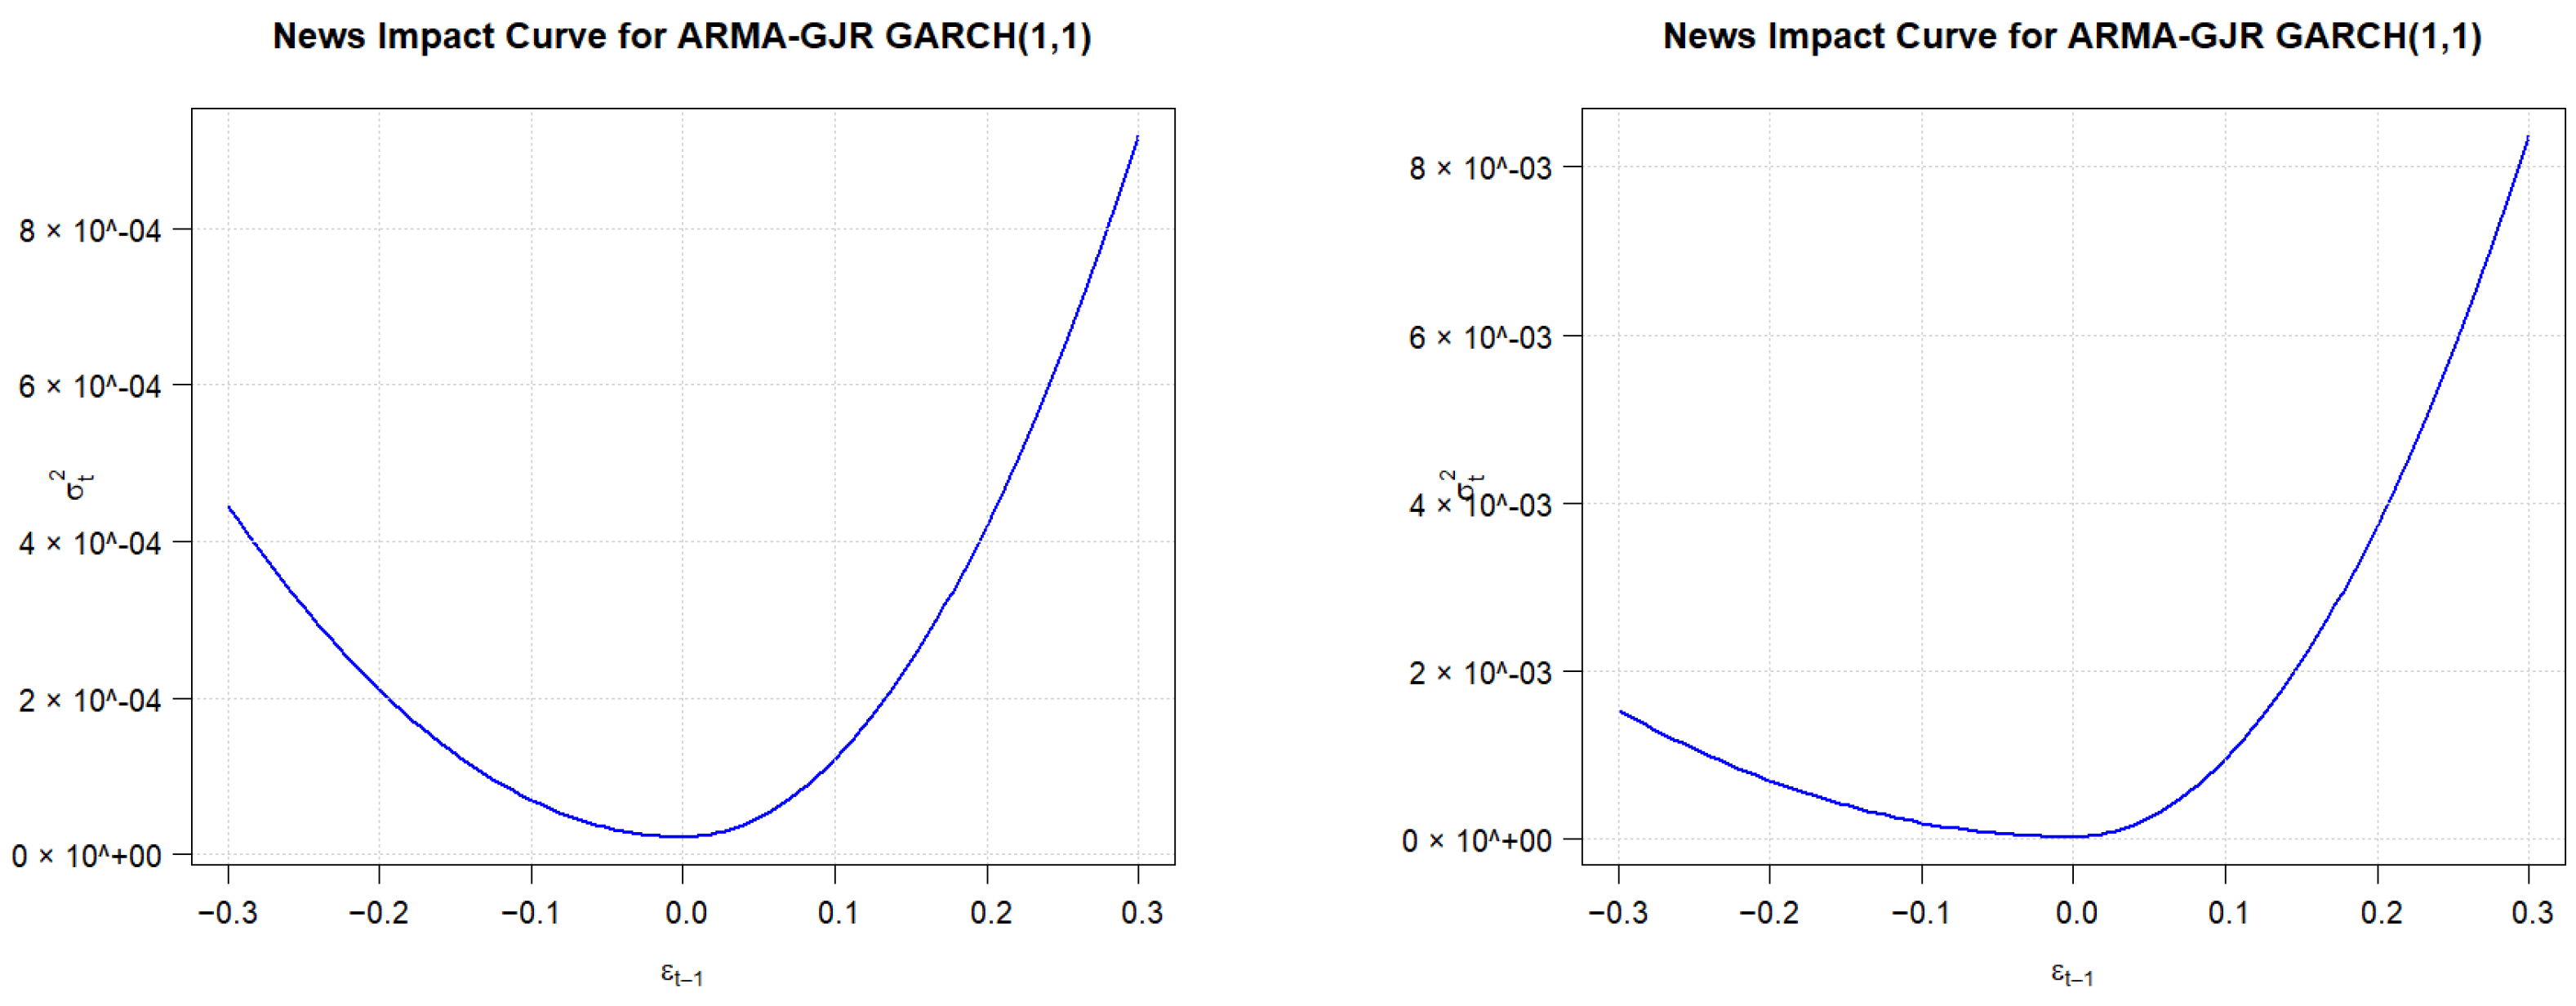
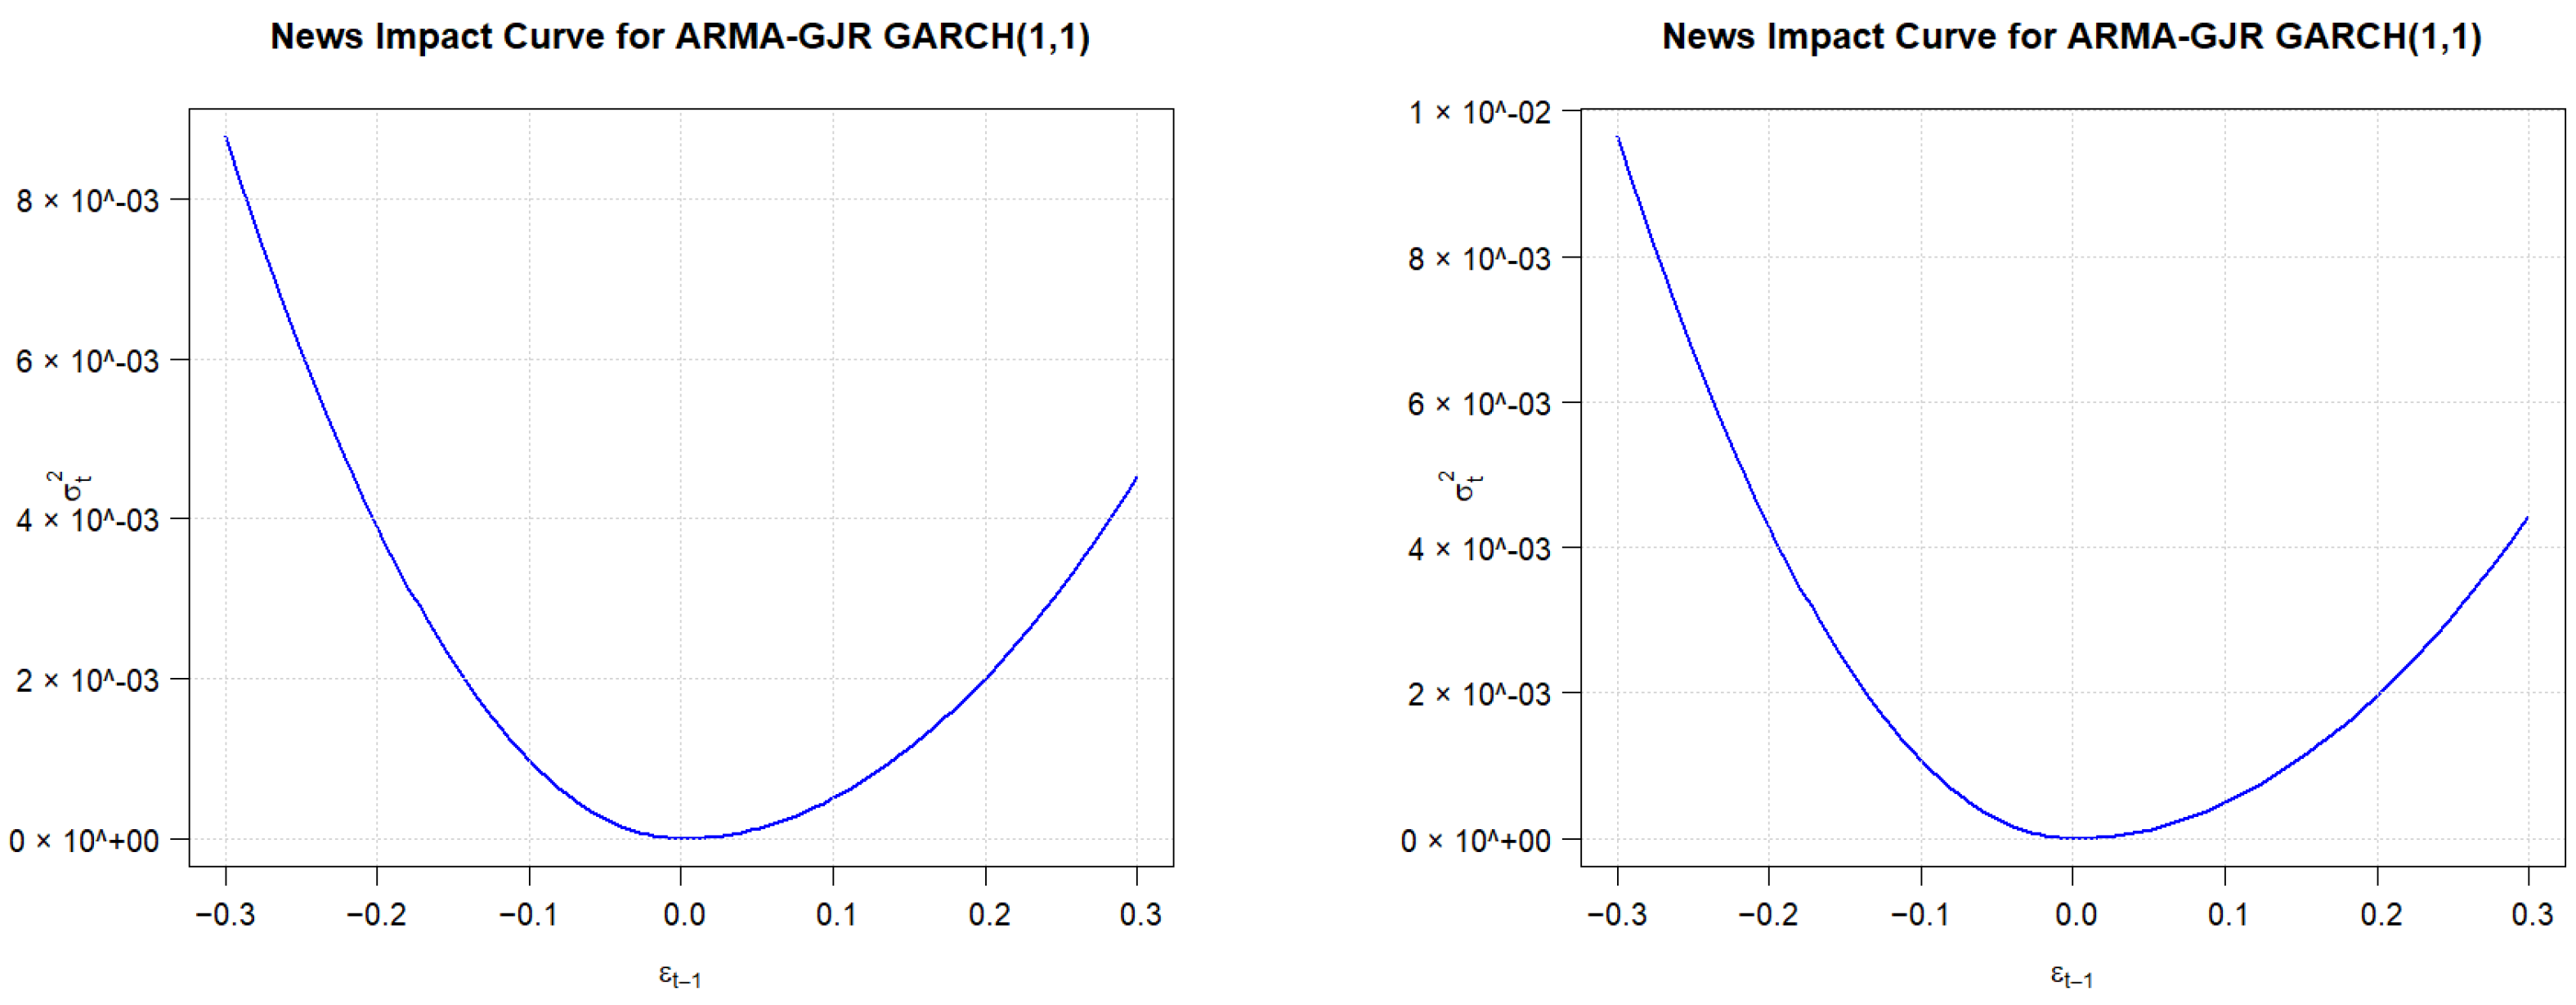
In conclusion, the analysis using the asymmetric EGARCH(1,1) and GJR-GARCH(1,1) models reveals significant shifts in the dynamics of the EUR/MRU exchange rate due to the COVID-19 crisis. There was a substantial increase in the ARCH coefficient (alpha1), indicating heightened sensitivity to recent volatility. This is coupled with a decrease in the GARCH coefficient, signaling a lower persistence of volatility in the post-COVID period. Finally, the gamma coefficient exhibited a notable increase, highlighting that positive shocks led to larger volatility increases, contrasting with the usual leverage effect where negative shocks cause larger volatility increases. These findings suggest a shift in market behavior during the post-COVID period, with greater volatility following positive news, possibly due to factors such as speculative bubbles or overconfidence.
As for the USD/MRU exchange rate, the analysis of the USD/MRU exchange rate using the asymmetric EGARCH(1,1) and GJR-GARCH(1,1) models highlights notable differences between the pre-COVID and COVID periods. the coefficient revealed contrasting asymmetries: in the EGARCH model, positive shocks had a greater impact on volatility, while in the GJR-GARCH model, negative shocks were more influential. These findings underscore the different ways each model captures asymmetry and volatility dynamics, with the EGARCH model emphasizing positive asymmetry and the GJR-GARCH model highlighting negative asymmetry. The results are not contradictory but rather reflect the distinct formulations of the models, which should be understood to correctly interpret market behavior during the COVID-19 period.
We observe that the differences in volatility dynamics between the EUR/MRU and USD/MRU exchange rates may be influenced by various economic factors. While this study primarily focuses on statistical modeling of volatility through ARMA-GARCH specifications, other elements—such as the Mauritanian economy’s differential exposure to the US dollar versus the euro, central bank interventions, and global market conditions—are likely to contribute to these variations. A detailed macroeconomic analysis is beyond the scope of this paper, but acknowledging these factors provides context for the statistical patterns observed across the two exchange rates.
We also recognize that including a pandemic dummy variable in the GARCH variance equation could formally isolate COVID-19-specific shocks. Nevertheless, our results indicate that a comparison between pre-COVID and COVID-19 sub-periods effectively captures the pandemic’s impact on exchange rate volatility. For example, for the EUR/MRU exchange rate, the parameter increased by nearly 496% after the COVID-19 outbreak, indicating a stronger response to past shocks, while slightly declined, reflecting a modest reduction in volatility persistence. For the USD/MRU exchange rate, decreased by 11% during the COVID-19 period but remained significant, and remained high, reflecting strong volatility persistence. These results show that the models can effectively detect changes in volatility dynamics without the inclusion of a dedicated dummy variable. Introducing such a dummy could slightly modify parameter estimates and complicate the identification of specific effects, yet the overall trends and conclusions remain robust. Therefore, we rely on period-based analysis, while acknowledging that formally including a pandemic dummy could be a valid extension for future research.
Model Selection Results Based on AIC and BIC Criteria
Based on both the AIC and BIC criteria (see
Table 32,
Table 33,
Table 34 and
Table 35), the E-GARCH(1,1) model is the best choice for modeling the EURO/MRU exchange rate during the first period. It has the lowest values for both AIC (−7.7305) and BIC (−7.6887).
Also based on both the AIC and BIC criteria, the E-GARCH(1,1) model is the best choice for modeling the EURO/MRU exchange rate during the second period. It has the lowest values for both AIC (−7.6163) and BIC (−7.5885).
In the first period for the USD/MRU exchange rate, the E-GARCH(1,1) model again emerges as the best choice, based on both AIC and BIC criteria. It has the lowest AIC value (−9.2184) and BIC value (−9.1840). Thus, the E-GARCH(1,1) model is preferred for this period.
For the USD/MRU exchange rate in the second period, the E-GARCH(1,1) model is also the most suitable based on the AIC and BIC values. It has the lowest AIC (−8.9426) and BIC (−8.9179). Therefore, the E-GARCH(1,1) model is the recommended model for this period as well.
5. Conclusions
The analysis of the stationarity and ARCH effects of the EUR/MRU and USD/MRU exchange rates reveals that both exchange rates passed the ADF test for stationarity in both the first and COVID-19 periods, indicating volatility clustering and potential ARCH effects. The ARCH LM test confirmed the presence of ARCH effects for both exchange rates in both periods, suggesting the need for GARCH models to capture time-varying volatility. Additionally, autocorrelation tests revealed significant autocorrelation in the residuals, indicating the necessity of incorporating ARMA models to better capture the data’s underlying structure.
The standard GARCH model shows that the COVID-19 crisis had an impact on both of the EUR/MRU and USD/MRU exchange rates. For EUR/MRU, the parameter increased significantly by 496%, suggesting a sharper response to past shocks during the pandemic. In contrast, the parameter showed a 12% decline, indicating a decrease in volatility persistence post-COVID. For USD/MRU, decreased by 11%, suggesting a weaker response to past shocks during the pandemic, while remained high, indicating persistent volatility even after COVID-19. This suggests that while both exchange rates experienced increased volatility during the COVID-19 crisis, the effects were more pronounced for EUR/MRU compared to USD/MRU. This means that the impact of past shocks on volatility is stronger during the pandemic compared to the pre-COVID period for EUR/MRU. However, for USD/MRU, the opposite holds true.
The analysis using the asymmetric EGARCH(1,1) and GJR-GARCH(1,1) models reveals significant shifts in the dynamics of the EUR/MRU exchange rate due to the COVID-19 crisis. The mean return remained relatively stable across both periods, with minor reductions in both models. However, the COVID-19 crisis significantly impacted the autoregressive behavior of the market, as evidenced by the drastic decrease in the autoregressive term (ar1) of the mean equation, suggesting a disruption of typical market patterns. The persistence of past shocks on the mean also decreased, with a reduction in the moving average coefficient (ma1). On the other hand, there was a substantial increase in the ARCH coefficient (), indicating heightened sensitivity to recent volatility. This is coupled with a decrease in the GARCH coefficient, signaling a lower persistence of volatility in the post-COVID period. Finally, the gamma coefficient exhibited a notable increase, highlighting that positive shocks led to larger volatility increases, contrasting with the usual leverage effect where negative shocks cause larger volatility increases. These findings suggest a shift in market behavior during the post-COVID period, with greater volatility following positive news, possibly due to factors such as speculative bubbles or overconfidence.
The analysis of the USD/MRU exchange rate using the asymmetric EGARCH(1,1) and GJR-GARCH(1,1) models reveals significant differences between the pre-COVID and COVID periods. The coefficient showed contrasting asymmetries: in the EGARCH model, positive shocks had a stronger effect on volatility, while in the GJR-GARCH model, negative shocks were more impactful. These results highlight how each model differently captures asymmetry and volatility dynamics, with the EGARCH model focusing on positive asymmetry and the GJR-GARCH model emphasizing negative asymmetry. The findings are not inconsistent but rather reflect the unique characteristics of each model, which are essential for accurately interpreting market behavior during the COVID-19 period.
An out-of-sample backtesting analysis was performed to assess the predictive accuracy of the GARCH, EGARCH, and GJR-GARCH models during the COVID-19 crisis. Using rolling one-step-ahead forecasts evaluated with standard loss functions (MSE, QLIKE, MAE-LOG) and the Diebold–Mariano test, results show that asymmetric models—particularly EGARCH for EUR/MRU and GJR-GARCH for USD/MRU—provide slightly superior volatility forecasts. This consistency between in-sample and out-of-sample results confirms the robustness and practical relevance of asymmetric specifications for modeling exchange rate volatility in times of crisis. These results indicate that the Central Bank of Mauritania could leverage insights from the asymmetric EGARCH and GJR-GARCH models to better manage exchange rate volatility. Positive shocks on the EUR/MRU and negative shocks on the USD/MRU have disproportionate effects, emphasizing the need for targeted interventions and hedging strategies. Incorporating these dynamics into risk management could help the central bank anticipate market fluctuations and stabilize the foreign exchange market.
