Article

Navigating the Green Frontier: Dynamic Risk and Return Transmission Between Clean Energy ETFs and ESG Indexes in Emerging Markets

1
Faculty of Economics and Management of Sfax, University of Sfax, Sfax 3018, Tunisia
2
Department of Finance and Accounting, University of Sfax, Sfax 3018, Tunisia
*
Author to whom correspondence should be addressed.
J. Risk Financial Manag. 2025, 18(10), 557; https://doi.org/10.3390/jrfm18100557
Submission received: 4 August 2025 / Revised: 7 September 2025 / Accepted: 15 September 2025 / Published: 2 October 2025

Abstract

This study is designed to investigate the dynamic risk transmission processes between clean energy ETFs and ESG indices in the BRICS countries—Brazil, India, China, and South Africa—while excluding Russia due to the lack of consistent data availability during the study period, which coincides with the Russia–Ukraine conflict. The analysis is conducted on daily data obtained from DataStream, spanning from 27 October 2021 to 5 January 2024. By applying a time-varying parameter vector autoregression (TVP-VAR) modeling framework, we considered examining the global market conditions and economic shocks’ effects on these indices’ interconnectedness, including COVID-19 and geopolitical tensions. In this context, clean energy ETFs turned out to stand as net shock transmitters throughout volatile market spans, while ESG indices proved to act as net receivers. Moreover, we undertook to estimate both of the minimum variance and minimum connectedness portfolios’ hedging efficiency and performance. The findings highlight that introducing clean energy indices into investment strategies helps boost financial outcomes while maintaining sustainability goals. Indeed, the minimum connectedness portfolio consistently delivers superior risk-adjusted returns across varying market circumstances. In this respect, the present study provides investors, regulators, and policymakers with practical insights. Investors may optimize their portfolios by integrating clean energy and ESG indexes, useful for achieving financial and sustainability aims. Similarly, regulators might apply the findings to establish reliable green investment norms and strategies. Thus, this work underscores the crucial role of dynamic portfolio management in optimizing risk and return in the globally evolving green economy.

1. Introduction

The growing global emphasis on sustainable finance has significantly increased scholarly and investor interest in Environmental, Social, and Governance (ESG) as well as Clean Energy indexes (Kanamura, 2023; Dias et al., 2024). ESG indexes capture the performance of firms that embed sustainability considerations into their strategies by integrating environmental protection, social responsibility, and corporate governance into their operations. Clean Energy indexes, in contrast, specifically monitor companies engaged in renewable energy production, pollution reduction, and efficient resource utilization (Z. P. Wang et al., 2014; Ji et al., 2024; Gheorghe et al., 2025). Taken together, these indexes have emerged as essential benchmarks for investors aiming to align financial objectives with long-term sustainability commitments (Pástor et al., 2021; Chen & Fan, 2024; Bhattacherjee et al., 2024).
In recent years, global environmental concerns and climate-related risks have reinforced the need to integrate ESG and clean energy considerations into investment decision-making. This trend is particularly salient in BRICS countries, where rapid economic growth is frequently accompanied by environmental degradation and energy transition challenges. Within this context, ESG and Clean Energy indexes provide investors with tools not only for tracking the renewable energy transition and monitoring firms committed to sustainability but also for diversifying portfolios and hedging against systemic risks (Zhang et al., 2022; Beloskar & Rao, 2023; W. P. Liu et al., 2024). As Šević et al. (2024) argued, dynamic analyses of sustainability-linked indexes are essential, since they are highly sensitive to global events and economic shocks.
Despite this growing importance, the existing literature remains fragmented. Several studies have highlighted the role of ESG indices in portfolio diversification and risk reduction (Hiremath & Kattuman, 2017; Bolognesi, 2023; Yang et al., 2024; Alharbi et al., 2025; Porteu de la Morandière et al., 2025), while others have emphasized the hedging properties of clean energy assets during financial turbulence (Jain et al., 2019; Ji et al., 2024; Özkan et al., 2024; Lopez-Penabad et al., 2025). However, few studies have explored the dynamic interdependence between ESG and clean energy indices, particularly in emerging economies such as the BRICS markets, where sustainability challenges are closely linked to economic and geopolitical uncertainties. Consequently, this study aims to address the following research questions:
  • To what extent are ESG and Clean Energy indexes dynamically connected in BRICS markets?
  • How do these connections influence portfolio diversification and risk management?
  • What are the implications for investors seeking to balance risk and return amid global uncertainty?
Methodologically, the study employs advanced portfolio construction approaches, namely the Minimum Variance Portfolio (MVP) and Minimum Connectedness Portfolio (MCoP), while considering hedging effectiveness, Sharpe ratios, and connectedness measures. This approach not only allows for a deeper understanding of the interactions between ESG and Clean Energy indexes but also provides practical insights into their risk management and portfolio optimization potential.
The contributions of this research are threefold. First, it extends the literature by jointly examining ESG and Clean Energy indexes in BRICS markets, thereby addressing a gap in prior studies that have largely considered them in isolation. Second, it sheds light on the hedging and diversification benefits of these indexes during periods of heightened volatility, offering actionable insights for investors. Third, it provides evidence relevant for policymakers by highlighting the implications of sustainability-linked investments for financial stability and energy transition pathways.
The remainder of the paper is structured as follows: Section 2 presents a detailed review of the relevant literature. Section 3 outlines the methodology. Section 4 discusses the empirical results, and Section 5 concludes with the main findings and research perspectives.

2. Literature Review

Over the last decade, the increasingly urgent interest in environmental and social issues has induced investors and stakeholders to adopt rather effective sustainable investment strategies that integrate sustainability metrics into portfolio management procedures, including environmental, social and governance (ESG) criteria, as well as Clean Energy indexes. With the escalation of such global crises as climate change and socioeconomic inequalities, sustainable investment policies turned out to become a paramount necessity rather than a mere trend (Kocmanová et al., 2020; Sinha Ray & Goel, 2023; Desai & Das, 2024; Belkhir et al., 2025). Such an urgency highlights well the increasing urgency and crucial importance of sustainability in guiding investment decisions, harmoniously with the ethical and environmental norms (Kanamura, 2023; Dias et al., 2024; Bhattacherjee et al., 2024).
Thus, sustainability has turned out to be an essential part of modern investment undertakings, wherein ESG criteria provide a solid benchmark fit for estimating corporate long-term environmental and social effects (Deng & Cheng, 2019; G. Liu & Hamori, 2020; X. Liu et al., 2024). Accordingly, investors are more aware of the need to incorporate ESG factors as effective means for maintaining financial returns and addressing persistent global challenges (Piserà & Chiappini, 2022). Additionally, Clean Energy indexes, which drive companies into the environmentally friendly domains, particularly the renewable energy sector, provide extra sustainability investment-associated aspects (Z. P. Wang et al., 2014; Ji et al., 2024; Tripathi & Jham, 2020). Jointly, therefore, ESG and Clean Energy indexes provide stakeholders with valuable opportunities to meet financial targets while simultaneously maintaining the attainment of environmental and societal goals (Zhu et al., 2020; X. Liu et al., 2024). Actually, these combined objectives, simultaneously involving dual focus on financial resilience and ethical responsibility dimensions, highlight well the investments’ evolving character and responsibility in modern markets (Z. P. Wang et al., 2014; Jain et al., 2019; Mats, 2024).
In this respect, Z. P. Wang et al. (2014), Deng and Cheng (2019), Zhu et al. (2020), Zhang et al. (2022), and Fu et al. (2024) emphasized the ESG and Clean Energy indexes crucially associated roles in boosting sustainable practices through addressing the complementary intermingling dimensions of sustainability and investment prerequisites.
Worth highlighting, in this regard, is that a great deal of relevant research tended to underline the important advantages associated with integrating ESG aspects in investment strategies and portfolios, particularly in studies associating ESG criteria with corporate financial performance (Siche et al., 2008; Strezov et al., 2017; Deng & Cheng, 2019; G. Liu & Hamori, 2020). In this context, Friede et al. (2015) argued that companies with robust ESG profiles tended to outperform their peer firms. Conversely, also, research dealing with the Clean Energy indexes’ roles and effects revealed that these assets were able to hedge against market volatilities, particularly during economic distress and uncertainty spans (Bolognesi, 2023). In turn, Zhang et al. (2022), along with Höl (2024), further outlined that, once integrated with extra sustainability measures, Clean Energy indexes helped in providing a comprehensive view of the environmental effect and resource application efficiency binding correlations.
Still, while highlighting the financial viability of sustainability-oriented investments, such results also raised the question of optimizing portfolios in emerging markets, wherein such indexes are not well established (Suresha et al., 2022; W. P. Liu et al., 2024; Jlassi et al., 2025). Hence, by addressing previous research’s persistent gaps, which tended to treat the ESG and Clean Energy indexes on a separate basis, this study undertakes to integrate both factors into a single portfolio in a bid to estimate their correlations.
Several studies have examined the interactions among sustainable assets under various market conditions. Gheorghe et al. (2025) employs Quantile-on-Quantile Regression (QQR) and Wavelet Coherence (WCO) to analyze ESG and AI-themed ETFs, showing that ESG ETFs are more resilient under extreme uncertainty, whereas AI-themed ETFs perform better under moderate-risk conditions but are vulnerable during systemic stress. Jeribi and Béjaoui (2025) apply quantile and frequency connectedness methods to Bitcoin, Gold, Green, and Blue ETFs, revealing dynamic connectedness and volatility spillovers that intensify during extreme events. Gökgöz et al. (2025) use a TVP-VAR broadened connectedness approach on BRICS stock markets and implied volatility indices, highlighting nontrivial dynamic connectedness with heterogeneous patterns across markets. Belkhir et al. (2025) employ a TVP-VAR model to study traditional and clean energy assets, showing that green finance indices act as net shock transmitters, while fossil fuel assets are primarily net receivers, enhancing portfolio stability when incorporated into minimum correlation and risk parity strategies. Bouzguenda and Jarboui (2025) implement a quantile and frequency connectedness analysis to examine Blue and Green Economy ETFs, emphasizing significant and interconnected spillover effects, which provide useful insights for risk management and portfolio optimization. While these studies offer valuable insights, most focus on developed markets, consider ESG or clean energy indices separately, or do not explicitly account for emerging markets and geopolitical shocks. In contrast, the present study integrates both ESG and clean energy indices within the BRICS countries (excluding Russia), examines their dynamic risk transmission under global shocks, such as COVID-19 and the Russia–Ukraine conflict, and evaluates portfolio performance using minimum variance and minimum connectedness approaches, thereby addressing existing gaps and providing a more comprehensive understanding of sustainable asset interactions in emerging markets.
To this end, we investigate the dynamic linkages between ESG and Clean Energy indices in emerging markets amid evolving global crises. Based on the preceding theoretical and empirical insights, we propose the following research hypotheses:
H1: 
ESG and Clean Energy indices in BRICS markets exhibit a significant and time-varying interconnectedness, influenced by global economic conditions and market events.
H2: 
Portfolio strategies accounting for this interconnectedness (notably the Minimum Connectedness Portfolio—MCoP) deliver superior risk-adjusted returns compared to traditional strategies (such as the Minimum Variance Portfolio—MVP), particularly during periods of heightened market volatility.
H3: 
The interdependence network of these indices offers effective hedging opportunities and improves portfolio diversification, providing robust risk management benefits.
These hypotheses guide the empirical analysis presented in the following section, allowing us to examine the interconnections, hedging efficiency, and risk management implications of ESG and Clean Energy indices in BRICS markets.

3. Data and Methodology

3.1. Data

The present research is designed to assess the correlation and spillover effects between key Clean Energy indexes (ICLN, CNRG, FAN, and TAN) and ESG indexes of Brazil, India, China, and South Africa, regarding the period span ranging from 27 October 2021 to 5 January 2024. Daily data were collected from DataStream and processed using R software (R 4.3.1). Although the sample period covers only a little more than two years, it was deliberately chosen as it coincides with major global disruptions, including the aftermath of the COVID-19 pandemic, the Russia–Ukraine conflict, and heightened geopolitical and energy market tensions. These events generated unprecedented market volatility, making this short horizon particularly relevant for analyzing dynamic risk transmission. Consequently, the study offers timely insights into the resilience and hedging role of clean energy and ESG indices under crisis-driven conditions.
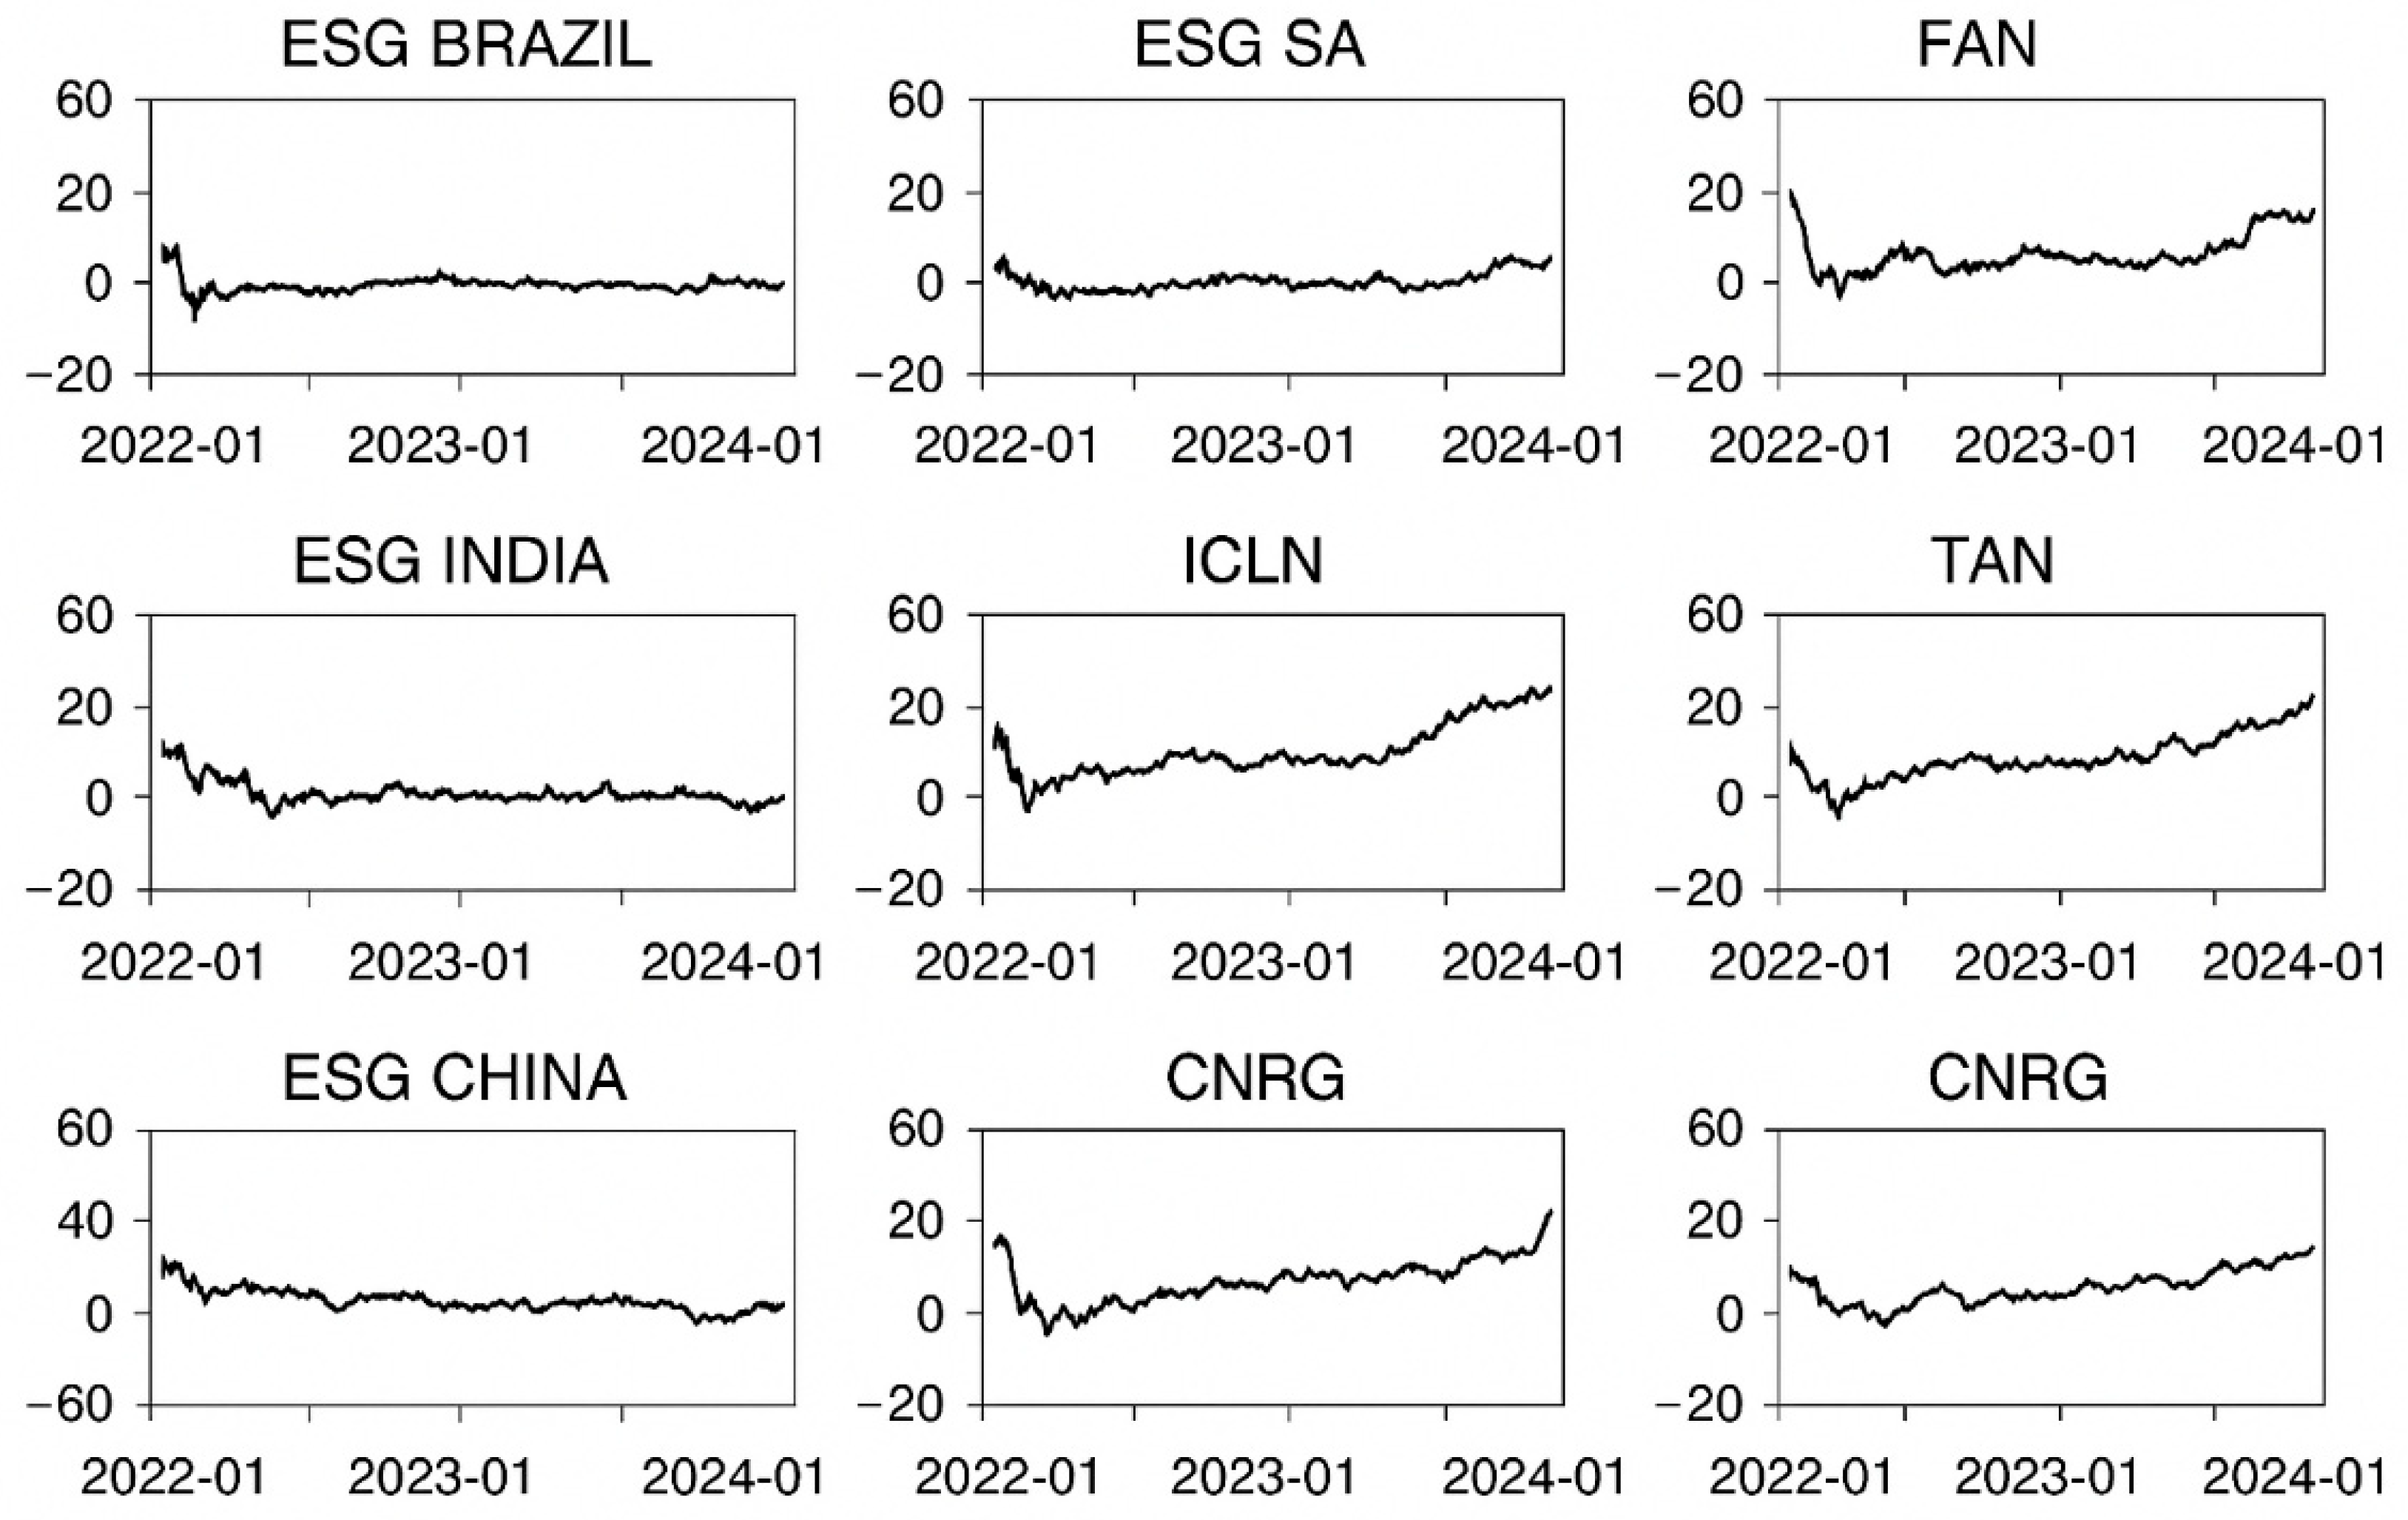
Each of the indexes’ associated returns were computed based on the formula: Rt = ln(Pt/Pt − 1), to ensure an accurate capture of the return dynamics and market volatilities. It is worth noting that the entirety of the indexes’ mean returns appeared to approach the zero value, highlighting persistence of small average returns, with ICLN and TAN demonstrating slightly negative, yet statistically non-significant returns (−0.001). Similarly, the variance appeared to draw too close to the zero value, reflecting minimal fluctuations in average returns across the indexes (see Figure 1).

3.2. Adopted Methodology

Following the works of Wan et al. (2024), as well as Diebold and Yılmaz (2009, 2012, 2014), Antonakakis and Gabauer (2017, 2020), Baruník and Křehlík (2018), and Y. Wang et al. (2020), our undertaken analysis was implemented on a three-step basis: an econometric-modeling stage, a portfolio-construction stage, as well as a daily portfolio-performance step. This multi-stage framework was specifically chosen because it allows us to capture both short-term and long-term interdependencies while also testing whether ESG and Clean Energy indexes interact dynamically across different economic regimes. Thus, the design is directly aligned with our research objective of examining spillover effects and risk transmission mechanisms.
Accordingly, the initially applied Time-Varying Parameter-Vector Autoregression (TVP-VAR) model was then transformed into a Time-Varying Parameter-Variance Moving Average (TVP-VMA) model. Following Diebold and Yılmaz (2009), this procedure should help in computing such dynamic connectedness measures as the Generalized Impulse Response Functions (GIRF) and Generalized Forecast Error Variance Decompositions (GFEVD). Thus, the net connectedness procedure was computed by subtracting the «from» connectedness from the «to» connectedness, as implemented by Antonakakis and Gabauer (2017, 2020). The adoption of a Time-Varying Parameter VAR (TVP-VAR) is motivated by the need to capture the evolving dynamics and potential structural breaks in the relationships among ESG and clean energy markets. Unlike a fixed-parameter VAR, the TVP-VAR allows model parameters to change over time, which is essential in periods of crises, policy shifts, or other external shocks that can significantly affect market behavior. Such flexibility ensures a more accurate representation of the interdependencies among the variables. This approach has been widely used in the literature to study time-varying connectedness and spillovers in financial and ESG markets (e.g., Baykut & Gökgöz, 2024; Mellouli et al., 2025; Gökgöz et al., 2025). To further strengthen the empirical justification for adopting the TVP-VAR specification, we statistically compared it with its fixed-parameter counterpart. Most lagged coefficients in the fixed VAR were found to be insignificant, indicating weak relationships. Combined with the evidence from the OLS-CUSUM stability test, these results provide robust support for the TVP-VAR approach, which accommodates time-varying relationships and more accurately captures the evolving interconnectedness among the variables (Appendix A).
Subsequently, portfolio performance was then estimated by comparing the Minimum Variance Portfolio (MVP) and the Minimum Connectedness Portfolio (MCoP), as undertaken by Y. Wang et al. (2020). Ultimately, each procedure’s corresponding dynamic Sharpe ratio was computed using the relative daily covariance matrix to attain a thoroughly agile management analysis of the ESG BRICS and Green Funds portfolios throughout the global crises’ spans.
By combining econometric modeling with portfolio optimization and backtesting, the methodological design provides a comprehensive framework that not only evaluates statistical relationships but also derives practical financial implications. This dual approach enhances the robustness of the experimental design and ensures its appropriateness for addressing the research hypotheses.

3.2.1. Time-Varying Connectedness via TVP-VAR Modeling

It is worth recalling that the TVP-VAR model is generally written under the following form:
y t = t y t 1 + ε t ε t F t 1 ~ N ( 0 , H t )
v e c t = v e c t 1 + ϵ t ϵ t F t 1 ~ N ( 0 , ω t )
where F t 1 encompasses all historical data up to t 1 ;   y t denotes the returns’ series1; ε t signifies the error variance; t and H t are m × m dimensional matrices; ϵ t and v e c t are m 2 × 1 , and ω t is an m 2 × m 2   dimensional matrix, wherein, ϵ t is the error term depicting the random fluctuations in the VAR model parameters’ evolution over time. Specifically, the lag length of the TVP-VAR model was determined using standard information criteria, namely the Akaike Information Criterion (AIC), Bayesian Information Criterion (BIC), and Hannan–Quinn Criterion (HQIC), ensuring an appropriate balance between model fit and parsimony. Furthermore, the forecast horizon for the generalized forecast error variance decomposition (GFEVD) was set to K = 10, consistent with prior literature (Diebold & Yılmaz, 2012). This choice provides a robust representation of dynamic connectedness across indices and offers a meaningful window to capture short- to medium-term spillover dynamics without introducing excessive forecast uncertainty.
At this level, the GIRF approach helps to effectively capture the dynamics among and between the entirety of the variables j, as expressed by the following:
G I R F ( φ i j , t ( K ) )
here,   φ i j , t K   measures the effect of a one-standard-deviation shock to variable j at time t on variable i over horizon K, while accounting for contemporaneous dependence among variables. K denotes the number of lags in the VAR model (K = 10).
G I R F K , H j j , F t 1 = H j j , t 1 / 2 A K , t H t ϵ t
where A K , t : represents the time-varying coefficient matrices of the TVP-VAR model at horizon K and time t, reflecting the evolving relationships among variables and serving as the basis for impulse responses and variance decompositions.
Then, the GFEVD2 depicts each variable’s distinct contribution to the variable i forecast error variance, highlighting to what extent one variable, in percentage terms, impacts another variable’s forecast error variance within the system. This procedure is formulated by as follows:
j = 1 m G I R F i j , t ( K ) = 1 , i , j = 1 m G I R F i j , t ( K ) = m ,
The total directional connectedness ‘FROM all others’, is depicted by the following:
F R O M i j , t j = 1 , i j m G F E D i = 1 m G F E D × 100
While the total directional connectedness ‘TO all others’ is expressed by the following:
T O i j , t j = 1 , i j m G F E D j = 1 m G F E D × 100
The Net TCI3 is then attained through the following:
N e t i , t ( K ) = T O i j , t F R O M i j , t
Finally, the TCI definition could be modified to attain the inter-variables’ i and j pairwise connectedness index (PCI4) scores, as follows:
T C I t e K = i ,   j = 1 , i j m A d j G F E D k ,     w i t h   0 < T C I t e K < 1

3.2.2. Portfolio Implications

The Minimum Variance Approach
Initially introduced by Markowitz (2008), the Minimum Variance Portfolio (MVP) was designed to minimize the portfolio volatility level, by optimizing asset weights, to maintain the lowest possible risk level, as follows:
O W * = V a r C o v t 1 I I   V a r C o v t 1 I
where O W * stands for a portfolio weight vector; I designates an m-dimensional vector of ones, and V a r C o v t 1 denotes the m   × m conditional variance-covariance matrix for the time span t.
In line with our model specification, the [Var-Cov]   t matrix is directly derived from the estimated Time-Varying Parameter VAR (TVP-VAR) model. It corresponds to the conditional variance-covariance matrix of the model’s innovations, defined as   Σ t = E ( U t U t F t 1 ), where U t   is the vector of innovations and F t 1 is the information set available up to time t − 1. This formulation ensures that the portfolio weights are derived consistently from the estimated conditional covariance structure.
The Minimum Connectedness Approach
At this level, the Minimum Connectedness Portfolio (MCoP) was introduced to minimize spillovers, applying pairwise connectedness indexes rather than the traditional variance or correlation matrix. On reducing interconnectedness levels, the portfolio turns out to be less sensitive to network shocks by allotting greater weights to instruments with minimal impacts ‘on’ or ‘from’ others. Hence the following:
O W * = P C I t 1 I I   P C I t 1 I
where P W C o n n e c t t 1 stands for the pairwise connectedness index matrix, and I designates the identity matrix.
Importantly, while MVP focuses solely on minimizing portfolio variance based on the variance–covariance matrix, the MCoP explicitly incorporates the network of spillover effects among assets. By accounting for how shocks propagate through the network, MCoP allocates weights to reduce not only individual asset risk but also systemic spillovers. This makes MCoP less sensitive to extreme network shocks and enhances the portfolio’s robustness under volatile market conditions, particularly during crises.

3.2.3. Portfolio Back Testing

To estimate the portfolio’s performance, we considered applying the Sharpe ratio and hedge effectiveness score. The Sharpe ratio, also dubbed the reward-to-volatility ratio (Sharpe, 1966), is determined by the following:
S R t = E ( r p   t ) V a r t
where E ( r p t ) designates the daily expected portfolio return and V a r t the daily portfolio’s standard deviation. Following Ederington (1979), hedge effectiveness is provided by the following:
H E = 1 V a r ( H e d g ) V a r ( U n h e d g )
where Var(Hedg) stands for the portfolio returns’ variance, Var (Unhedg) represents the unhedged asset’s variance, and HE designates the reduction percentage of the unhedged position’s variance. Thus, the higher the HE is, the larger the risk reduction will turn out to be.

4. Results and Discussion

4.1. Descriptive Statistics

As for the skewness values, they demonstrated well that the estimated indexes turned out to be predominantly positively skewed, wherein China’s Clean Energy (ICLN, CNRG, FAN, and TAN) and ESG indexes tended to demonstrate statistically and significantly positive skewness, showing occasionally large upward returns. Contrarily, however, India’s ESG indexes appeared to display negative skewness (−0.384), highlighting a stronger likelihood of extreme negative returns. Noteworthy, also, is that excessive kurtosis proved to persist across the entirety of indexes, particularly within the Chinese ESG (6.399), denoting persistence of frequently extreme events. In addition, the administered Jarque–Bera tests appeared to confirm the persistence of non-normal return distributions (p-values < 0.05). From a portfolio management perspective, positive skewness indicates potential for occasional large gains, whereas negative skewness, as observed in India’s ESG index, suggests higher tail risk and the need for strategies that mitigate extreme losses, such as diversification, hedging, or dynamic risk-adjusted allocation.
It is also worth noting that the administered ERS test proved to highlight the persistence of stationarity regarding the entirety of estimated indexes (p-values < 0.01), as a step necessary for the time-series’ analysis procedure. As regards the Q(20) test, it revealed a significantly persistent autocorrelation among indices, more particularly, between China’s FAN and ESG and South Africa’s ESG, implying that past returns might well serve to predict potential ones. Moreover, the administered Q2(20) test also indicated the persistence of volatility clustering among several indexes, particularly within the Brazilian, Indian, and Chinese Clean Energy (ICLN, FAN, and TAN) and ESG indexes, revealing high/low volatility spans following similar tendencies.
As illustrated in Table 1, the Kendall correlation coefficients revealed strong associations binding the Clean Energy (ICLN, CNRG, FAN, and TAN) and ESG indexes of Brazil, India, and China. The highest correlations were mainly noticeable amongst the Clean Energy indexes, particularly ICLN and TAN (0.816 *), suggesting persistence of a strong interdependence between the clean and solar energy sectors. Similarly, a strong correlation was noticeable between the ICLN and CNRG (0.783 *), as well as between CNRG and TAN (0.785 *), denoting high associations binding the renewable energy factors.
With respect to the ESG indexes, they tended to display moderate correlations with the clean energy sector. For instance, Brazil’s ESG appeared to correlate moderately with both ICLN (0.205 *) and CNRG (0.219 *), while India’s ESG demonstrated moderate correlations with FAN (0.175 *) and South Africa’s ESG (0.214 *). As for the lowest correlations, they were perceived to persist between China’s ESG and the other indexes, highlighting a noticeably weak correlation with Brazil’s ESG (0.031) yet a moderate correlation with South Africa’s ESG (0.282 *). More generally, the Clean Energy indexes appeared to reveal strongly binding correlations, while the various regions’ ESG indexes tended to be less closely connected with clean energy markets. These low correlations, particularly the 0.031 observed between the Chinese and Brazilian ESG indices, indicate potential diversification benefits, suggesting that combining ESG and Clean Energy assets in a portfolio can help reduce risk and enhance overall portfolio diversification across BRICS markets.

4.2. Dynamic Total Connectedness Analysis
The total connectedness analysis reflected key insights regarding the inter-ESG and Clean Energy indexes shock transmission process (see Table 2). In this context, the «TO» values reflect the shock transmission tendencies, while the «FROM» values indicate shock reception trends. The total connectedness average among ESG and Clean Energy indexes was 65.10%, wherein ESG Brazil appeared to display the highest connectedness level (69.04%), with ICLN and CNRG displaying a significant shock transmission role. Moreover, ESG Brazil demonstrated the lowest «FROM» value (30.96%), indicating a high independence rate, while CNRG proved to be the most highly affected by external shocks (73.69%). As for the strongest pairwise connectedness level, it was maintained between ICLN and CNRG, reflecting a high-level interdependence. Inversely, however, India’s ESG revealed the lowest pairwise connectedness rate, displaying a «TO» value of merely 17.36%, highlighting a rather isolated state. Actually, such dynamics were intended to help investors and stakeholders optimize their asset allocation undertakings while boosting the risk-adjusted returns.
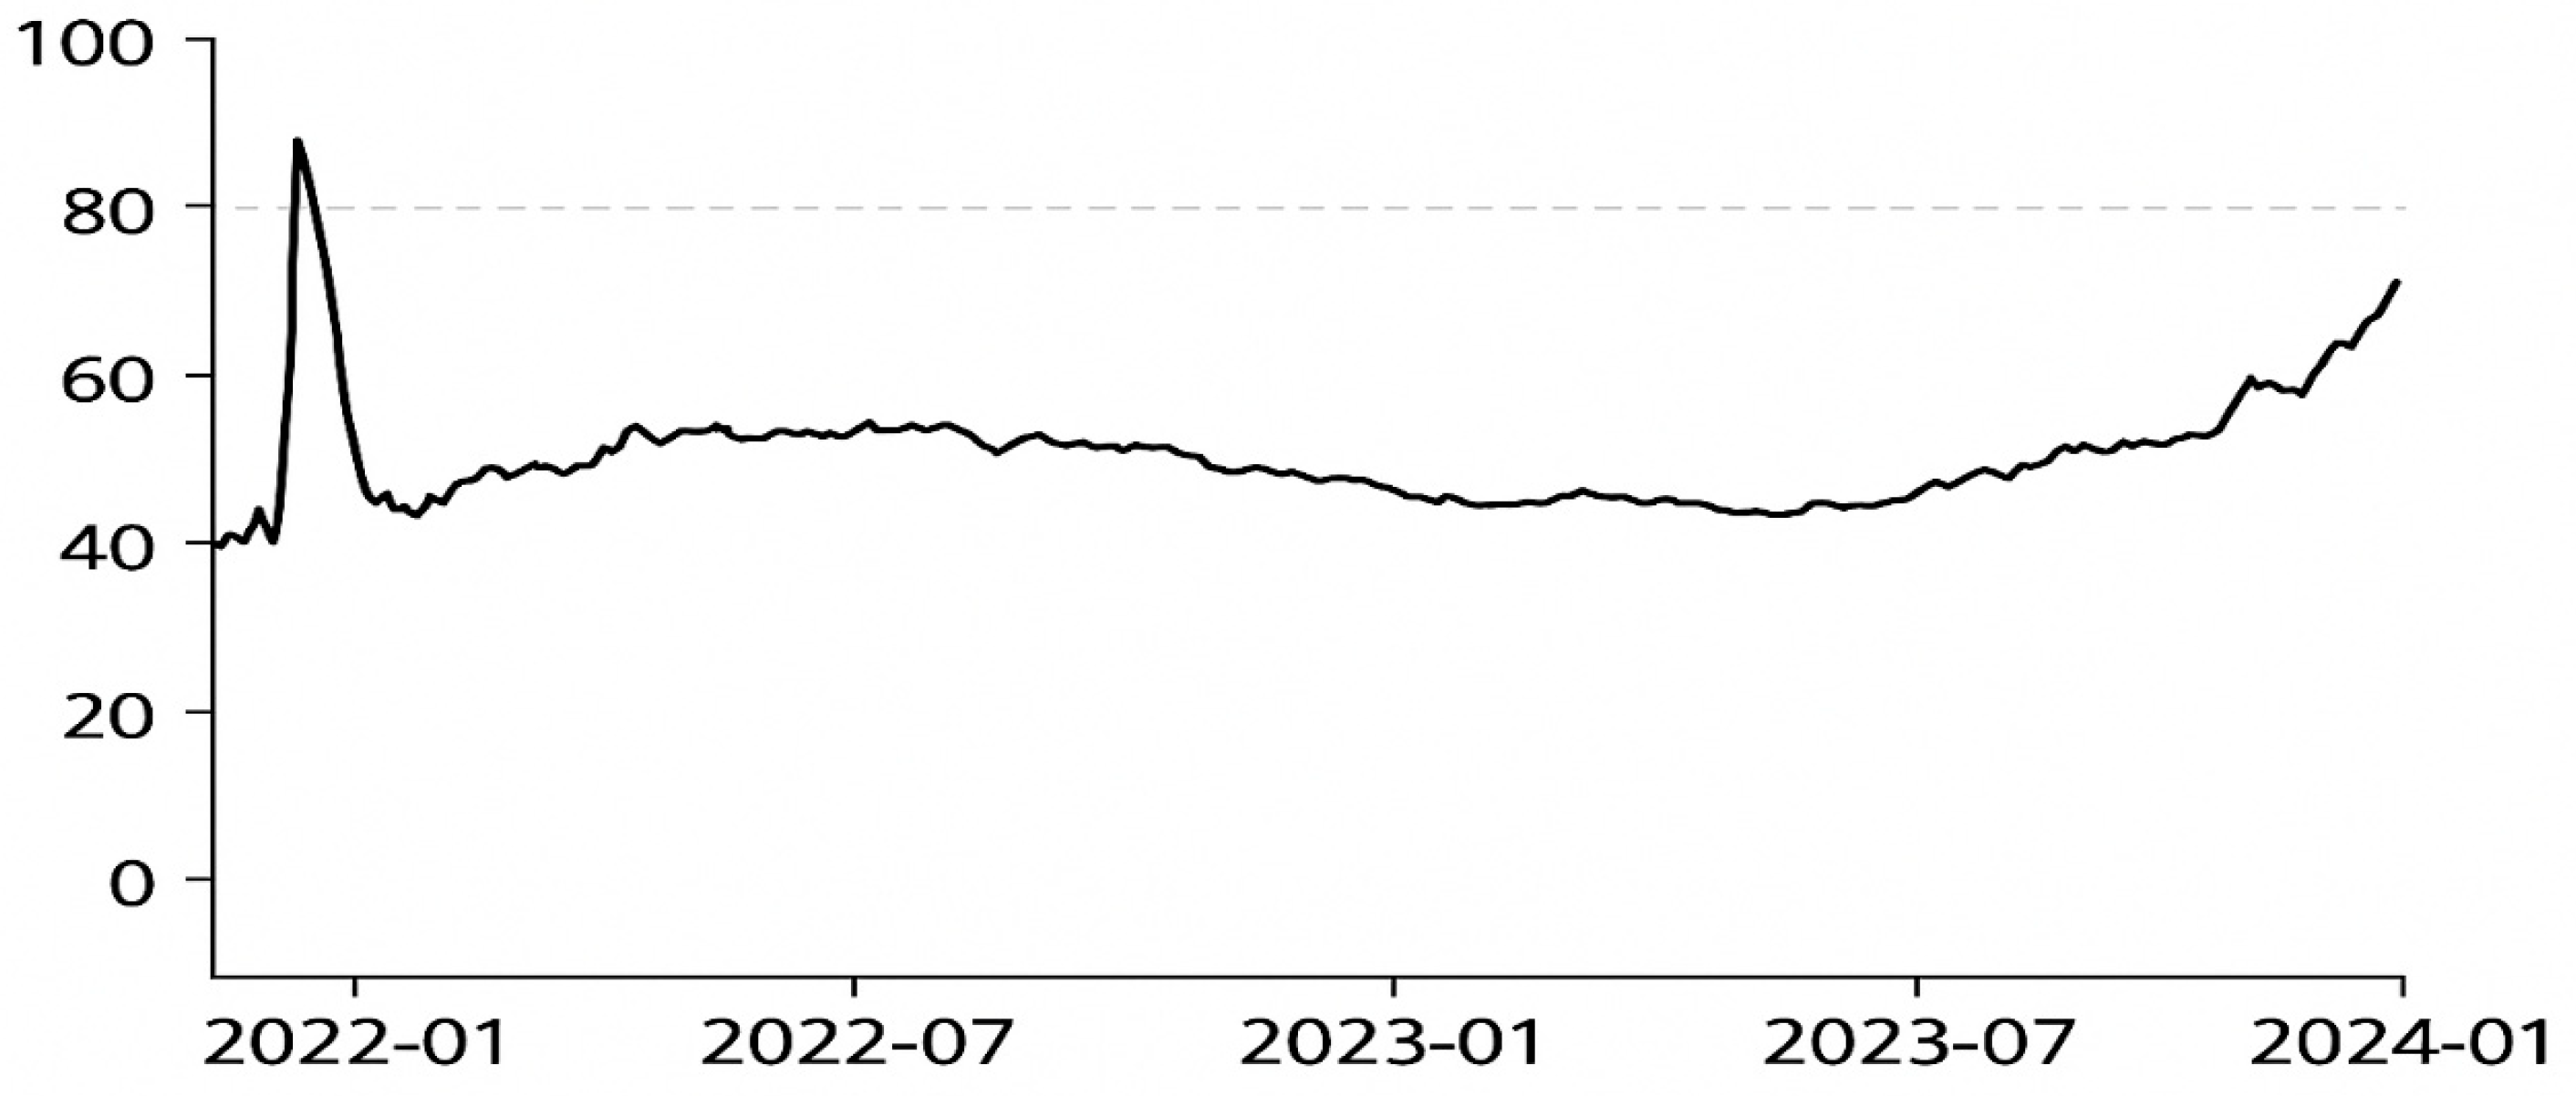
Figure 2. Dynamics of total connectedness across market indices.
Jrfm 18 00557 g002
The Total Connectedness Index (TCI) dynamics demonstrated major tendencies in the evolution of connectedness between ESG and Clean Energy indexes. For instance, in late 2021, the TCI reached a peak of approximately 85–90, indicating a period of intense interconnectivity likely driven by heightened global focus on sustainability and renewable energy transition efforts. This surge clearly reflects persistent strong shock transmission across indexes, underscoring the highly interrelated nature of these markets.
These results fully support Hypothesis H1, which posited a significant and time-varying interconnectedness between ESG and Clean Energy indexes, influenced by global economic and market events.
Consequently, stakeholders and investors are advised to closely monitor these indexes, as volatility in one index may significantly impact others. From a portfolio management perspective, these findings emphasize the need for integrated strategies and effective hedging measures to enhance resilience, particularly during periods of high interconnectedness (Bolognesi, 2023; Anvekar & Patil, 2024).
Noteworthy, also, is that a few months following the initial peak, the TCI index tended to drop significantly, revealing a noticeable decrease in spillover effects. This reduction reflected well a persistence of market stabilization, for investors started to adapt to shifting economic and regulatory conditions (Desai & Das, 2024) and evolving responses to ESG and green energy investments (Dhasmana et al., 2023). Following this transitory situation, the TCI remained somewhat stable, oscillating within the ranges of 55 and 70, triggering a period of moderate interconnection and shock transmission intensity. Towards the end of 2023, however, the TCI gradually resumed its increasing trend, enhanced by kindled interest in sustainability-bound investments, green technological progress, corporate commitment to ESG issues, and growing environmental concerns and regulatory pressures.
Hence, the TCI marking volatilities reflected well the ESG and clean energy investments’ evolving landscape, making it necessary for stakeholders to cautiously track these dynamics binding interconnectedness. Thus, the TCI continuous shifts contributed to guiding decisions as to portfolio diversification and risk management (Mats, 2024). Therefore, while moderate correlations gave rise to strategic asset allocation procedures, benefiting from milder spillover effects, increased dependencies helped in kindling amplified market co-movement potentials, thereby affecting portfolio performance (Suresha et al., 2022; X. Liu et al., 2024). A perpetual analysis of TCI indexes bound trends is therefore vital for the strategic investment undertakings to effectively adapt to leverage these bound indexes’ impacts.
Overall, the dynamic net connectedness appeared to demonstrate that the BRICS’ ESG indexes proved to be consistent net receivers of spillovers, wherein India’s ESG stood as the most prominent net receiver, mainly during the year 2022, followed by China’s ESG (Agyei et al., 2022; Almansour et al., 2023; de Boyrie & Pavlova, 2024). Inversely, however, the Clean Energy indexes, specifically ICLN and CNRG, stood as stable net transmitters. A sharp decline in the TAN and FAN net transmission process was noticeable by the turn of 2021, highlighting a reduced shock transmission impact over that time span (Figure 3).
Additional evidence of these dynamics is provided through the visualization of the average VAR parameter matrices (Figure 4). The heat map offers an intuitive overview of the transmission patterns between Clean Energy ETFs and ESG indexes. The results reveal that ICLN and CNRG act as the strongest net transmitters of shocks, exerting significant spillover effects on both clean energy and ESG markets. Conversely, ESG indexes—particularly those of India and Brazil—emerge as predominant net receivers, absorbing shocks transmitted from clean energy ETFs with limited feedback effects. This visualization further confirms the asymmetric nature of interconnectedness, where Clean Energy ETFs serve as the main sources of systemic spillovers while ESG indexes remain more vulnerable to external influences. Such evidence complements the connectedness analysis and provides investors with deeper insights into the transmission channels across these markets.
Figure 3. Dynamics of net total connectedness: emerging markets ESG indices vs. Clean Energy ETFs.
Jrfm 18 00557 g003
Figure 4. Heat map of averaged VAR parameter matrices. The red (positive) and purple (negative) color gradients indicate the intensity and direction of the relationships. Clean Energy ETFs (ICLN, CNRG, FAN, and TAN) are shown to act as primary transmitters of shocks, while BRICS’ ESG indexes appear as net receivers.
Jrfm 18 00557 g004
The BRICS’ ESG indexes persistent shock-receiving status within the network, specifically the Indian indexes, reflected well their vulnerability to external shocks throughout market volatility spans, arising highly recommended caution among stakeholders.
For results’ robustness purposes, the indexes binding correlations were further estimated through 250, 200, and 150-day rolling windows. The attained findings revealed consistent dynamic total-connectivity patterns, maintaining well that the depicted correlations were not specific to a single window length. This analysis highlighted the persistence of stable connections, with some assets behaving as consistent key shock transmitters and others as major receivers. This stability, noticeable over various time spans, testified well the reached findings’ robustness and reliability, stressing these assets’ persistent key roles within the financial network.

4.3. Dynamic Portfolios

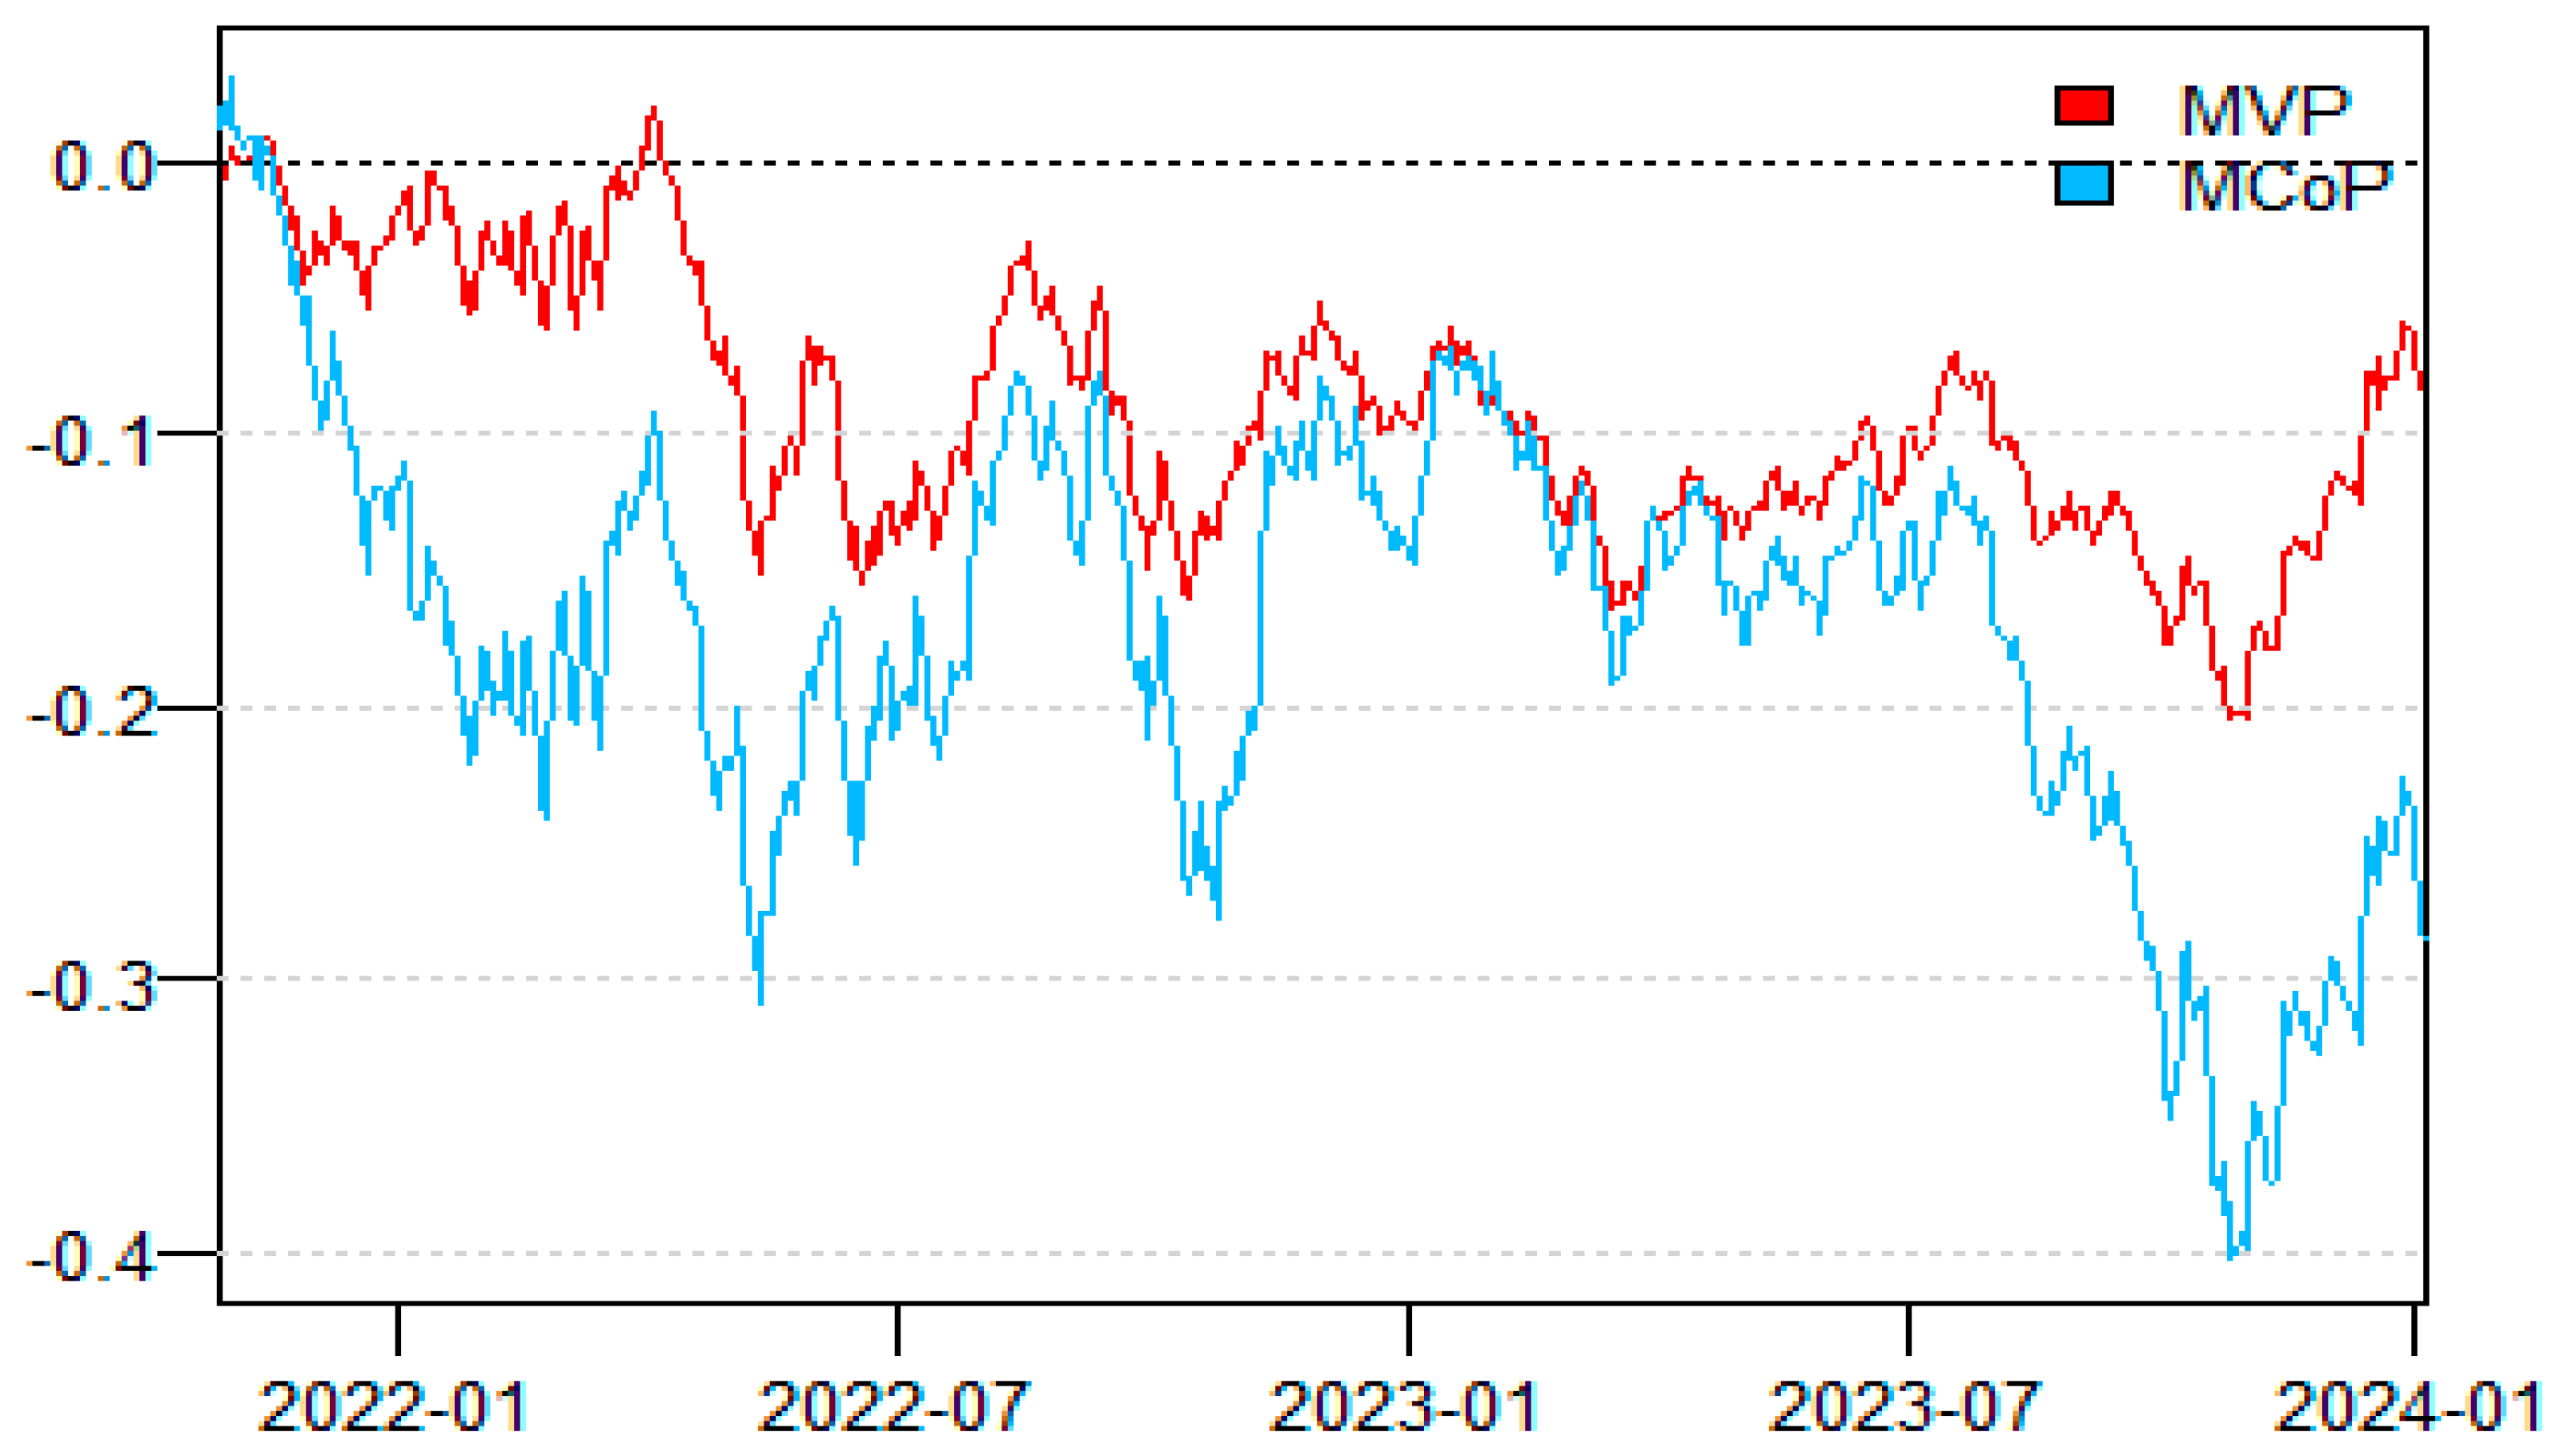
Figure 5 illustrates the BRICS’ ESG indexes as well as the green energy standards’ cumulative returns, wherein the red line designates the Minimum Variance Portfolio, while the blue line stands for the Minimum Connectedness Portfolio. As could be noted, both portfolios tended to follow fluctuating trends, marking noticeable dips in mid-2022 and the third quarter of 2023, followed by a recovery and resumed particularly in late 2023 and early 2024. It is worth noting that the MCoP remained more unstable than the MVP, displaying sharper trends, mainly regarding 2022 and late 2023 Q2. Such a result implied that the MVP tended to maintain rather constant returns, whereas the MCoP proved to undergo more frequent volatilities, yet providing higher return potentials throughout the recovery spans. This finding confirms Hypothesis H2, as the MCoP’s ability to generate superior returns during recovery phases despite higher volatility demonstrates that strategies accounting for interconnectedness outperform traditional minimum variance approaches in terms of risk-adjusted performance. Generally, both portfolios exhibited negative cumulative growth and significant volatility trends. Such contrasting features reflected well the crucial aspect of the strategic asset allocation process (Karniol-Tambour et al., 2020). Hence, stakeholders aspiring for greater stability might well opt for an MVP type of portfolio, whereas those willing to bear greater risks could appeal to the MCoP option (Lu et al., 2016).
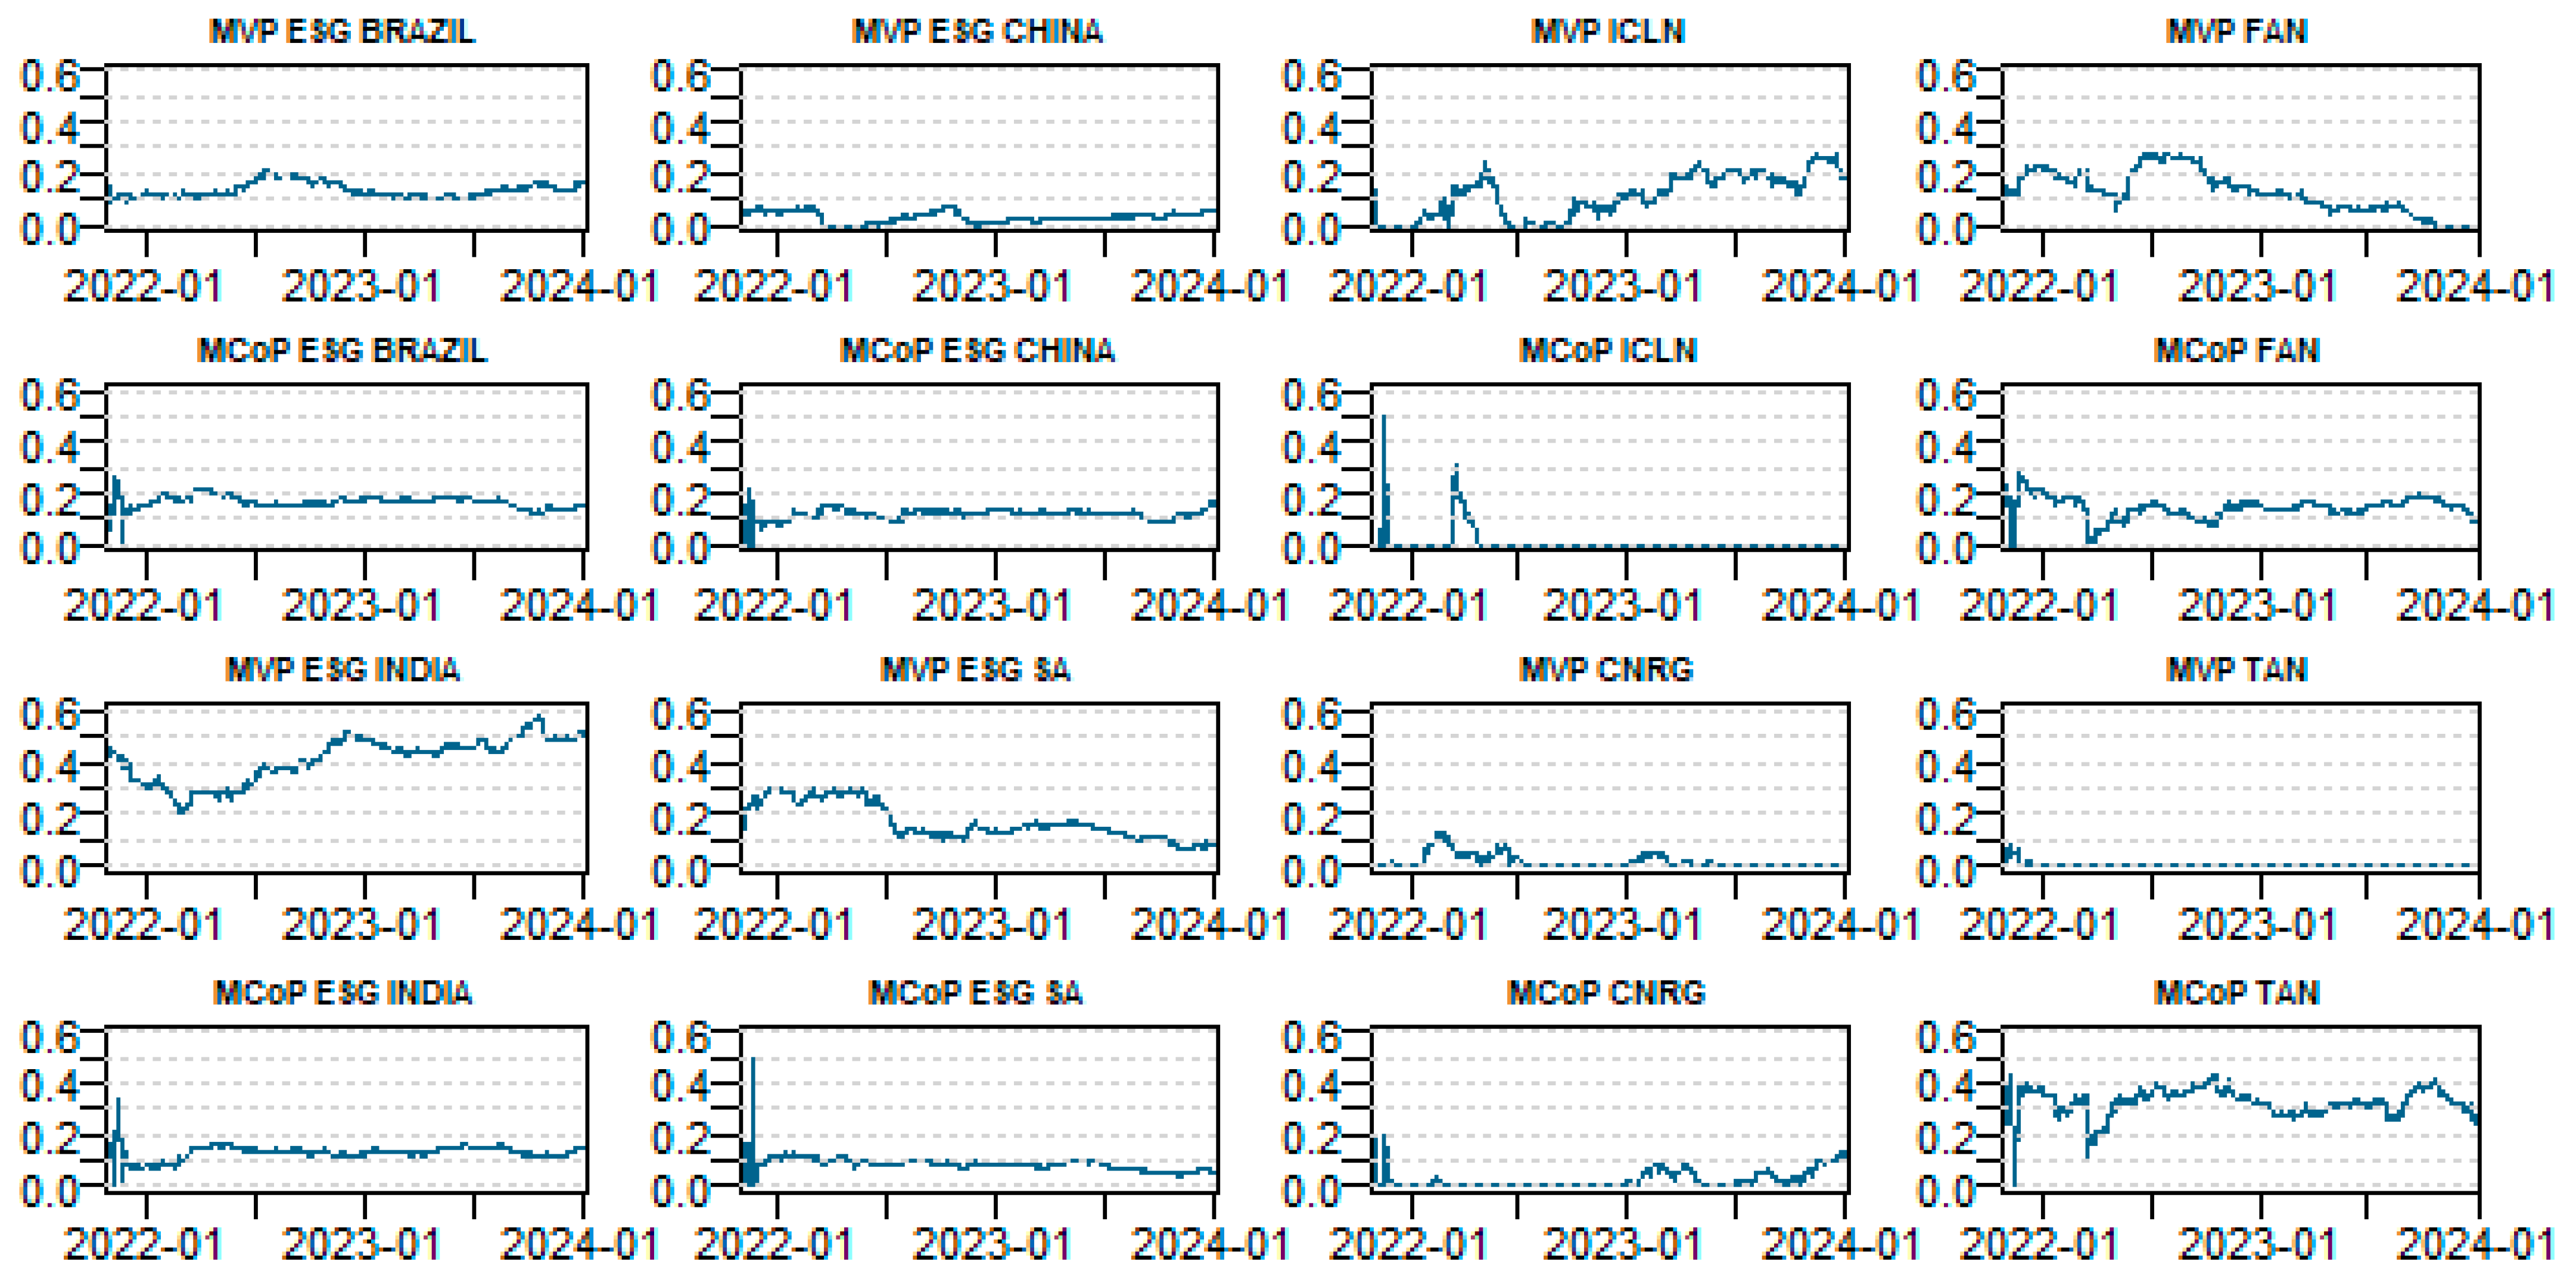
The MVP construct (Figure 6) highlights the Indian ESG predominance growth, whose weight steadily increased from 20% to 50%, displaying rather growing importance and stable returns, which helped boost the portfolio’s adjusted risk performance (Beloskar & Nageswara Rao, 2024). Additionally, the Clean Energy indexes’ ICLN also gained greater weight, particularly following the 2022 Q2, stimulated mainly by the investors’ growing renewable energy concerns, along with higher performance in the face of market fluctuations (Bolognesi, 2023; Höl, 2024). Inversely, however, the wind energy FAN index steadily underwent a decreased weight, owing mainly to a number of relevant recurrent challenges, including regulatory shifts, fierce market competition, and lower performance relative to other indexes (Nalam & Kamble, 2023; Anvekar & Patil, 2024; Sajith et al., 2024).
As to the divergent trends marking the Indian ESG, ICLN, and FAN indexes, they testified well to the urgent requirement for more efficiently adaptive portfolio policies (Hiremath & Kattuman, 2017; Dhasmana et al., 2023; Bolognesi, 2023; Anvekar & Patil, 2024). This finding stressed well that India’s ESG and ICLN indexes could have contributed to further promoting stability and performance, while the FAN index’s reassessed role might have helped in optimizing allocations and attenuating the underperforming sectors associated risks (Martí-Ballester, 2022; Rao et al., 2023; Höl, 2024).
With regard to the Minimum Connectivity Portfolio (MCoP), the Brazilian, Chinese, Indian, and South African ESG indexes accounted for 10% to 20%, while the FAN and TAN indexes’ contribution exceeded the rate of 20%, and the TAN index held the largest share. Such a result underlined well the TAN index’s significant risk management and resilience role throughout the market volatility marked spans. Thus, the MCoP intervened by displaying a remarkable ability to balance the ESG and Clean Energy indexes, stressing the TAN index’s role in promoting portfolio resilience through targeting the emerging ESG market growth potential (G. Liu & Hamori, 2020; Sharma et al., 2022; Lopez-Penabad et al., 2025). At this level, analysis of the Minimum Variance Portfolio raised important insights regarding the ESG and Clean Energy indexes’ crucial role in mitigating portfolio volatilities. In this respect, India’s ESG index, scoring the highest allocation rate (41%), demonstrated a noticeable risk reduction potential, despite its low hedging efficiency (HE) score (0.22), denoting a very limited volatility attenuating role. As for Brazil’s ESG index (13% allocation rate), it recorded a moderate risk mitigation power and a slightly higher HE ratio (0.61). With respect to China’s ESG index, which registered a minimal weight of 3%, it recorded a high HE ratio of the rate of 0.86, reflecting a strong hedging capacity.
Worth highlighting, also, is that the ICLN index, which scored a weight of 11%, ended up recording an HE ratio of 0.83, demonstrating an effective volatility attenuating potential, while the CNRG index, recording a 1% weight ratio, displayed a remarkable risk reduction power, scoring a high HE ratio (0.86). With respect to the FAN index (13% weight ratio), it exhibited a highly positive risk management contribution, recording a highly robust HE ratio (0.70). Contrarily, however, the TAN index, with a weight of 0%, only minimally contributed to the risk-mitigating process, despite the highly recorded HE ratio (0.91) (see Table 3).
In sum, the analysis turned out to emphasize the need to prioritize the highest HE ratios marking indexes for effective portfolio stability-enhancement purposes, despite their low-recorded allocation potential scores.
Such a review outlined well the necessity and appropriateness of incorporating such portfolio assets as Chinese ESG (Piserà & Chiappini, 2022) and CNRG indexes, even though they proved to score lower weight ratios, owing to their effectively significant risk management potentials and volatility-attenuating contributions, leading to more resilient investment policies and sustainable growth.
Additionally, a review of the Minimum Connectedness Portfolio revealed important insights as to the various ESG and Clean Energy indexes’ valuable contribution in optimizing portfolio dynamics while reducing autocorrelation risks. Worth citing, in this respect, was the Brazilian ESG index, which reflected the largest allocation ratio (17%), highlighting its remarkably noticeable assets’ connectedness managing role (Table 4). Indeed, despite such a crucial role, this index’s hedging effectiveness (HE) ratio did not exceed the threshold of −0.06, denoting that it might not maintain as effective hedging advantages as other indexes5. Contrarily, India’s ESG index, which scored a mean weight of 13%, tended to display a noticeably negative HE ratio (−1.15), indicating a further contribution in potential risk increase rather than mitigating risk effects.
More interestingly, also, was that the Chinese ESG, which recorded a weight of 12%, proved to demonstrate a positive HE ratio (0.62), reflecting a relatively strong hedging potential, despite its moderately scored allocation ratio (Piserà & Chiappini, 2022). Such a finding denoted well that, despite its moderate allocation power, China’s ESG proved to retain a remarkably strong risk attenuation potential. Actually, this positive HE ratio signified that this particular index was highly effective in mitigating overall portfolio volatility and boosting its resilience against external shocks. Thus, China’s ESG proved to offer a critical contribution in bolstering the portfolio’s protective features, which made it stand as a valuable asset target opportunity for stakeholders intending to promote their risk management process while maintaining their ESG-oriented investments. In effect, by complementarily supplementing other portfolio assets, they help maintain effective hedging potential, thus enhancing and improving the entire investment strategy’s overall stability and performance. For instance, while recording an 8% allocation ratio score, the South African ESG index also registered a negative HE ratio of −0.23, making it less favorably liable to effectively contribute to promoting the risk management strategy’s overall level. Furthermore, the ICLN (iShares Global Clean Energy ETF) index scored only a minimal allocation rate of 1%, yet recorded a positive HE ratio (0.52), maintaining a respectable risk hedging and attenuation effectiveness. Nevertheless, with just a minimal 2% contribution in portfolio results, the CNRG (SPDR S&P Kensho Clean Power ETF) index managed to ensure a positive HE ratio (0.62), exhibiting a significantly effective hedging potential.
In this respect, the FAN (First Trust Global Wind Energy ETF) index helped maintain an average weight of 14%, along with a solid HE ratio (0.17), displaying a moderate risk management role. Such a result implied that while FAN helped provide a certain level of risk mitigation capacity, its effectiveness did not seem to be as pronounced as the other portfolio assets. Hence, despite its sustaining role in diversifying the portfolio, investors might have to combine FAN with other stronger hedging indexes, displaying rather robust risk-strategy management potentials. With respect to the TAN (Invesco Solar ETF) index, which recorded the highest weight (32%) and strongest HE (0.74) ratios, it exhibited a remarkable interconnectedness reduction potential within the portfolio. Overall, this review outlined the selected assets binding complex dynamics within a Minimum Connectedness Portfolio context. Accordingly, some assets, namely the Indian and Brazilian ESGs, turned out to be rather prone to involve further risks, while others, such as the Chinese and TAN ESGs, appeared to demonstrate considerable portfolio efficiency-boosting potential for managing correlations and attenuating overall risk (Bangur et al., 2022; Beloskar & Rao, 2023).
The attained results underscored the need for a more careful assets’ selection process, based on their respective hedging effectiveness levels, to adequately fit the MCoP index. Thus, prioritizing such indexes as the Chinese and TAN ESGs might well enhance the relevant portfolios’ potential for effectively managing interconnections and minimizing risk exposure. Similarly, a more thorough allocation reassessment undertaking regarding such indexes as the Indian and Brazilian ESG indexes seemed seriously imposed for the relevant potential risks to be effectively attenuated (Dai, 2021; Li et al., 2022; Natasha & Rajitha, 2023; Gidage et al., 2024; Rout & Das, 2024). Such undertakings, we reckon, might well bring in rather balanced, resilient investment policies, likely to boost the portfolios’ overall effective performance.
Table 5 evinces a review of the dynamic bivariate portfolio hedge ratios raised valuable insights as to the various ESG and Clean Energy indexes’ risk reduction efficiency and portfolio performance optimization. In this respect, the Brazilian ESG/ICLN pair, which recorded a mean hedge ratio of 0.20, appeared to demonstrate a moderate risk mitigation potential, maintained by a hedge effectiveness (HE) ratio of 0.10, denoting a relatively low hedging potential, despite its critical portfolio role. Contrarily, the ESG Brazil/FAN combination, scoring a higher mean hedge ratio (0.25), tended to demonstrate a stronger risk management power, despite the modestly recorded HE ratio (0.10). Hence, stakeholders were rather recommended to prioritize the highly effective hedging combinations likely to optimize their portfolios and lower risk exposure levels (Harris & Shen, 2006; Peng et al., 2016; X. Liu et al., 2024).
As to the Chinese ESG/ICLN pair, which recorded a mean hedge ratio of 0.21, it demonstrated a rather moderate risk-attenuating power. Still, the low associated hedge effectiveness (HE) ratio (0.05) suggested well that this combination could only provide a limited hedging potential. This result implied that while this pairwise combination helped maintain a certain risk reduction level, its overall portfolio volatility managing effectiveness proved to be relatively weak relative to other pairwise combinations. Regarding the South African ESG/FAN combination, it exhibited a robust mean hedge ratio (0.26), along with an HE ratio of 0.15, which testified to its significantly positive risk management potential. Investors might therefore consider supplementing this dual pair-oriented allocation, owing to its associated portfolio resilience-boosting capacity in the face of market volatilities. In effect, prioritizing these strong hedging ratios and liable combinations could help maintain a rather effective and stable investment undertaking, thereby further boosting risk-adjusted return levels.
Concerning the ESG India enclosing pairs, the associated hedge ratios turned out to be relatively low. In this regard, the Indian ESG/ICLN pair ended up scoring a mean hedge ratio of 0.09 and an HE ratio of 0.05, reflecting a rather limited hedging efficiency potential. Similar tendencies were also noted for other pairwise associations involving the Indian ESG index, highlighting its low rank mean regarding risk mitigation efficiency. As regards the CNRG involving pairwise combinations, they demonstrated valuable insights as to their respective hedging potential. Hence, the CNRG/ESG Brazil couple appeared to record a mean hedge ratio of 0.48, demonstrating a substantial hedging potential, along with an HE ratio of 0.12, highlighting a moderate risk reduction efficiency. Similarly, the CNRG/ESG India combination appeared to score a respectable mean hedge ratio (0.45) yet, a noticeably lower HE ratio (0.05), highlighting that despite its significant hedging power, this combination’s volatility-attenuating potential seemed less effective in respect of the Brazil-involving pair.
On the other hand, the CNRG/ESG China pairwise combination tended to score a mean hedge ratio of 0.21, along with an HE ratio of 0.05, reflecting a rather limited hedging effectiveness as compared to other pairs. Hence, investors might have to reconsider their opting for such a combination and account for other alternative combinations likely to ensure a higher hedging efficiency for the sake of boosting their portfolios’ overall stability and shielding against adverse market trends. Opting for the most reliably effective and synchronous pairs could therefore help in maintaining rather effective risk management and performance strategies.
With respect to the CNRG/ESG SA combination, it proved to record the highest mean hedge ratio (0.53), along with an HE ratio of 0.12, which testified to its effectively strong portfolio risk-attenuating potential. These findings testified well to the CNRG’s significant role in maintaining the portfolio’s overall performance, particularly in joint combination with Brazil’s and South Africa’s ESG indexes, though with varying degrees of effectiveness.
As to the last TAN/ESG SA pair, it ended up recording the highest hedge ratio (0.66), highlighting its remarkably high-risk attenuating power, despite its moderately recorded HE ratio (0.13). This finding implied well that even though the TAN index contained a considerable risk management potential, its associated effectiveness did not prove to be fully optimized. All in all, this conducted analysis helped outline the importance of estimating both of the hedging strategies bound hedge ratios and effectiveness levels within the portfolio management strategy (Zou & Yang, 2008; Pradhan, 2011; Kharbanda & Singh, 2018; Umar et al., 2024). Thus, although the TAN/ESG SA pairwise combination demonstrated a promising risk reduction potential, the relatively low-scored HE ratio underlined well that there was still room for efficiency improvement to be effectively applied. Therefore, through accurately refining the allocation policies and exploring more effective complementary indexes, investors might well boost their risk mitigation strategies’ overall effectiveness rates. In this context, such a devised approach could noticeably help in attaining rather resilient portfolios likely to capitalize on strong hedge ratios while simultaneously maximizing the stable returns’ potential, particularly in the prevalence of volatile market conditions.

4.4. Back-Testing Portfolios

At this level, we proceeded with measuring the portfolio’s robustness level and performance potential by applying a back-testing metric framework using Sharpe ratios for the purpose of estimating the relevant risk-adjusted returns. Accordingly, high Sharpe ratios would imply higher performance in relation to the risk level, wherein positive values would indicate risk-free rate exceeding returns, while negative values would reflect lower performance levels. In this context, the Minimum Variance Portfolio and Minimum Connectedness Portfolio associated daily Sharpe ratios were, respectively, depicted in Figure 7, highlighting their respective risk management and portfolio construction effectiveness rates. Such a procedure was aimed to outline the potential advantages associated with the asset allocation optimization process, in terms of boosting returns and risk management levels, as a contribution to further enhancing the ESG and green investment-associated discourse (Pástor et al., 2021; Yoshino et al., 2023; Xiao et al., 2024; Arouri et al., 2025).
As could be noted, the MVP-associated Sharpe ratio appeared to fluctuate, displaying positive and negative values regarding the 2022–2024 time span, reaching the highest peaks in mid- and late 2022, while generally oscillating between the −2 and +2 values. As for the mid-2022 and scattered parts of 2023 marking performance spikes, they implied high returns achieved throughout favorable condition spans, while the negative territory persistent dip frequencies indicated market volatility-associated vulnerabilities. Hence, stakeholders might well take advantage of dynamic management strategies to draw certain benefits, thereby maintaining an effective risk-adjusted performance.
Contrarily, however, the MCoP displayed rather consistently positive Sharpe ratios, usually exceeding the value 2, highlighting a somewhat persistent stability and lower volatility status relative to the MVP. Such a steady performance was mainly owed to risk-averse stakeholders, who tended to prioritize reliability over the MVP’s greater, yet more variable, returns. Indeed, the MCoP-associated resilience throughout turbulent market conditions made it stand as a rather safe, consistent, risk-adjusted returns-desired option.
On comparing both portfolio options, it became clear that the MVP proved to stand as more liable to noticeable risk-adjusted returns’ fluctuations, as demonstrated through its frequent oscillations between positive and negative Sharpe-ratio values. Such fluctuations reflected higher volatility levels, wherein the MVP tended to undergo sharp as well as under-performance spans. On the other hand, the MCoP exhibited rather persistent stability, showing consistent positive Sharpe ratios during the same time spans.
Such consistency testified well to the MCoP’s supremacy in terms of risk management and returns’ optimization procedures, rendering it a favorable choice for risk-and-reward-aspiring stakeholders. This pattern empirically confirms Hypothesis H3, as the MCoP’s stable and positive risk-adjusted performance demonstrates its effectiveness in providing hedging opportunities and improving portfolio diversification, thereby offering robust risk management benefits. It is actually the MCoP-associated remarkable stability that made it a fit choice for investors targeting long-term stability and risk reduction performance, particularly during persistent market uncertainties and volatilities. This underscores the strategic importance of asset selection and portfolio design in setting up optimal risk-return frameworks, guiding investors towards sustainable investment schedules.
Furthermore, the study acknowledges the inherent limitations associated with the data period. Although relatively short and potentially limiting the generalizability of the results, it captured an exceptional context of global crises, notably the COVID-19 pandemic and the Russia-Ukraine conflict. This context offers a unique opportunity to analyze portfolio performance under extreme market conditions. Several promising avenues for future research have been identified, including extending the analysis to longer time horizons to assess the persistence of these dynamics under more stable conditions or further exploring the effects of geopolitical tensions, climate change, and evolving regulatory frameworks. Addressing these dimensions will be crucial for developing more resilient asset allocation models in an increasingly complex global landscape.
Finally, the findings carry several practical implications. Investors can optimize portfolios by integrating clean energy and ESG indices to achieve both financial and sustainability goals. Regulators may apply the results to establish reliable green investment norms and strategies, while policymakers can use the insights to support long-term market stability and promote sustainable economic growth. These applications underscore the broader relevance of dynamic portfolio management in the evolving green economy.

5. Conclusions

Under the priority to enhance sustainable growth practices, ESG and Clean Energy indexes stand as critical sustainability-boosting mechanisms, distinctly addressing the relevant enhancement aspects and investment needs (W. P. Liu et al., 2024; Deng & Cheng, 2019; Zhang et al., 2022; Alharbi et al., 2025; Muhammad & Huang, 2025). In this context, the present research was designed to explore and estimate the extent of these intervening indexes targeted performance and risk management efficiency scores within the BRICS nations’ context, measured via Minimum Variance Portfolio and Minimum Connectedness Portfolio modeling techniques, accounting for the interconnectedness, hedging effectiveness, and risk attenuation dimensions’ drawn insights (Kanamura, 2023; Dias et al., 2024; Jlassi et al., 2025; Arouri et al., 2025).
The reached results revealed well that such indexes as India and Brazil’s ESGs tended to heighten risk levels, owing to associated low hedging effectiveness, while China’s ESG and TAN proved to help in boosting portfolio performance and attenuating interconnectedness issues (Sinha Ray & Goel, 2023; W. P. Liu et al., 2024). Furthermore, the MVP’s scored fluctuationary Sharpe ratios appeared to outline its bound volatility, while the MCoP tended to provide consistent positive risk-adjusted returns, testifying to its stability-maintaining nature (Hiremath & Kattuman, 2017; Dhasmana et al., 2023; Belkhir et al., 2025).
Such findings highlighted well the necessity to select the most optimal asset option based on risk reduction ends to achieve the most effectively resilient portfolio constructs. By prioritizing the highly hedging effective indexes, investors would rather tend to favor rather balanced and high-performing portfolios. In sum, the present work was designed to further enrich and provide an additional contribution to the sustainable finance-relevant literature while providing practical insights useful for effectively optimizing the asset allocation process. Potential research veins might well be targeted to further estimating the effects of such intervening factors as geopolitical events, climatic changes, and regulatory shifts on stirring the ESG and Clean Energy indexes’ volatilities.
This study is not without limitations, particularly the relatively short data period, which may limit generalizability. Future research could extend the analysis over longer horizons and further examine the effects of geopolitical events, climate change, and evolving regulations on ESG and clean energy investments, providing valuable insights for more resilient and sustainable portfolio strategies.

Author Contributions

Conceptualization, M.B. and A.J.; methodology, M.B.; software, M.B.; validation, A.J.; formal analysis, M.B.; investigation, M.B.; resources, M.B.; data curation, M.B.; writing—original draft preparation, M.B.; writing—review and editing, A.J.; visualization, A.J.; supervision, A.J.; project administration, A.J. All authors have read and agreed to the published version of the manuscript.

Funding

This research did not receive any particular grant from any public, commercial, or non-profit making sectors or organizations pertaining funding agencies.

Institutional Review Board Statement

Not applicable.

Informed Consent Statement

Not applicable.

Data Availability Statement

The original contributions presented in this study are included in the article. Further inquiries can be directed to the corresponding author.

Conflicts of Interest

The authors declare no conflict of interest relevant to the present paper’s publication process.

Appendix A

Figure A1. OLS-CUSUM stability tests for fixed-parameter VAR model.
Jrfm 18 00557 g0a1

Notes

1
The time span t denotes daily observations.
2
GFED: It is a key measure in the Diebold and Yilmaz connectedness framework. It quantifies the proportion of the forecast error variance of variable i attributable to shocks from variable j at a given horizon H. Its generalized version (GFEVD) is robust to the ordering of variables in the VAR system.
3
TCI (Total Connectedness Index): The system-wide total connectedness index, measuring the overall degree of interdependence among all variables. It is calculated as the normalized sum of directional spillovers between all pairs of variables.
4
The pairwise connectedness index matrix at time t, where each element (PCIt)ij measures the directed connectedness from variable j to variable i.
5
The HE ratio did not prove to be statistically significant.

References

  1. Agyei, S. K., Owusu Junior, P., Bossman, A., Asafo-Adjei, E., Asiamah, O., & Adam, A. M. (2022). Spillovers and contagion between BRIC and G7 markets: New evidence from time-frequency analysis. PLoS ONE, 17(7), e0271088. [Google Scholar] [CrossRef]
  2. Alharbi, S. S., Naveed, M., Ali, S., & Moussa, F. (2025). Sailing towards sustainability: Connectedness between ESG stocks and green cryptocurrencies. International Review of Economics & Finance, 98, 103848. [Google Scholar] [CrossRef]
  3. Almansour, B. Y., Elkrghli, S., Gaytan, J. C. T., & Mohnot, R. (2023). Interconnectedness dynamic spillover among US, Russian, and Ukrainian equity indices during the COVID-19 pandemic and the Russian–Ukrainian war. Heliyon, 9(12), e22974. [Google Scholar] [CrossRef]
  4. Antonakakis, N., & Gabauer, D. (2017). Refined measures of dynamic connectedness based on TVP-VAR. Journal of Risk and Financial Management, 10(4), 1–19. [Google Scholar]
  5. Antonakakis, N., & Gabauer, D. (2020). A New methodology for measuring time-varying connectedness and its application to global economic uncertainty. Journal of Business & Economic Statistics, 38(1), 181–195. [Google Scholar] [CrossRef]
  6. Anvekar, R., & Patil, S. (2024). Circular economy goals, large capitalisation, and ESG funds: An investment perspective. Φинaнcы: тeopия и пpaктикa, 28(2), 206–218. [Google Scholar] [CrossRef]
  7. Arouri, M., Mhadhbi, M., & Shahrour, M. H. (2025). Dynamic connectedness and hedging effectiveness between green bonds, ESG indices, and traditional assets. European Financial Management. [Google Scholar] [CrossRef]
  8. Bangur, P., Bangur, R., Jain, P., & Shukla, A. (2022). Investment certainty in ESG investing due to COVID-19: Evidence from India. International Journal of Sustainable Economy, 14(4), 429–440. [Google Scholar] [CrossRef]
  9. Baruník, J., & Křehlík, T. (2018). Measuring the frequency dynamics of financial connectedness and systemic risk. Journal of Financial Econometrics, 16(2), 271–296. [Google Scholar] [CrossRef]
  10. Baykut, E., & Gökgöz, H. (2024). Volatility connectedness of MOVE index and bond returns. Etikonomi, 23(1), 27–46. [Google Scholar]
  11. Belkhir, N., Masmoudi, W. K., Loukil, S., & Belguith, R. (2025). Portfolio diversification and dynamic interactions between clean and dirty energy assets. International Journal of Energy Economics and Policy, 15(1), 519. [Google Scholar] [CrossRef]
  12. Beloskar, V. D., & Nageswara Rao, S. V. D. (2024). Screening activity matters: Evidence from ESG portfolio performance from an emerging market. International Journal of Finance & Economics, 29(3), 2593–2619. [Google Scholar] [CrossRef]
  13. Beloskar, V. D., & Rao, S. N. (2023). Did ESG save the day? Evidence from India during the COVID-19 crisis. Asia-Pacific Financial Markets, 30(1), 73–107. [Google Scholar] [CrossRef]
  14. Bhattacherjee, P., Mishra, S., Bouri, E., & Wee, J. B. (2024). ESG, clean energy, and petroleum futures markets: Asymmetric return connectedness and hedging effectiveness. International Review of Economics & Finance, 94, 103375. [Google Scholar] [CrossRef]
  15. Bolognesi, E. (2023). New trends in asset management. Springer books. Palgrave Macmillan Cham. [Google Scholar] [CrossRef]
  16. Bouzguenda, M., & Jarboui, A. (2025). Unravelling interconnectedness and dynamic behaviour in financial networks: Insights from asset analysis. Global Business Review. [Google Scholar] [CrossRef]
  17. Chen, S., & Fan, M. (2024). ESG ratings and corporate success: Analyzing the environmental governance impact on Chinese companies’ performance. Frontiers in Energy Research, 12, 1371616. [Google Scholar] [CrossRef]
  18. Dai, Y. (2021). Can ESG investing beat the market and improve portfolio diversification? Evidence from China. The Chinese Economy, 54(4), 272–285. [Google Scholar] [CrossRef]
  19. de Boyrie, M. E., & Pavlova, I. (2024). Connectedness with commodities in emerging markets: ESG Leaders vs. conventional indexes. Research in International Business and Finance, 71, 102456. [Google Scholar] [CrossRef]
  20. Deng, X., & Cheng, X. (2019). Can ESG indices improve the enterprises’ stock market performance?—An empirical study from China. Sustainability, 11(17), 4765. [Google Scholar] [CrossRef]
  21. Desai, R., & Das, L. (2024). Investor reaction to the mandatory reporting of corporate ESG practices in the Indian stock market: An event study approach (2020–2021). International Journal of Green Economics, 18(1), 45–60. [Google Scholar] [CrossRef]
  22. Dhasmana, S., Ghosh, S., & Kanjilal, K. (2023). Does investor sentiment influence ESG stock performance? Evidence from India. Journal of Behavioral and Experimental Finance, 37, 100789. [Google Scholar] [CrossRef]
  23. Dias, R., Galvão, R., Cruz, S., Irfan, M., Teixeira, N., & Gonçalves, S. (2024). Exploring the relationship between clean energy indices and oil prices: A ten-day window approach. Journal of Ecohumanism, 3(4), 1462–1472. [Google Scholar] [CrossRef]
  24. Diebold, F. X., & Yılmaz, K. (2009). Measuring financial asset return and volatility spillovers, with application to global equity markets. The Economic Journal, 119(534), 158–171. [Google Scholar] [CrossRef]
  25. Diebold, F. X., & Yılmaz, K. (2012). Better to give than to receive: Predictive directional measurement of volatility spillovers. International Journal of Forecasting, 28(1), 57–66. [Google Scholar] [CrossRef]
  26. Diebold, F. X., & Yılmaz, K. (2014). On the network topology of variance decompositions: Measuring the connectedness of financial firms. Journal of Econometrics, 182(1), 119–134. [Google Scholar] [CrossRef]
  27. Ederington, L. H. (1979). The hedging performance of the new futures markets. The journal of finance, 34(1), 157–170. [Google Scholar] [CrossRef]
  28. Friede, G., Busch, T., & Bassen, A. (2015). ESG and financial performance: Aggregated evidence from more than 2000 empirical studies. Journal of Sustainable Finance & Investment, 5(4), 210–233. [Google Scholar] [CrossRef]
  29. Fu, Y., Qi, H., Chen, Y., & Wang, Y. (2024). Short-term impacts vs. long-term contributions: The role of clean energy and ESG investments in China. Renewable Energy, 233, 121131. [Google Scholar] [CrossRef]
  30. Gheorghe, C., Panazan, O., Alnafisah, H., & Jeribi, A. (2025). ETF resilience to uncertainty shocks: A cross-asset nonlinear analysis of AI and ESG strategies. Risks, 13(9), 161. [Google Scholar] [CrossRef]
  31. Gidage, M., Bhide, S., Pahurkar, R., & Kolte, A. (2024). ESG performance and systemic risk nexus: Role of firm-specific factors in Indian companies. Journal of Risk and Financial Management, 17(9), 381. [Google Scholar] [CrossRef]
  32. Gökgöz, H., Ben Salem, S., Bejaoui, A., & Jeribi, A. (2025). Connectedness structure and volatility dynamics between BRICS markets and international volatility indices: An investigation. International Journal of Finance & Economics, 30(3), 2981–3002. [Google Scholar] [CrossRef]
  33. Harris, R. D., & Shen, J. (2006). Hedging and value at risk. Journal of Futures Markets: Futures, Options, and Other Derivative Products, 26(4), 369–390. [Google Scholar] [CrossRef]
  34. Hiremath, G. S., & Kattuman, P. (2017). Foreign portfolio flows and emerging stock market: Is the midnight bell ringing in India? Research in International Business and Finance, 42, 544–558. [Google Scholar] [CrossRef]
  35. Höl, A. Ö. (2024). Long memory in clean energy exchange traded funds. Politická ekonomie, 72(3), 478–500. [Google Scholar] [CrossRef]
  36. Jain, M., Sharma, G. D., & Srivastava, M. (2019). Can sustainable investment yield better financial returns: A comparative study of ESG indices and MSCI indices. Risks, 7(1), 15. [Google Scholar] [CrossRef]
  37. Jeribi, A., & Béjaoui, A. (2025). Time-frequency volatility transmission and connectedness across gold, bitcoin, green and blue ETFs: A revisit. Development and Sustainability in Economics and Finance, 7, 100070. [Google Scholar] [CrossRef]
  38. Ji, H., Naeem, M., Zhang, J., & Tiwari, A. K. (2024). Dynamic dependence and spillover among the energy related ETFs: From the hedging effectiveness perspective. Energy Economics, 136, 107681. [Google Scholar] [CrossRef]
  39. Jlassi, N. B., Lahiani, A., Mefteh-Wali, S., & Mselmi, N. (2025). ESG and sustainable development: Evidence from DCC-GARCH R2 decomposed connectedness measures. Finance Research Letters, 79, 107222. [Google Scholar] [CrossRef]
  40. Kanamura, T. (2023). Clean energy and (E) SG investing from energy and environmental linkages. Environment, Development and Sustainability, 25(9), 9779–9819. [Google Scholar] [CrossRef] [PubMed]
  41. Karniol-Tambour, K., Stendevad, C., Hochman, D., Davidson, J., & Kreiter, B. (2020). Building a balanced and scalable strategic asset allocation to meet financial and ESG impact goals 1. In Sustainable investing (pp. 303–328). Routledge. [Google Scholar] [CrossRef]
  42. Kharbanda, V., & Singh, A. (2018). Futures market efficiency and effectiveness of hedge in Indian currency market. International Journal of Emerging Markets, 13(6), 2001–2027. [Google Scholar] [CrossRef]
  43. Kocmanová, A., Dočekalová, M. P., Meluzín, T., & Škapa, S. (2020). Sustainable investing model for decision makers (based on research of manufacturing industry in the czech republic). Sustainability, 12(20), 8342. [Google Scholar] [CrossRef]
  44. Li, X., Xu, F., & Jing, K. (2022). Robust enhanced indexation with ESG: An empirical study in the Chinese Stock Market. Economic Modelling, 107, 105711. [Google Scholar] [CrossRef]
  45. Liu, G., & Hamori, S. (2020). Can one reinforce investments in renewable energy stock indices with the ESG index? Energies, 13(5), 1179. [Google Scholar] [CrossRef]
  46. Liu, W. P., Lo, L. Y., & Huang, W. C. (2024). Market reactions to firms’ inclusion in the sustainability index: Further evidence of TCFD framework adoption. Journal of Information Science & Engineering, 40(4), 799–811. [Google Scholar]
  47. Liu, X., Liang, W., Fu, Y., & Huang, G. Q. (2024). Dual environmental, social, and governance (ESG) index for corporate sustainability assessment using blockchain technology. Sustainability, 16(10), 4272. [Google Scholar] [CrossRef]
  48. Lopez-Penabad, M. C., Iglesias-Casal, A., Maside-Sanfiz, J. M., & Larbi, O. B. (2025). Clean energy and fintech: A scientometric study on spillovers and hedging in investment portfolios. Energy Strategy Reviews, 59, 101703. [Google Scholar] [CrossRef]
  49. Lu, J. R., Hwang, C. C., Liu, M. L., & Lin, C. Y. (2016). An incentive problem of risk balancing in portfolio choices. The Quarterly Review of Economics and Finance, 61, 192–200. [Google Scholar] [CrossRef]
  50. Markowitz, H. M. (2008). Portfolio selection: Efficient diversification of investments. Yale University Press. [Google Scholar]
  51. Martí-Ballester, C. P. (2022). Do renewable energy mutual funds advance towards clean energy-related sustainable development goals? Renewable Energy, 195, 1155–1164. [Google Scholar] [CrossRef]
  52. Mats, V. (2024). Hedge performance of different asset classes in varying economic conditions. Radioelectronic and Computer Systems, 2024(1), 217–234. [Google Scholar] [CrossRef]
  53. Mellouli, D., Bejaoui, A., & Jeribi, A. (2025). Analyzing quantile and frequency connectedness between natural gas and stock markets amid turbulent times: Evidence from G7, BRICS, and Gulf countries. Journal of Chinese Economic and Business Studies, 1–41. [Google Scholar] [CrossRef]
  54. Muhammad, S., & Huang, X. (2025). Dynamic dependence and network analysis between renewable energy tokens, sustainability-driven investments and equity markets: Portfolio implications. Renewable Energy, 251, 123256. [Google Scholar] [CrossRef]
  55. Nalam, H., & Kamble, K. (2023). Global wind turbines market. Tribology & Lubrication Technology, 79(3), 20–22. [Google Scholar]
  56. Natasha, P., & Rajitha, K. S. (2023). Volatility of returns in stock market investments: A study of BRICS Nations. Φинaнcы: тeopия и пpaктикa, 27(2), 87–98. [Google Scholar] [CrossRef]
  57. Özkan, O., Meo, M. S., & Younus, M. (2024). Unearthing the hedge and safe-haven potential of green investment funds for energy commodities. Energy Economics, 138, 107814. [Google Scholar] [CrossRef]
  58. Pástor, Ľ., Stambaugh, R. F., & Taylor, L. A. (2021). Sustainable investing in equilibrium. Journal of Financial Economics, 142(2), 550–571. [Google Scholar] [CrossRef]
  59. Peng, H., Tan, X., & Chen, Y. (2016). Discretion of dynamic position adjustment in hedging strategy. Romanian Journal of Economic Forecasting, 19(2), 86. [Google Scholar]
  60. Piserà, S., & Chiappini, H. (2022). Are ESG indexes a safe-haven or hedging asset? Evidence from the COVID-19 pandemic in China. International Journal of Emerging Markets, 19(1), 56–75. [Google Scholar] [CrossRef]
  61. Porteu de la Morandière, A., Vaucher, B., & Bouchet, V. (2025). Do ESG exclusions have an effect on portfolio risk and diversification? Journal of Impact & ESG Investing, 5(4), 159. [Google Scholar]
  62. Pradhan, K. (2011). The hedging effectiveness of stock index futures: Evidence for the S&P CNX nifty index traded in India. South East European Journal of Economics and Business, 6(1), 111–123. [Google Scholar] [CrossRef]
  63. Rao, A., Dagar, V., Sohag, K., Dagher, L., & Tanin, T. I. (2023). Good for the planet, good for the wallet: The ESG impact on financial performance in India. Finance Research Letters, 56, 104093. [Google Scholar] [CrossRef]
  64. Rout, B. S., & Das, N. M. (2024). BRICS stock markets performances during COVID-19: Comparison with other economic crises. Vikalpa, 49(3), 230–243. [Google Scholar] [CrossRef]
  65. Sajith, S., Aswani, R. S., Bhatt, M. Y., & Kumar, A. (2024). Challenges and opportunities for offshore wind energy from global to Indian context: Directing future research. International Journal of Energy Sector Management, 19(1), 117–145. [Google Scholar] [CrossRef]
  66. Sharma, G. D., Sarker, T., Rao, A., Talan, G., & Jain, M. (2022). Revisiting conventional and green finance spillover in post-COVID world: Evidence from robust econometric models. Global Finance Journal, 51, 100691. [Google Scholar] [CrossRef]
  67. Sharpe, W. F. (1966). Mutual fund performance. The Journal of Business, 39(1), 119–138. [Google Scholar] [CrossRef]
  68. Siche, J. R., Agostinho, F., Ortega, E., & Romeiro, A. (2008). Sustainability of nations by indices: Comparative study between environmental sustainability index, ecological footprint and the emergy performance indices. Ecological Economics, 66(4), 628–637. [Google Scholar] [CrossRef]
  69. Sinha Ray, R., & Goel, S. (2023). Impact of ESG score on financial performance of Indian firms: Static and dynamic panel regression analyses. Applied Economics, 55(15), 1742–1755. [Google Scholar] [CrossRef]
  70. Strezov, V., Evans, A., & Evans, T. J. (2017). Assessment of the economic, social and environmental dimensions of the indicators for sustainable development. Sustainable Development, 25(3), 242–253. [Google Scholar] [CrossRef]
  71. Suresha, B., Srinidhi, V. R., Verma, D., Manu, K. S., & Krishna, T. A. (2022). The impact of ESG inclusion on price, liquidity and financial performance of Indian stocks: Evidence from stocks listed in BSE and NSE ESG indices. Investment Management & Financial Innovations, 19(4), 40. [Google Scholar] [CrossRef]
  72. Šević, A., Nerantzidis, M., Tampakoudis, I., & Tzeremes, P. (2024). Sustainability indices nexus: Green economy, ESG, environment and clean energy. International Review of Financial Analysis, 96, 103615. [Google Scholar] [CrossRef]
  73. Tripathi, V., & Jham, J. (2020). Corporate environmental performance and stock market performance: Indian evidence on disaggregated measure of sustainability. Journal of Corporate Accounting & Finance, 31(3), 76–97. [Google Scholar] [CrossRef]
  74. Umar, Z., Usman, M., Umar, M., & Ktaish, F. (2024). Interdependencies and risk management strategies between green cryptocurrencies and traditional energy sources. Energy Economics, 136, 107742. [Google Scholar] [CrossRef]
  75. Wan, J., Yin, L., & Wu, Y. (2024). Return and volatility connectedness across global ESG stock indexes: Evidence from the time-frequency domain analysis. International Review of Economics & Finance, 89, 397–428. [Google Scholar] [CrossRef]
  76. Wang, Y., Xie, B., & Wen, F. (2020). Measuring dynamic connectedness in financial markets: Time-varying evidence from the stock markets and commodities. Energy Economics, 86, 104642. [Google Scholar] [CrossRef]
  77. Wang, Z. P., Tao, C. Q., & Shen, P. Y. (2014). Regional green technical efficiency with its influencing factors analysis based on ecological footprint. Population Resources and Environment in China, 24, 35–40. [Google Scholar]
  78. Xiao, Z., Ma, S., Zhang, Z., & Xiang, L. (2024). Shaping sustainable future: The role of central bank in galvanizing corporate ESG performance. Finance Research Letters, 67, 105787. [Google Scholar] [CrossRef]
  79. Yang, J., Agyei, S. K., Bossman, A., Gubareva, M., & Marfo-Yiadom, E. (2024). Energy, metals, market uncertainties, and ESG stocks: Analysing predictability and safe havens. The North American Journal of Economics and Finance, 69, 102030. [Google Scholar] [CrossRef]
  80. Yoshino, N., Yuyama, T., & Taghizadeh-Hesary, F. (2023). Diversified ESG evaluation by rating agencies and net carbon tax to regain optimal portfolio allocation. Asian Economic Papers, 22(3), 81–96. [Google Scholar] [CrossRef]
  81. Zhang, S., Li, F., Zhou, Y., Hu, Z., Zhang, R., Xiang, X., & Zhang, Y. (2022). Using net primary productivity to characterize the spatio-temporal dynamics of ecological footprint for a resource-based city, Panzhihua in China. Sustainability, 14(5), 3067. [Google Scholar] [CrossRef]
  82. Zhu, L., Zhang, H., Liao, H., & Peng, R. (2020). Evaluation of ecological sustainability in Chongqing, China based on 3D ecological footprint model. International Journal of Design & Nature and Ecodynamics, 15, 89–96. [Google Scholar] [CrossRef]
  83. Zou, B., & Yang, G. X. (2008). Optimal hedging strategy of futures. Journal of Beijing Institute of Technology (English Edition), 17(Suppl.), 167–170. [Google Scholar]
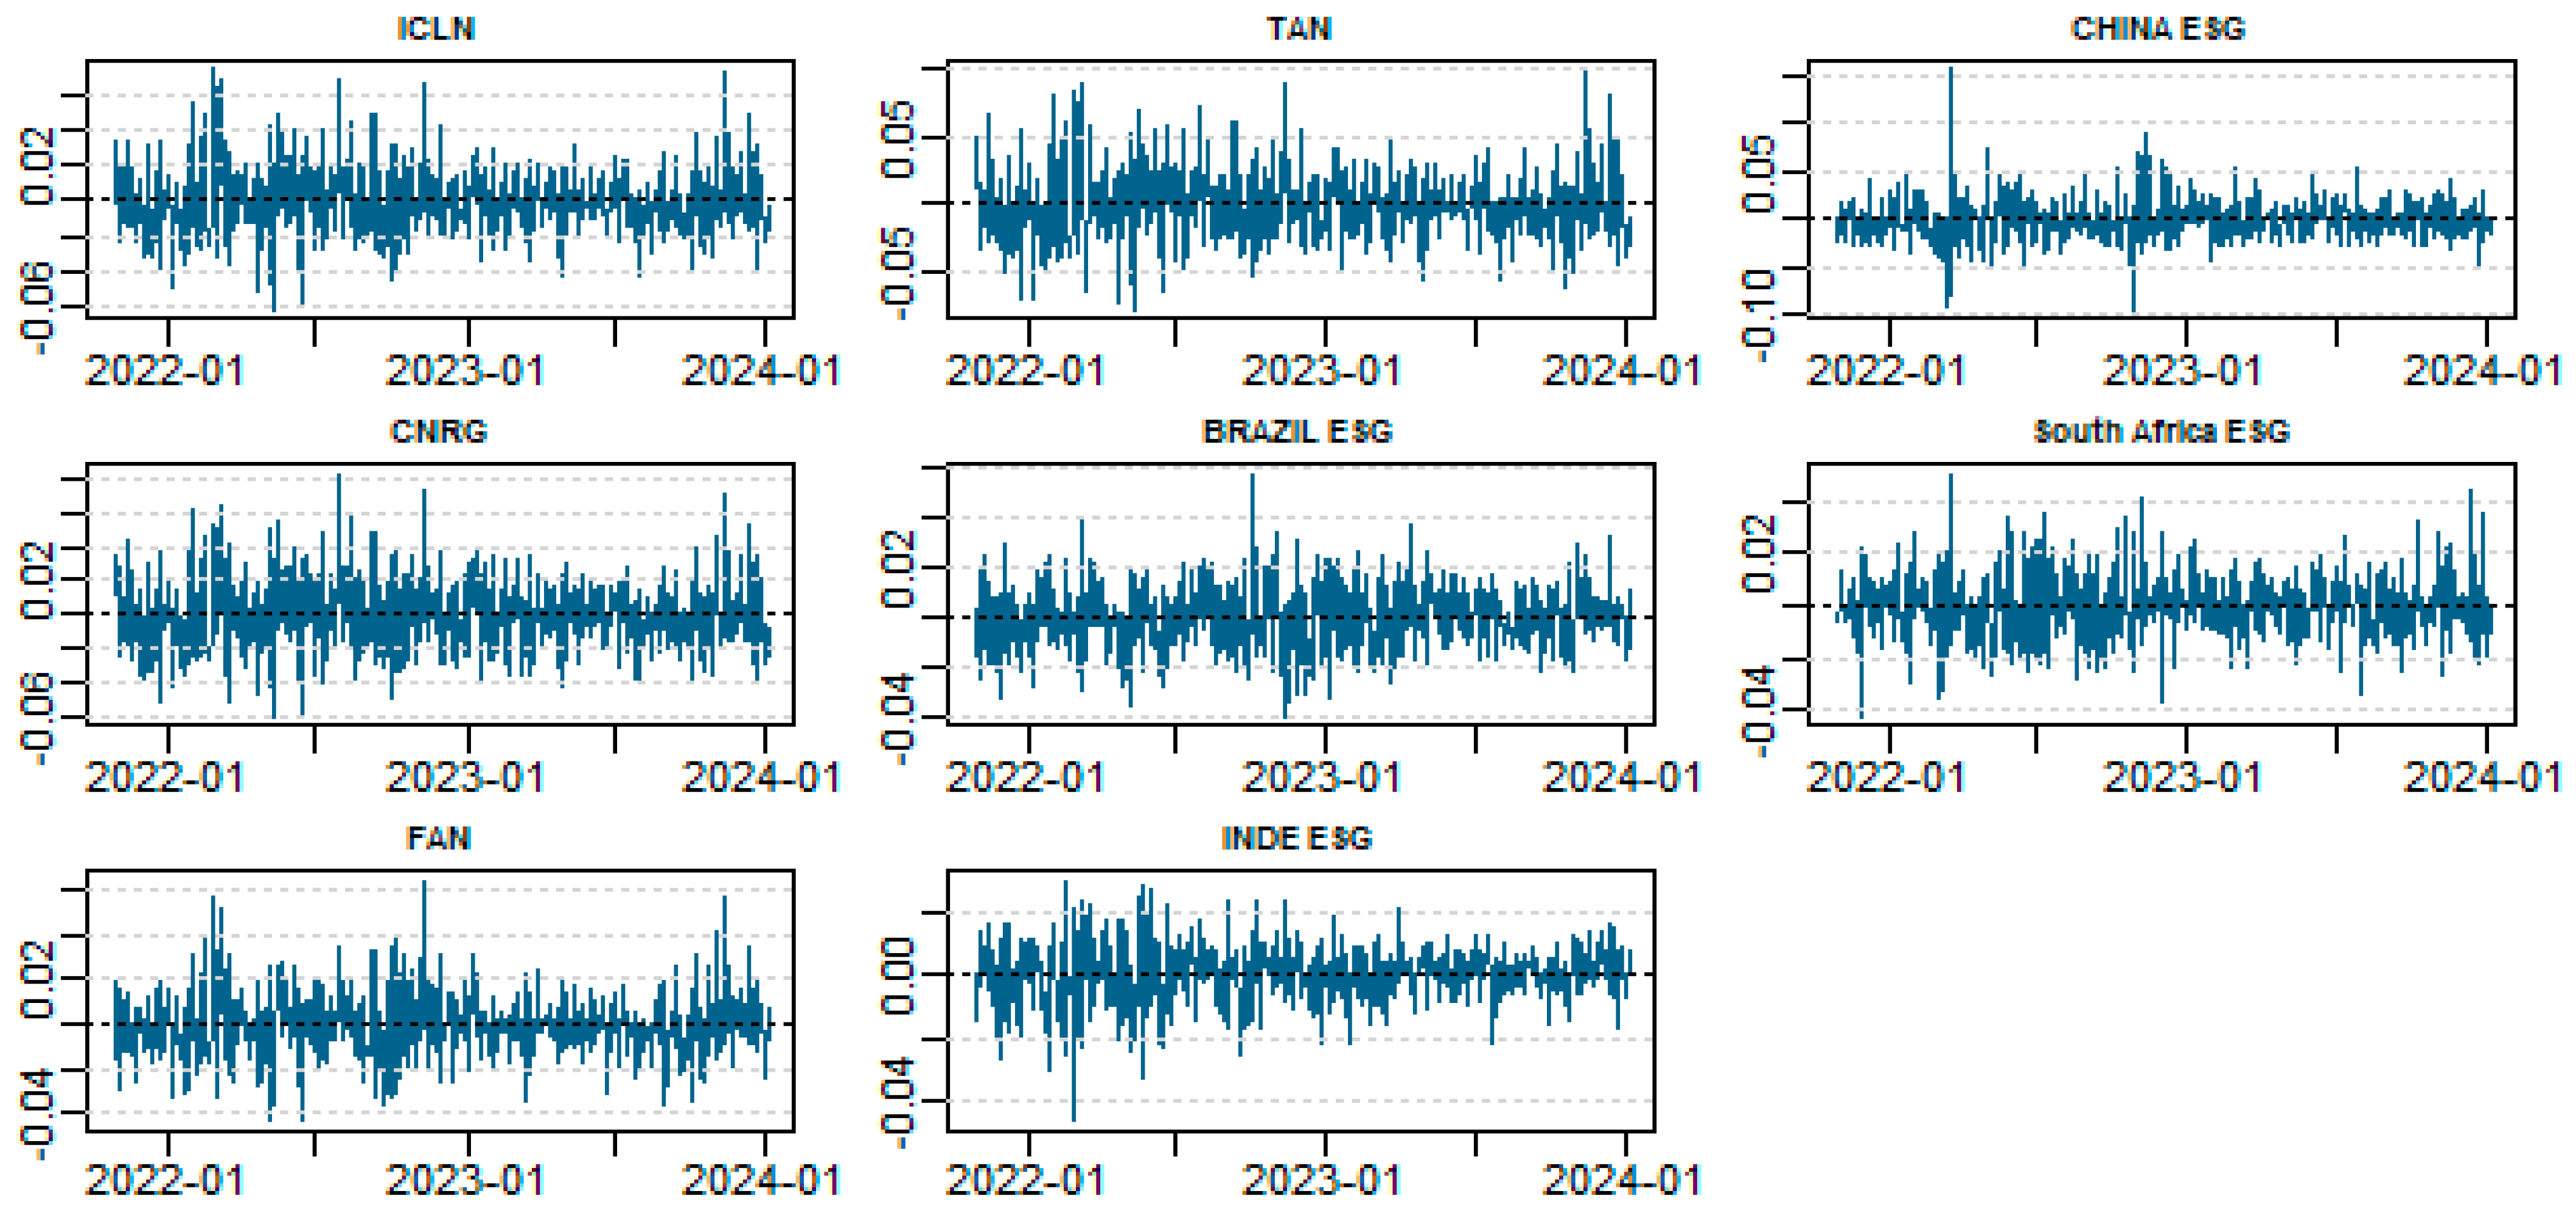
Figure 1. Time series of dynamic returns for BRICS ESG indices and Clean Energy ETFs.
Jrfm 18 00557 g001
Figure 5. Cumulative returns of the Minimum Variance Portfolio (MVP) versus the Mean Connectedness Gain Portfolio (MCGP).
Jrfm 18 00557 g005
Figure 6. Dynamic asset allocation: multivariate portfolio weights.
Jrfm 18 00557 g006
Figure 7. Comparative evolution of the Sharpe ratios for the Minimum Variance Portfolio (MVP) and the Mean Connectedness Portfolio (MCoP). MVP (Minimum Variance Portfolio) and MCoP (Minimum Connectedness Portfolio) weight dynamics from January 2022 to January 2024. Shaded areas indicate periods of high market volatility. MCoP shows more stable allocations during stress periods, confirming its superior risk management properties.
Jrfm 18 00557 g007
Table 1. Descriptive statistics and Kendall correlation coefficients.
ICLNCNRGFANTANESG BRAZILESG INDIAESG CHINAESG SOUTH
Mean−0.0010.0000.000−0.0010.0000.000−0.0010.000
(0.412)(0.581)(0.495)(0.419)(0.983)(0.649)(0.207)(0.969)
Variance0000.001000
Skewness0.571 *0.403 *0.525 *0.498 *0.065−0.384 *0.886 *0.203
(0.000)(0.000)(0.000)(0.000)(0.520)(0.000)(0.000)(0.046)
Ex.Kurtosis1.434 *0.636 *1.932 *1.037 *0.648 *1.766 *6.399 *1.367 *
(0.000)(0.009)(0.000)(0.000)(0.009)(0.000)(0.000)(0.000)
JB80.234 *25.184 *115.404 *49.338 *10.431 *88.585 *1052.623 *48.528 *
(0.000)(0.000)(0.000)(0.000)(0.005)(0.000)(0.000)(0.000)
ERS−3.242−5.069−9.639−2.588−9.203−9.528−4.398−9.452
(0.001)(0.000)(0.000)(0.010)(0.000)(0.000)(0.000)(0.000)
Q(20)20.23010.67123.062 *15.1526.99314.33027.906 *24.149 *
(0.016)(0.434)(0.004)(0.115)(0.824)(0.152)(0.000)(0.003)
Q2(20)27.994 *14.79148.936 *24.054 *21.874 *89.643 *90.732 *11.009
(0.000)(0.130)(0.000)(0.003)(0.008)(0.000)(0.000)(0.400)
kendallICLNCNRGFANTANESG BRAZILESG INDIAESG CHINAESG SOUTH
ICLN1.000 *0.783 *0.629 *0.816 *0.205 *0.137 *0.140 *0.200 *
CNRG0.783 *1.000 *0.525 *0.785 *0.219 *0.131 *0.129 *0.200 *
FAN0.629 *0.525 *1.000 *0.521 *0.188 *0.175 *0.132 *0.219 *
TAN0.816 *0.785 *0.521 *1.000 *0.167 *0.113 *0.165 *0.205 *
ESG BRAZIL0.205 *0.219 *0.188 *0.167 *1.000 *0.092 *0.0310.131 *
ESG INDIA0.137 *0.131 *0.175 *0.113 *0.092 *1.000 *0.197 *0.214 *
ESG CHINA0.140 *0.129 *0.132 *0.165 *0.0310.197 *1.000 *0.282 *
ESG SOUTH0.200 *0.200 *0.219 *0.205 *0.131 *0.214 *0.282 *1.000 *
* indicates that the result is statistically significant.
Table 2. Average total connectedness matrix of Clean Energy and ESG indexes 1.
ESG BRAZILESG INDIAESG CHINAESG SAICLNCNRGFANTANFROM
ESG BRAZIL69.043.240.783.806.197.056.013.8830.96
ESG INDIA5.1352.103.096.918.628.798.237.1347.90
ESG CHINA2.402.9056.7712.056.176.256.147.3243.23
ESG SA3.295.449.6153.556.956.557.936.6946.45
ICLN2.371.361.342.7626.3123.0918.9023.8873.69
CNRG2.821.491.532.9424.2327.3115.4024.2772.69
FAN2.861.741.323.9523.0117.8131.7517.5768.25
TAN1.591.202.113.1525.0624.3115.1427.4672.54
TO20.4517.3619.7635.57100.2393.8477.7590.73455.70
Inc.Own89.5069.4776.5489.12126.54121.16109.51118.18cTCI/TCI
NET−10.50−30.53−23.46−10.8826.5421.169.5118.1865.10/56.96 2
NPT2.000.001.003.007.006.004.005.00
The dynamic total connectedness shown in Figure 2 and Figure 3 was estimated using the Time-Varying Parameter Vector Autoregressive (TVP-VAR) model, which makes it possible to measure contagion effects over time. 1 The average total connectedness index, which is obtained by computing the mean of the dynamic total connectedness index (TCI) across the full sample period. 2 TCI = 56.96% indicates moderate interconnectedness. Clean energy ETFs (ICLN, CNRG, TAN) are net shock transmitters (positive NET), while ESG indices are net receivers (negative NET).
Table 3. Dynamic allocation weights in the Minimum Variance Portfolio: ESG indices vs. Clean Energy ETFs.
MeanStd.Dev.5%95%HEp-Value
ESG BRAZIL0.130.030.100.190.610.00
ESG INDIA0.410.090.270.520.220.00
ESG CHINA0.030.020.000.060.860.00
ESG SA0.170.070.070.290.550.00
ICLN0.110.080.000.250.830.00
CNRG0.010.030.000.070.860.00
FAN0.130.080.000.270.700.00
TAN0.000.010.000.000.910.00 1
1 ESG INDIA has highest weight (0.41). Clean energy ETFs (CNRG and TAN) show strongest hedging (HE ≥ 0.86). All allocations statistically significant (p < 0.05).
Table 4. Portfolio weights under the Minimum Connectedness Portfolio (MCoP) approach.
Mean Std. Dev.5%95%HEp-Value
ESG BRAZIL0.17 0.020.13 0.21−0.060.46
ESG INDIA0.13 0.030.08 0.16−1.150.00
ESG CHINA0.12 0.020.09 0.150.620.00
ESG SA0.08 0.030.05 0.12−0.230.01
ICLN0.01 0.040.00 0.050.520.00
CNRG0.02 0.040.00 0.100.620.00
FAN0.14 0.040.07 0.210.170.03
TAN0.32 0.050.22 0.400.740.00 1
1 TAN dominates allocation (0.32). ESG INDIA and ESG SA show negative hedging effectiveness. Most weights statistically significant (p < 0.05).
Table 5. Estimated dynamic bivariate hedge ratios for portfolio risk management.
Mean Std.Dev.5%95%HEp-ValueReturnStd.Dev.
ESG BRAZIL/ICLN0.20 0.040.140.290.100.000.020.20
ESG BRAZIL/CNRG0.19 0.040.130.250.120.000.010.19
ESG BRAZIL/FAN0.25 0.080.140.360.100.000.020.20
ESG BRAZIL/TAN0.11 0.040.050.180.080.000.000.20
ESG INDIA/ICLN0.09 0.030.050.160.050.000.060.14
ESG INDIA/CNRG0.08 0.030.040.140.060.000.050.14
ESG INDIA/FAN0.13 0.050.080.240.050.000.060.14
ESG INDIA/TAN0.05 0.020.030.090.040.000.050.14
ESG CHINA/ICLN0.21 0.060.110.290.050.00−0.260.34
ESG CHINA/CNRG0.20 0.060.120.330.060.00−0.270.33
ESG CHINA/FAN0.24 0.060.130.340.040.00−0.270.34
ESG CHINA/TAN0.20 0.050.120.300.080.00−0.260.33
ESG SA/ICLN0.18 0.070.100.320.130.000.020.18
ESG SA/CNRG0.16 0.050.110.270.130.000.010.18
ESG SA/FAN0.26 0.080.140.400.150.000.000.18
ESG SA/TAN0.14 0.050.080.220.130.000.020.18
ICLN/ESG BRAZIL0.40 0.140.260.670.110.35−0.210.29
ICLN/ESG INDIA0.41 0.110.240.600.050.59−0.210.30
ICLN/ESG CHINA0.17 0.050.110.260.050.35−0.130.30
ICLN/ESG SA0.47 0.120.310.770.120.09−0.200.29
CNRG/ESG BRAZIL0.48 0.160.310.790.120.35−0.180.32
CNRG/ESG INDIA0.45 0.120.280.660.050.59−0.190.33
CNRG/ESG CHINA0.21 0.060.120.330.050.35−0.090.33
CNRG/ESG SA0.53 0.110.370.820.120.09−0.170.32
FAN/ESG BRAZIL0.30 0.130.150.500.100.35−0.130.22
FAN/ESG INDIA0.34 0.100.240.530.050.59−0.140.23
FAN/ESG CHINA0.12 0.030.080.170.040.35−0.090.23
FAN/ESG SA0.40 0.110.230.650.150.09−0.130.22
TAN/ESG BRAZIL0.40 0.200.160.760.080.35−0.290.40
TAN/ESG INDIA0.46 0.140.250.710.050.59−0.290.41
TAN/ESG CHINA0.31 0.080.200.470.070.35−0.160.41
TAN/ESG SA0.66 0.160.411.030.130.09−0.270.39 1
1 Hedge ratios show optimal protection positions. The ESG SA/FAN pair shows the highest hedging effectiveness (HE = 0.15). Most ratios are statistically significant (p < 0.05). Clean energy ETFs generally provide better hedging than ESG indices.
Disclaimer/Publisher’s Note: The statements, opinions and data contained in all publications are solely those of the individual author(s) and contributor(s) and not of MDPI and/or the editor(s). MDPI and/or the editor(s) disclaim responsibility for any injury to people or property resulting from any ideas, methods, instructions or products referred to in the content.