Article

South Africa’s Vice Chancellors’ Historical and Future Salary Predictors from 2016 to 2026

by
Molefe Jonathan Maleka
* and
Crossman Mayavo
Faculty of Management Sciences, Tshwane University of Technology, eMalahleni Campus, Emalahleni 1034, South Africa
*
Author to whom correspondence should be addressed.
J. Risk Financial Manag. 2025, 18(10), 550; https://doi.org/10.3390/jrfm18100550
Submission received: 23 July 2025 / Revised: 26 August 2025 / Accepted: 10 September 2025 / Published: 1 October 2025
(This article belongs to the Section Economics and Finance)

Abstract

This article aims to create insights concerning the remuneration of executives (also known as vice chancellors (VCs)) in higher education in South Africa. Their remuneration is a trending and contentious topic in the media and literature within the South African context. The motivation for conducting this study is that there are no clear indicators, norms, or standards to measure salaries. Therefore, this study is grounded in agency and institutional theories. Moreover, prior to this study, there were no longitudinal studies in the South African context that have analysed VCs’ salaries, using predictors like student enrolment, return on assets, debt ratio, and revenue. The research design was longitudinal, while the research approach was quantitative. The universities that did not meet the requirements for 2016 to 2023 were excluded from the analysis, which was conducted using Python, version 3.11.7, Python Software Foundation: Wilmington, DE, USA, 2025. Since the data points were small (n = 8), bootstrapping was used to resample 1000 samples. The correlation results showed a significant relationship with the fixed salary, whereas the regression results were not significant. It was found that the VCs’ salary is a larger portion of the fixed salary, and the historical data (2013 to 2016) showed an upward trend; the forecast from 2024 to 2026 showed a flat trend. The forecasts are salient and create insights that will assist remuneration practitioners to budget for VCs’ salaries in order to attract, motivate, and retain them.

1. Introduction

Executive remuneration is not only a contentious topic but is also trending in the people analytics and human resource management literature (Maleka et al., 2024). Moreover, human resource practitioners’ role is to establish the remuneration of executives so that they can attract, retain, and motivate executives (Ball, 2023). The executives’ academic role is to conduct research, such as in the current study, and utilise a theoretical framework. For example, agency and institutional theories were adopted for this study to determine the predictors of executive remuneration and develop applicable models.
Currently, there is no consensus in the literature regarding how executive remuneration should be packaged; however, there are two clear patterns that are prevalent. One pattern in the private sector is that the executive remuneration should mainly comprise variable pay, while a small portion should be fixed pay (Shaw, 2011). Fixed pay is the guaranteed remuneration that executives receive at the end of the month (Karton, 2020); on the other hand, variable pay is not guaranteed but is based on performance (Lee, 2024). Other terms for variable pay are incentives or benefits, which are defined as compensation offered to employees based on their performance, and are fluctuating, not a fixed salary (Martocchio, 2015). Examples of variable pay that executives receive are in the form of bonuses and shares (WorldatWork, 2019). Nevertheless, in the public sector, it is claimed that a significant portion of the executive remuneration should comprise fixed pay and benefits (Madingwane et al., 2023).
Moreover, there is no consensus in the literature concerning the percentage of variable pay, which should be allotted as a percentage of the total package for executives working in the public sector. One of the studies established that variable pay should be between 20% and 40% (Cable & Vermeulen, 2016). However, another study determined that the variable pay is 56% of the executives’ total package (Maleka et al., 2024). This is one of the motivations and justifications for establishing the variable pay contribution for executives in higher education, since previous studies were conducted internationally and in the South African tourism sector.
Executives in public universities are known as VCs, and in South Africa, there are 26 public universities. These executive positions are mainly appointed on a 5-year fixed-term contract, and based on their performance, their contracts may be renewed. The reason for adopting the agency theory is that it enables the agency to act on behalf of the Department of Higher Education. Moreover, their performance indicators are giving rise to transformation, which includes equal gender representation at the executive and managerial levels. These transformative indicators also ensure that their institutions meet the student enrolment targets, which are contracted through the Ministry of Higher Education, and when they are not met, the university is penalised. Money that universities receive for meeting the targets for first-time enrolment students is known as the teaching inputs unit. The money that the university receives for its graduation rate is known as the teaching output unit. In addition, they generate money by offering short learning programmes, thorough investment, and research output. Collectively, these money-generating streams are classified as revenue on the university’s statement of financial position; moreover, management is at the institutional level, hence the need to use institutional theory (Council of Higher Education, 2024).
Another key performance indicator for vice chancellors is to manage debt; hence, in this study, the debt ratio is measured as a predictor of VCs’ remuneration. It is defined as the proportion of total assets owed by the organisation’s creditors (Kučera et al., 2021). This ratio can be used in two ways. Firstly, when it is higher, the university should reduce liabilities and ensure that it pays its creditors as soon as possible. Conversely, when it is lower, the university can purchase assets on credit (Marx & De Swart, 2013).
Some of the assets managed by the VCs include infrastructure, digital assets, and intangibles, such as the university’s brand and intellectual property rights. Since one of their key performance indicators is asset management, in this article, we include a business metric known as return on assets (ROA). ROA is a business analytics metric that is used to measure how efficiently the total assets of universities are used to generate revenue (Erasmus et al., 2020). In various organisations (including universities) where talent is sourced, trained, and retained, they have higher ROA (WorldatWork, 2021).
Unfortunately, there are gaps in the South African literature, as there is a scarcity of research that has measured remuneration over a more extended period, in relation to executive pay in higher education. One study that has measured predictors of executive remuneration was conducted by Bussin and Modau (2015); however, this was not based on VCs’ remuneration. One of the studies that measured VC salary was conducted by Maleka and Schultz (2021), but it was not longitudinal and did not use Python to analyse the data as in this article. The other limitation of these studies is that they did not forecast VCs’ salaries for 2025 and 2026, which the current study has fulfilled. Therefore, this article contributes to the executive remuneration body of knowledge, using predictors such as total students enrolled, ROA, debt ratio, benefits, and revenue.
The study period (2016 to 2023) is notable because VCs faced challenges, such as the fees must fall campaign, where students in the public sector were demanding free education. In addition, they faced dwindling subsidies from the Department of Higher Education, inappropriate infrastructure, and a higher students’ debt ratio, while a low number of students registered due to COVID-19, all of which affected the financial sustainability of the universities (Mlambo & Spanza, 2024). In 2023, there was an outcry in the media when a VC was given a golden handshake or termination allowance of R12 million when the VC and the university mutually agreed to terminate the relationship prior to the end of the contract period (Basson & Charles, 2023). Hence, the research question is as follows: What are the South African VCs’ historical and future salary predictors (i.e., debt ratio, revenue, ROA, student enrolments, and salary) from 2016 to 2026? To address the research question, the objectives are as follows:
  • To determine the benefits as a percentage of the fixed salary;
  • To identify the relationship between the predictors and VCs’ salaries;
  • To forecast and analyse the history of VC’s fixed and benefits costs from 2016 to 2026.

2. Materials and Methods

2.1. Literature Review

This section focuses on reviewing the literature that supports the objectives of this study. The focus was on the study’s agency theory, institutional theory, and the predictors of the execution remuneration, which are the number of students enrolled, return on investment, debt ratio, and return on investment. These theories and predictors will be discussed in the sections below to provide a comprehensive understanding of their relevance to universities’ executive remuneration. The two theories chosen by the researchers were agency theory and institutional theory, as these theories could assist in pinpointing the issues related to South Africa’s Vice Chancellors’ historical and future salaries from 2016 to 2026. Since the study’s focus is on universities, the researchers found it relevant to use these two theories to support their study. Agency theory explains the relationship that exists between the agent (executives) and the principal (government). Similarly, institutional theory focuses on the existing environment, considering that the government is responsible for funding the universities, as well as the donor community. Nevertheless, while other theories are available, such as the human capital theory and stakeholder theory (which align very well), the authors could not consider them all in this study. The focus now shifts to agency theory.

2.1.1. Agency Theory

This theory was introduced by Barry Mitnick in 1973, who was employed in the School of Public Administration, where it served as the theoretical framework for agency theory (Mitnick, 1975). Others credit Jensen and Meckling (1976) as the originators of agency theory. The theory stands and is described as a contract between one or more people (principal) seeking the services of another person (agent) to preside over the services of the principal (Jensen & Meckling, 1976). In this study, the principal is the Department of Higher Education and Training, while university management represents the agent. The management becomes agents on the basis that they oversee the management of the affairs of the universities on behalf of the Department of Higher Education and Training. Accordingly, the agent signs a five-year renewal contract based on their performance, which is the case between the two selections in this study, that is, the principal and agent as described above (Maleka, 2023). In short, good governance is the cornerstone of the relationship between the agent and the principal (Mashele et al., 2024). Additionally, at the heart of the relationship, there is a high level of remuneration provided to the agent in order to curb the executives’ self-interests (Zinatsa & Saurombe, 2022).
As stated in the introduction above, the VCs and team manage universities on behalf of the government, signing five-year contracts (renewable in other cases) to ensure that the affairs of the universities are professionally run, meeting targets, reducing debts, and enrolling first-time students (meeting targets). Moreover, they maintain the target or student level and supervise them throughout their university tenure with a reasonable level of graduates (Khuluvhe et al., 2022). The agents should also maintain the university brand, manage infrastructure in the physical form, as well as digital and intangible assets such as intellectual property (Jensen & Meckling, 1976; Maleka et al., 2024). However, the principal is responsible for ensuring that they monitor the performance of the agents, based on job responsibilities. This can be accomplished using report submission and special visits to assess the effectiveness of the team on the ground (Maleka & Schultz, 2021). Additionally, the principals create a favourable environment for the agent to prevail, which can be accomplished through high salaries with good benefits. Research has shown that it is difficult for the principal to monitor the hidden agendas as well as the agent’s knowledge (Mayavo, 2023). Research further suggests that monitoring agents and alignment of interests create problems for both the principal and the agent (Maleka & Schultz, 2021; Zinatsa & Saurombe, 2022).
In the context of this study, the monitoring mechanism between university management and the Department of Higher Education and Training has been a challenge, as accusations are the order of the day, even though trust must prevail between the two entities (Khuluvhe et al., 2022; Syafriadi et al., 2023). Despite all the challenges, the VCs and team are highly remunerated by the principals. Furthermore, the theory resembles control and separation, as denoted by Mitnick (1975). Therefore, the agents must ensure that the debts and equity of the firm are maintained, as universities often find themselves in debt. However, the VCs must find a way of managing such debts and equity to preserve the university’s brand on behalf of the principals (Eisenhardt, 1989; Rutherford et al., 2005). Finally, a good relationship between the agent and the principal leads to a return on asset management, reduction of debts, and improves the revenue generation and smooth operation of universities. This theory is aligned with the study topic, which is South Africa’s Vice Chancellors’ Historical and Future Salaries from 2016 to 2026 (Mahon & Mitnick, 2010). The following section examines the institutional theory.

2.1.2. Institutional Theory

The theory was developed and introduced by John Meyer and Brian Rowan around the 1970s. The theory examines the social choices that shape the organisation’s environment (Neubaum & Zahra, 2006). The central theme of institutional theory is the organisational structure that is viewed by states, policymakers, and donors as a signal of great movement towards development and worthy of financial support. This is the case with the South African universities that are well supported by the state and donors, as they are seen as leading the transformation of the country and are a clear testament that the government and the donors view academics as a part of growth and success for the nation to be industrialised (Shrum, 2001).
Thus, institutional theory plays a crucial role in shaping executive remuneration by highlighting the influence of social norms, institutional frameworks, and values on compensation practices. The theory further states that universities operate in a broader context of established laws, rules, and responsibilities that govern the level of executive pay. Moreover, it involves how organisational pressures can severely impact the compensation packages, as well as how they are perceived and structured (Meyer & Rowan, 1977). Research states that institutional theory’s other key concept in this study is legitimacy. In short, universities gain legitimacy by conforming to the current practices and norms within the industry (Syafriadi et al., 2023). In the context of this study, executive remuneration is influenced by industry standards, with salaries and benefits based on what is perceived as being acceptable in the higher education and training sectors (Mashele et al., 2024; Rutherford et al., 2005).
Additionally, top talent is attracted to the educational management system in order to remain competitive through the benchmarking process, while adhering to societal requirements and expectations based on fair compensation. This theory is a suitable fit for the research topic, namely, South Africa’s Vice Chancellors’ Historical and Future Salaries from 2016 to 2026 (Maleka & Schultz, 2021; Pepper et al., 2015). Therefore, the shaping of executive remuneration practices is highlighted by the theory, as it promotes governance structures and regulatory frameworks (Meyer & Rowan, 1977). Nevertheless, regulatory bodies and shareholders are increasingly pushing for accountability and transparency pertaining to executive pay. Such a push has led universities to adopt standardised policies, such as tying every executive compensation to performance metrics, aligning with the expectations of shareholders (Maleka & Schultz, 2021). Moreover, the influence of professional associations and networks is important, especially when it relates to executive remuneration at South African universities (Mashele et al., 2024). Furthermore, their guidelines and best practices enhance professionalism and legitimacy (Friedman & Afitska, 2023; Stoltz-Urban & Govender, 2014). Hence, universities in South Africa can participate in benchmarking and collaborate to develop compensation strategies that align with executive remuneration expectations. The next step is to examine the predictors of executive remuneration in universities in South Africa.

2.1.3. Predictors of Executive Remuneration

In South Africa’s higher education sector, executive pay is influenced by different predictors such as student enrolments, debt ratio, return on assets, benefits, and revenue generated. Therefore, understanding the relationship between the predictors and executive compensation provides some valuable insights into the operational efficiency of universities and their financial status. The first predictor is the number of students enrolled (first-year students and postgraduates), as this serves as a significant metric for examining the financial viability of public higher education universities (Bartlett, 2012; Maleka & Schultz, 2021). Research indicates that the greater the number of students enrolled, the more likely it is to lead to increased tuition income, which, in turn, may lead to higher executive salaries (Blagg & Blom, 2018). It is further noted that universities with a higher number of students not only reflect market demand but also increase the university’s economies of scale (Ross et al., 2020). The higher the number of enrolled students, the greater the financial resources available for benefits and salaries to expand, allowing universities to offer remuneration packages that attract and retain top leadership professionals.
Moving to the second predictor, that is, return on assets (ROA), this is a crucial aspect of financial indicators, reflecting how effectively a university utilises its assets to generate income (Singh et al., 2024). A higher ROA indicates operational effectiveness and efficient management of resources, which may lead to increased executive remuneration, rewarding good stewardship of the executive. Leaders in higher learning institutions with higher ROA are often viewed as competent, and, as such, their compensation is adjusted based on their performance (Brealey et al., 2011; Brewer et al., 1999). The relationship between ROA and executive remuneration further highlights the importance of accountability and transparency in executive roles.
The debt ratio notion, which is the third predictor, measures the proportion of the university’s assets financed by debt and plays an important role in determining the university’s executive remuneration (Blagg & Blom, 2018; Mashele et al., 2024). Accordingly, financial stability is represented by a lower debt ratio, which, in turn, reduces stakeholders’ risk and leads to higher favourable pay for the executives. On the other hand, universities with a higher debt ratio can be scrutinised regarding executives’ performance, thereby reducing remuneration packages of the same (Al-Manaseer, 2024; Blagg & Blom, 2018). Additionally, executives with institutions that are doing well are better positioned to acquire competitive remuneration packages, a lower risk profile, and financial health.
With regard to the benefits as the fourth predictor of executive remuneration in this study, the focus is on bonuses, retirement plans, housing allowances, and vehicle perks (Bussin & Ncube, 2017). Thus, more benefits are provided to executives when their organisations perform well. This reward serves as an incentive for attracting and retaining top leadership talent. A good package of benefits reflects a university’s commitment to recognising and rewarding positive executive leadership (Maleka & Schultz, 2021; Nkwadi & Matemane, 2022). This can also influence the availability and quality of benefits, which may also alter the overall executive remuneration structures. The next predictor is revenue.
Revenue is the last crucial predictor of executive pay in this study, since it has a direct correlation with the university’s good financial standing (Bartlett, 2012). Research has shown that higher income allows universities to invest in infrastructure, relevant programmes, and leadership talent (PWC, 2020), which can lead to more executive remuneration. Aiding the above, universities with various streams of income, such as government, donations, research grants, and other financial support, are well placed for higher compensation packages for executives. The following section focuses on the study’s methodology.

2.2. Research Methodology

2.2.1. Research Design

The research design demonstrates the strategy whereby the study is going to be conducted and is based on a time dimension (Saunders et al., 2019). In terms of the latter, the study was longitudinal in the sense that the authors used more than one year of data. A longitudinal study is defined as a study where data were collected from the same group of study participants to observe patterns over several weeks up to decades (Caruana et al., 2015). In addition, the research design was both descriptive and correlational. Moreover, it was descriptive, as it was intended to quantify benefits (i.e., variable pay) and the percentage of the total package, and it was correlational, as it intended to establish the relationship between the predictors (ROA, students enrolled, debt-ratio, and revenue) and VC salary. The study was also forecasting, as it used historical data to predict the future salaries of VCs. In addition, the historical and secondary data analysed were from 2016 to 2023, and the forecast data were from 2024 to 2026.

2.2.2. Sample and Sampling Method

In this study, the population was based on 26 public universities, and according to Leedy and Ormrod (2015), since the population size was less than 500, a census was used. The same authors adumbrated that a census is defined as a sampling technique where every unit or data source is included. It can also be argued that the study employed a purposive sampling technique, as it focused on intentionally selecting reliable data from universities’ annual reports, rather than randomly selecting them, in line with the study’s objectives.
Of the 26 universities that met the pre-defined inclusion criteria, 8 universities (n = 8) were selected for analysis. The selection was based on the availability and accessibility of the annual reports and their relevance to research objectives. This is the sample of the study. With the focus on these eight universities, the study ensures that the data are representative of the phenomenon under investigation and are analysed.

2.2.3. Source of Data

Similar to the previous research that predicted VC salaries, in this study, annual reports were used as source documents. Annual reports are comprehensive documents that present financial results and governance activities for the fiscal year, aiming to provide transparency and accountability to stakeholders (Lucey et al., 2022). The annual reports are regarded as secondary data, since the researchers generated those (Saunders et al., 2019). The benefits of using the annual reports are that they have been audited, thereby enhancing their veracity and reliability. The inclusion criteria for the annual reports analysed were as follows:
  • The annual reports must be available on Google;
  • They must list the student enrolment, revenue, and VC salaries;
  • They must include the Statement of Financial Position and Statement of Comprehensive Income.

2.2.4. Data Collection Procedure

Saunders et al. (2019) opined that the data collection procedure constitutes a systematic method of collecting and recording information related to specific research questions and business objectives. The procedure followed in the study entailed stating the study objectives (refer to the introduction, Section 1). Subsequently, we identified, accessed, and collected annual reports that matched the inclusion criteria listed in Section 2.2.3. The variables were captured and stored in Excel. Since ROA and debt ratios are not calculated in the annual statement, we had to calculate them using information from the financial statement listed in Section 2.2.3. The formula for the Statement of Financial Position was as follows: Debt Ratio = Total Liabilities/Total Assets. Total liabilities comprise what the organisation owes to its creditors, while the total assets represent what the organisation owns. Both can be current (less than 12 months) or non-current (more than 12 months) (WorldatWork, 2022). Another financial ratio that was calculated was the ROA; its formula is: ROA = Net Income/Assets. The net income is viewed as the profit that remains after the organisation has paid all the expenses, while the organisation’s asset constitutes something that is valuable to the organisation (e.g., property, plants, and equipment). The net profit is found in the statement of comprehensive income, and the asset can be found in the statement of financial position (Cloete & Marimuthu, 2019). Once the data were captured in Excel, they were exported into Python for analysis.

2.2.5. Conceptual and Operational Definitions of Variables

This study comprised predictors and target variables. A predictor, also known as an independent variable, is the variable that influences the target variable (Leedy & Ormrod, 2015). Two of the predictors (debt-ratio and ROA) were defined in Section 2.2.4. Revenue, also known as sales, is the money generated by an organisation and is found in the statement of comprehensive income (Cloete & Marimuthu, 2019). A target variable is a variable that is affected by the predictor variable (Saunders et al., 2019). In this study, the target variable was salaries, and it is the remuneration that the VC (i.e., agent) is paid by the principals (i.e., universities which receive payment from higher education) to ensure that the universities’ processes and procedures, as well as assets, are managed optimally (Maleka & Schultz, 2021). Remuneration of the VC is split into two categories: benefits and fixed. Benefits can be viewed as bonuses, leave entitlement, defined contribution plans, and termination benefits. A fixed salary, on the other hand, is also known as a guarantee that the VC receives monthly, irrespective of their performance or the number of hours they work (WorldatWork, 2022).

2.2.6. Statistical Analysis

The data were analysed using line graphs, stacked bar charts, a correlational heatmap, and regression. Hayes (2018) argued that when the data points are very low, the strategy to employ is known as bootstrapping. In this case, the data points were eight; hence, the data were bootstrapped. In addition, Hayes (2018) held the view that confidence intervals should be utilised to determine the significance of the relationship. If the confidence intervals include zero, the relationship is deemed not significant, and vice versa is correct. Holt–Winters models are designed to handle stationary and non-stationary data that exhibit trends and/or seasonality (James & Tripathi, 2021). Correlation is a statistical tool that measures the relationship between the variables, and ranges from +1 (perfect positive linear relationship) to −1 (perfect negative linear relationship). According to Maree (2016), the strength of the correlation is determined as follows: 1, perfect correlation; 0.7 to 0.9, strong correlation; 0.5 to 0.6, moderate correlation; and 0.1 to 0.4, weak correlation.

3. Results

Presented in this section are the study results in line with the study objectives. In addition, the descriptive results are also presented.

3.1. Descriptive Results

The point of departure was to employ the bootstrapping strategy since the sample size of the study was eight, using 1000 (n = 1000) resampling. Moreover, the descriptive statistics are shown in Figure 1, and the interpretation of confidence intervals is shown below the same figure.

3.2. Benefits as a Percentage of Fixed Salary

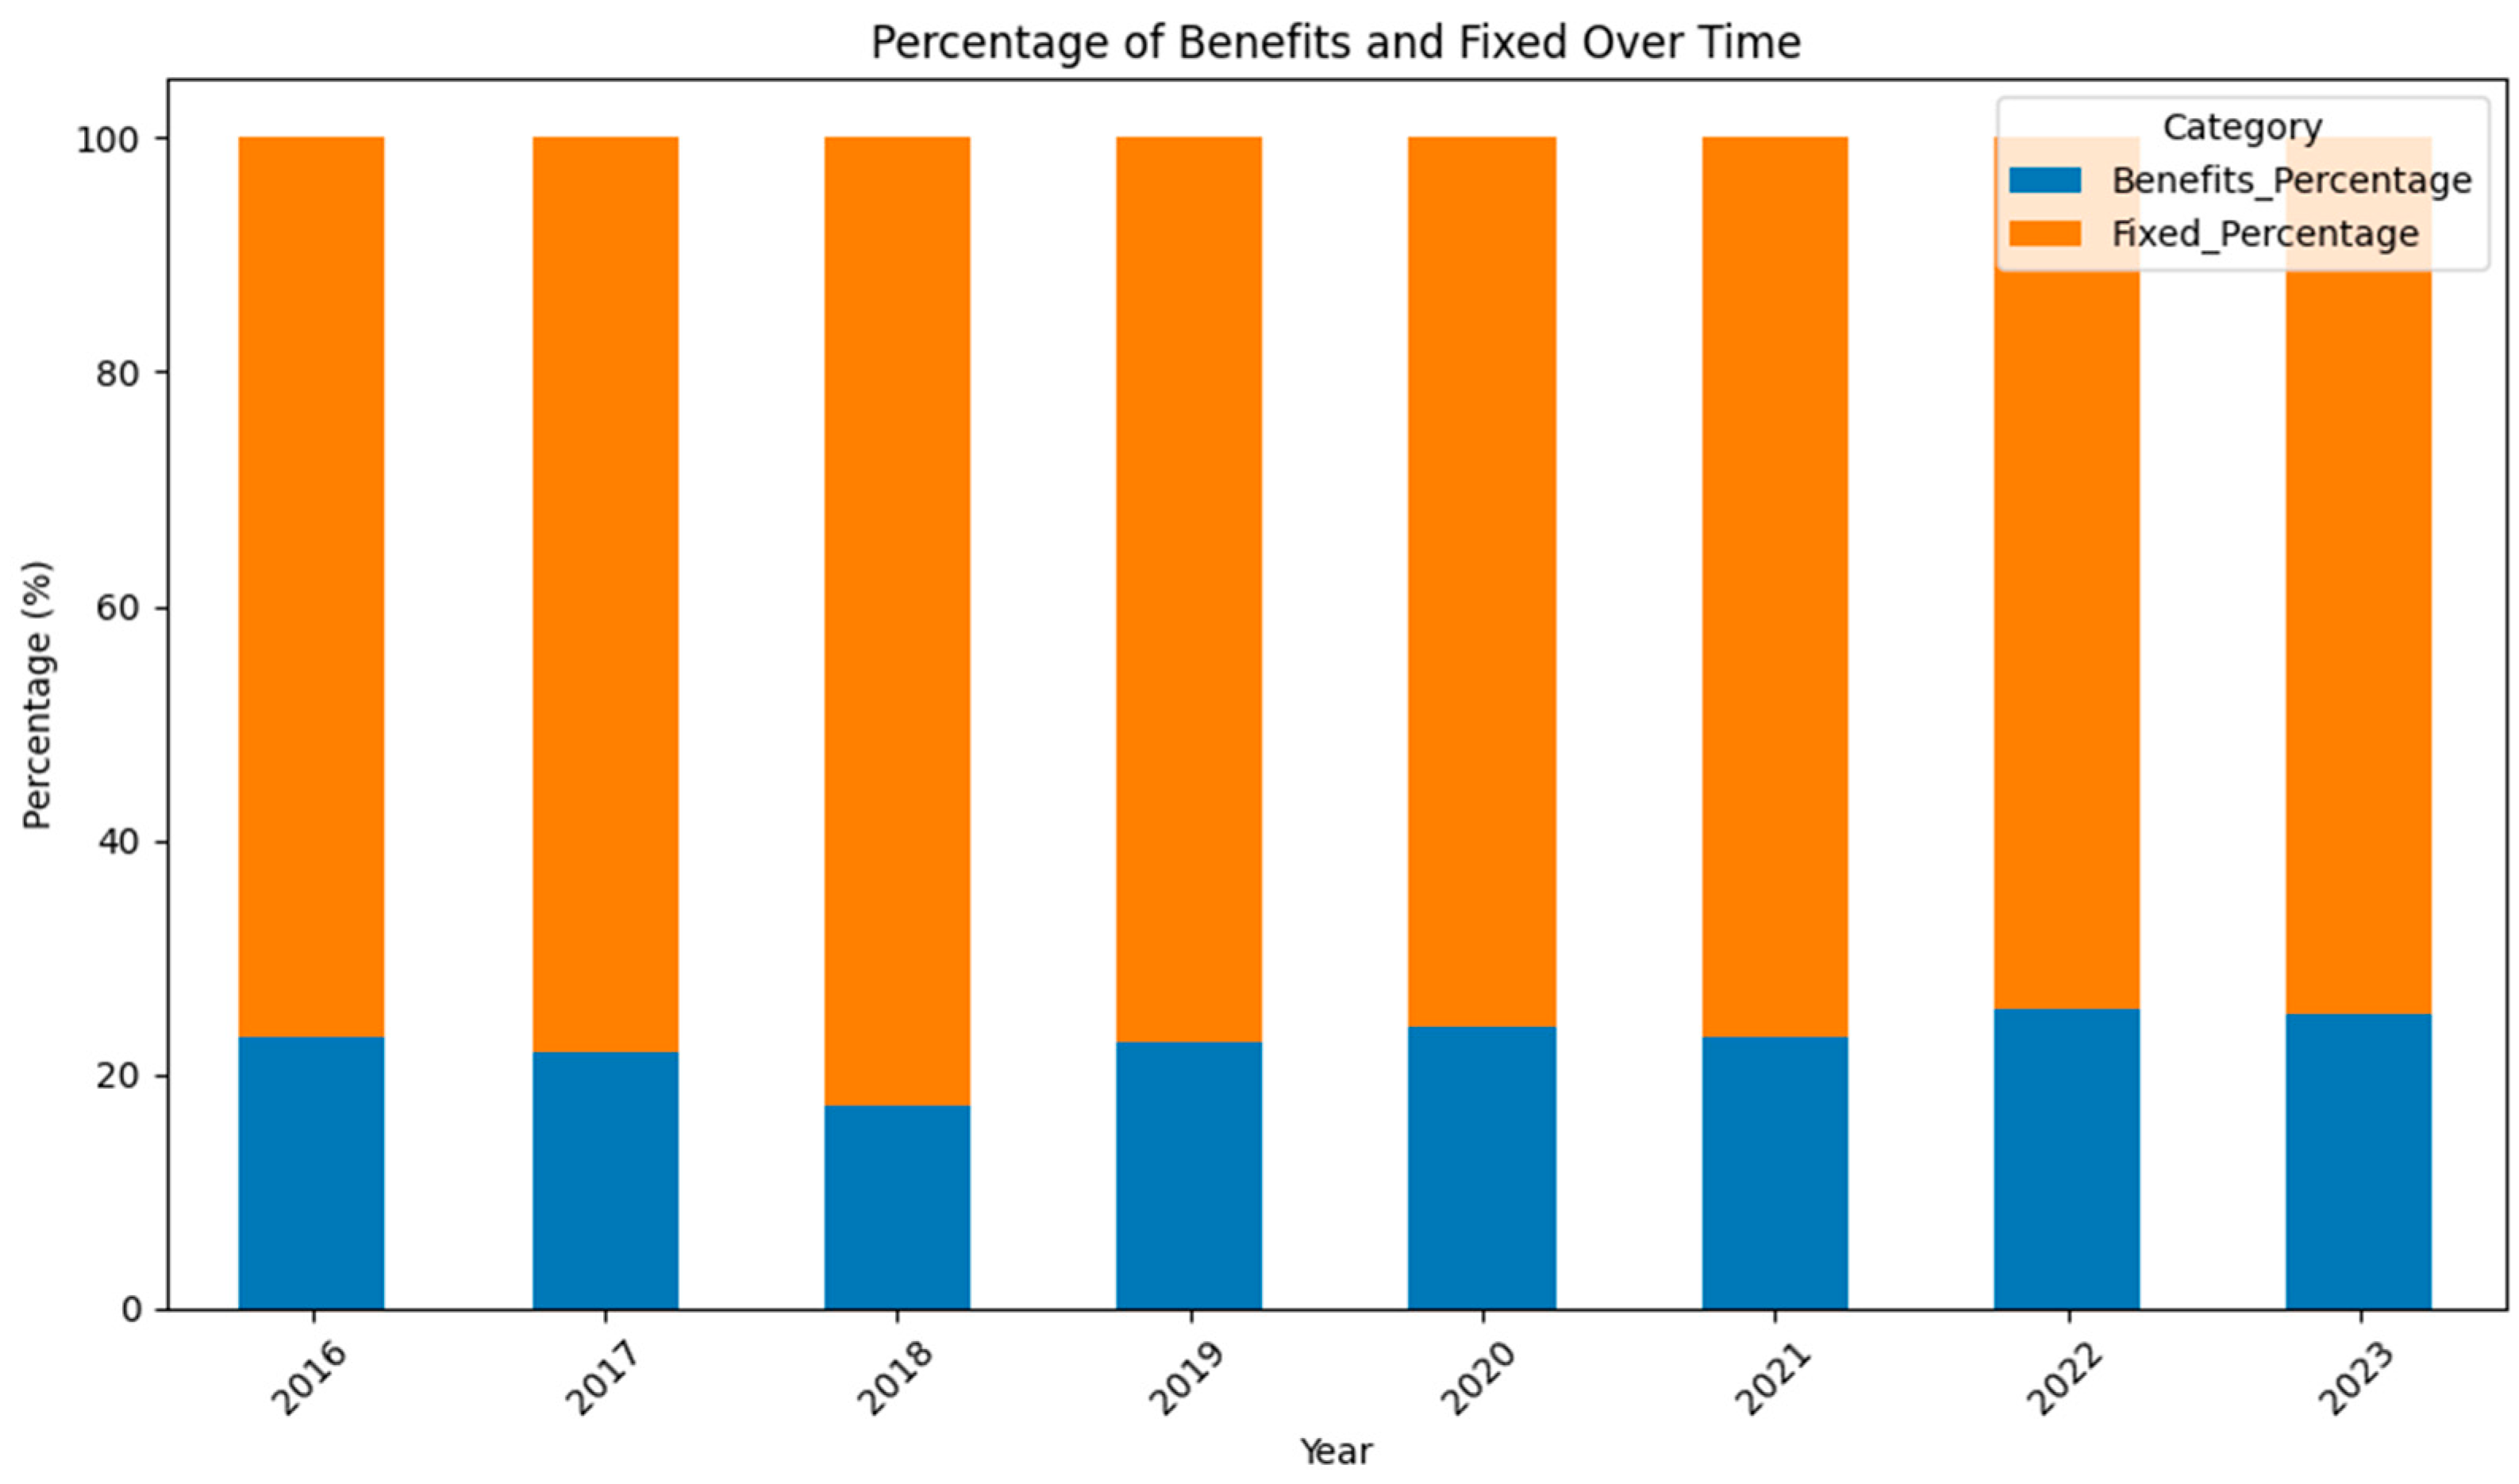
In order to address the first objective, a stacked bar chart was developed; the results are shown in Figure 2. The fixed salary (hereafter listed as Fixed) generally constitutes a larger percentage of the total than Benefits. The percentage of Fixed appears to be highest in 2018 (around 82.6%) and lowest in 2022 (around 74.4%). Conversely, the percentage of Benefits appears lowest in 2018 and highest in 2022.
Figure 2 above depicts a bar chart which uses stacked bars to represent the benefits percentage (blue) and fixed cost percentages (orange) for each year from 2016 to 2023. Each bar’s total height represents 100% with the divisions between the blue and orange segments indicating the proportion of benefits and fixed costs, respectively.

3.3. Relationship Between Target and Predictor Variables

To address the study’s second objective, correlation and regression were conducted, and the results are shown in Figure 2.
The results can be interpreted as follows:
  • Revenue: The 95% confidence interval does not include zero, indicating the correlation is statistically significant at the 5% level. The mean bootstrapped correlation coefficient was 0.7718. On average, there was a positive linear relationship between Revenue and Fixed.
  • Debt ratio: The 95% confidence interval does not include zero, indicating the correlation is statistically significant at the 5% level. The mean bootstrapped correlation coefficient was 0.8427. On average, this suggests a positive linear relationship between the Debt ratio and Fixed Assets.
  • Benefits: The 95% confidence interval does not include zero, indicating the correlation is statistically significant at the 5% level. The mean bootstrapped correlation coefficient was 0.8876. On average, there is a positive linear relationship between Benefits and Fixed.
  • Total students: The 95% confidence interval does not include zero, indicating the correlation is statistically significant at the 5% level. The mean bootstrapped correlation coefficient was 0.7876. On average, there is a positive linear relationship between the Total Number of students and the Fixed Amount.
The challenge with the results variables was that they were highly correlated. For example, the correlation between the total number of students and revenue was 0.92. A correlation above 0.80 indicates multi-collinearity, which is a higher correlation between the predictors, and can adversely impact the coefficients (Maree, 2016). As a strategy to deal with multi-collinearity, we dropped the total students and then ran a regression, which resulted in the features significantly predicting the fixed.

3.4. Historical and Forecast of VCs’ Benefits and Fixed Costs from 2024 to 2026

3.4.1. Benefits of Historical Salary Benefits and Forecasting

In order to achieve the third objective, the Holt–Winters method was deemed an appropriate statistical technique.
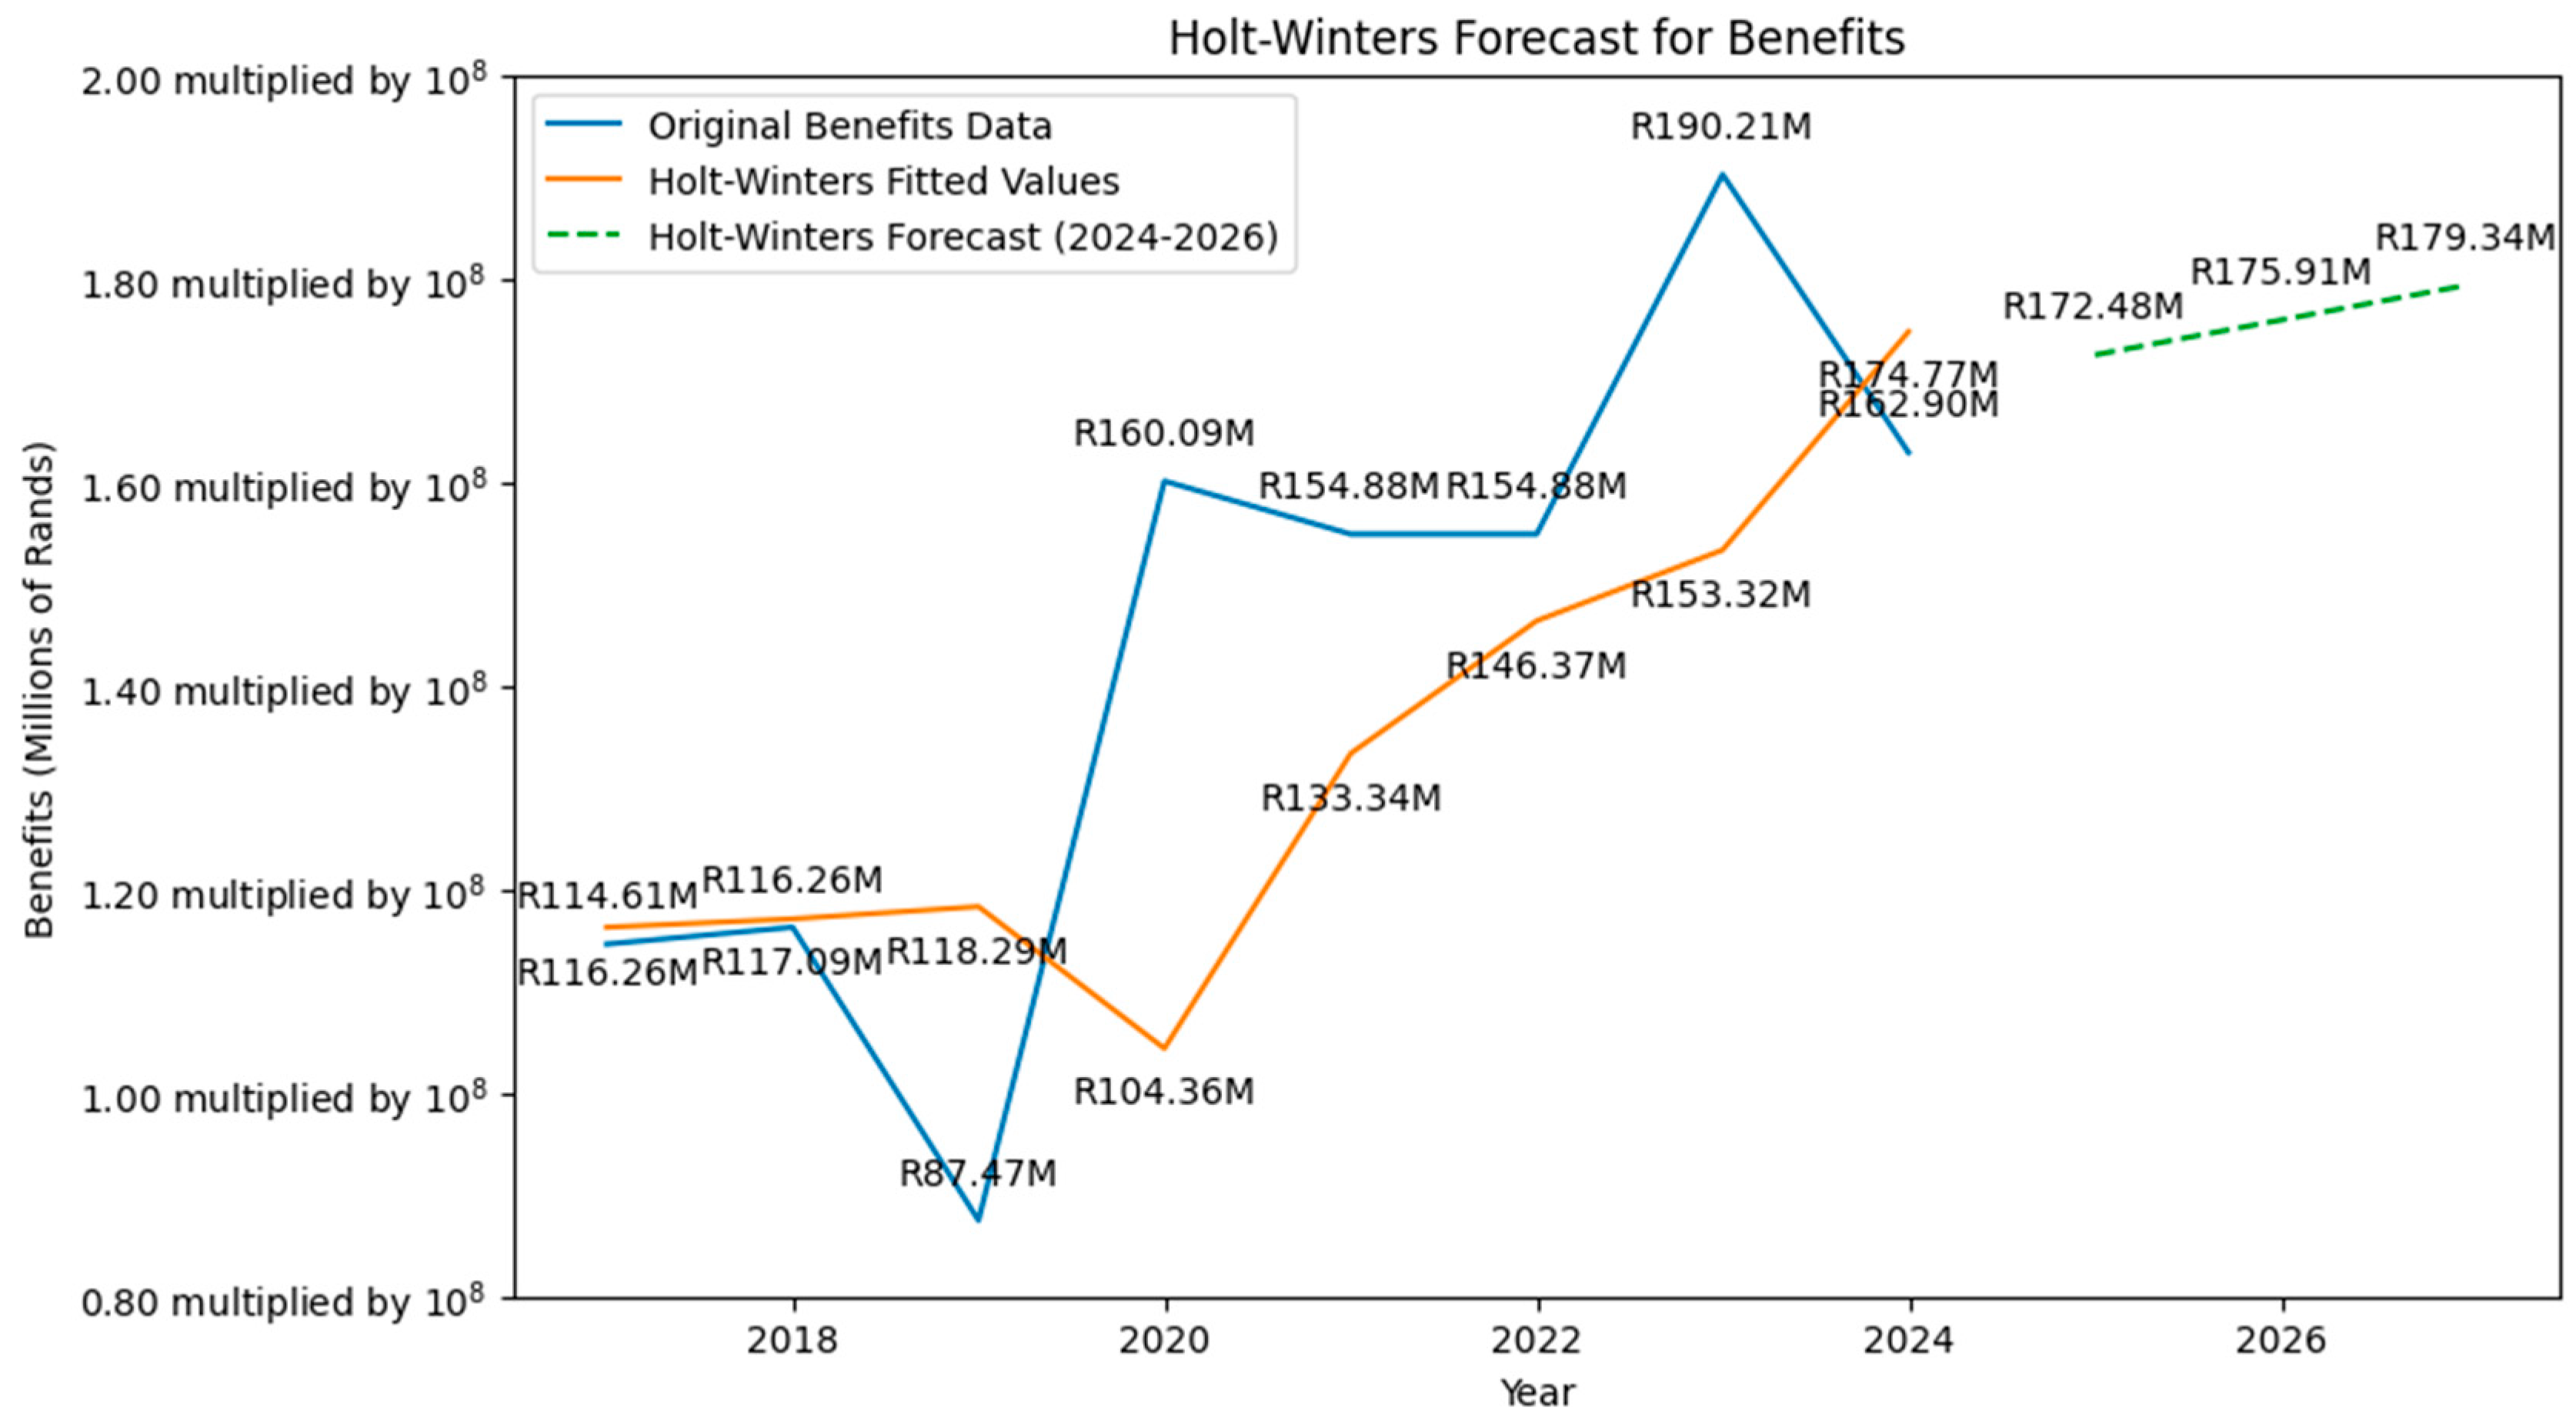
The results shown in Figure 3 can be interpreted as follows:
  • Historical Data (Blue Line): This line reflects the actual ‘Benefits’ values from 2016 to 2023. You can see the specific amounts for each year (e.g., R114.61M in 2016, R160.09M in 2019, peaking at R190.21M in 2022, and then R162.90M in 2023). This line shows the past trend and any fluctuations in Benefits.
  • Holt–Winters Fitted Values (Orange Line): This line represents the values that the Holt–Winters model calculated for the historical period (2016–2023) based on the identified trend (additive trend in this case). These fitted values try to capture the underlying pattern in the historical data, smoothing out some of the year-to-year variations. It is observable that how closely the orange line follows the blue line; the differences between them indicate the model’s error in capturing the exact historical values. For example, the fitted value for 2022 is R174.77M, which is lower than the actual R190.21M.
  • Holt–Winters Forecast (Green Dashed Line): This line extends from the end of the historical data (2023) and shows the model’s predictions for the next three years (2024, 2025, and 2026). The forecast is based on the trend extrapolated from historical data. The forecast values are approximately R172.48M for 2024, R175.91M for 2025, and R179.34M for 2026. The upward slope of the dashed line indicates that the model forecasts a continued increasing trend in Benefits over the next three years (2024 to 2026).

3.4.2. Fixed Historical Salary and Forecasting

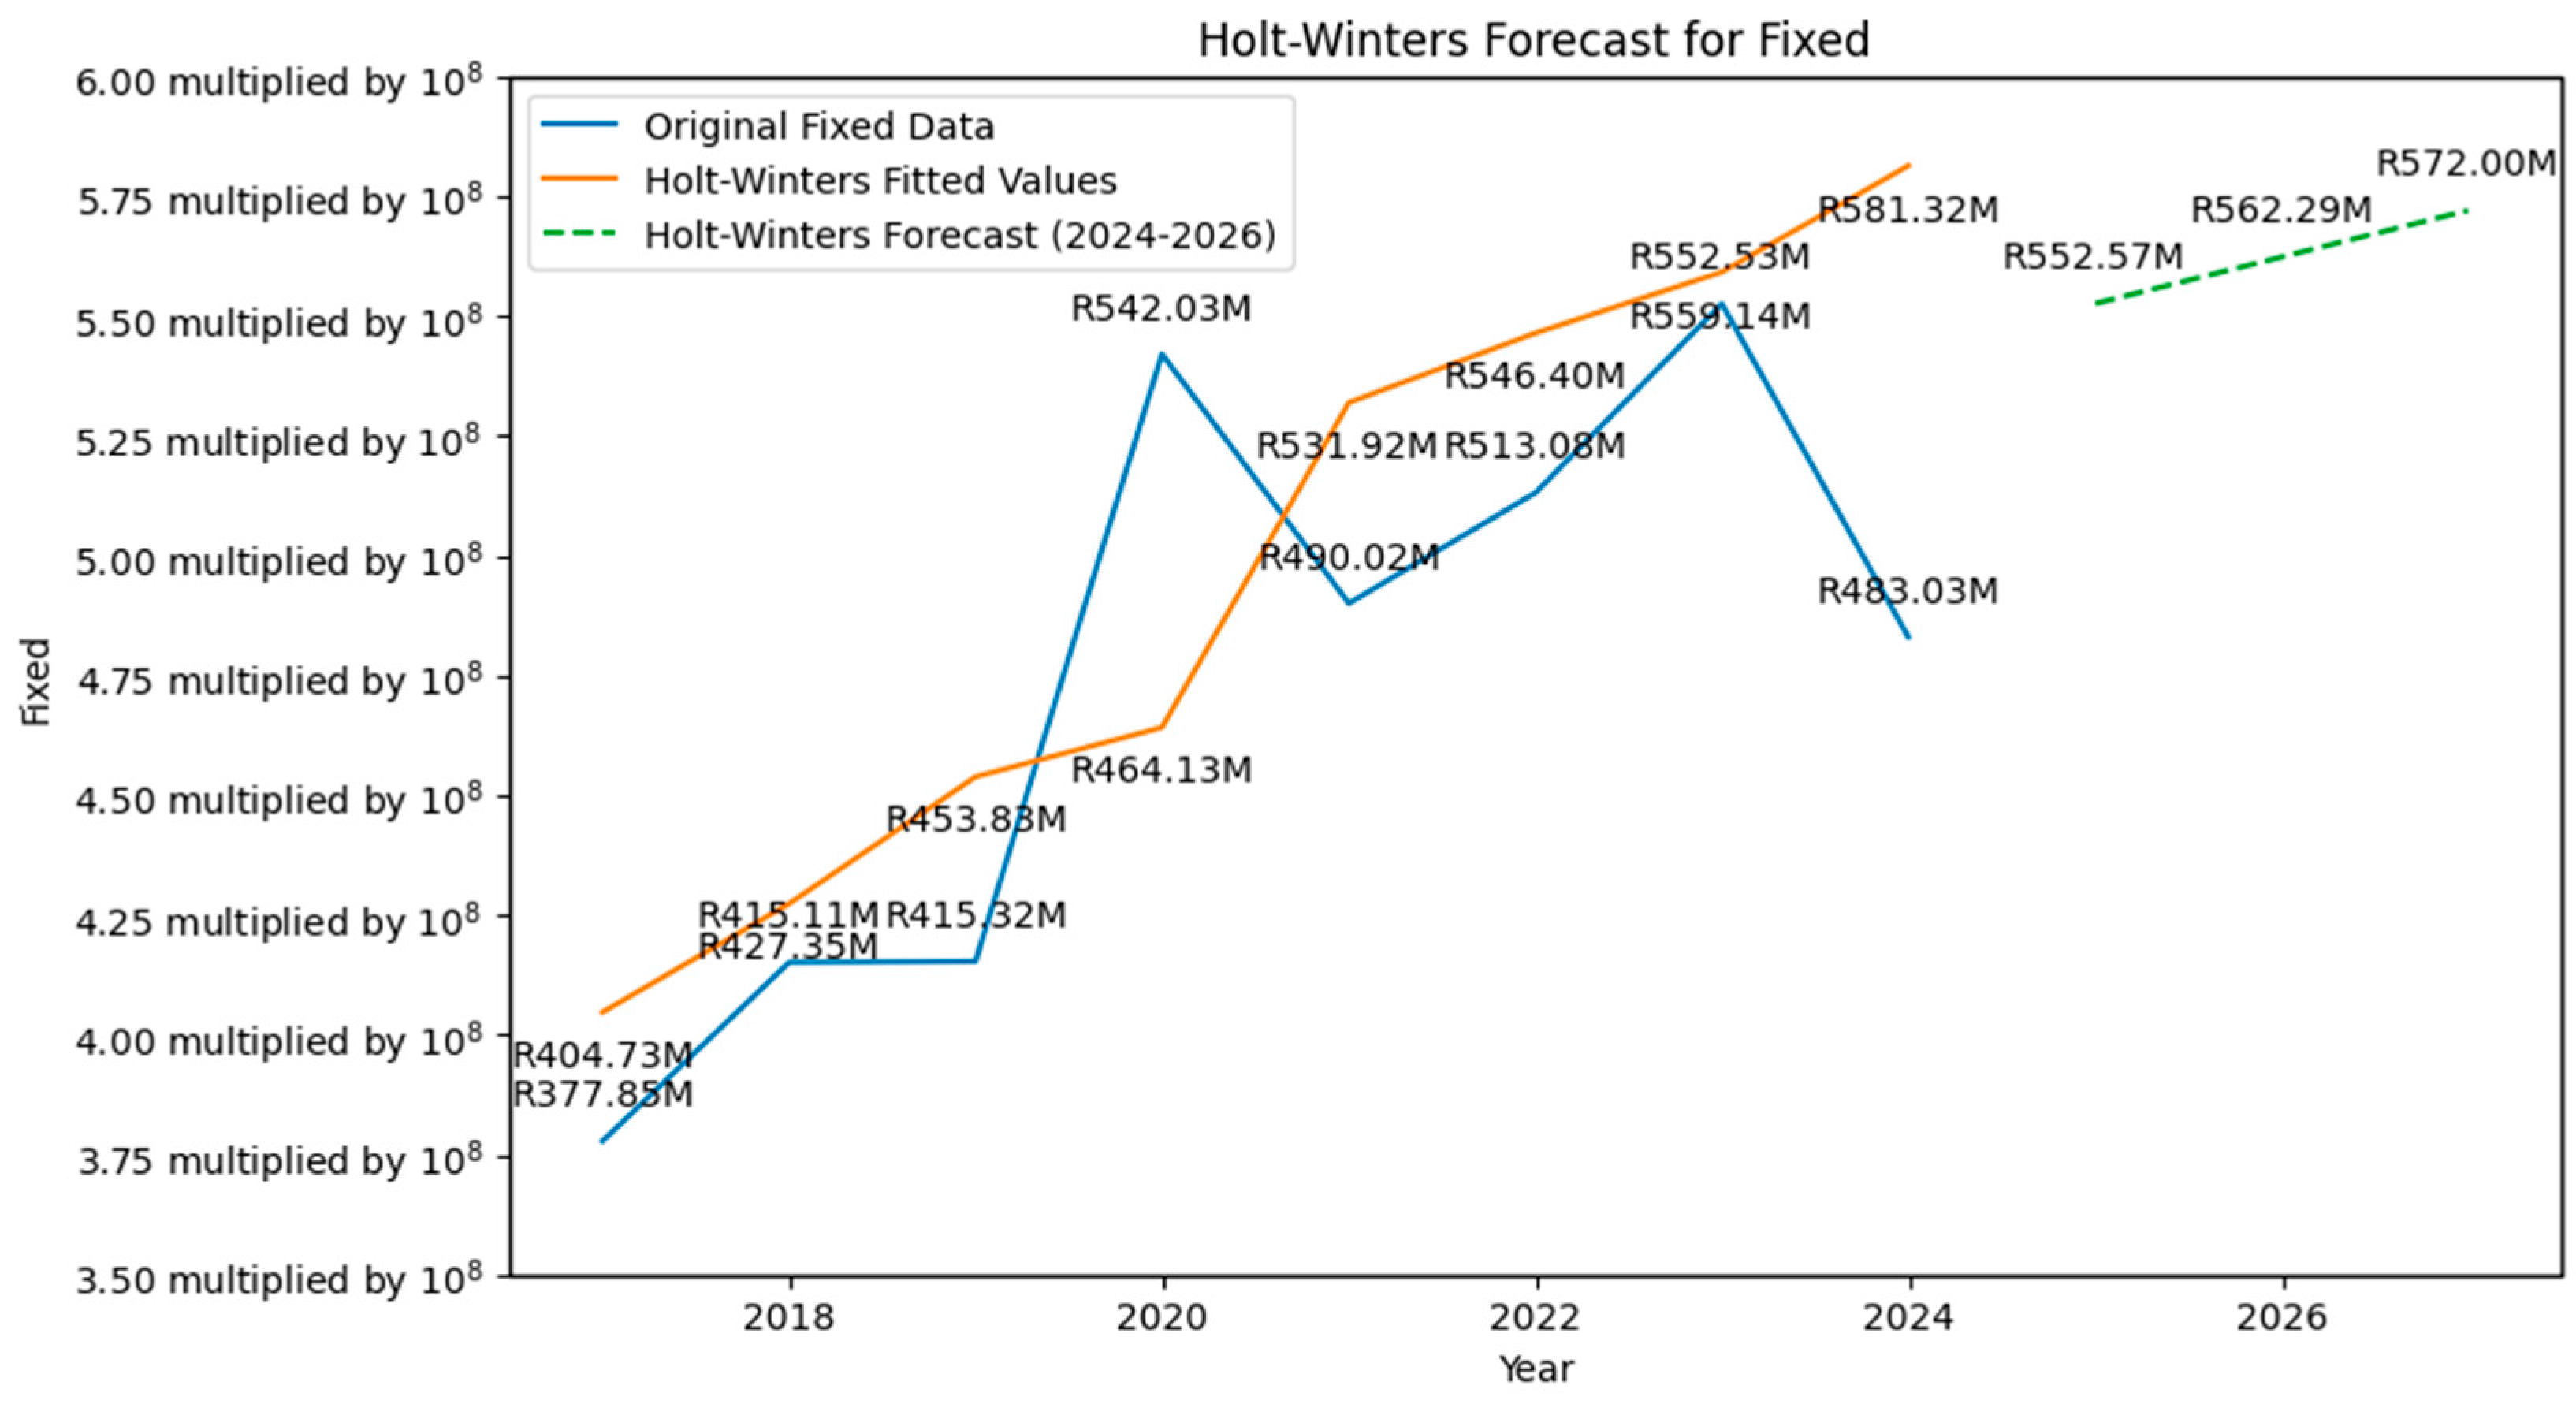
The historical data in Figure 4, and the results can be interpreted as follows:
  • Historical Data (Blue Line): This line shows the actual Fixed values from 2016 to 2023. You can see the specific amounts (e.g., R377.85M in 2016, R542.03M in 2019, R552.53M in 2022, and then R483.03M in 2023). This line shows the past trend and fluctuations in Fixed expenses.
  • Holt–Winters Fitted Values (Orange Line): This line represents the Holt–Winters model’s calculated values for the historical period (2016–2023) based on its identified additive trend. Similar to Benefits, this line smooths the historical data. One can observe where the orange line deviates from the blue line, indicating where the model’s trend does not perfectly match the historical fluctuations. For instance, the fitted value for 2023 is R581.32M, while the actual value was R483.03M, reflecting a significant difference.
  • Holt–Winters Forecast (Green Dashed Line): This line shows the model’s predictions for Fixed from 2024 to 2026. The forecast values were approximately R552.57M for 2024, R562.29M for 2025, and R572.00M for 2026. The upward slope of the dashed line suggests that the model forecasts a continued increasing trend in fixed expenses over the next three years, similar to Benefits.
Overall, the Holt–Winters models, with an additive trend and no seasonality, project a continued increase in both Benefits (refer to Figure 4) and Fixed (refer to Figure 5) over the next three years based on the historical patterns. However, the deviations between the historical data and the fitted values, particularly noticeable for Fixed, suggest that this simple additive trend model might not fully capture the year-to-year variability or potential cyclical patterns in the data. Moreover, the root mean square error values (R27.61M for Benefits and R51.23M for Fixed) quantify the average error of the fitted values compared to the actual historical data, giving an idea of the model’s historical accuracy.

4. Discussion

This study is aimed at revealing South Africa’s Vice Chancellors’ Historical and Future Salary Predictors between 2016 and 2026. The literature in the introduction section revealed that similar studies were rare in the context of South Africa; furthermore, this subject appears to be current and controversial (Maleka et al., 2024). The study was motivated by cross-sectional literature that encouraged longitudinal research. Consequently, it is necessary to establish clear predictor patterns (Maleka & Schultz, 2021). The data were collected and analysed from eight South African Universities using annual reports for the period mentioned above. The scatter plot was used, which showed a positive relationship between the variables and VCs’ salaries.
In achieving the first objective, the results show that in 2018, benefits accounted for the smallest percentage of the fixed costs and, in 2022, they accounted for the largest percentage; however, the following years were within the expected range. This finding differs slightly from previous research, showing a range of variable pay rates between 20% and 40% (Cable & Vermeulen, 2016) and 56% (Maleka et al., 2024). This study confirms previous research that the salary of executives in public sector institutions is lower than the fixed salary guaranteed at the end of the month (Maleka et al., 2024). Overall, the remuneration of executives (including VCs) represents a reasonable compensation strategy to attract and retain executives, and to keep them motivated, engaged, committed, and satisfied (Bussin & Ncube, 2017). More benefits are provided to executives when their organisations are performing well, as shown by the results of this study. In other words, the executives are most likely to receive more rewards due to their good performance. This reward serves as an incentive for retaining and attracting top leadership talent, and universities can be committed to recognising and rewarding the executive leadership (Maleka & Schultz, 2021; Nkwadi & Matemane, 2022).
In order to achieve the second objective of the study, a correlation was conducted. The literature shows that students who attain their enrolment objectives tend to support the university financially (Bartlett, 2012; Maleka & Schultz, 2021) via student tuition fees (Blagg & Blom, 2018). Concerning the latter, this seems to indicate that universities do not use their assets to generate income (Singh et al., 2024). Overall, this study did not find any predictor having an impact on the VC. This is not surprising, as the mandates of public universities are not profit-oriented, but developed for “educational and social purposes, knowledge production and successful graduates” (Council of Higher Education, 2024). However, from an agency theory perspective, as agents, VCs must guarantee that universities are financially sustainable and that their debts are managed adequately. This can ensure that, through proper governance protocols, they generate a sufficient amount of funds to pay staff salaries and run operations efficiently. With regard to institutional theory, they must also ensure that their universities can produce graduates who meet industry standards and norms (Syafriadi et al., 2023).
To achieve the third objective, the Holt–Winters method was applied to determine the historical trend (2016 to 2023) and forecast the salaries from 2024 to 2026 for future VCs’ salaries. The data showed that during this study’s timeline, universities, as principals, ensured that the VCs’ salaries remained on an upward trajectory. It is during the historical period that, as agents, they had to navigate challenges, such as student protests, COVID-19 (Mlambo & Spanza, 2024), and dilapidating infrastructure; thus, the salaries they earned managed to retain them and keep them motivated. From institutional theory, universities should be aware that the forecasted salaries will be under pressure and scrutiny as they will be compared to the salaries of low earners, along with the economic conditions of the country (Maleka et al., 2024). In addition, if the projections exceed inflation rates and the universities do not meet the industry’s and societal challenges, their salary increases will be met with scepticism as well as criticism.

5. Managerial Implication(s)

This study has managerial implications, as it revealed that predictors can be used to determine the VCs’ salaries and develop performance management indicators. The most accurate indicator linked to both benefits and fixed salary was reaching the students’ enrolment targets. Not only are the enrolment targets linked to collecting tuition fees, but they are also correlated to penalties imposed by the Department of Higher Education (DHET). The other negative consequence of not meeting the enrolment targets is that the university might run short in its operational budget, which could result in not being able to maintain the infrastructure and purchase information technology and communication licenses. Essentially, less revenue generation might lead to a university not being able to pay anticipated salary adjustments, which might result in labour unrest and low levels of job satisfaction.
As shown in Figure 4, the Holt–Winters method, benefits from 2016 to 2023 showed some fluctuations over the years. The data further suggest variability with significant peaks and troughs. The forecasted benefits for 2024 to 2026 show an increase in benefits starting at approximately R172.48M and pushing to R179.34M by 2026. The implications are that the projected increase in benefits for 2024 to 2026 suggests a positive financial outlook. This could encourage principals to invest in programmes that could further increase these benefits. Additionally, the stability implies that management can rely on the projected figures for long-term strategic planning that can assist in budgeting resource allocation and setting financial goals. However, it is recommended that VCs create a conducive environment for universities to invest assets in long-term sustainability. Ultimately, investments will be crucial to generating reserves, especially since the trend over the past four years shows that subsidies from DHET are dwindling. Furthermore, in order to recruit students in an effort to reach enrolment targets, VCs should champion the creation of a curriculum that will attract students and address industry needs. Thus, universities can use the forecast to budget so that they can attract and retain VCs, as they play a salient role in driving the university’s strategies and ensuring their financial sustainability.
Additionally, enrolment numbers can play a vital role in universities as larger institutions may have dissimilar financial structures compared to smaller institutions, affecting revenue and costs. Also, funding sources may vary significantly, impacting revenue, fixed costs, and financial ratios. The other implication is that the cost of living can cause higher mixed costs; therefore, different pricing model strategies may be adopted. Furthermore, depending on the economic situation, this can influence the total number of enrolments and the availability of funding. The implication is that a reduction in enrolments, in turn, affects the VCs’ benefits and pay. Therefore, the historical and future projections of benefits provide valuable insights for strategic decision-making. Through these trends and implications, management can take proactive steps to enhance organisational performance and ensure financial stability.
As shown in Figure 5, the Holt–Winters method, the historical data showed an upward trend from 2016 to 2023. The data further point to an upward general trend, indicating increased fixed costs over the years. Additionally, the forecasted fixed costs for the period 2024 to 2026 show a slight increase in fixed costs starting at approximately R552.57 million in 2024, rising to R572 million by 2026. The implication is that the upward trend in fixed costs highlights a need for management to fully comprehend the various factors contributing to these increases. Essentially, identifying and controlling these costs will assist the universities’ management in maintaining a healthy financial balance. Additionally, as the fixed cost rises, institutions may need to evaluate their investment by ensuring that revenue growth outpaces the fixed cost increase, which assists the VCs in leading investment and is essential for financial sustainability. Moreover, managers can plan for a more stable fixed costs environment, allowing for more appropriate resource allocation and financial forecasting. Also, management should monitor external factors that may cause rapid changes in fixed costs for the universities, looking at issues such as regulatory changes or a shift in the economic situation. The implication suggests that university management across South Africa can apply this stability to engage in long-term planning. These strategic initiatives require constant funding and should weigh the potential benefits of new initiatives against the fixed costs.

6. Conclusions

In order to achieve the study’s objectives, the research approach employed a quantitative methodology. Additionally, the research design was longitudinal, and the research philosophy was positivist. This study focused on executive remuneration, which, according to the literature, is a remarkable analytical measure for understanding people. In the introduction, the justification and motivation for carrying out this study were mentioned. The latter was motivated by previous cross-sectional research, which, in turn, encouraged research on similar topics. The literature review also showed that there were few longitudinal studies in the education sector. The education sector is vital to the South African economy, as it generates the skills needed to work and participate in, and contribute to the economy. It also plays a vital role in the training of entrepreneurs to create jobs. Based on the previous research, the predictors of VCs’ remuneration that were covered were total students enrolled, benefits, ROA, and debt ratio. The justification and relevance of the theories of agency and institutions were described in Section 2.1.1 and Section 2.1.2, respectively.
Additionally, we have concluded that there is a strong correlation between benefits and fixed costs over the years, which has provided some insights into financial management and resource allocation. This shows that the remuneration of the VCs is directly linked to the costs. Understanding these dynamics can help institutions make informed decisions to enhance their organisational performance and financial sustainability. Additionally, the total number of students is directly linked to the VCs’ salaries, as reflected by the data. This may further help institutions to remunerate VCs fairly so that they can execute their duties. We also concluded that there is a relationship between revenue and the total students recruited, suggesting that as the number of students increases, revenue also tends to increase. Therefore, management should invest their resources in marketing and improve their academic offerings to recruit more students, as this has shown that the more students, the more the revenue. Hence, the universities must have a high uptake of students. Improving the universities’ infrastructure to accommodate more students could be the best foot forward.
The study concluded that there is some variability with significant peaks and troughs in the historical data from 2016 to 2023, and there is an upward trend in the forecasted years of 2024 to 2026. This projected increase in benefits starts from R172.48 million and rises to R179.34 million by 2026. This points to a positive economic environment that universities in South Africa should consider and make the most of, such as improving the return on assets and debt ratio, as well as increasing benefits for the executive and revenue collection. Additionally, we concluded that stakeholders and management can utilise this stability and projected figures to plan for the long term in resource allocation and financial management.
On fixed costs, the researchers concluded that the forecasting done using the Holt–Winters method for fixed costs indicates a continuing upward trajectory, emphasising the importance of effective cost management and strong strategic financial planning. The projected fixed cost increase started at approximately R552.57M in 2024, rising to R572M by 2026. This is a starting point for universities in South Africa to provide remuneration to their VCs. By considering the implications of the fixed cost benefits, management can take proactive steps to control expenses, optimise resource allocation, and ensure the financial sustainability of the universities over the years. Additionally, addressing the main drivers of the fixed cost increase will be critical in maintaining an appropriate balance between costs and revenue.
One of the limitations of this study was that only 8 out of 26 universities were analysed. This was due to the inclusion criteria. Based on these limitations, it is suggested that future studies should identify and test additional predictors in the literature. In addition, follow-up studies may be carried out over the next five years to verify whether the patterns found in the current study will emerge. A qualitative study was conducted where VCs were sampled to give them a voice on salaries. Finally, the salaries and benefits of VCs as a total package and the enrolment of students are closely linked to their salaries, meaning there is a positive linear relationship between the Debt ratio and Fixed costs linked to VCs’ salaries.

Author Contributions

Conceptualization, methodology, results and conclusion, M.J.M.; introduction, literature, discussion, managerial implications, C.M. All authors have read and agreed to the published version of the manuscript.

Funding

This research was funded by own funds.

Institutional Review Board Statement

Not applicable.

Informed Consent Statement

Not applicable.

Data Availability Statement

The data presented in this study are available in [VC Salary] at [https://github.com/molkem/VC-Salary/blob/main/Copy%20of%20VCs.xlsx (accessed on 3 July 2025)], reference number [molekm]. These data were derived from the following resources available in the public domain.

Acknowledgments

The authors want to express their sincere appreciation to the reviewers and to the Research, Innovation, and Engagement directorate for allowing them to be members of this niche of living wages, executive remuneration, people analytics, and HRM outcomes.

Conflicts of Interest

The authors declare no conflicts of interest.

References

  1. Al-Manaseer, S. R. (2024). The impact of debt ratio on financial stability through the mediating role of capital adequacy: Evidence from the regulatory framework of the banking industry. Journal of Governance and Regulation, 13(4), 247–256. [Google Scholar] [CrossRef]
  2. Ball, A. (2023). Investigating the relationship between pay disparity and organisational performance [Master’s thesis, University of Cape Town]. Available online: http://hdl.handle.net/11427/37962 (accessed on 2 July 2025).
  3. Bartlett, J. (2012). A compensation comparison: Determinants of compensation for chief executive officers and university presidents [Claremont McKenna College]. Available online: https://scholarship.claremont.edu/cgi/viewcontent.cgi?article=1508&context=cmc_theses (accessed on 2 July 2025).
  4. Basson, A., & Charles, M. (2023). Embattled vice-chancellor Phakeng leaves UCT with R12m golden handshake. News24. Available online: https://www.news24.com/southafrica/news/exclusive-embattled-vice-chancellor-phakeng-leaves-uct-with-r12m-golden-handshake-20230222 (accessed on 11 July 2025).
  5. Blagg, K., & Blom, E. (2018). Evaluating the return on investment in higher education: An assessment of individual and State level returns (pp. 1–20). Urban Institute. Available online: https://www.urban.org/sites/default/files/publication/99078/evaluating_the_return_on_investment_in_higher_education.pdf (accessed on 29 June 2025).
  6. Brealey, R. A., Myers, S. C., & Allen, F. (2011). Principles of corporate finance: S&P market insight (10th ed). McGraw-Hill Irwin. [Google Scholar]
  7. Brewer, D. J., Eide, E. R., & Ehrenberg, R. G. (1999). Does it pay to attend an elite private college? Cross-cohort evidence on the effects of college type on earnings. The Journal of Human Resources, 34(1), 104. [Google Scholar] [CrossRef]
  8. Bussin, M., & Modau, M. F. (2015). The relationship between chief executive officer remuneration and financial performance in South Africa between 2006 and 2012. SA Journal of Human Resource Management, 13(1), 18. [Google Scholar] [CrossRef]
  9. Bussin, M., & Ncube, M. (2017). Chief executive officer and chief financial officer compensation relationship to company performance in state-owned entities. South African Journal of Economic and Management Sciences, 20(1). [Google Scholar] [CrossRef]
  10. Cable, D., & Vermeulen, F. (2016). Stop paying executives for performance. Available online: https://hbr.org/2016/02/stop-paying-executives-for-performance (accessed on 13 July 2025).
  11. Caruana, E. J., Hernandez-Sanchez, R. M. J., & Solli, P. (2015). Longitudinal studies. Journal of Thoracic Disease, 7(11), E537–E540. [Google Scholar] [CrossRef]
  12. Cloete, M., & Marimuthu, F. (2019). Basic accounting for non-accountants. Van Schaik. [Google Scholar]
  13. Council of Higher Education. (2024). Annual report 23/24 (pp. 1–318). DHET. [Google Scholar]
  14. Eisenhardt, K. M. (1989). Agency theory: An assessment and review. The Academy of Management Review, 14(1), 57. [Google Scholar] [CrossRef]
  15. Erasmus, P., Viviers, S., & Thomas, K. (2020). Corporate finance: A South African perspective (G. Els, Ed.; 3rd ed.). Oxford University Press. [Google Scholar]
  16. Friedman, A. L., & Afitska, N. (2023). Professional bodies. Journal of Professions and Organization, 10(1), 21–35. [Google Scholar] [CrossRef]
  17. Hayes, A. (2018). Introduction to mediation, moderation, and conditional process analysis. A regression-based approach (2nd ed.). Guilford. [Google Scholar]
  18. James, A., & Tripathi, V. (2021). Time series data analysis and ARIMA modelling to forecast the short-term trajectory of the acceleration of fatalities in Brazil caused by the corona virus (COVID-19). PeerJ Life and Environment, 9, E11748. [Google Scholar] [CrossRef]
  19. Jensen, M. C., & Meckling, W. H. (1976). Theory of the firm: Managerial behavior, agency costs and ownership structure. Journal of Financial Economics, 3(4), 305–360. [Google Scholar] [CrossRef]
  20. Karton, J. (2020). International arbitration as comparative law in action. Journal of Dispute Resolution, 2020, 1–37. Available online: https://ssrn.com/abstract=3654734 (accessed on 9 July 2025).
  21. Khuluvhe, M., Netshifhefhe, E., & Negogogo, V. (2022). Post-school education and training monitor: Macro-indicator trends (pp. 1–133). Department of Education and Training. Available online: https://www.dhet.gov.za/Planning%20Monitoring%20and%20Evaluation%20Coordination/Post-School%20Education%20and%20Training%20Monitor%20-%20Macro-Indicator%20Trends%20-%20March%202021.pdf (accessed on 9 July 2025).
  22. Kučera, J., Vochozka, M., & Rowland, Z. (2021). The ideal debt ratio of an agricultural enterprise. Sustainability, 13(9), 4613. [Google Scholar] [CrossRef]
  23. Lee, Y. (2024). Board gender diversity and nonprofit CEO compensation: Implications for gender pay gap. Nonprofit and Voluntary Sector Quarterly, 53(1), 257–273. [Google Scholar] [CrossRef]
  24. Leedy, P. D., & Ormrod, J. E. (2015). Practical research: Planning and design. Pearson. [Google Scholar]
  25. Lucey, B., Urquhart, A., & Zhang, H. (2022). UK vice chancellor compensation: Do they get what they deserve? The British Accounting Review, 54(4), 101108. [Google Scholar] [CrossRef]
  26. Madingwane, R., Mazenda, A., Nhede, N., & Munyeka, W. (2023). Employee performance and remuneration in public service of South Africa. Journal of Public Administration, Finance and Law, 27, 239–253. [Google Scholar] [CrossRef]
  27. Mahon, J. F., & Mitnick, B. M. (2010). Reputation shifting. Journal of Public Affairs, 10(4), 280–299. [Google Scholar] [CrossRef]
  28. Maleka, M. J. (2023). Using ensemble method to predict employee atrrition at the multinational consulting corporation. IBC, Swakopmund Hotel and Entertainment Centre. [Google Scholar]
  29. Maleka, M. J., & Schultz, C. M. (2021). The relationship between performance indicators and executives’ remuneration in the South African higher education sector. Academia Letters. [Google Scholar] [CrossRef]
  30. Maleka, M. J., Sifolo, P., & Henama, U. (2024). Executive gender pay trends in the South African public tourism sector. Journal of Global Business and Technology, 20(1), 1–14. [Google Scholar]
  31. Maree, K. (Ed.). (2016). First steps in research (2nd ed.). Van Schaik. [Google Scholar]
  32. Martocchio, J. J. (2015). Pay, compensation, and performance, psychology of. In International encyclopedia of the social & behavioral sciences (pp. 611–617). Elsevier. [Google Scholar] [CrossRef]
  33. Marx, J., & De Swart, C. (2013). Financial management in Southern Africa (4th ed.). Pearson Education. [Google Scholar]
  34. Mashele, A., Mouton, M., & Pelcher, L. (2024). Corporate governance and financial performance: Family firms vs. non-family firms. Journal of Risk and Financial Management, 17(10), 444. [Google Scholar] [CrossRef]
  35. Mayavo, C. (2023). Towards the development of a sustainable procurement framework for improved operational efficiency in donor-funded procurements in the Zimbabwean public health laboratory services. University of the Witwatersrand. [Google Scholar]
  36. Meyer, J. W., & Rowan, B. (1977). Institutionalized organizations: Formal structure as myth and ceremony. American Journal of Sociology, 83(2), 340–363. [Google Scholar] [CrossRef]
  37. Mitnick, B. M. (1975). The theory of agency: A Framework. In The theory of agency (pp. 1–81). Cambridge University Press. [Google Scholar] [CrossRef]
  38. Mlambo, V., & Spanza, S. (2024). Exploring the challenges of higher education in South Africa: A comprehensive literature review. Alustath Journal for Human and Social Sciences, 63(3), 22–40. [Google Scholar] [CrossRef]
  39. Neubaum, D. O., & Zahra, S. A. (2006). Institutional ownership and corporate social performance: The moderating effects of investment horizon, activism, and coordination. Journal of Management, 32(1), 108–131. [Google Scholar] [CrossRef]
  40. Nkwadi, R., & Matemane, M. R. (2022). Executive compensation and company performance: Pre- and post-marikana uprising analysis. Southern African Business Review, 26, 22. [Google Scholar] [CrossRef]
  41. Pepper, A., Gosling, T., & Gore, J. (2015). Fairness, envy, guilt and greed: Building equity considerations into agency theory. Human Relations, 68(8), 1291–1314. [Google Scholar] [CrossRef]
  42. PWC. (2020). Practices and remuneration trends report: Executive directors (12th ed., pp. 1–97). PWC. Available online: https://www.pwc.co.za/en/assets/pdf/executive-directors-report-2020.pdf (accessed on 27 June 2025).
  43. Ross, S. A., Westerfield, R. W., & Jordan, B. D. (2020). Essentials of corporate finance (10th ed.). McGraw-Hill Education. [Google Scholar]
  44. Rutherford, R. C., Springer, T. M., & Yavas, A. (2005). Conflicts between principals and agents: Evidence from residential brokerage. Journal of Financial Economics, 76(3), 627–665. [Google Scholar] [CrossRef]
  45. Saunders, M., Lewis, P., & Thornhill, A. (2019). Research methods for business students (8th ed.). Pearson. [Google Scholar]
  46. Shaw, P. A. (2011). CEO pay-performance sensitivity in South African financial services companies [MBA thesis, University of Pretoria]. Available online: http://hdl.handle.net/2263/27027 (accessed on 1 July 2025).
  47. Shrum, W. (2001). Science and development. In International encyclopedia of the social & behavioral sciences (pp. 13607–13610). Elsevier. [Google Scholar] [CrossRef]
  48. Singh, R., Gupta, C. P., & Chaudhary, P. (2024). Defining return on assets (ROA) in empirical corporate finance research: A critical review. Empirical Economics Letters, 23, 25–36. [Google Scholar] [CrossRef]
  49. Stoltz-Urban, C., & Govender, K. K. (2014). The role of professional associations in the South African education and training system. Journal of Social Sciences, 41(2), 201–208. [Google Scholar] [CrossRef]
  50. Syafriadi, E., Sitepu, H. B., Andini, Y. P., Muda, I., & Kesuma, S. A. (2023). The impact of agency theory on organizational behavior: A systematic literature review of the latest research findings. Brazilian Journal of Development, 9(12), 31895–31911. [Google Scholar] [CrossRef]
  51. WorldatWork. (2019). Variable pay: Improving performance with variable pay [Graphic]. Available online: https://worldatwork.org/courses/variable-pay-improving-performance-with-variable-pay?tab=virtual (accessed on 3 July 2025).
  52. WorldatWork. (2021). Total rewards inventory programmes and practices (pp. 1–106). WorldatWork. Available online: https://worldatwork.org/media/CDN/dist/CDN2/documents/pdf/resources/research/WorldatWork_Survey_Total%20Rewards%20Inventory%20Programs%20&%20Practices_2022.pdf (accessed on 3 July 2025).
  53. WorldatWork. (2022). International financial reporting standards for total rewards professions. WorldatWork. [Google Scholar]
  54. Zinatsa, F., & Saurombe, M. D. (2022). A framework for the labour market integration of female accompanying spouses in South Africa. SA Journal of Industrial Psychology, 48, a2006. [Google Scholar] [CrossRef]
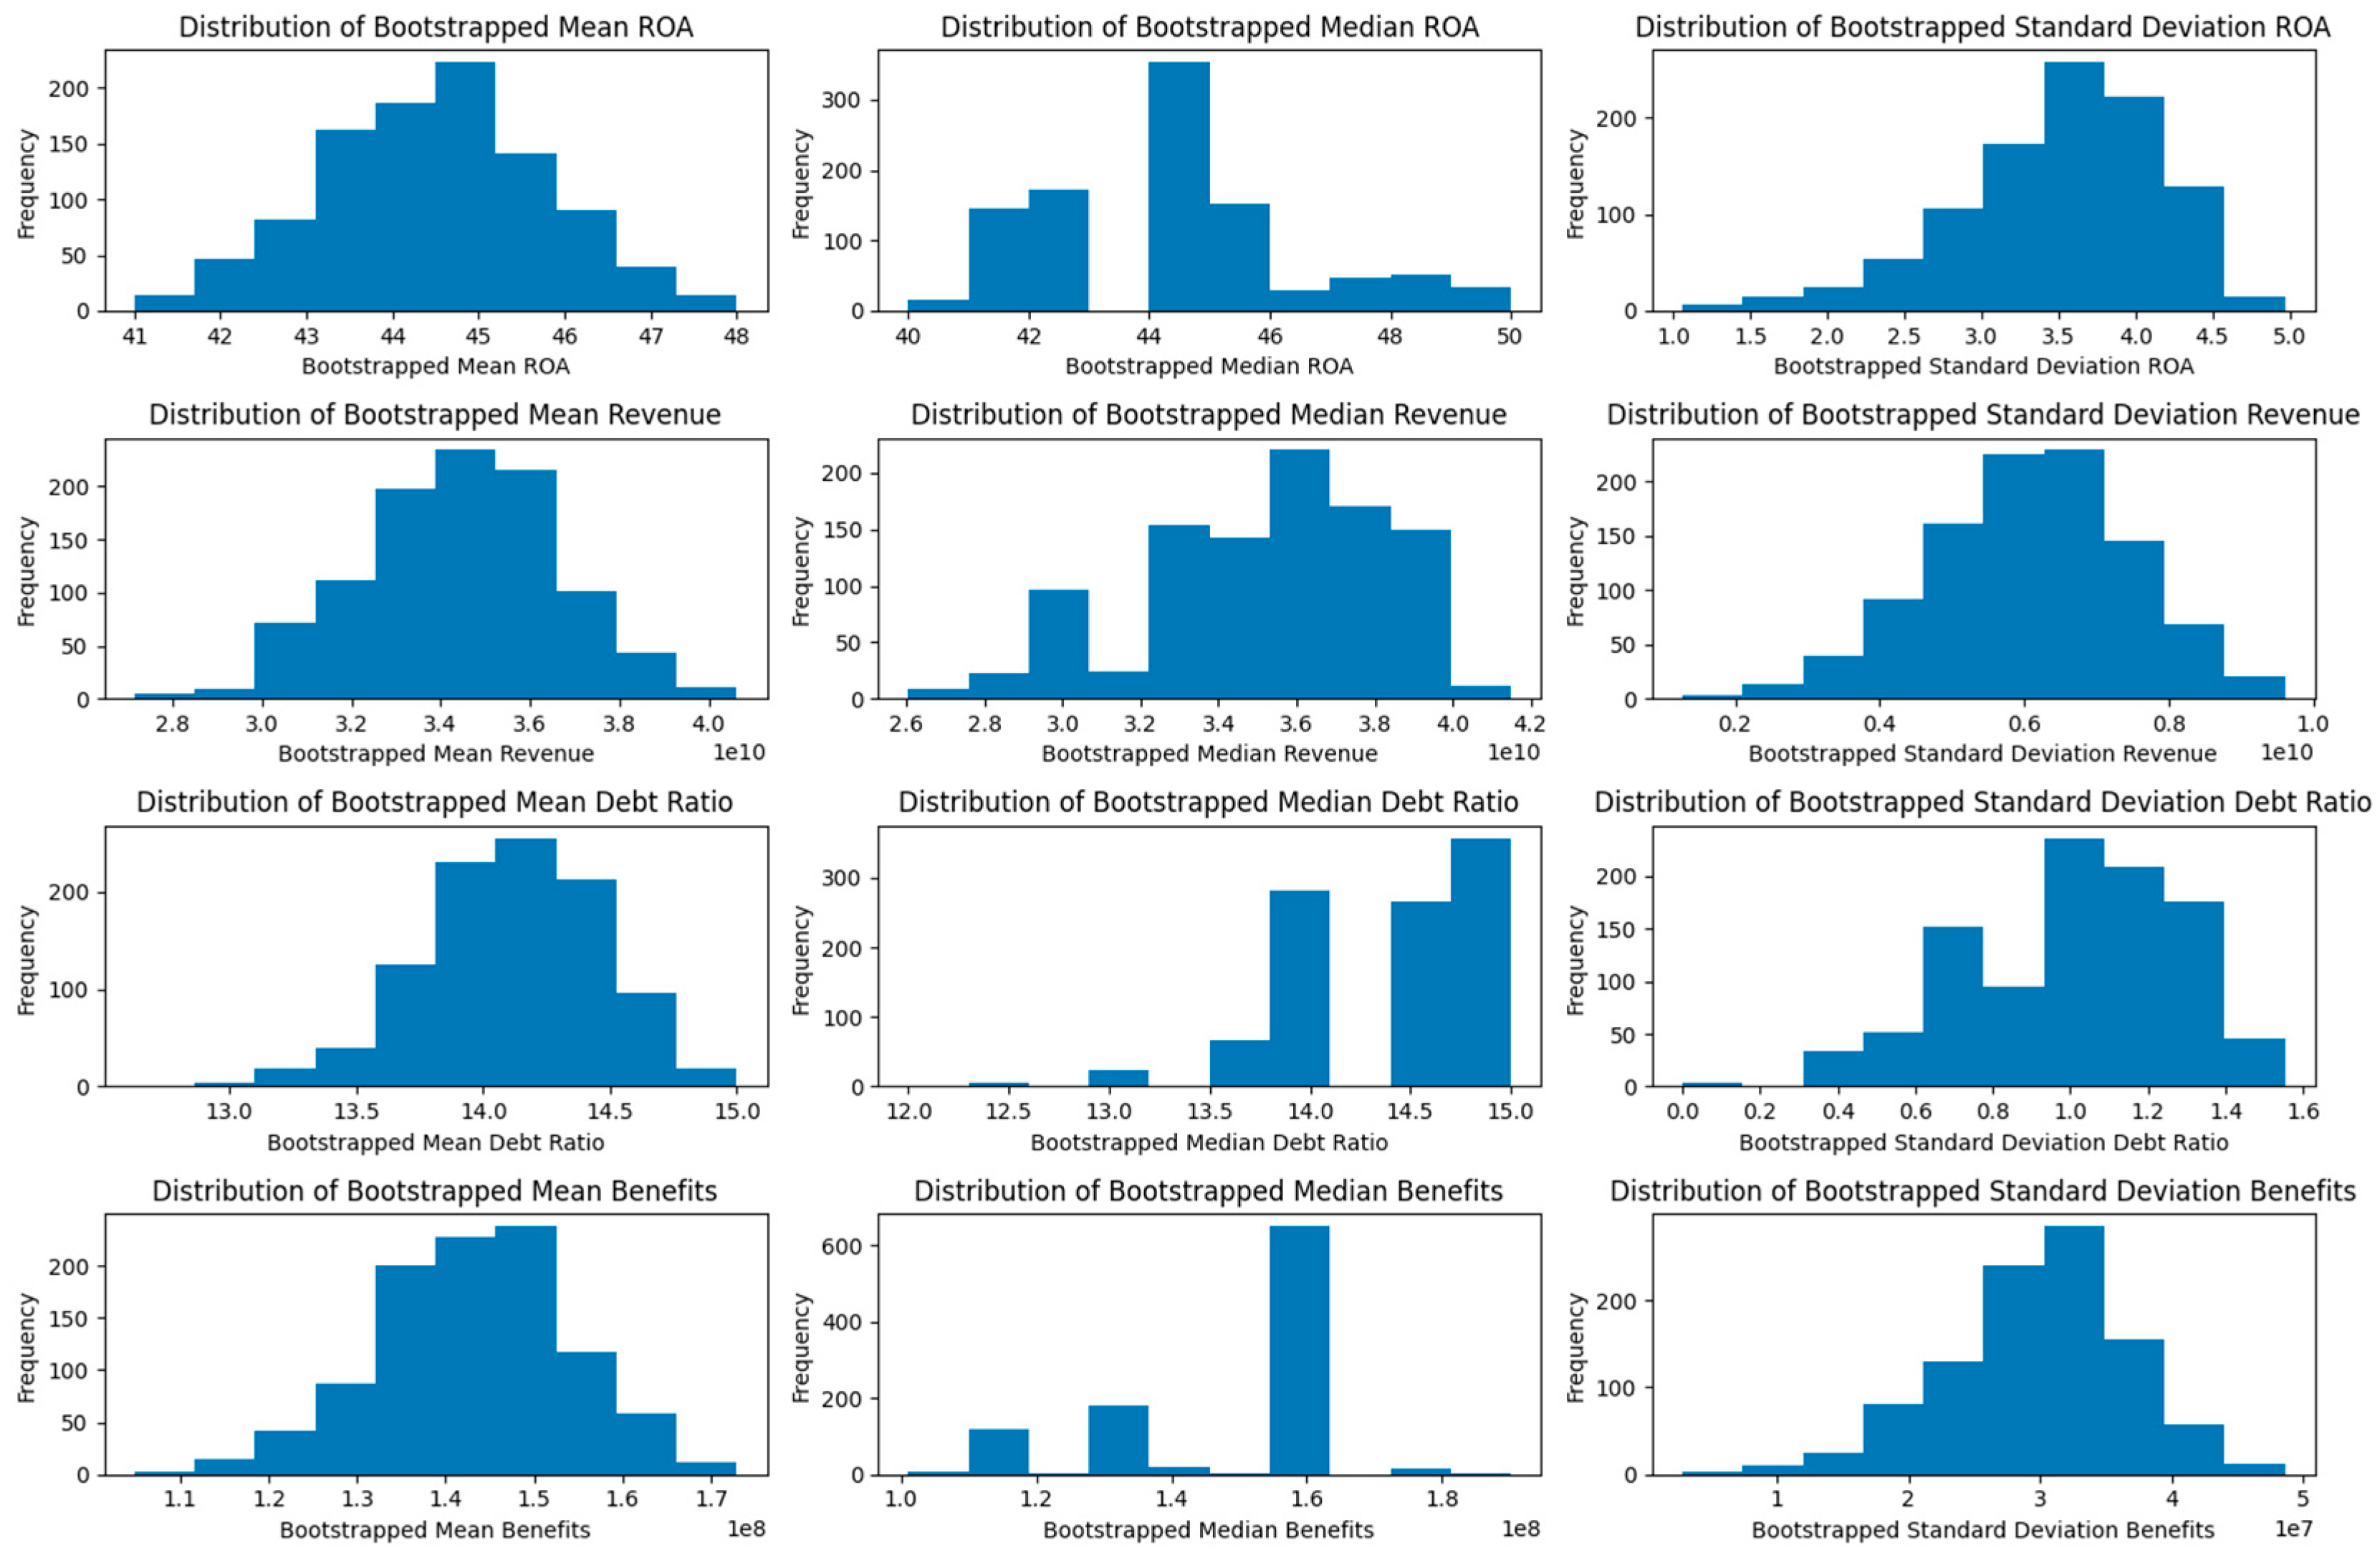
Figure 1. Resampled features. 95% Confidence Interval for Mean ROA: [42.121875, 47.125]; 95% Confidence Interval for Median ROA: [41.0, 49.0]; 95% Confidence Interval for Standard Deviation of ROA: [1.91 × 100, 4.52 × 100]; 95% Confidence Interval for Mean Revenue: [3.01 × 10¹⁰, 3.87 × 10¹⁰]; 95% Confidence Interval for Median Revenue: [2.88 × 10¹⁰, 3.90 × 10¹⁰]; 95% Confidence Interval for Standard Deviation of Revenue: [3.11 × 10⁹, 8.66 × 10⁹]; 95% Confidence Interval for Mean Debt Ratio: [13.375, 14.75]; 95% Confidence Interval for Median Debt Ratio: [13.0, 15.0]; 95% Confidence Interval for Standard Deviation of Debt Ratio: [4.63 × 10⁻¹, 1.41 × 100]; 95% Confidence Interval for Mean Benefits: [1.21 × 10⁸, 1.63 × 10⁸]; 95% Confidence Interval for Median Benefits: [1.15 × 10⁸, 1.63 × 10⁸]; 95% Confidence Interval 95% Confidence Interval for Standard Deviation of Benefits: [1.49 × 10⁷, 4.18 × 10⁷].
Jrfm 18 00550 g001
Figure 2. Benefits as a percentage of fixed.
Jrfm 18 00550 g002
Figure 3. Correlation matrix.
Jrfm 18 00550 g003
Figure 4. Holt–Winters Historical and Forecast Results.
Jrfm 18 00550 g004
Figure 5. Fixed historical salary and forecast.
Jrfm 18 00550 g005
Disclaimer/Publisher’s Note: The statements, opinions and data contained in all publications are solely those of the individual author(s) and contributor(s) and not of MDPI and/or the editor(s). MDPI and/or the editor(s) disclaim responsibility for any injury to people or property resulting from any ideas, methods, instructions or products referred to in the content.