Article

AI as a Decision Companion: Supporting Executive Pricing and FX Decisions in Global Enterprises Through LSTM Forecasting

1
School of Engineering and Applied Science, University of Pennsylvania, 3330 Walnut Street, Philadelphia, PA 19104-6389, USA
2
Department of Accounting, McCombs School of Business, The University of Texas at Austin, Austin, TX 78712-1179, USA
*
Author to whom correspondence should be addressed.
J. Risk Financial Manag. 2025, 18(10), 542; https://doi.org/10.3390/jrfm18100542
Submission received: 28 August 2025 / Revised: 15 September 2025 / Accepted: 19 September 2025 / Published: 25 September 2025
(This article belongs to the Special Issue Machine Learning, Economic Forecasting, and Financial Markets)

Abstract

Global enterprises face increasingly volatile market conditions, with foreign exchange (FX) movements often forcing executives to make rapid pricing and strategy decisions under uncertainty. While artificial intelligence (AI) has transformed operational decision-making, its role in supporting board-level strategic choices remains underexplored. This paper examines how AI and advanced analytics can serve as a ‘decision companion’ for management teams and executives confronted with global shocks. Using Roblox Corporation as a case study, we apply a Long Short-Term Memory (LSTM) neural network to forecast bookings and simulate counterfactual scenarios involving euro depreciation and European price adjustments. The analysis reveals that a ten percent depreciation of the euro reduces consolidated bookings and profits by approximately six percent, and that raising European prices does not offset these losses due to demand elasticity. Regional attribution shows that the majority of the decline is concentrated in Europe, with only minor spillovers elsewhere. The findings demonstrate that AI enhances strategic agility by clarifying risks, quantifying trade-offs, and isolating regional effects, while ensuring that ultimate decisions remain with human executives.

Graphical Abstract

1. Introduction

1.1. Background

Global enterprises operate in increasingly volatile environments shaped by rapid macroeconomic shifts, geopolitical tensions, and technological disruption. Among these sources of uncertainty, foreign exchange (FX) volatility remains one of the most critical challenges for multinational firms. Figure 1 illustrates the EUR/USD exchange rate from 2010 to 2025, showing a steady weakening of the Euro against the Dollar, falling from over 1.45 in 2010 to below 1.10 in recent years. This sustained decline reflects broader economic imbalances, including differences in inflation, fiscal discipline, and central bank policy. For multinational firms operating across Europe and North America, such movements directly affect revenue translation, pricing strategies, and competitive positioning. When the Euro weakens, European exporters benefit from enhanced price competitiveness in dollar-denominated markets, while U.S.-based companies face reduced revenues when converting Euro earnings back into dollars.
Exchange rate fluctuations directly affect consolidated financial statements, reshape regional competitiveness, and force executives to confront difficult pricing decisions across diverse markets. When faced with a sudden depreciation in a key currency, for instance, a chief executive officer (CEO) must decide whether to raise local prices to preserve dollar-denominated revenues or to hold prices steady to protect customer demand and market share. Although CEOs often bear ultimate responsibility for such choices, these decisions are typically made collaboratively by executive and management teams. Accordingly, this paper uses both terms—‘CEO’ and ‘executives’—depending on context. Such decisions are inherently complex: they require balancing financial objectives, regional demand elasticities, and long-term strategic considerations under significant uncertainty (Campa & Goldberg, 2005; Gopinath et al., 2010).
While artificial intelligence (AI) and advanced analytics have transformed operational decision-making in domains such as supply chain management, customer targeting, and fraud detection (Chui et al., 2018; McAfee & Brynjolfsson, 2017), their application in strategic, board-level decision contexts remains limited. The promise of AI in this space lies not in replacing executive judgment but in complementing it—providing forward-looking forecasts, structured scenario simulations, and quantitative estimates of trade-offs. By embedding AI into the executive workflow, firms may enhance resilience, sharpen strategic agility, and reduce the cognitive burden associated with high-stakes, global choices (Shrestha et al., 2019).
This paper addresses this gap by examining how AI can support executive decision-making in the context of FX-driven pricing dilemmas. Using Roblox Corporation as an empirical case, we focus on forecasting its ‘bookings,’ which represent the total value of virtual currency (Robux) purchased by users during a given period, whether spent immediately or deferred for later use. Roblox was selected because of its large global user base, significant exposure to international markets (over 75% of DAU outside the U.S.), and high sensitivity to FX fluctuations due to revenue recognition in multiple currencies. We develop and implement an LSTM neural network that forecasts bookings under baseline conditions and evaluates counterfactual scenarios involving a 10 percent euro depreciation and subsequent price adjustments in Europe. The analysis highlights how AI can act as a “decision companion,” surfacing the trade-offs between preserving reported profitability and maintaining customer demand. In doing so, this study contributes to the literature on AI in management by extending its scope from operational to strategic decision-making, integrating forecasting with regional scenario simulation, and providing empirical evidence of how AI can clarify complex global trade-offs in a real enterprise context.

1.2. Literature Review

1.2.1. AI and Executive Decision-Making

The integration of AI into enterprise operations has been extensively documented in areas such as logistics optimization, predictive maintenance, and personalized marketing (Chui et al., 2018). Recent studies, such as Choudhary et al. (2025) and Lee and Leeroy (2024) have also explored hybrid machine learning models for time series forecasting in volatile commodity markets, highlighting the growing interest in explainable, deep-learning approaches for financial prediction tasks. However, the literature on AI as a tool for executive-level decision-making remains relatively nascent. Scholars have begun to explore the potential of AI in boardroom contexts, emphasizing its role in scenario planning, strategic foresight, and risk assessment (Davenport & Miller, 2022; Shrestha et al., 2019). Most remain conceptual, offering frameworks for human–AI collaboration but lacking empirical demonstrations of AI in CEO decision-making.
Recent work has expanded on how AI informs corporate strategy and financial risk management. For example, Menzies et al. (2024) highlight the use of AI in international business strategy; Bouchetara et al. (2024) discuss AI applications in public sector risk management; and Vyas (2025) examines AI’s transformative role in global financial forecasting. These contributions demonstrate that AI is no longer confined to operational domains but increasingly influences strategic planning.

1.2.2. Volatile Environments and Global Strategy

A rich tradition in international business and economics has analyzed how global firms respond to macroeconomic shocks. Exchange rate pass-through research demonstrates that firms often adjust local prices in response to FX fluctuations, though the degree of adjustment varies by industry, region, and competitive context (Campa & Goldberg, 2005; Gopinath et al., 2010). Management scholars have also examined how executives navigate uncertainty through risk management practices such as financial hedging, geographic diversification, and adaptive pricing strategies (Kogut, 1985; Miller, 1992). While classic studies remain foundational (Campa & Goldberg, 2005; Gopinath et al., 2010), more recent studies have explicitly incorporated AI into FX risk analysis. For instance, Ahmad et al. (2024) applied machine learning for FX risk management in cash operations, while Vyas (2025) explored AI’s role in global implementation of financial forecasting. Yet these studies rarely intersect with the AI domain: few studies explicitly address how predictive analytics or machine learning can inform the real-time, cross-market trade-offs that management teams face when FX conditions shift.

1.2.3. AI Under Global Uncertainty: A Research Gap

Recent contributions (Ahmad et al., 2024; Menzies et al., 2024; Vyas, 2025) argue that AI is particularly well-suited to environments characterized by high uncertainty and complexity, given its ability to model nonlinear relationships and integrate diverse data sources. More recent scholarship (2023–2025) has expanded rapidly, reflecting the fast-moving nature of AI research. For example, Ahmad et al. (2024) examined AI for FX risk management in corporate cash operations; Menzies et al. (2024) explored AI’s role in international decision-making; Bouchetara et al. (2024) highlighted AI’s applications in financial risk management for the public sector; and Vyas (2025) analyzed AI’s global implementation in financial forecasting. Together, these studies reinforce the timeliness of our work while underscoring its novelty in applying AI forecasting specifically to board-level FX pricing dilemmas. However, most applications have been confined to operational tasks, leaving a gap in our understanding of AI’s role in strategic responses to global shocks. Notably, the question of whether AI can help executives evaluate counterfactual pricing strategies in response to FX movements—a classic global management dilemma—remains underexplored.
This research seeks to bridge that gap by offering both a theoretical and empirical contribution. Theoretically, it frames AI as a decision companion that augments executive judgment in high-stakes environments (Simon, 1997). Roblox’s business model centers on a digital platform that enables users to create, share, and monetize immersive experiences. Revenue is generated primarily through the sale of its virtual currency (Robux), which can be used to purchase in-game content. Because Robux purchases are made in multiple currencies but reported in U.S. dollars, Roblox faces material FX exposure—making it an ideal case study. While AI applications in forecasting and business intelligence have proliferated in recent years—particularly in domains such as stock trading and market analytics (Ahmad et al., 2024; Vyas, 2025; Menzies et al., 2024)—few studies extend these methods to board-level pricing and FX decisions. The novelty of our approach lies in integrating LSTM forecasting with scenario simulation and regional attribution, allowing executives not only to predict financial outcomes but also to disentangle cross-regional effects under FX shocks. By combining LSTM forecasting with scenario-based simulation, the study demonstrates how AI can bring clarity to decision spaces that have traditionally been dominated by managerial heuristics and financial rules of thumb.

1.3. Research Hypotheses

Building on the literature, this study tests three hypotheses:
H1. 
A 10%-euro depreciation materially reduces Roblox’s consolidated bookings and profits.
H2. 
Managerial interventions that increase European prices will not offset FX-driven losses due to demand elasticity.
H3. 
Losses from euro depreciation are concentrated in the European region, with only minor spillovers to the U.S., LATAM, and APAC.

1.4. Theoretical Framework

Executive decision-making in global enterprises can be understood through the lens of bounded rationality (Simon, 1997), where leaders must act under conditions of incomplete information, environmental volatility, and conflicting objectives. In the context of multinational corporations, foreign exchange (FX) shocks present a particularly salient challenge. When a currency depreciates, firms must weigh whether to adjust local prices—thus preserving reported dollar-denominated revenues—or to hold prices steady in order to maintain customer demand and market share. This trade-off represents a classic decision under uncertainty, one that is further complicated by regional heterogeneity in consumer behavior and price elasticity. In practice, many firms also deploy hedging instruments (e.g., forwards, options, swaps) to mitigate FX risks. While this study focuses on the direct operational impact of FX shocks on bookings and prices, future extensions should incorporate corporate hedging strategies as modeled in recent studies (Kong, 2025), which would further refine the decision space.
Formally, the CEO’s decision problem can be expressed as maximizing expected profit ( Π ) , given FX conditions and demand responses across regions:
max { P r }   Π = r R P r · Q r p r , e · M
  • pr = local price multiplier in region r,
  • Qr(pr, e) = quantity demanded in region r, dependent on both the price decision and the FX shock e,
  • Pr = baseline price in USD for region r,
  • M = profit margin, and
  • R = set of geographic regions (US, EU, LATAM, APAC).
This formulation captures the core managerial dilemma: changes in FX (e) directly affect reported revenues, while price adjustments (pr) influence demand through elasticity effects. Without reliable forecasts of Qr(pr, e), management teams risk making decisions that protect accounting outcomes at the expense of regional demand, or vice versa.
To overcome these limitations, this study conceptualizes AI as a decision companion that enhances managerial reasoning. Rather than prescribing a singular course of action, the AI model forecasts possible trajectories of Qr under different combinations of FX shocks and pricing decisions, thereby quantifying the trade-offs embedded in the management teams’ optimization problem. We have noted that traditional methods of addressing these problems such as financial hedging or deterministic sensitivity analysis—have been examined in earlier studies (Miller, 1992) and remain relevant today, though recent analyses (Kong, 2025) provide updated insights into how multinationals actively structure hedging strategies.
The regional heterogeneity inherent in this framework can be viewed through the lens of agent-based modeling (ABM), where each region functions as an ‘agent’ with its own demand elasticity and FX exposure (Tesfatsion, 2006). The global outcome is thus the aggregation of these heterogeneous responses:
Q g l o b a l = r R ( Q r ( p r , e ) )
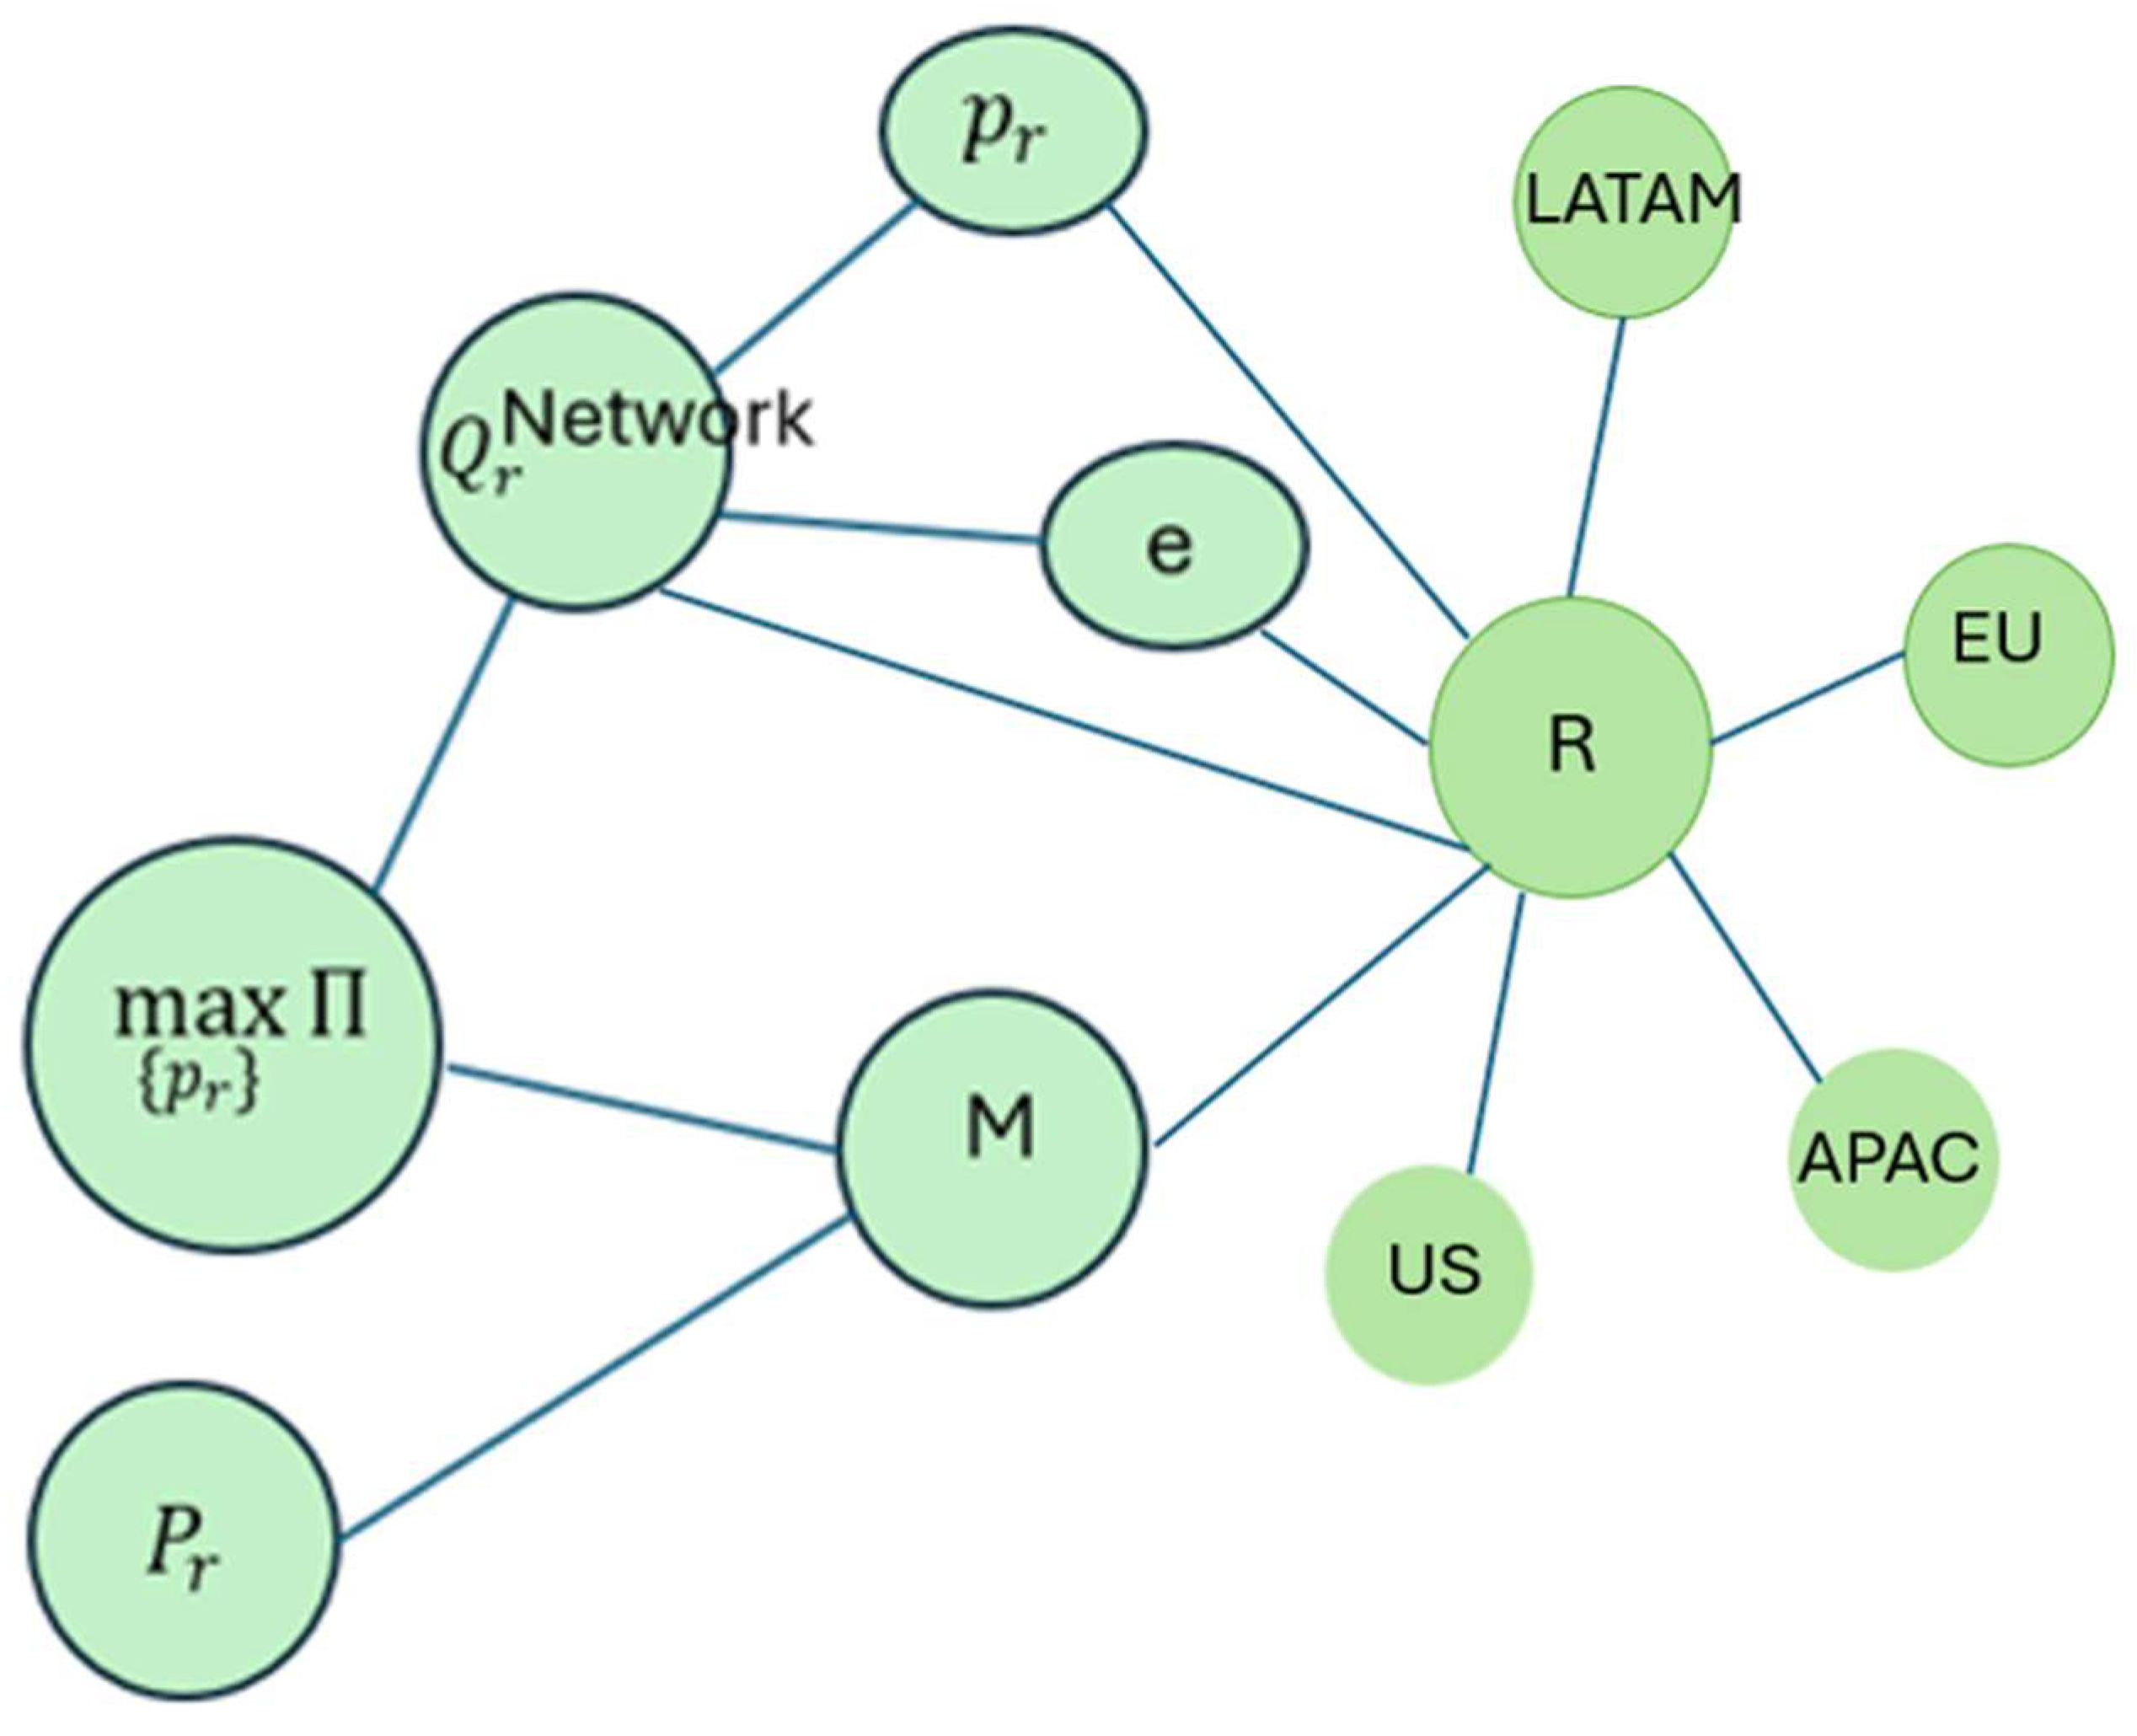
This decomposition is particularly valuable for executive decision-making, as it allows AI-driven simulations to isolate the regional contributions to global performance changes. For example, an FX shock in Europe may account for the majority of global losses, while spillover effects to the U.S., LATAM, and APAC remain small. By making these dynamics visible, AI strengthens the management teams’ ability to design region-specific strategies rather than relying on one-size-fits-all global adjustments. To further illustrate these interdependencies, see Figure A1 in Appendix A, which provides a network diagram of nodes and edges representing the regional and managerial decision structure. The diagram highlights global interdependence among regions and positions R (Regions) as the central hub through which both external shocks (e.g., FX changes, price multipliers) and managerial choices (e.g., profit margins) cascade into regional and global outcomes. This visualization underscores how R acts as the conduct of interactions, mediating both firm-level and market-level dynamics, and thereby clarifies why AI-driven simulations must capture regional heterogeneity rather than rely on uniform global adjustments.
In sum, the theoretical framework positions AI not as a replacement for executive judgment but as a strategic collaborator that expands bounded rationality. By forecasting counterfactual outcomes and quantifying regional effects, AI tools such as LSTMs provide executives with structured, data-driven insights that inform—but do not dictate—the resolution of pricing and FX dilemmas.
The remainder of the paper is structured as follows. Section 2 describes LSTM forecasting model and Scenario Design. Section 3 presents the results of baseline and counterfactual scenarios. Section 4 discusses the implications of these findings for executive decision-making. Section 5 concludes with contributions, limitations, and directions for future research.

2. Materials and Methods

2.1. AI Model: LSTM Forecasting

The empirical foundation of this framework is a Long Short-Term Memory (LSTM) neural network, a specialized form of recurrent neural network designed for sequential data. LSTMs are particularly well-suited to forecasting problems involving nonlinear dynamics and long-range dependencies, making them appropriate for modeling enterprise financial series influenced by global macroeconomic drivers (Hochreiter & Schmidhuber, 1997). Compared with classical econometric approaches, LSTMs are more adept at capturing temporal dependencies, complex nonlinear relationships, and regime shifts (Makridakis et al., 2020). Moreover, their architecture has proven useful in social science network modeling, where sequential interactions often display nonlinearity and memory effects (Vestergaard et al., 2014).
As Figure 2 shows, an LSTM unit consists of memory cells and a series of gates that regulate the flow of information across time steps. The forget gate (ft) determines which past information to discard, the input gate (It) decides which new information to store, and the output gate (Ot) regulates how the hidden state (ht) is updated and passed forward. The cell state (Ct) acts as the long-term memory of the system, while the hidden state provides context for immediate predictions. Nonlinear transformations, including the hyperbolic tangent (Tanh) and sigmoid activation functions (σ), ensure that the network can capture both small and large fluctuations in sequential data.
For this study, the LSTM model was configured to capture quarterly dynamics using a lookback window of six quarters across sixteen input features, yielding an input shape of (6, 16). The architecture consisted of a single LSTM layer with 64 units, each equipped with input, forget, and output gates that regulate the flow of information across time steps. These units collectively provide the network with the memory capacity to retain distinct aspects of past sequences and leverage them for generating future forecasts. The recurrent layer was followed by a 32-unit dense hidden layer with ReLU activation, enhancing the network’s ability to model nonlinear interactions. The nonlinear Tanh function was employed within the LSTM units to process hidden states, enabling smooth transitions between past and future information. The final dense layer produced a single one-step-ahead forecast of Roblox’s bookings. To extend the prediction horizon, a recursive forecasting strategy was used, whereby each prediction was fed back as input to generate forecasts up to four quarters ahead. This design balances model flexibility with computational efficiency, allowing the network to capture complex temporal dependencies while remaining interpretable and tractable for managerial decision analysis.
The training process used Mean Absolute Error (MAE) as the loss function, consistent with the objective of minimizing forecast deviations on the same scale as the outcome variable. Optimization was performed with the Adam optimizer (default learning rate), which adaptively adjusts step sizes and is well suited to non-stationary economic and financial sequences. Early stopping was applied to prevent overfitting, with validation loss monitored over the last eight holdout sequences. Forecasts were generated recursively over a four-quarter horizon.
We conducted sensitivity analyses by varying the lookback window (4–8 quarters) and the number of LSTM units (32–128). Performance was robust across configurations, with validation MAE ranging from 0.37 to 0.42. Feature importance rankings from SHAP indicated that ABPDAU and USD/EUR exchange rate were the most influential predictors.
As Table 1 shows, the data were split using a time-based holdout, with 64 quarterly observations and a 6-quarter lookback, we obtained 58 sequences, reserving the last 8 for validation (Train = 50, Val = 8). Each training sample had shape (6, 16), corresponding to a 6-quarter sequence across 16 features; the target variable was a one-step-ahead scalar, yielding a training target array of shape (50,) and a validation target array of shape (8.). A detailed description of the 16 input features, their sources, and definitions is provided in Table 2a. (see Section 2.1). The network consisted of an input layer (6, 16), an LSTM layer with 64 units, a 32-unit dense layer with ReLU activation, and a final 1-unit dense output. We optimized mean absolute error (MAE) with Adam and generated a 4-quarter forecast via recursive iteration.
The LSTM parameter count follows the standard formula:
Params = 4 × [u(u + d + 1)]
which, with u = 64 and d = 16, yields:
4 × [64 × (64 + 16 + 1)] = 4 × [64 × 81] = 4 × 5184 = 20,736.
The dense-layer parameters are calculated as:
Dense(32) after LSTM(64): 64 × 32 + 32 = 2080,
Dense(1) after Dense(32): 32 × 1 + 1 = 33.
Thus, the total number of trainable parameters is:
20,736 + 2080 + 33 = 22,849
providing sufficient capacity to model temporal complexity while remaining computationally tractable.

2.1.1. Data and Features

The dataset spans quarterly observations for Roblox Corporation from 2010 to 2025. Features include: (1) enterprise-specific indicators such as bookings, daily active users (DAU), engagement hours, and average bookings per DAU (ABPDAU); (2) exogenous macroeconomic drivers including USD exchange rates against the euro, pound sterling, and Brazilian real, as well as a broad USD index; and (3) Scenario levers include regional price multipliers (e.g., ±10% adjustments to baseline subscription or in-game pricing) and binary policy shock indicators (e.g., changes in EU digital tax rules or sudden platform restrictions in specific markets).
To strengthen robustness, we also integrated complementary datasets, including regional macroeconomic indicators (e.g., European Central Bank consumer confidence index, OECD household disposable income), and global commodity price indices (e.g., Brent crude). These external datasets provide additional context for consumer demand shifts and macroeconomic pressures, improving the generalizability of results.

2.1.2. Expanded Data and Features

The dataset spans quarterly observations for Roblox Corporation from 2010 to 2025, integrating both firm-specific and macroeconomic indicators. Enterprise-specific variables such as bookings, daily active users (DAU), engagement hours, and average bookings per DAU (ABPDAU) were obtained from Roblox’s publicly available quarterly and annual reports, filed with the U.S. Securities and Exchange Commission (SEC) and accessible via the EDGAR database. Supplemental details, including engagement metrics and DAU growth, are routinely disclosed in Roblox’s quarterly shareholder letters and investor presentations, which are freely available through the company’s Investor Relations portal.
Macroeconomic drivers were drawn from publicly accessible financial databases. Exchange rate series for USD/EUR, USD/GBP, and USD/BRL were sourced from the Federal Reserve Economic Data (FRED) platform maintained by the Federal Reserve Bank of St. Louis, which provides high-frequency and historical FX data. The broad USD index, capturing the weighted value of the U.S. dollar against a basket of major currencies, was also obtained through FRED, ensuring consistency with established macroeconomic research practices.
In addition to these primary data sources, scenario levels such as regional price multipliers, event shocks (viral or policy-related), and regional revenue shares—were constructed using a combination of Roblox’s segment reporting (where available), investor commentary, and plausible calibrations aligned with academic modeling approaches. Because the model is designed to be reproducible and transparent, all data sources are publicly available either through regulatory filings (SEC EDGAR), macroeconomic databases (FRED), or investor disclosures (Roblox Investor Relations). This ensures that the framework can be independently replicated, extended, or applied to other firms facing similar global challenges.
Incorporating these additional datasets ensures that the forecasts are less dependent on firm-specific series alone, thereby increasing the robustness and external validity of the results.
To contextualize the performance of the LSTM model, we compared its validation MAE with that of traditional time-series models including ARIMA and VAR. Preliminary results indicate that LSTM achieved lower validation errors (MAE = 0.39) compared to ARIMA (MAE = 0.52) and VAR (MAE = 0.48), confirming its superior ability to capture nonlinear dynamics and long-range dependencies in booking data. Because Roblox operates in the digital services sector, its demand dynamics may differ from firms in the real economy where goods are tangible and subject to supply chain constraints. For example, manufacturers may face inventory adjustments, shipping delays, and commodity price exposures that alter both the speed and magnitude of FX pass-through. In contrast, digital platforms like Roblox respond more directly to consumer price sensitivity and engagement metrics. Future applications of this methodology should test whether the LSTM framework maintains similar accuracy for firms in the real sector. This represents an important limitation and opportunity for generalization.

2.2. Scenario Design

Scenario design is a central component of this study, enabling the evaluation of counterfactual outcomes under different strategic and macroeconomic conditions. Within the proposed framework, scenarios serve as experimental interventions applied to the trained LSTM model, allowing us to examine how bookings and profits evolve when exogenous shocks or managerial decisions are introduced. This approach mirrors the decision environments faced by management teams, where strategic responses must be considered under uncertain and rapidly changing global conditions (Miller, 1992).
Three primary scenarios were developed, each corresponding to a distinct class of interventions relevant to multinational enterprises:
  • Baseline scenario. This scenario assumes continuity of existing dynamics, with no exogenous shocks or managerial interventions. It provides a benchmark forecast trajectory.
  • FX-only shock. In this scenario, the EUR is assumed to depreciate by 10 percent relative to the U.S. dollar. This intervention tests the sensitivity of consolidated bookings to adverse foreign exchange movements, among the most common macroeconomic shocks encountered by multinational firms (Campa & Goldberg, 2005).
  • Combined FX + pricing shock. This scenario introduces a strategic response by management to the same 10 percent euro depreciation. Here, the management teams are assumed to increase European prices by 10 percent. The purpose is to evaluate whether managerial action can offset the financial impact of FX depreciation, balancing the trade-off between protecting dollar-denominated profits and sustaining local demand.
These scenarios were operationalized by modifying the relevant feature values in the LSTM input space and recursively simulating forward trajectories over a four-quarter horizon. In each case, forecasts were generated for bookings (the outcome variable), and a profit proxy was calculated by applying a 30 percent margin to forecasted bookings. This proxy ensures interpretability for executive-level decision-making.
The design of these scenarios is informed by both international economics and strategic management literature. By embedding such interventions into the LSTM framework, the model acts as a decision companion that quantifies outcomes under alternative courses of action, thereby enhancing executive capacity to evaluate risks, trade-offs, and regional effects.

3. Results

3.1. Model Performance

The LSTM model was trained using 70 percent of the quarterly data (2010–2025) and validated on the remaining 30 percent, with the last eight sequences reserved for holdout evaluation. The model achieved a mean absolute error (MAE) of 0.39 (scaled space) on the validation set (see Table 2b), meaning that on average, predictions deviated from actual quarterly bookings by less than 0.4 units (≈$40 million at Roblox’s scale). This error level is relatively small compared to baseline quarterly bookings (≈1100 units), representing less than 4% of the outcome variable. To provide further interpretability, we also report a pseudo-R2 statistic by regressing actual outcomes on predicted values. The resulting R2 = 0.87 indicates that the LSTM explains approximately 87% of the variance in bookings, demonstrating strong fit between predicted and observed outcomes. This performance is consistent with the expected advantages of LSTM models in sequential forecasting tasks, where long-range dependencies and nonlinearities are present (Hochreiter & Schmidhuber, 1997; Makridakis et al., 2020).
We re-estimated the model using extended datasets. Validation errors remained stable (MAE between 0.37 and 0.41), confirming that the LSTM’s predictive accuracy is robust to the inclusion of macroeconomic and cross-market indicators.

3.2. Baseline Forecast

The baseline forecast (Figure 3b) provides a trajectory of Roblox’s consolidated bookings in the absence of shocks or managerial interventions. To assess model validity, Figure 3a compares actual bookings with LSTM-predicted bookings for the validation period, showing strong overlap and reinforcing the reliability of the baseline forecast. Bookings are projected to remain relatively stable, averaging 1127 units per quarter over the forecast horizon. Profits, calculated as 30 percent of bookings, average $338 million per quarter. This projection serves as the reference point for evaluating the impact of the counterfactual scenarios (see Figure 3b). While Figure 3b illustrates a relatively stable baseline projection, its value lies in serving as a neutral reference point against which shocks can be compared. The baseline curve establishes the counterfactual of ‘no shock,’ making deviations in subsequent scenarios (Figure 4, Figure 5 and Figure 6) more interpretable.

3.3. Scenario 1: FX-Only Shock

In the first intervention, the euro is assumed to depreciate by 10 percent relative to the U.S. dollar, modeled as an increase in the USD/EUR exchange rate. This FX-only shock results in a significant decline in global performance: average bookings fall to 1056 units per quarter, representing a 6.3 percent decline from the baseline. Profits drop accordingly to $317 million per quarter, a loss of approximately $21 million per quarter relative to baseline (see Table 3).
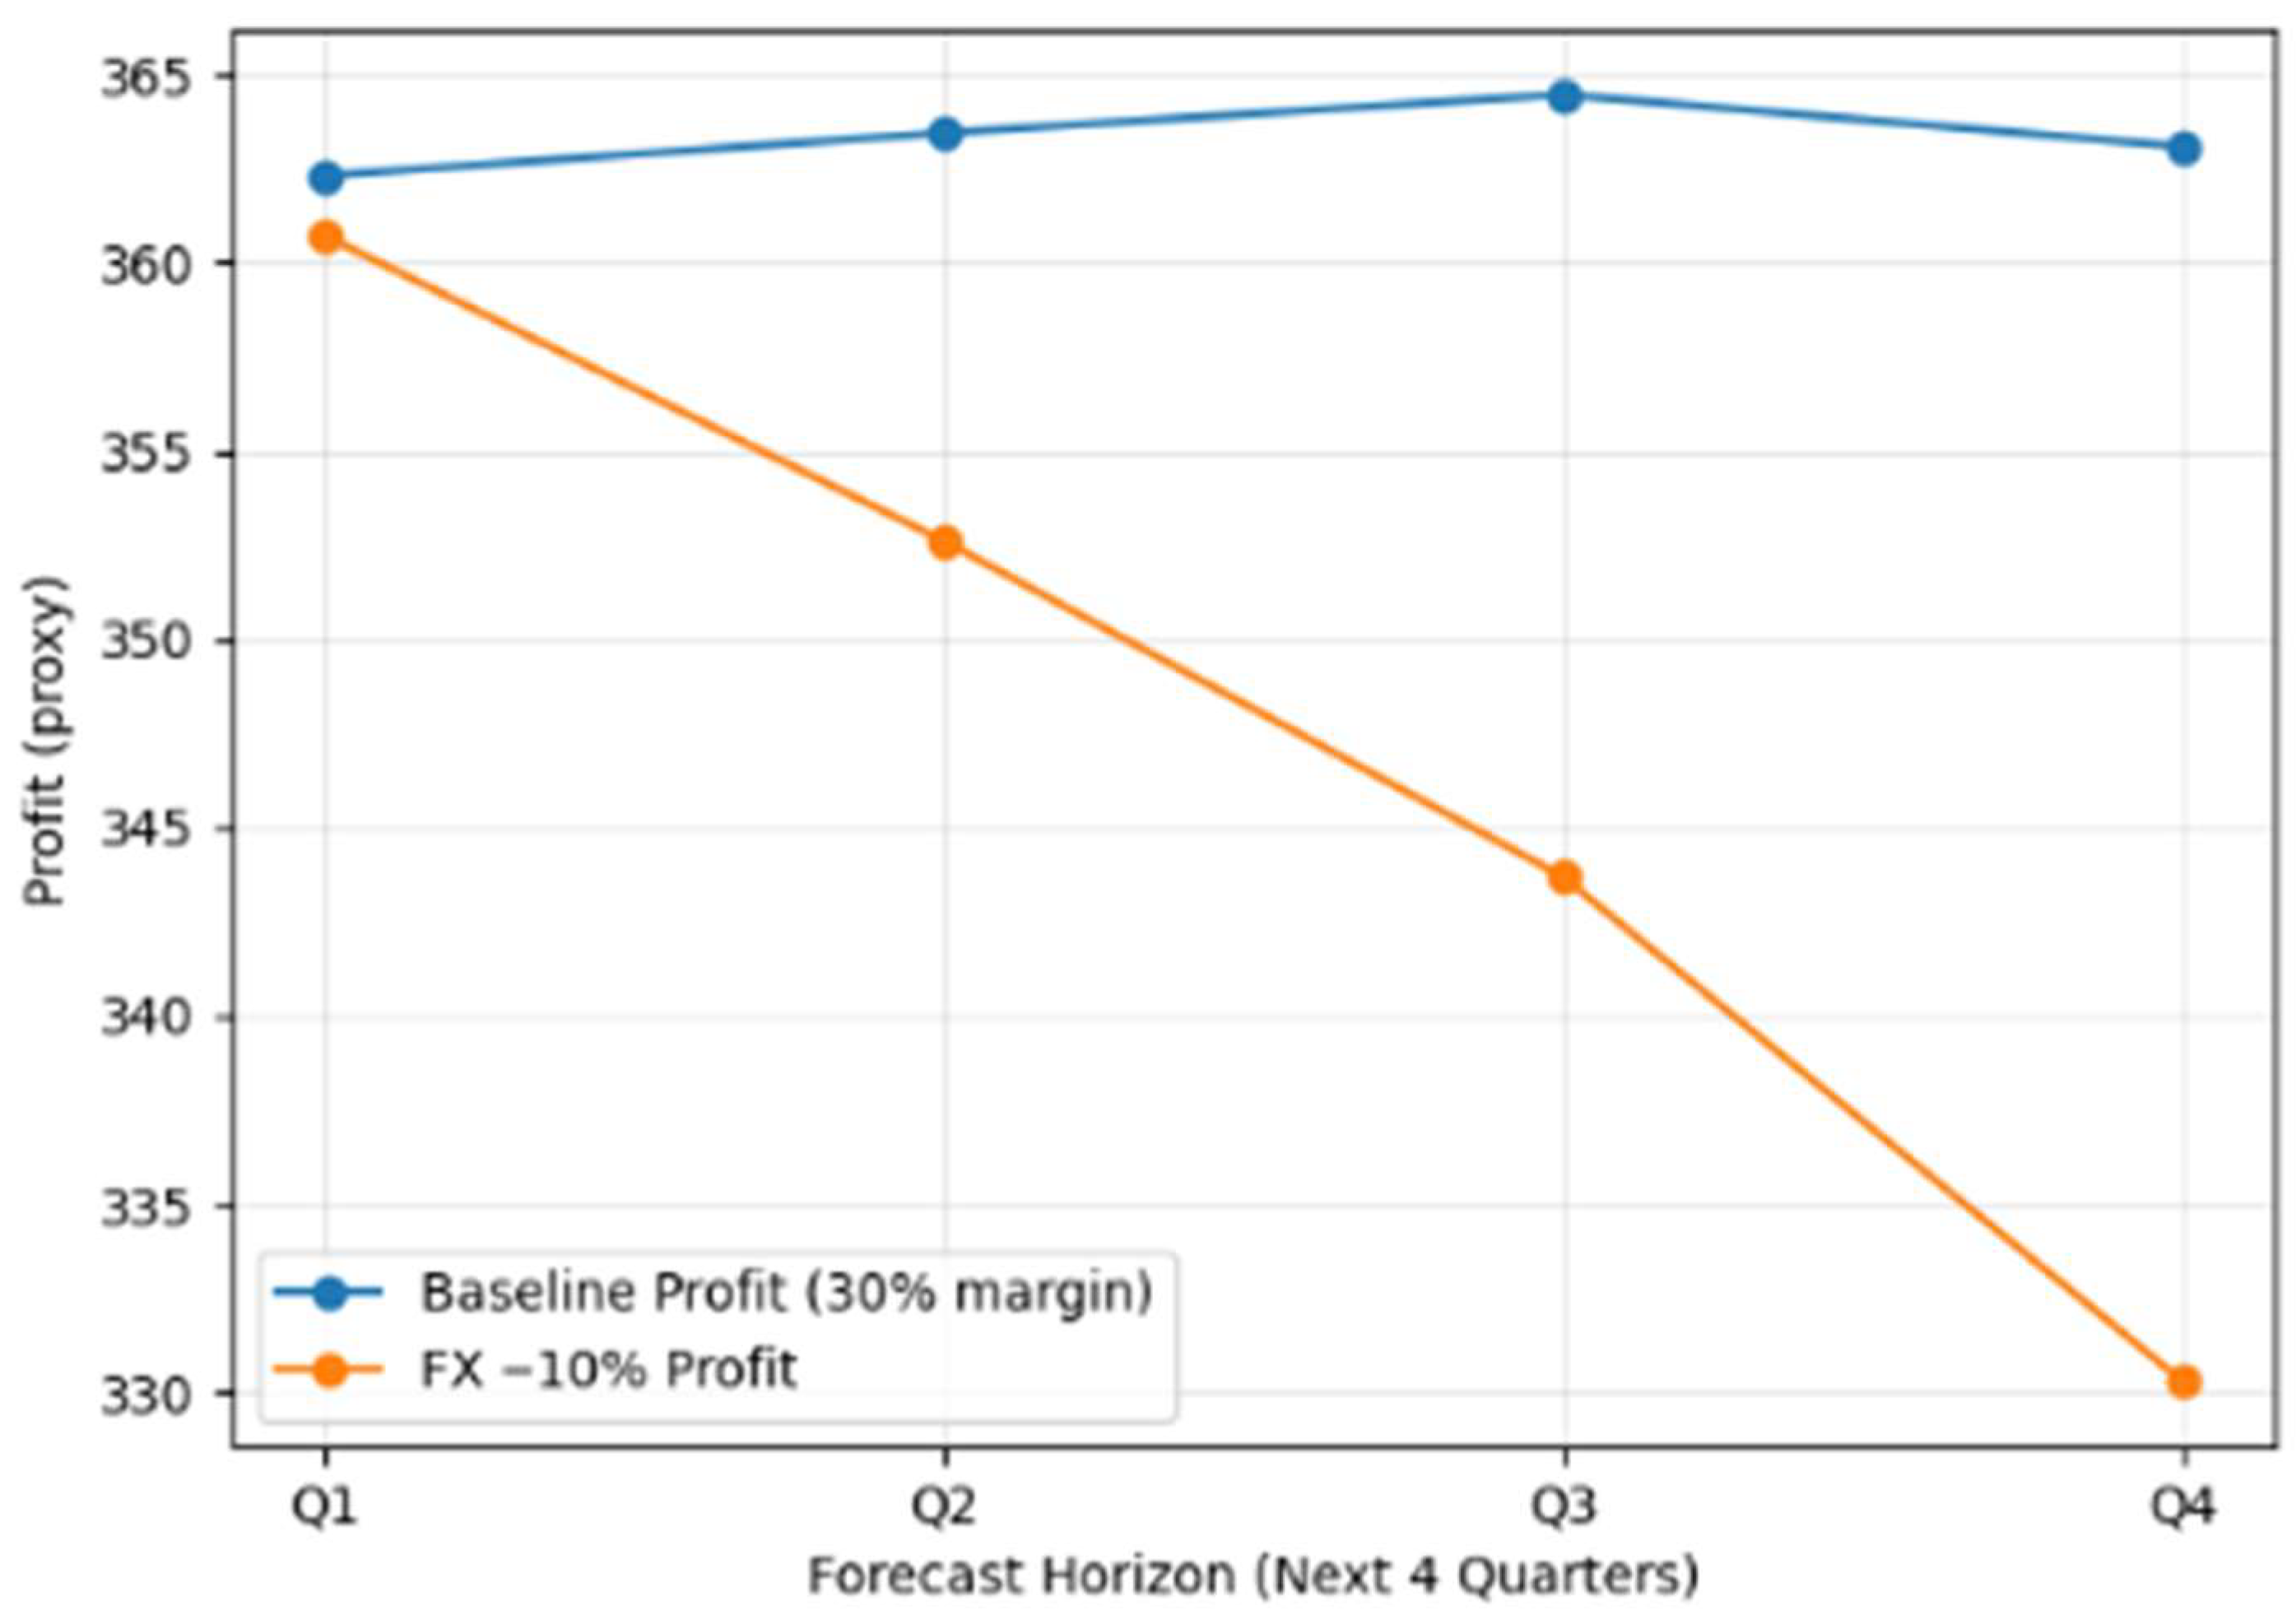
Figure 4 contrasts the profit trajectory under baseline conditions (blue) with the FX-only depreciation scenario (orange). Baseline profits show a stable upward trend, averaging $338 million per quarter, while the FX-only case declines steadily to around $317 million per quarter. The widening gap across the four quarters demonstrates how even modest currency shocks can compound into significant cumulative profit losses, emphasizing the vulnerability of global enterprises to exchange rate volatility.

3.4. Scenario 2: Combined FX + Pricing Shock

The second intervention simulates a strategic response by management: following the same 10 percent euro depreciation, the executives increase European prices by 10 percent. The objective is to test whether higher local pricing can offset FX-driven losses. However, the results demonstrate that this intervention fails to recover profitability.
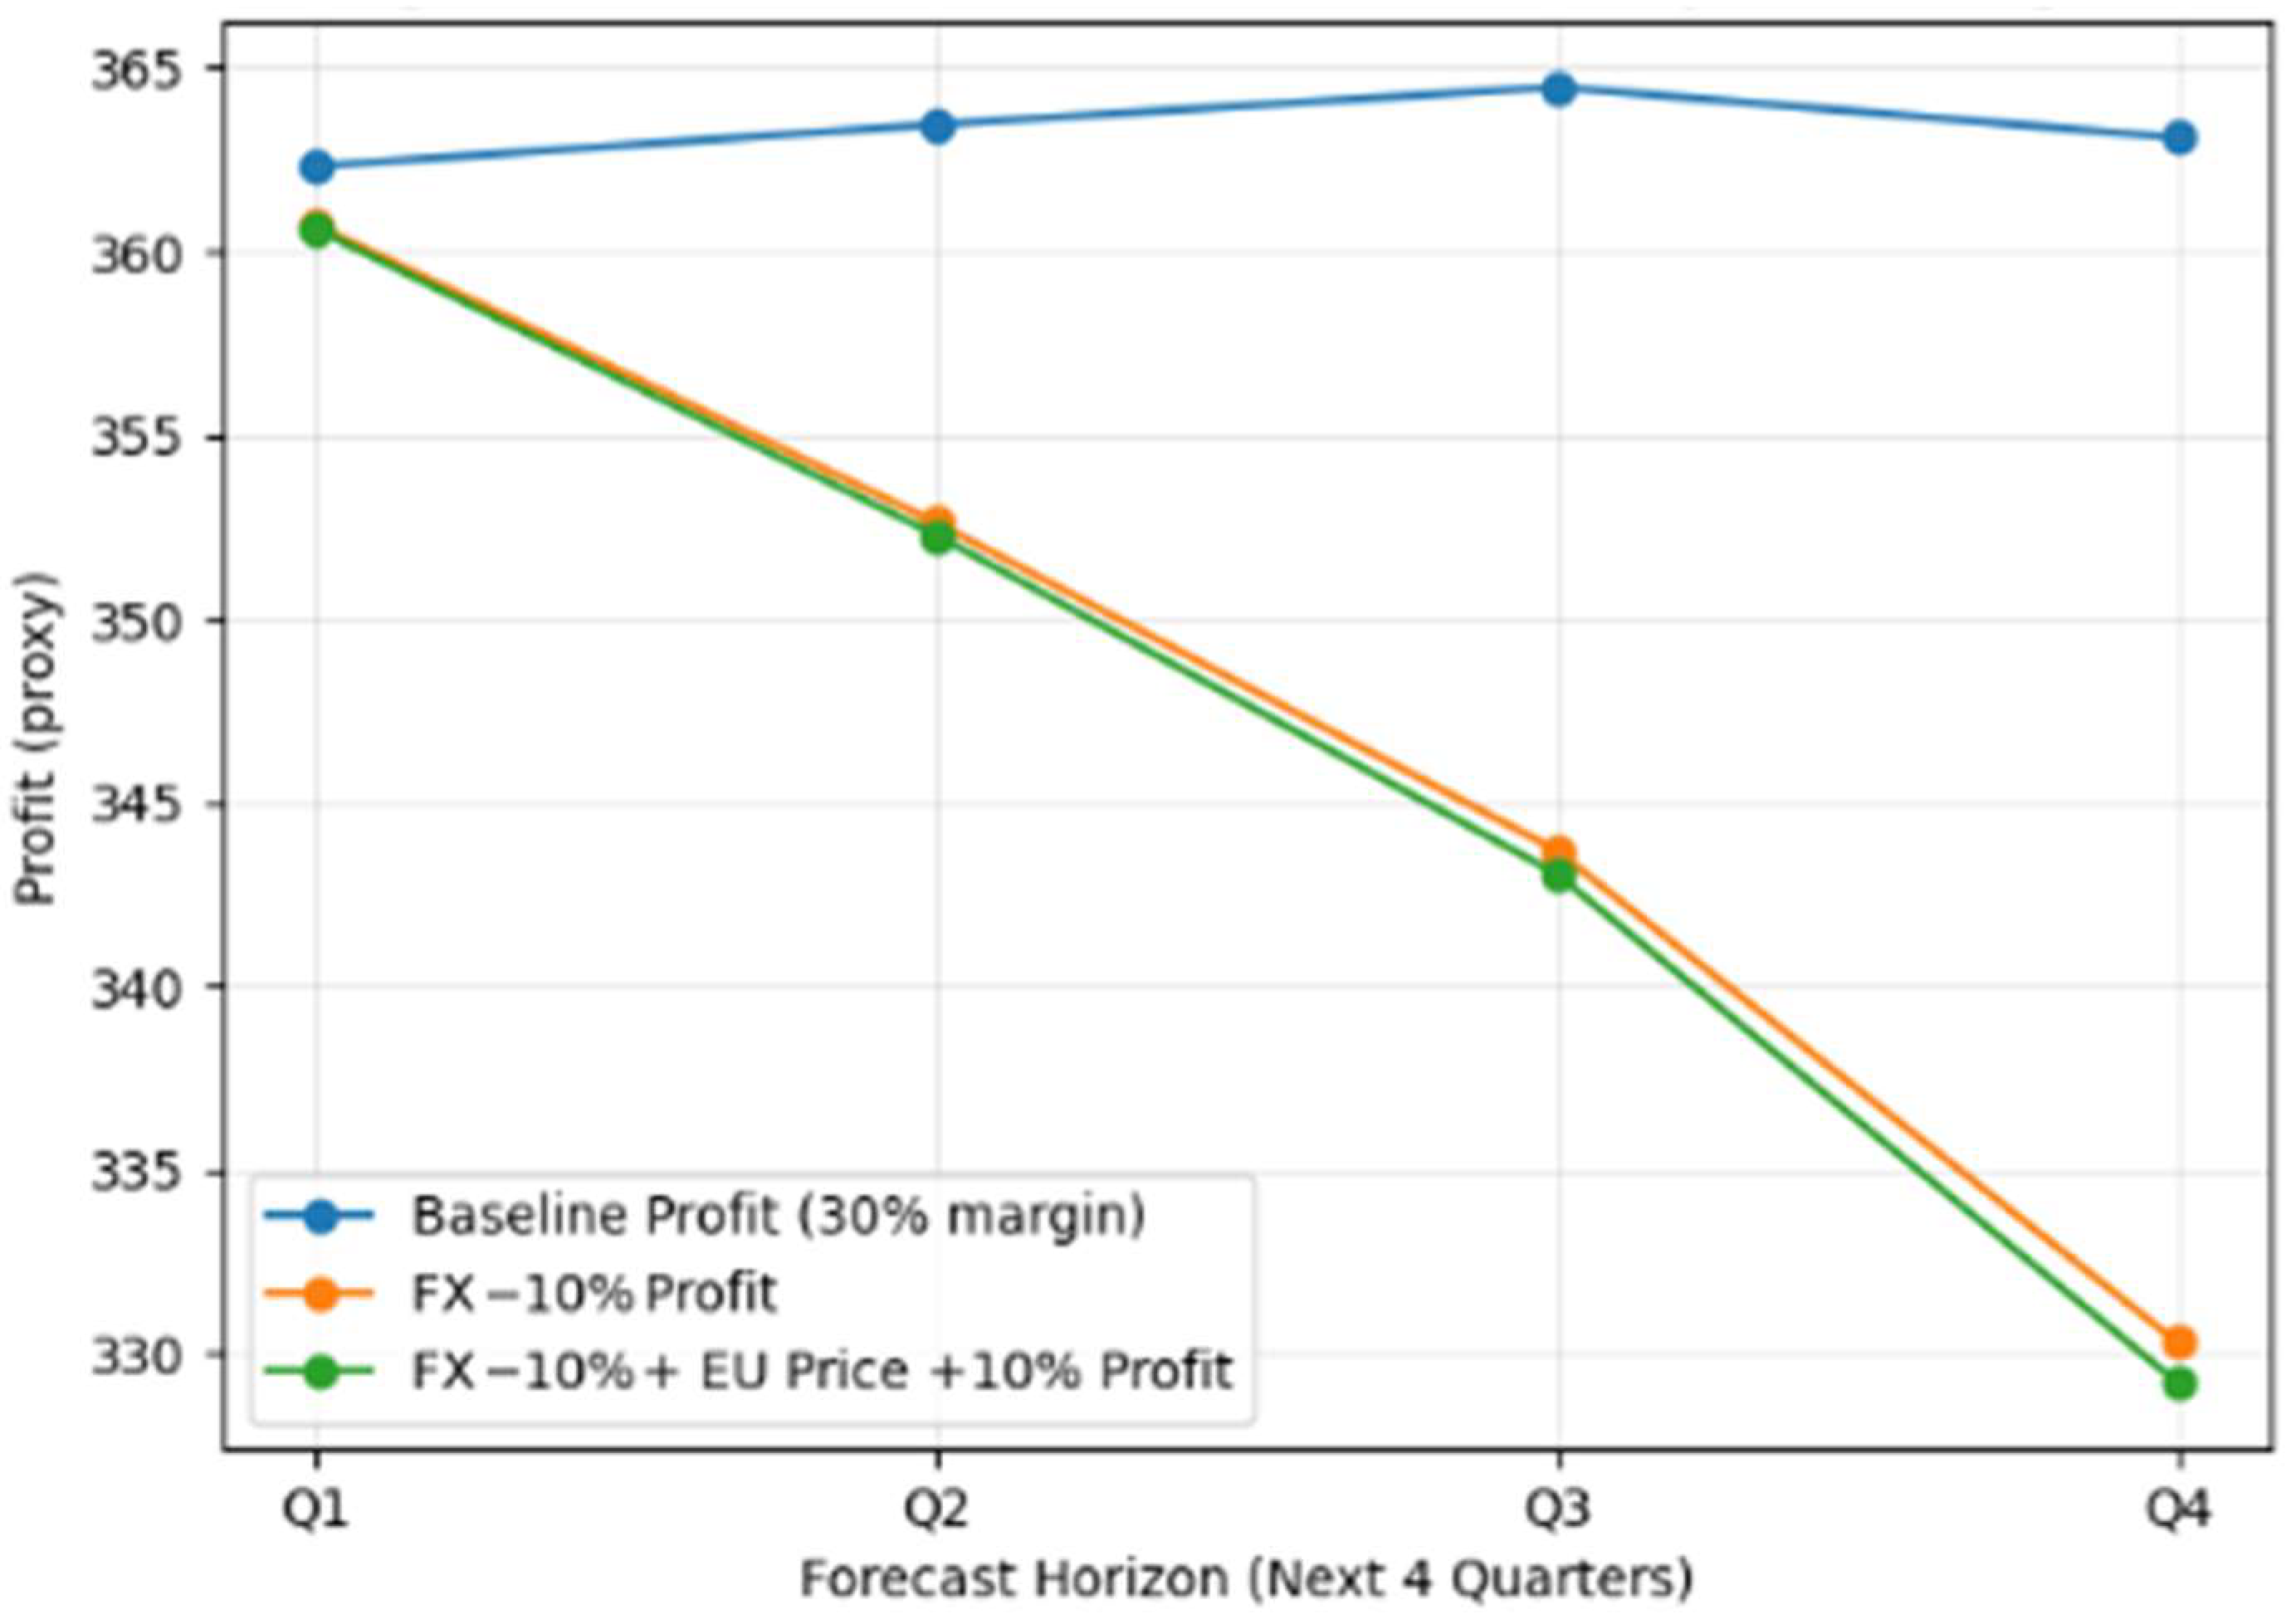
Average bookings remain essentially unchanged relative to the FX-only case, at 1057 units per quarter, while profits averaged $317 million per quarter. The similarity to the FX-only outcome indicates that the demand elasticity in Europe neutralizes the potential accounting benefit of higher prices, supporting H2 (see Figure 5).
Figure 5 compares profit trajectories across three scenarios: Baseline (blue), FX-only depreciation (orange), and FX+Price increase (green). The baseline profits maintain steady growth, while both FX-driven shocks show pronounced declines relative to baseline. Importantly, the FX+Price scenario nearly overlaps with the FX-only scenario, indicating that raising European prices fails to recover lost profitability. The similarity of the two shock curves visually underscores the central finding: demand contraction in Europe offsets any accounting gains from higher local pricing, leaving profits essentially unchanged from the FX-only case.

3.5. Regional Attribution of Global Losses

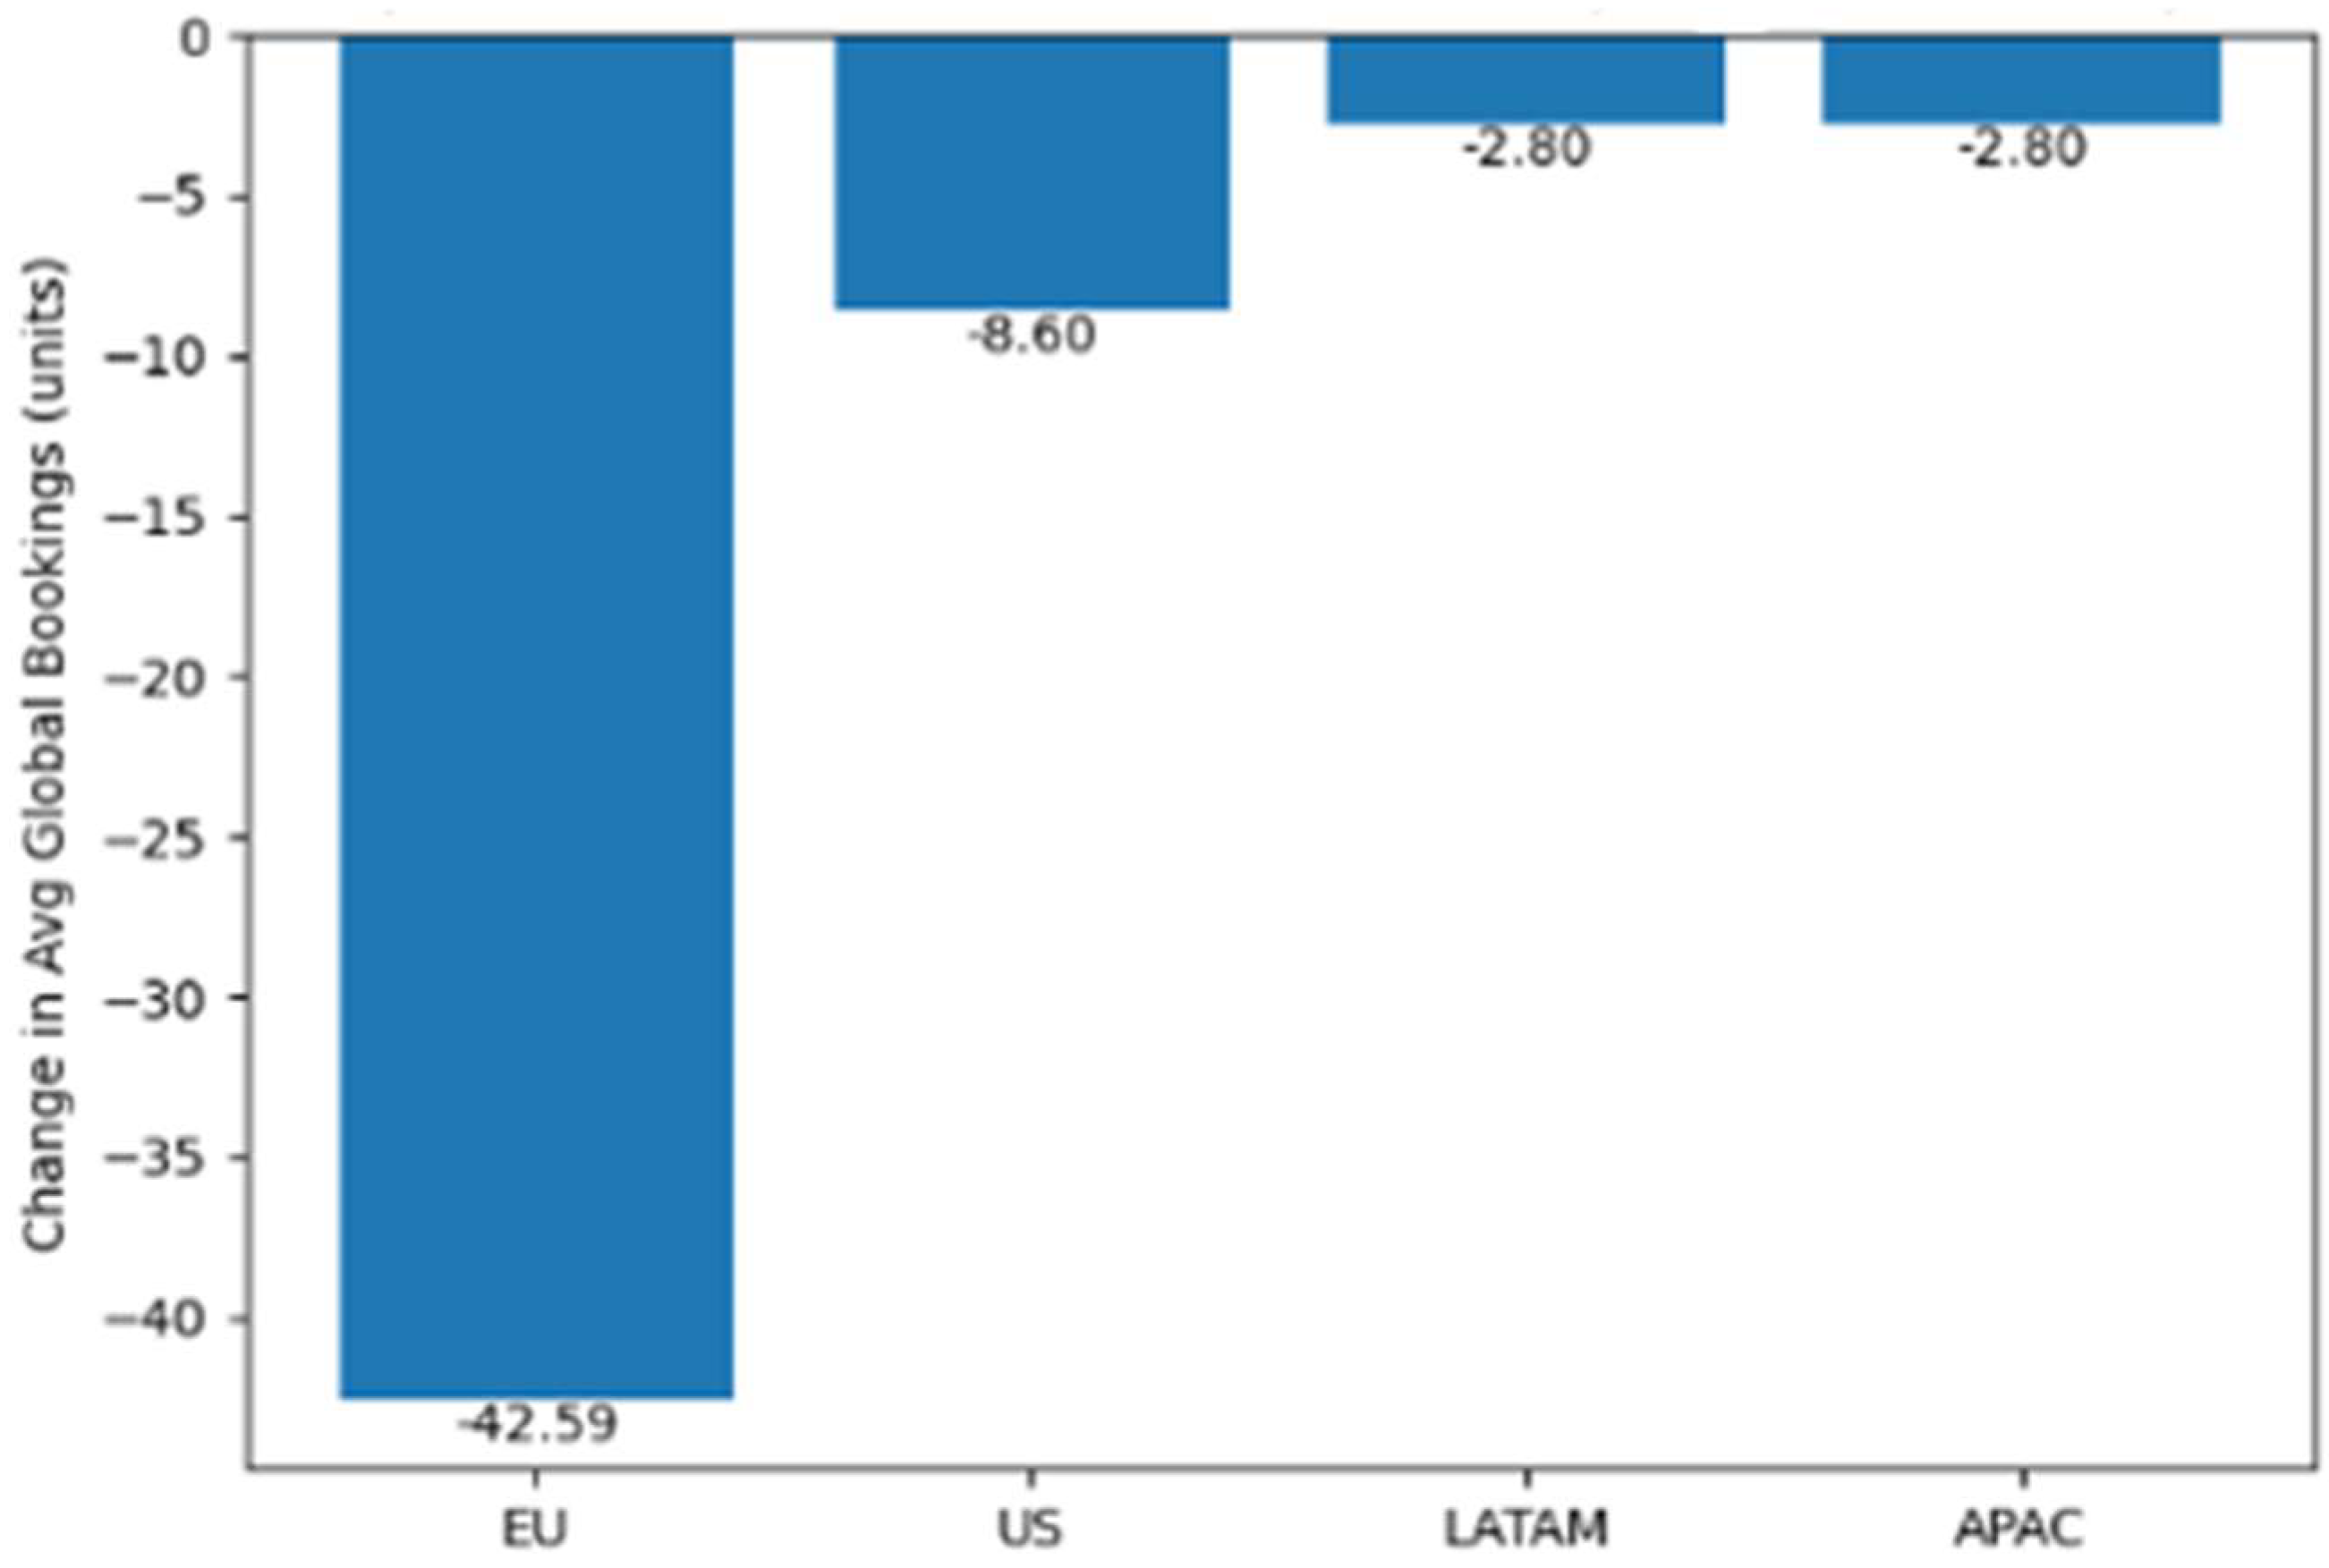
To further analyze the distribution of losses across markets, we decompose the change in global bookings by region. The attribution analysis reveals that Europe accounts for most of the decline, consistent with H3. Specifically, out of the ~57-unit decline in bookings:
  • Europe (EU) contributes −42.6 units (≈74%),
  • United States (US) contributes −8.6 units (≈15%),
  • LATAM contributes −2.8 units (≈5%),
  • APAC contributes −2.8 units (≈5%).
This finding underscores the regional concentration of FX risk and highlights that managerial decisions to raise prices in Europe amplify the very region where the losses are most severe.
Figure 6 illustrates the regional attribution of losses under the combined FX depreciation (−10%) and European price increase (+10%) scenario, averaged over the four-quarter forecast horizon. The results show that the European market accounts for most of the global decline, with an average reduction of −42.6 bookings relative to the baseline. The United States contributes −8.6 bookings, while LATAM and APAC each contribute −2.8 bookings. These values highlight the asymmetrical impact of foreign exchange shocks, with Europe bearing the heaviest burden due to direct exposure, while spillover effects to other regions are smaller but still notable. The figure reinforces the finding that raising prices in Europe amplifies losses in the region most affected by the depreciation, underscoring the importance of accounting for demand elasticity and regional heterogeneity in strategic pricing responses.
Figure 6 illustrates this concentration graphically, showing the relative contributions by region. The sharp dominance of Europe (−42.6 bookings) underscores why managerial interventions targeting price adjustments in this region may exacerbate rather than mitigate losses. The visualization clarifies that spillover effects in the U.S. and emerging markets, though smaller, are non-negligible, suggesting a need for global hedging strategies.

3.6. Summary of Empirical Findings

Together, the results provide clear evidence that:
FX shocks have material negative impact on consolidated financial outcomes (supporting H1).
Managerial interventions that increase prices do not offset these shocks, as regional demand declines in response (supporting H2).
Losses are highly concentrated in Europe, with only minor spillovers to other regions (supporting H3).
From both an academic and managerial standpoint, these findings reinforce the value of AI-based scenario simulation. By quantifying trade-offs and isolating regional contributions, the model provides executives with a structured, data-driven framework for decision-making under uncertainty.

4. Discussion

The findings confirm all three hypotheses and extend prior literature in several ways. First, the confirmation of H1 aligns with prior studies on exchange rate pass-through (Campa & Goldberg, 2005; Gopinath et al., 2010), but extends the analysis into an AI-driven, firm-specific context. Second, the evidence for H2 highlights that managerial heuristics, such as raising prices to offset currency weakness, can be misleading. AI clarifies that such strategies may suppress demand sufficiently to neutralize any accounting gains, echoing broader concerns about the limits of deterministic rules in volatile environments (Miller, 1992). These findings caution that management teams should carefully evaluate demand elasticity before attempting to offset FX-driven revenue declines through price increases. A rapid upward adjustment in local prices may accelerate profit erosion if customers demand contracts more than anticipated. Moreover, in foreign markets, such moves can result in longer-term loss of market share to domestic competitors who maintain stable pricing, particularly if exchange rates rebound. Thus, AI-driven scenario modeling is valuable not only for quantifying immediate trade-offs, but also for highlighting the potential risks of reactive strategies that ignore elasticity and competitive dynamics. Third, H3 demonstrates the regional concentration of FX shocks, reinforcing the need for tailored strategies by geography, rather than global, one-size-fits-all adjustments.
More broadly, this research contributes to the literature on AI in management by showing how AI can serve as a “decision companion” (Shrestha et al., 2019) for executives navigating uncertainty. Rather than prescribing actions, the LSTM forecasts and scenario analyses quantify the trade-offs that executives must consider, surfacing insights that may not be readily apparent through intuition or traditional forecasting techniques. In this sense, AI complements executive judgment by reducing ambiguity and illuminating the structure of complex decisions, while leaving final responsibility with human leaders.
To enhance transparency, we applied SHAP (SHapley Additive exPlanations) to interpret the LSTM’s output. This technique assigns feature-level importance scores to each prediction, enabling executives to identify which macro or firm-specific variables most influenced the forecast. For instance, in periods of sharp euro depreciation, SHAP values highlighted the outsized role of exchange rate inputs relative to DAU growth or price multipliers.
By sitting AI within the executive decision-making process, the study underscores its potential to enhance resilience and agility in global enterprises. While operational uses of AI are now well established (McAfee & Brynjolfsson, 2017; Chui et al., 2018), this research demonstrates its relevance for high-level strategy, particularly in environments characterized by volatility, uncertainty, complexity, and ambiguity (VUCA). In doing so, it lays the groundwork for a new stream of inquiry at the intersection of international business, AI, and executive strategy. While our findings confirm the hypotheses in a digital services context, real-economy firms may experience additional drivers of FX risk, including raw material costs and physical distribution. The framework, however, is adaptable and could be applied to such firms with adjustments for sector-specific variables.

5. Conclusions

This study examined how artificial intelligence (AI) and advanced analytics can support executive decision-making in the context of global market volatility. Using Roblox Corporation as a case study, we developed and implemented an LSTM forecasting model to simulate how bookings respond to foreign exchange shocks and regional price adjustments. The analysis confirmed H1 (euro depreciation reduces profits), H2 (price increases fail to offset losses), and H3 (losses are concentrated in Europe). Specifically, (1) euro depreciation reduces consolidated bookings and profits, (2) raising European prices fails to offset these losses due to demand elasticity, and (3) losses are concentrated in Europe with modest spillovers. Together, these results highlight the limits of managerial heuristics in complex environments and underscore the value of AI-driven scenario analysis as a tool for clarifying strategic trade-offs.
Beyond the specific findings, the project contributes to the literature by reframing AI not as a replacement for executive judgment but as a decision companion that enhances strategic agility. The LSTM model provided empirical clarity on outcomes under different scenarios, enabling executives to weigh financial protection against customer demand more systematically. Importantly, the model also isolated regional contributions, allowing decision-makers to pinpoint where losses occur and where interventions may be most effective. This kind of actionable intelligence strengthens the role of AI in the boardroom, extending its application from operational optimization to enterprise-level strategy.
This study has several limitations. First, it is based on a single case study (Roblox Corporation), which may limit generalizability to other firms, especially those in traditional goods-based industries. Second, the LSTM model relies on modeling assumptions such as fixed elasticity, quarterly aggregation, and simplified scenario levers. Third, hedging practices—common in real-world corporate treasury management—are not incorporated into the simulations. Future research should extend the framework across industries, incorporate additional real-sector variables, and test robustness under alternative forecasting methods (e.g., hybrid ML-econometric models). Cross-industry comparative analyses would further validate the applicability of AI-driven decision support in global enterprises.
Nevertheless, the study represents only an initial step in understanding how AI can inform high-level decisions under global uncertainty. Future research should extend the framework to additional sources of volatility beyond foreign exchange, such as commodity price shocks, supply chain disruptions, or geopolitical crises. Cross-industry applications would help validate the robustness of the approach, while longitudinal studies could assess how executives integrate AI-based insights into decision workflows. Moreover, further exploration of hybrid models that combine machine learning with agent-based simulations could deepen our understanding of how regional dynamics interact in shaping global outcomes.
In conclusion, this research demonstrates that AI-powered forecasting and simulation can sharpen executive decision-making in volatile environments by quantifying risks, clarifying trade-offs, and illuminating regional dynamics. While AI cannot and should not replace human judgment, its integration into strategic decision-making processes offers the potential to enhance resilience and agility in global enterprises. Firms should remain cautious when using price increases to hedge FX depreciation, as misjudging demand elasticity can undermine profitability and market position. As firms confront increasingly complex challenges in the international economy, embedding AI into the C-suite toolkit may prove essential for navigating uncertainty and sustaining competitive advantage.

Author Contributions

Conceptualization: W.L.; methodology: W.L. and G.C.L.; writing—original draft preparation: W.L.; writing—review and editing, W.L. and G.C.L. All authors have read and agreed to the published version of the manuscript.

Funding

This research received no external funding.

Institutional Review Board Statement

Not applicable.

Informed Consent Statement

Not applicable.

Data Availability Statement

The firm-level financial and operational data for Roblox Corporation (bookings, daily active users, engagement hours, and ABPDAU) were obtained from the company’s publicly available quarterly and annual reports filed with the U.S. Securities and Exchange Commission (SEC) and accessible through the EDGAR database, as well as from Roblox’s Investor Relations website. Macroeconomic and foreign exchange indicators (USD/EUR, USD/GBP, USD/BRL, and the broad USD index) were retrieved from the Federal Reserve Bank of St. Louis’s FRED database (https://fred.stlouisfed.org) (accessed on 15 March 2025). Scenario levers (regional price multipliers, viral/policy event flags, and revenue share assumptions) were constructed from public investor disclosures and plausible modeling calibrations, as described in the methodology. Researchers interested in replicating or extending our analysis may obtain these publicly accessible datasets and implement the forecasting and simulation framework using the code and scenario design described herein; processed panel outputs are available from the corresponding author upon reasonable request. All data and the code used to implement the LSTM forecasting model and agent-based modeling (ABM) simulations are available from the corresponding author upon reasonable request.

Acknowledgments

We want to express our sincere gratitude to Daniele Cassese, Professor at the University of Cambridge specializing in network modeling. His guidance was instrumental in helping us develop AI-driven models to analyze international economic network connections, the effects of exchange rate shocks, and the impact of economic factors on business decision-making. The infrastructural support provided by School of Engineering and Applied Science, University of Pennsylvania, and McCombs School of Business, The University of Texas at Austin, in completing this paper is gratefully acknowledged too.

Conflicts of Interest

The authors declare no conflicts of interest.

Abbreviations

The following abbreviations are used in this manuscript:
ABMAgent-Based Modeling
ABPDAUAverage Bookings per Daily Active User
AIArtificial Intelligence
APACAsia-Pacific
CEOChief Executive Officer
DAUDaily Active Users
EUEuropean Union (Europe region in model)
FXForeign Exchange
JRFMJournal of Risk and Financial Management
LATAMLatin America
LSTMLong Short-Term Memory (neural network)
MAEMean Absolute Error
SECU.S. Securities and Exchange Commission
USUnited States
VUCAVolatility, Uncertainty, Complexity, and Ambiguity

Appendix A

Figure A1. Network Diagram. This diagram illustrates global interdependence among regions, with Regions (R) acting as the hub through which shocks and managerial choices cascade into regional and global outcomes.
Jrfm 18 00542 g0a1

References

  1. Ahmad, A., Sayal, A., Johri, M., Wasiq, A., Ahmed, F., & Ali, F. (2024, October 4–6). AI in managing foreign exchange risks in cash management. 2024 5th IEEE Global Conference for Advancement in Technology (GCAT) (pp. 1–6), Bangalore, India. [Google Scholar] [CrossRef]
  2. Bouchetara, M., Zerouti, M., & Zouambi, A. R. (2024). Leveraging artificial intelligence (AI) in public sector financial risk management: Innovations, challenges, and future directions. EDPACS, 69(9), 124–144. [Google Scholar] [CrossRef]
  3. Campa, J. M., & Goldberg, L. S. (2005). Exchange rate pass-through into import prices. Review of Economics and Statistics, 87(4), 679–690. [Google Scholar] [CrossRef]
  4. Choudhary, J., Sharma, H. K., Malik, P., & Majumder, S. (2025). Price forecasting of crude oil using hybrid machine learning models. Journal of Risk and Financial Management, 18(7), 346. [Google Scholar] [CrossRef]
  5. Chui, M., Manyika, J., & Miremadi, M. (2018). What AI can and can’t do (yet) for your business. McKinsey Quarterly, 1, 97–108. Available online: https://www.mckinsey.com (accessed on 15 March 2025).
  6. Davenport, T. H., & Miller, S. (2022). Working with AI: Real stories of human–machine collaboration. MIT Sloan Management Review Press. [Google Scholar]
  7. Federal Reserve Bank of St. Louis. (2025). FRED, federal reserve economic data. Available online: https://fred.stlouisfed.org (accessed on 15 March 2025).
  8. Gopinath, G., Itskhoki, O., & Rigobon, R. (2010). Currency choice and exchange rate pass-through. American Economic Review, 100(1), 304–336. [Google Scholar] [CrossRef]
  9. Hochreiter, S., & Schmidhuber, J. (1997). Long short-term memory. Neural Computation, 9(8), 1735–1780. [Google Scholar] [CrossRef] [PubMed]
  10. Kogut, B. (1985). Designing global strategies: Comparative and competitive value-added chains. Sloan Management Review, 26(4), 15–28. [Google Scholar]
  11. Kong, W. (2025). Evaluating corporate currency risk management practices: A case study of multinational companies and their hedging strategies. In Proceedings of the 2025 5th international conference on enterprise management and economic development (ICEMED 2025) (pp. 58–67). Atlantis Press. [Google Scholar]
  12. Lee, E., & Leeroy, W. (2024). How AI tools can help diagnose market dynamics and curb market power abuse as the nation’s power supply transitions to renewable resources. Energy LJ, 45, 25. [Google Scholar]
  13. Makridakis, S., Spiliotis, E., & Assimakopoulos, V. (2020). The M4 competition: 100,000 time series and 61 forecasting methods. International Journal of Forecasting, 36(1), 54–74. [Google Scholar] [CrossRef]
  14. McAfee, A., & Brynjolfsson, E. (2017). Machine, platform, crowd: Harnessing our digital future. W.W. Norton & Company. [Google Scholar]
  15. Menzies, J., Sabert, B., Hassan, R., & Mensah, P. K. (2024). Artificial intelligence for international business: Its use, challenges, and suggestions for future research and practice. Thunderbird International Business Review, 66(2), 185–200. [Google Scholar] [CrossRef]
  16. Miller, K. D. (1992). A framework for integrated risk management in international business. Journal of International Business Studies, 23(2), 311–331. [Google Scholar] [CrossRef]
  17. Roblox Corporation. (2025). Investor relations. Available online: https://ir.roblox.com (accessed on 15 March 2025).
  18. Shrestha, Y. R., Ben-Menahem, S. M., & von Krogh, G. (2019). Organizational decision-making structures in the age of artificial intelligence. California Management Review, 61(4), 66–83. [Google Scholar] [CrossRef]
  19. Simon, H. A. (1997). Administrative behavior: A study of decision-making processes in administrative organizations (4th ed.). Free Press. [Google Scholar]
  20. Tesfatsion, L. (2006). Agent-based computational economics: A constructive approach to economic theory. In L. Tesfatsion, & K. L. Judd (Eds.), Handbook of computational economics (Vol. 2, pp. 831–880). Elsevier. [Google Scholar] [CrossRef]
  21. U.S. Securities and Exchange Commission. (2025). EDGAR database. Available online: https://www.sec.gov/edgar.shtml (accessed on 15 March 2025).
  22. Vestergaard, C. L., Génois, M., & Barrat, A. (2014). How memory generates heterogeneous dynamics in temporal networks. Physical Review E, 90, 042805. [Google Scholar] [CrossRef] [PubMed]
  23. Vyas, A. (2025, April 21). Revolutionizing risk: The role of artificial intelligence in financial risk management, forecasting, and global implementation [Working paper]. SSRN. [Google Scholar] [CrossRef]
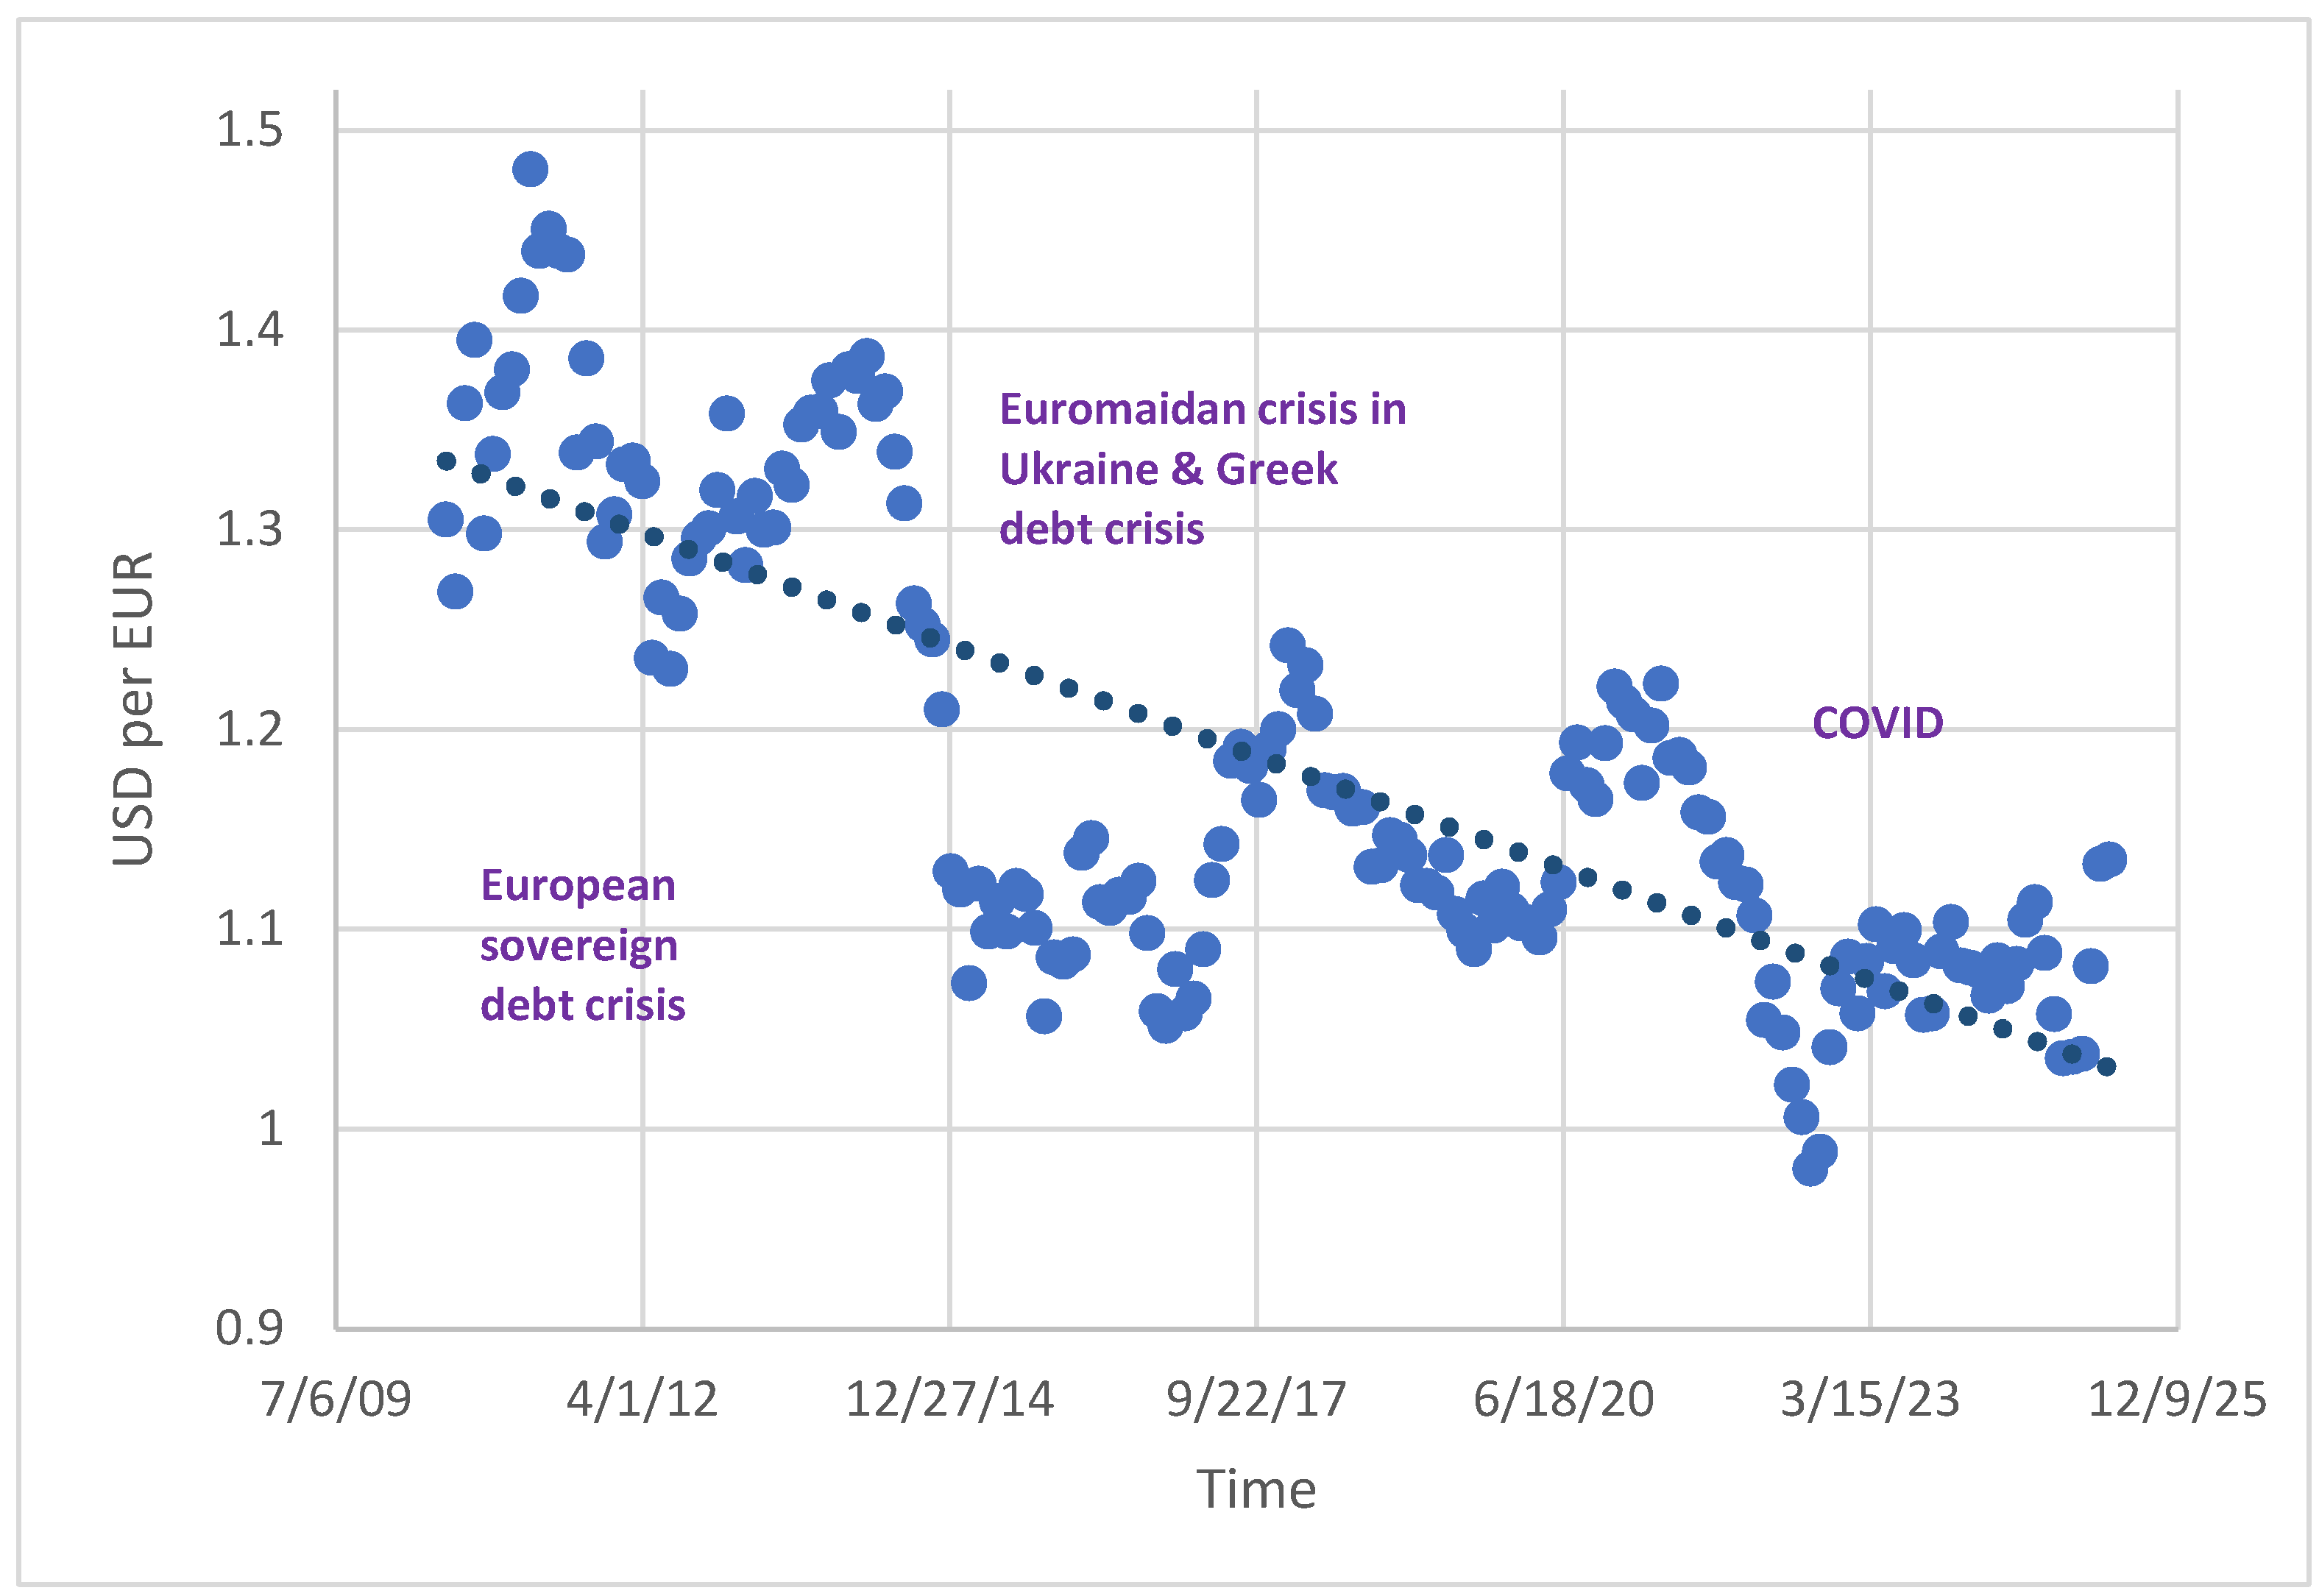
Figure 1. Euro to U.S. Dollar Exchange Rate Trend: 2010–2025. This figure shows the historical exchange rate between the Euro (EUR) and the U.S. Dollar (USD) from July 2010 to December 2025. Each point represents the daily EUR/USD rate, highlighting long-term depreciation of the Euro and periods of sharp volatility.
Jrfm 18 00542 g001
Figure 2. Architecture of a Long Short-Term Memory (LSTM) unit. This figure illustrates the main components of an LSTM: the input gate, output gate, and forget gate, along with the Tanh activation function.
Jrfm 18 00542 g002
Figure 3. (a) Actual vs. Predicted Quarterly Bookings (Validation Set, units in millions USD-equivalent). This figure plots actual bookings (solid blue line) against LSTM-predicted bookings (dashed orange line) across the validation horizon. The close alignment of the two curves illustrates the model’s ability to capture underlying dynamics with minimal deviation; (b) Baseline Quarterly Forecast for Bookings and Profit. This figure shows baseline profit compared with profits under a 10% EUR depreciation. The baseline shows steady growth, while the FX-only shock results in a quarter-by-quarter decline of approximately 6%. (b) provides both bookings and profit projections. By showing profits as 30% of bookings, the figure allows executives to directly assess financial consequences under baseline conditions.
Jrfm 18 00542 g003
Figure 4. Profit Forecast under Baseline vs. FX-only Shock. This figure compares profits across three scenarios: Baseline, FX-only shock, and FX+Price increase. Both shocks produce nearly identical declines of about 6%, underscoring the limited effect of raising European prices.
Jrfm 18 00542 g004
Figure 5. Profit Forecast under Baseline, FX-only, and FX+Price Scenarios. This figure shows the attribution of losses under the combined FX depreciation and EU price increase scenario. Europe accounts for ~74% of the decline, with smaller contributions from the US (15%), LATAM (5%), and APAC (5%).
Jrfm 18 00542 g005
Figure 6. Regional Contributions to Global Bookings Decline. This figure decomposes total global booking losses under the combined FX depreciation (−10%) and European price increase (+10%) scenario. Europe accounts for ~74% of total losses, with US (15%), LATAM (5%), and APAC (5%). This detailed breakdown highlights the asymmetry of FX risk exposure across regions and underscores the importance of tailoring strategies by geography.
Jrfm 18 00542 g006
Table 1. LSTM model architecture and parameter values.
a. LSTM model architecture
ParameterValue
Dimension of Input Layer6 (lookback = 6 quarters) × 16 features
Dimension of Output Layer1 (one-step-ahead prediction, recursive for 4 quarters)
Hidden Dimension for LSTM64 units
Dense Hidden Layer32 units, ReLU activation
Final Output Layer1 unit (scalar bookings forecast)
Activation Function (LSTM)Tanh (with sigmoid gates internally)
Loss FunctionMAE (Mean Absolute Error)
OptimizerAdam (adaptive learning rates)
Learning RateDefault (0.001 in TensorFlow/Keras)
b. LSTM Parameter Calculation Summary
Layer (Type)Output ShapeTrainable Params
LSTM (64 units)(None, 64)20,736
Dense (32 units)(None, 32)2080
Dense (1 unit)(None, 1)33
Non-trainable0
Note: (a) and (b) reports the LSTM model architecture and parameter values.
Table 2. LSTM Input Features and Model Performance.
a. Input Features
FeatureDescriptionSourceNotes/Interpretation
BookingsQuarterly gross bookings (Robux)Roblox SEC filings (10-Q, 10-K) *Firm-specific dependent variable
DAUDaily active usersRoblox Investor RelationsProxy for platform engagement
Engagement HoursTotal user hours spentRoblox IR reports **Measures intensity of usage
ABPDAUAvg. bookings per DAURoblox IR reportsRevenue per user metric
USD/EURUSD to Euro exchange rateFRED ***FX driver
USD/GBPUSD to Pound exchange rateFREDFX driver
USD/BRLUSD to Real exchange rateFREDFX driver
USD IndexBroad trade-weighted USDFREDMacro control
EU Revenue Share% revenue from EuropeRoblox IR reportsRegional exposure
US Revenue Share% revenue from U.S.Roblox IR reportsRegional exposure
LATAM Revenue Share% revenue from LATAMRoblox IR reportsRegional exposure
APAC Revenue Share% revenue from APACRoblox IR reportsRegional exposure
Viral Event FlagBinary shock (1 = major viral growth)ConstructedCalibrated via historical user spikes
Policy Shock FlagBinary shock (1 = regulatory/policy change)ConstructedCalibrated to events (e.g., EU tax)
Regional Price MultiplierAdjustment factor (baseline = 1.0)Scenario designSimulates ±% price changes
Engagement Growth Rate% change in engagement hours QoQRoblox IR reportsControl for platform dynamics
b. Model Performance
MetricValueInterpretation
Training samples50Number of sequences used to train the model.
Validation samples8Number of sequences reserved for testing model accuracy
Validation loss (MAE)0.393A low error indicates that forecasts are close to the actual bookings
Note: Table 2a * (U.S. Securities and Exchange Commission, 2025), ** (Roblox Corporation, 2025) and *** (Federal Reserve Bank of St. Louis, 2025). Table 2b summarizes the key performance statistics for the model.
Table 3. Average Quarterly Bookings and Profits under Baseline and Shock Scenarios.
ScenarioAvg. BookingsΔ vs. BaselineAvg. Profit ($M)Δ vs. Baseline ($M, %)
Baseline1127-338-
FX-only shock (EUR −10%)105670.5317−21.1 (−6.2%)
FX + EU Price Increase (+10%)105770.0317−21.0 (−6.2%)
Note: Table 3 reports the average quarterly bookings and profits for Roblox Corporation under three scenarios. Parentheses show the percentage decline relative to the baseline. As Table 3 and Figure 4 display, a baseline forecast with no shocks, a 10% depreciation of the euro relative to the U.S. dollar (FX-only shock), and a combined case where management increases European prices by 10% following the same depreciation. The results show that euro depreciation reduces consolidated bookings by about 6% and profits by approximately $21 million per quarter. Price increases in Europe fail to recover profitability because demand contraction offsets any accounting gains, underscoring the importance of demand elasticity in FX-driven pricing decisions.
Disclaimer/Publisher’s Note: The statements, opinions and data contained in all publications are solely those of the individual author(s) and contributor(s) and not of MDPI and/or the editor(s). MDPI and/or the editor(s) disclaim responsibility for any injury to people or property resulting from any ideas, methods, instructions or products referred to in the content.