Financial Risk, Debt, and Efficiency in Indonesia’s Construction Industry: A Comparative Study of SOEs and Private Companies
Abstract
1. Introduction
2. Literature Review
3. Data Sources and Methods
3.1. Data and Research Variables
3.2. Financial Ratio Analysis
- Liquidity ratio: Measures a company’s ability to meet its short-term obligations. This ratio is essential to assess the health of the company’s liquidity and ensure it has enough current assets to cover its current liabilities. The liquidity ratio proxies in this study are the quick and current ratios;
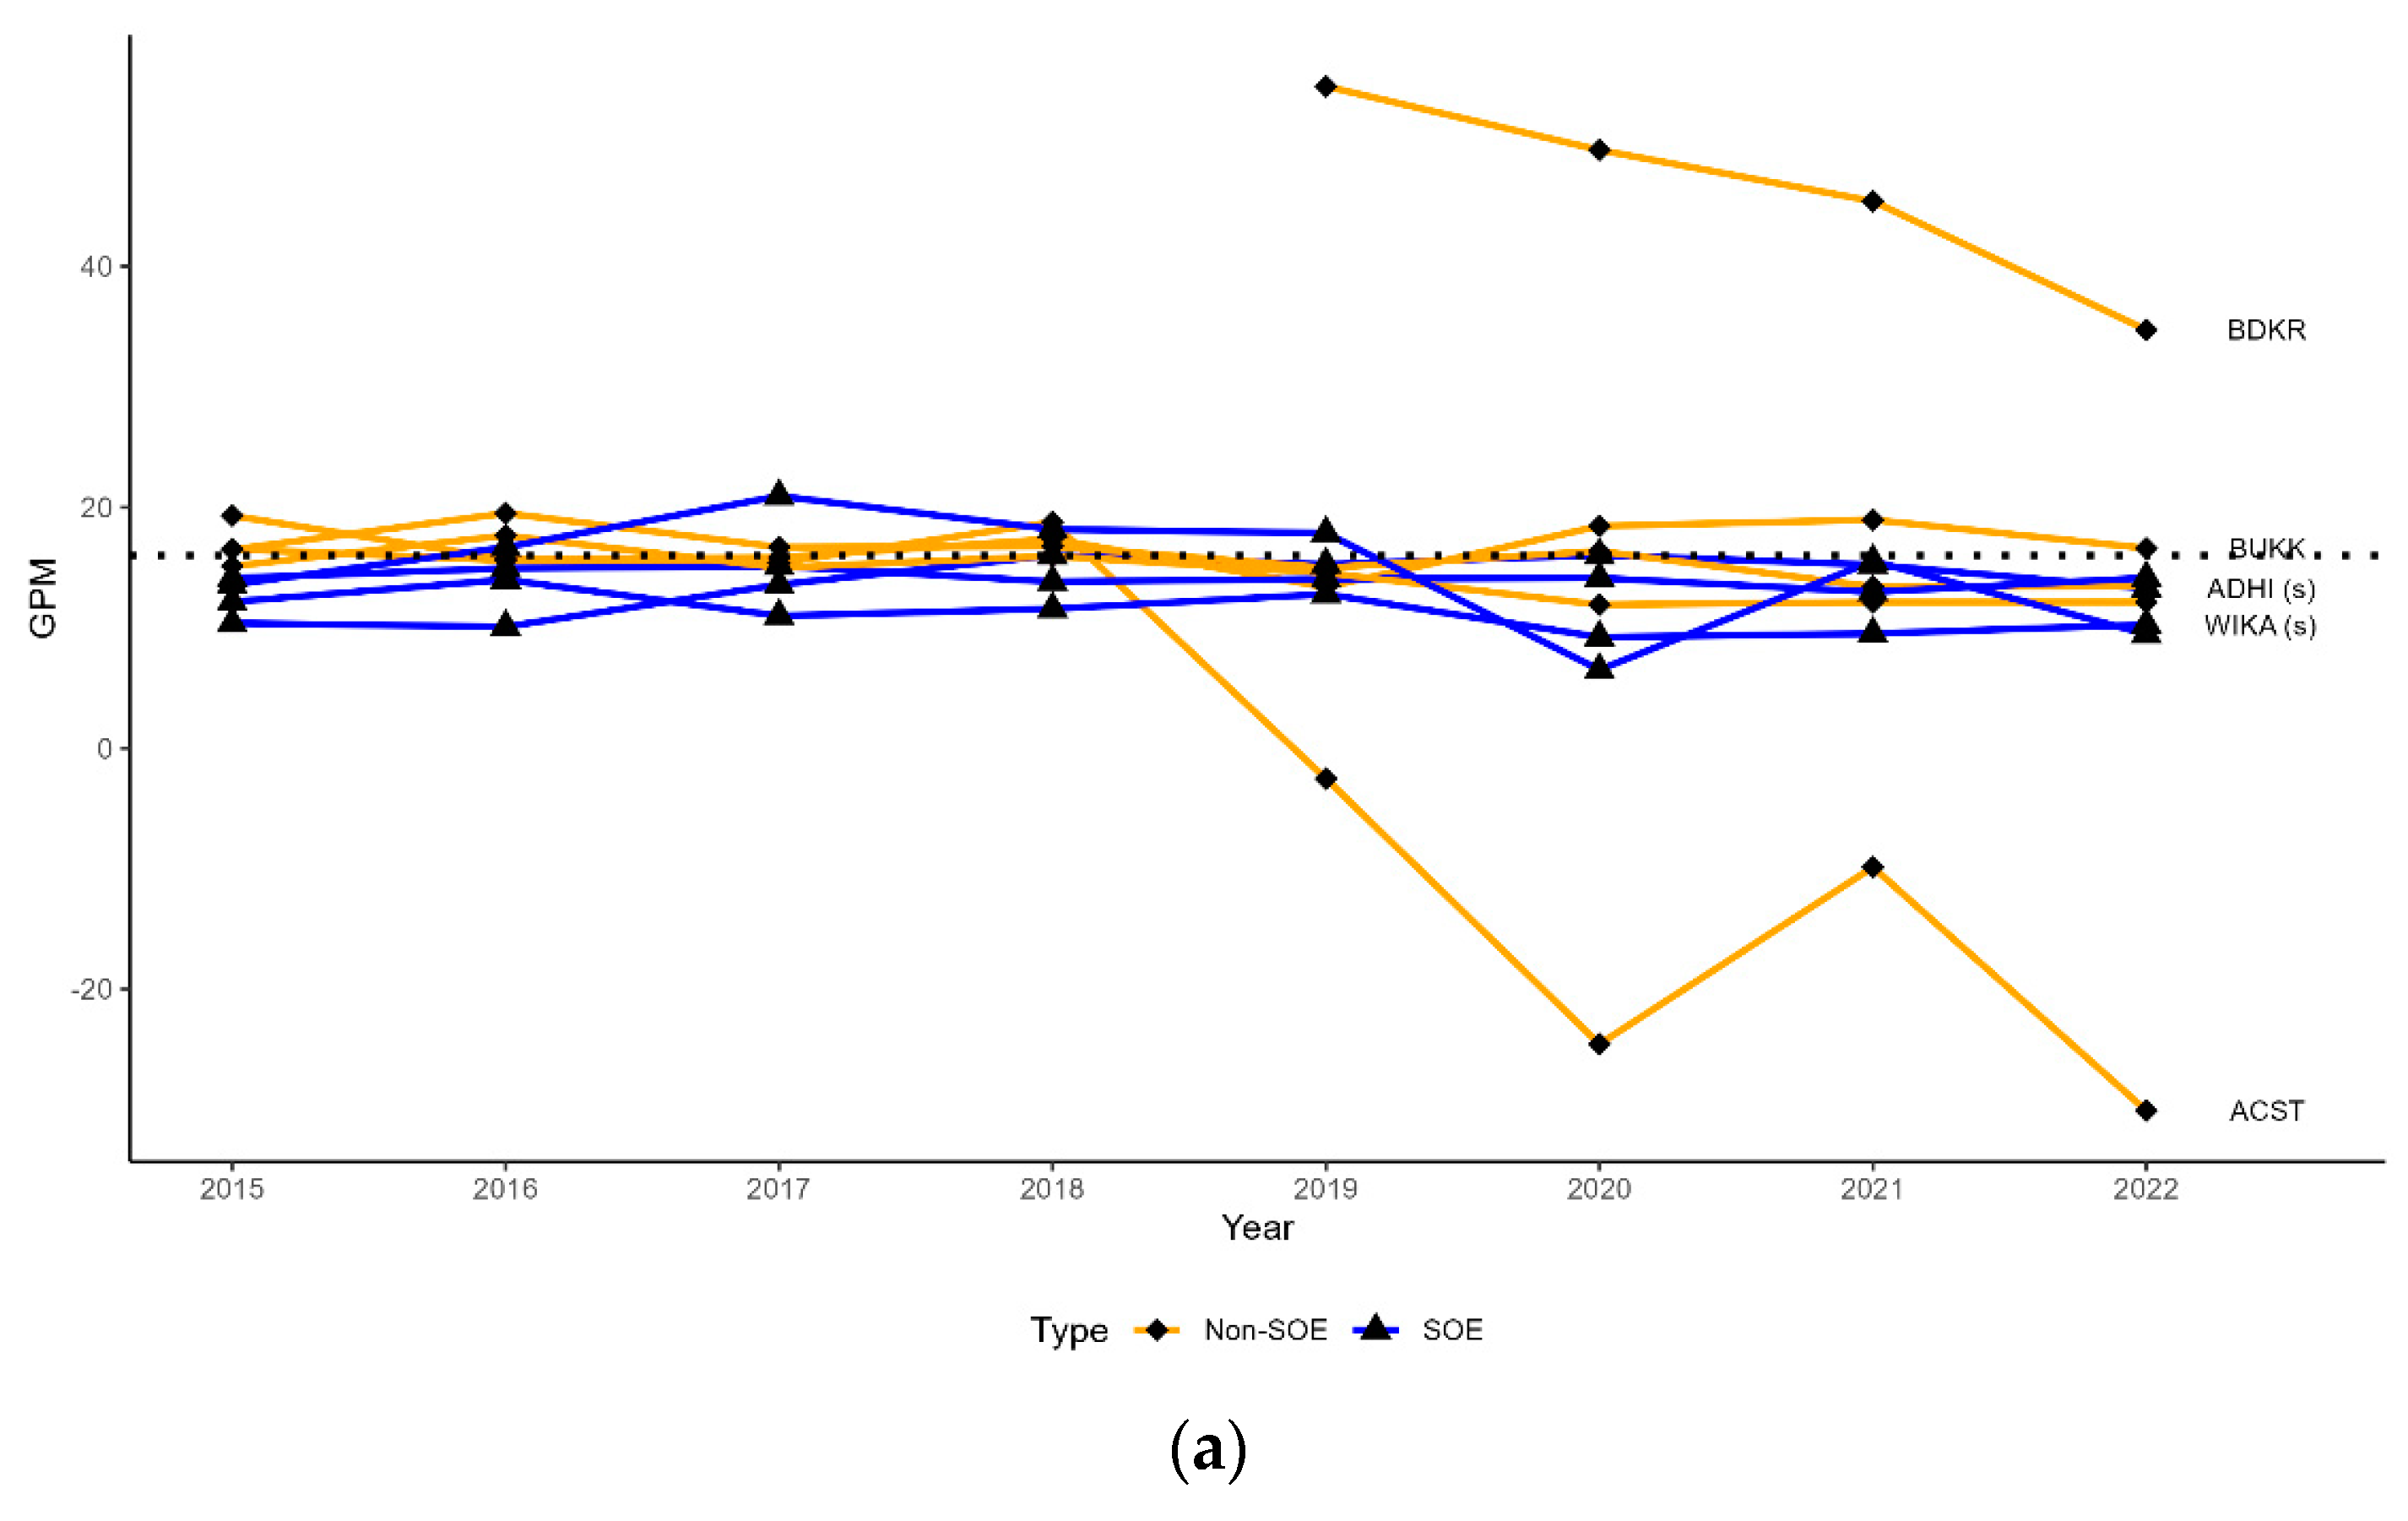
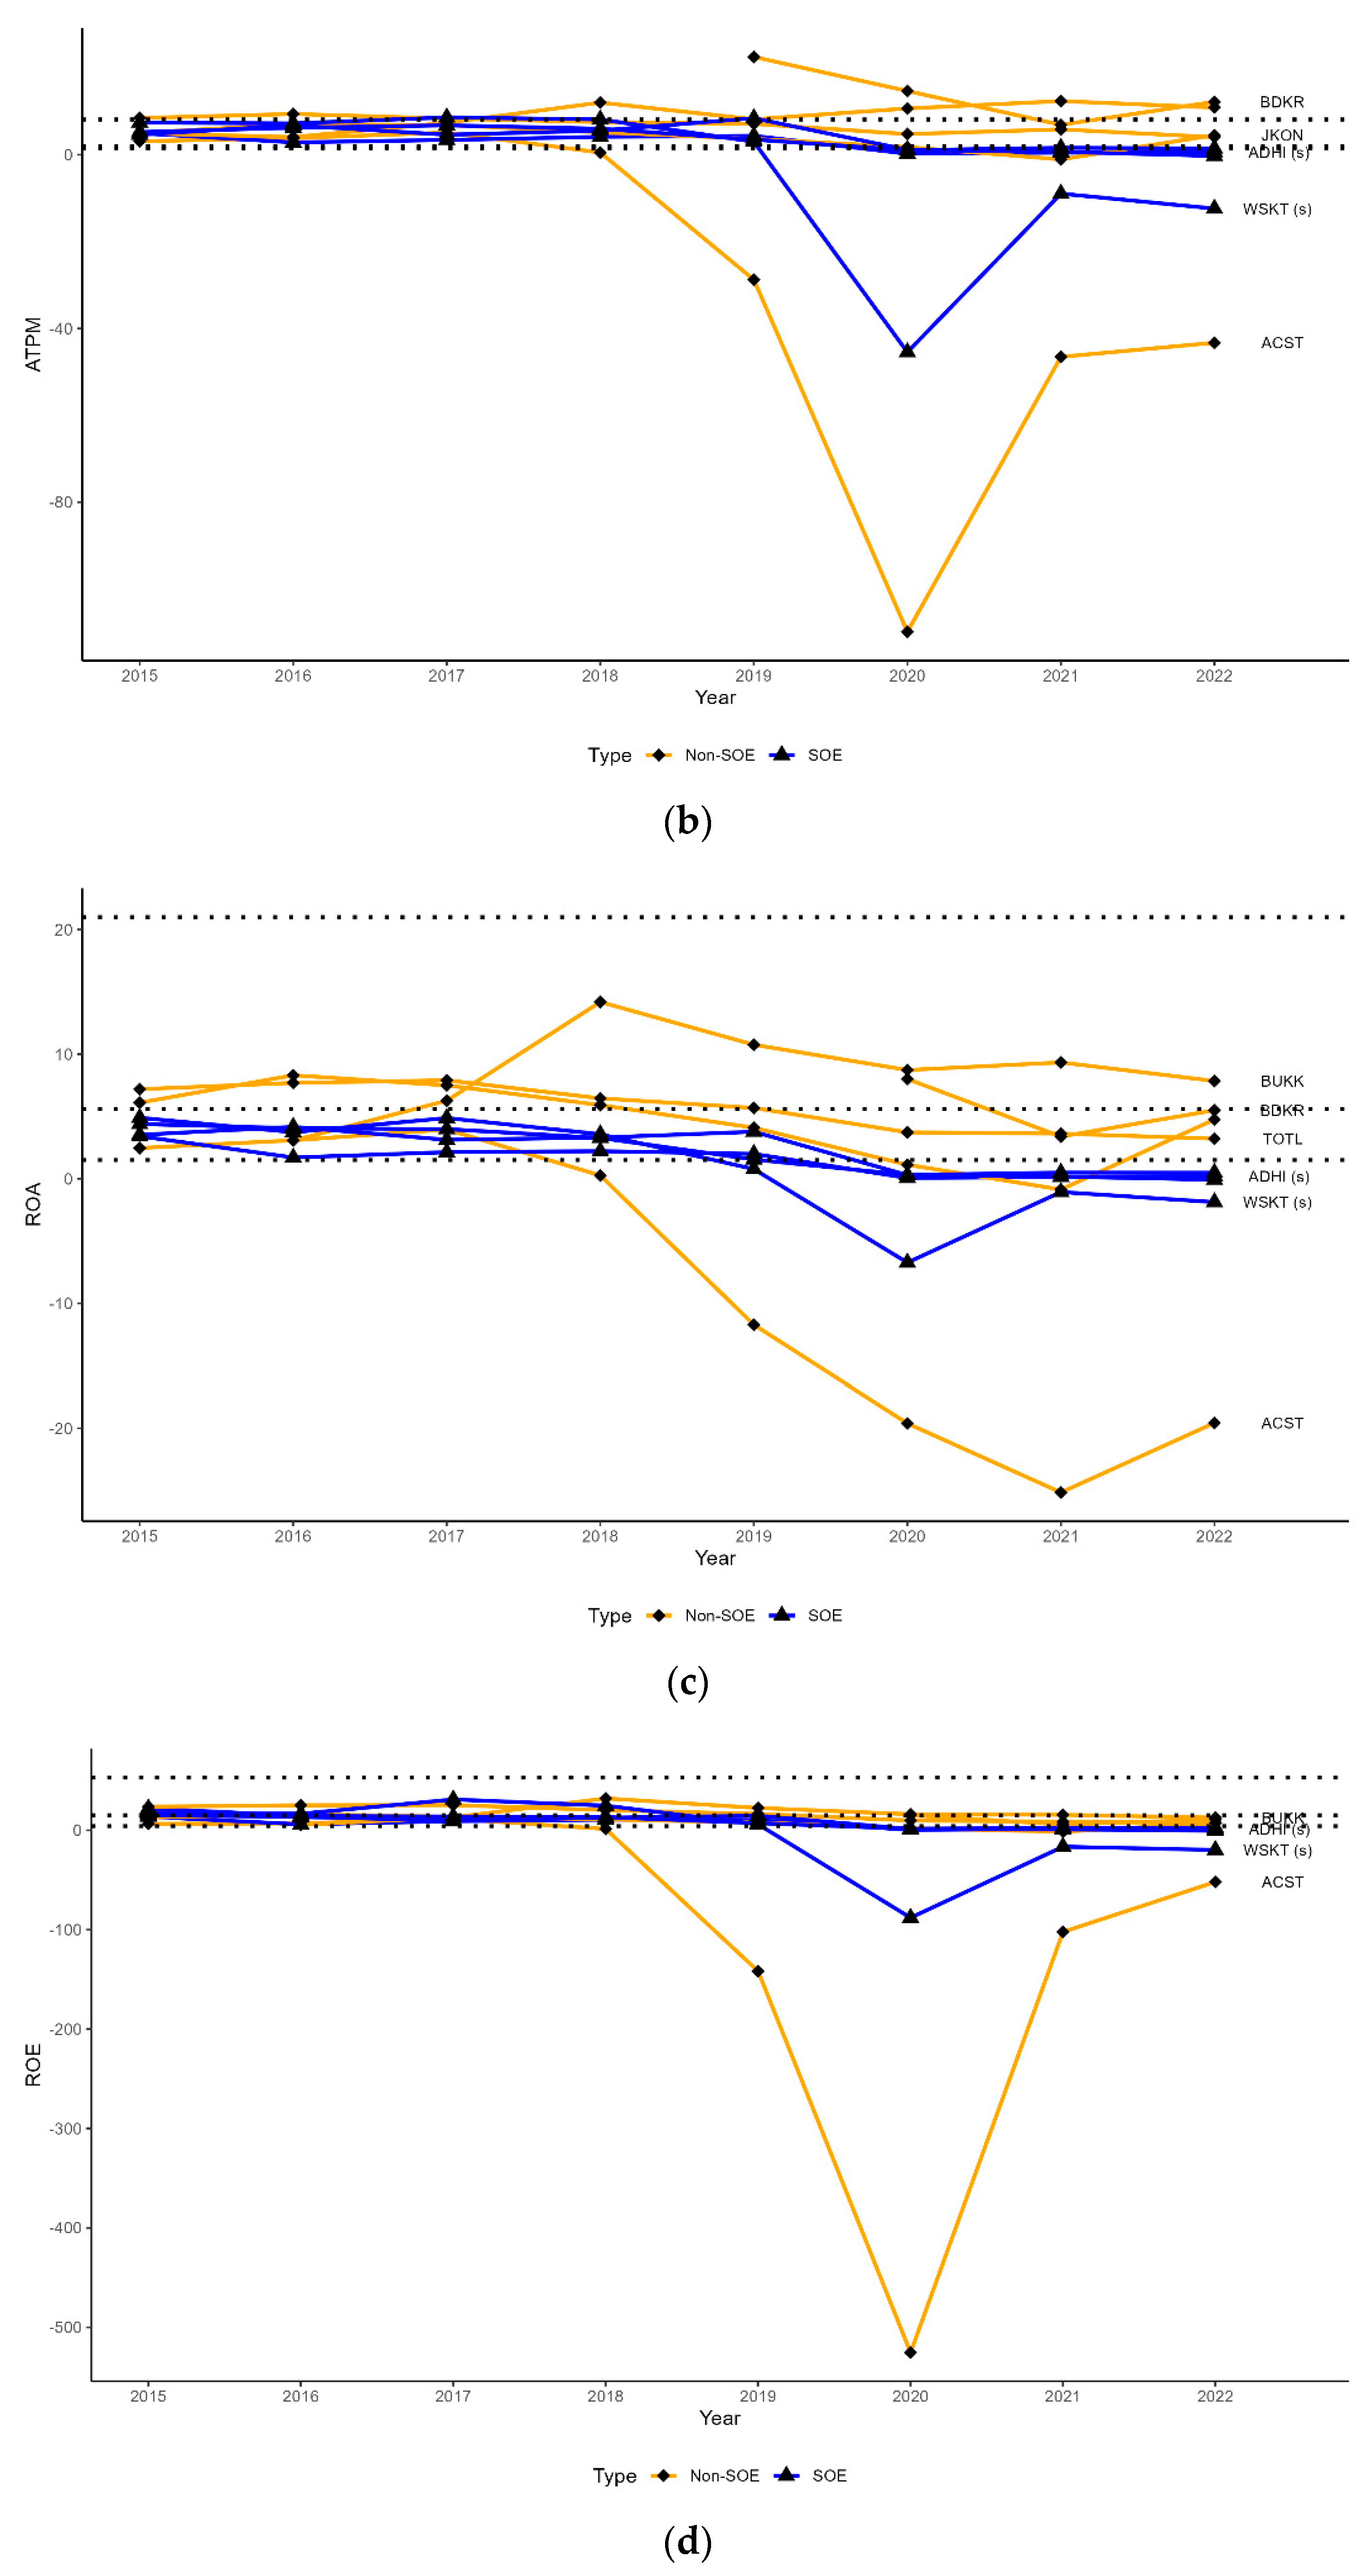
- Profitability ratios: Assess a company’s ability to generate profits relative to its sales, assets, and equity. This ratio measures operational efficiency and the company’s ability to provide profits to shareholders. The profitability ratio proxies in this study are gross profit margin (GPM), asset turnover (ATPM), return on assets, and return on equity (ROE);
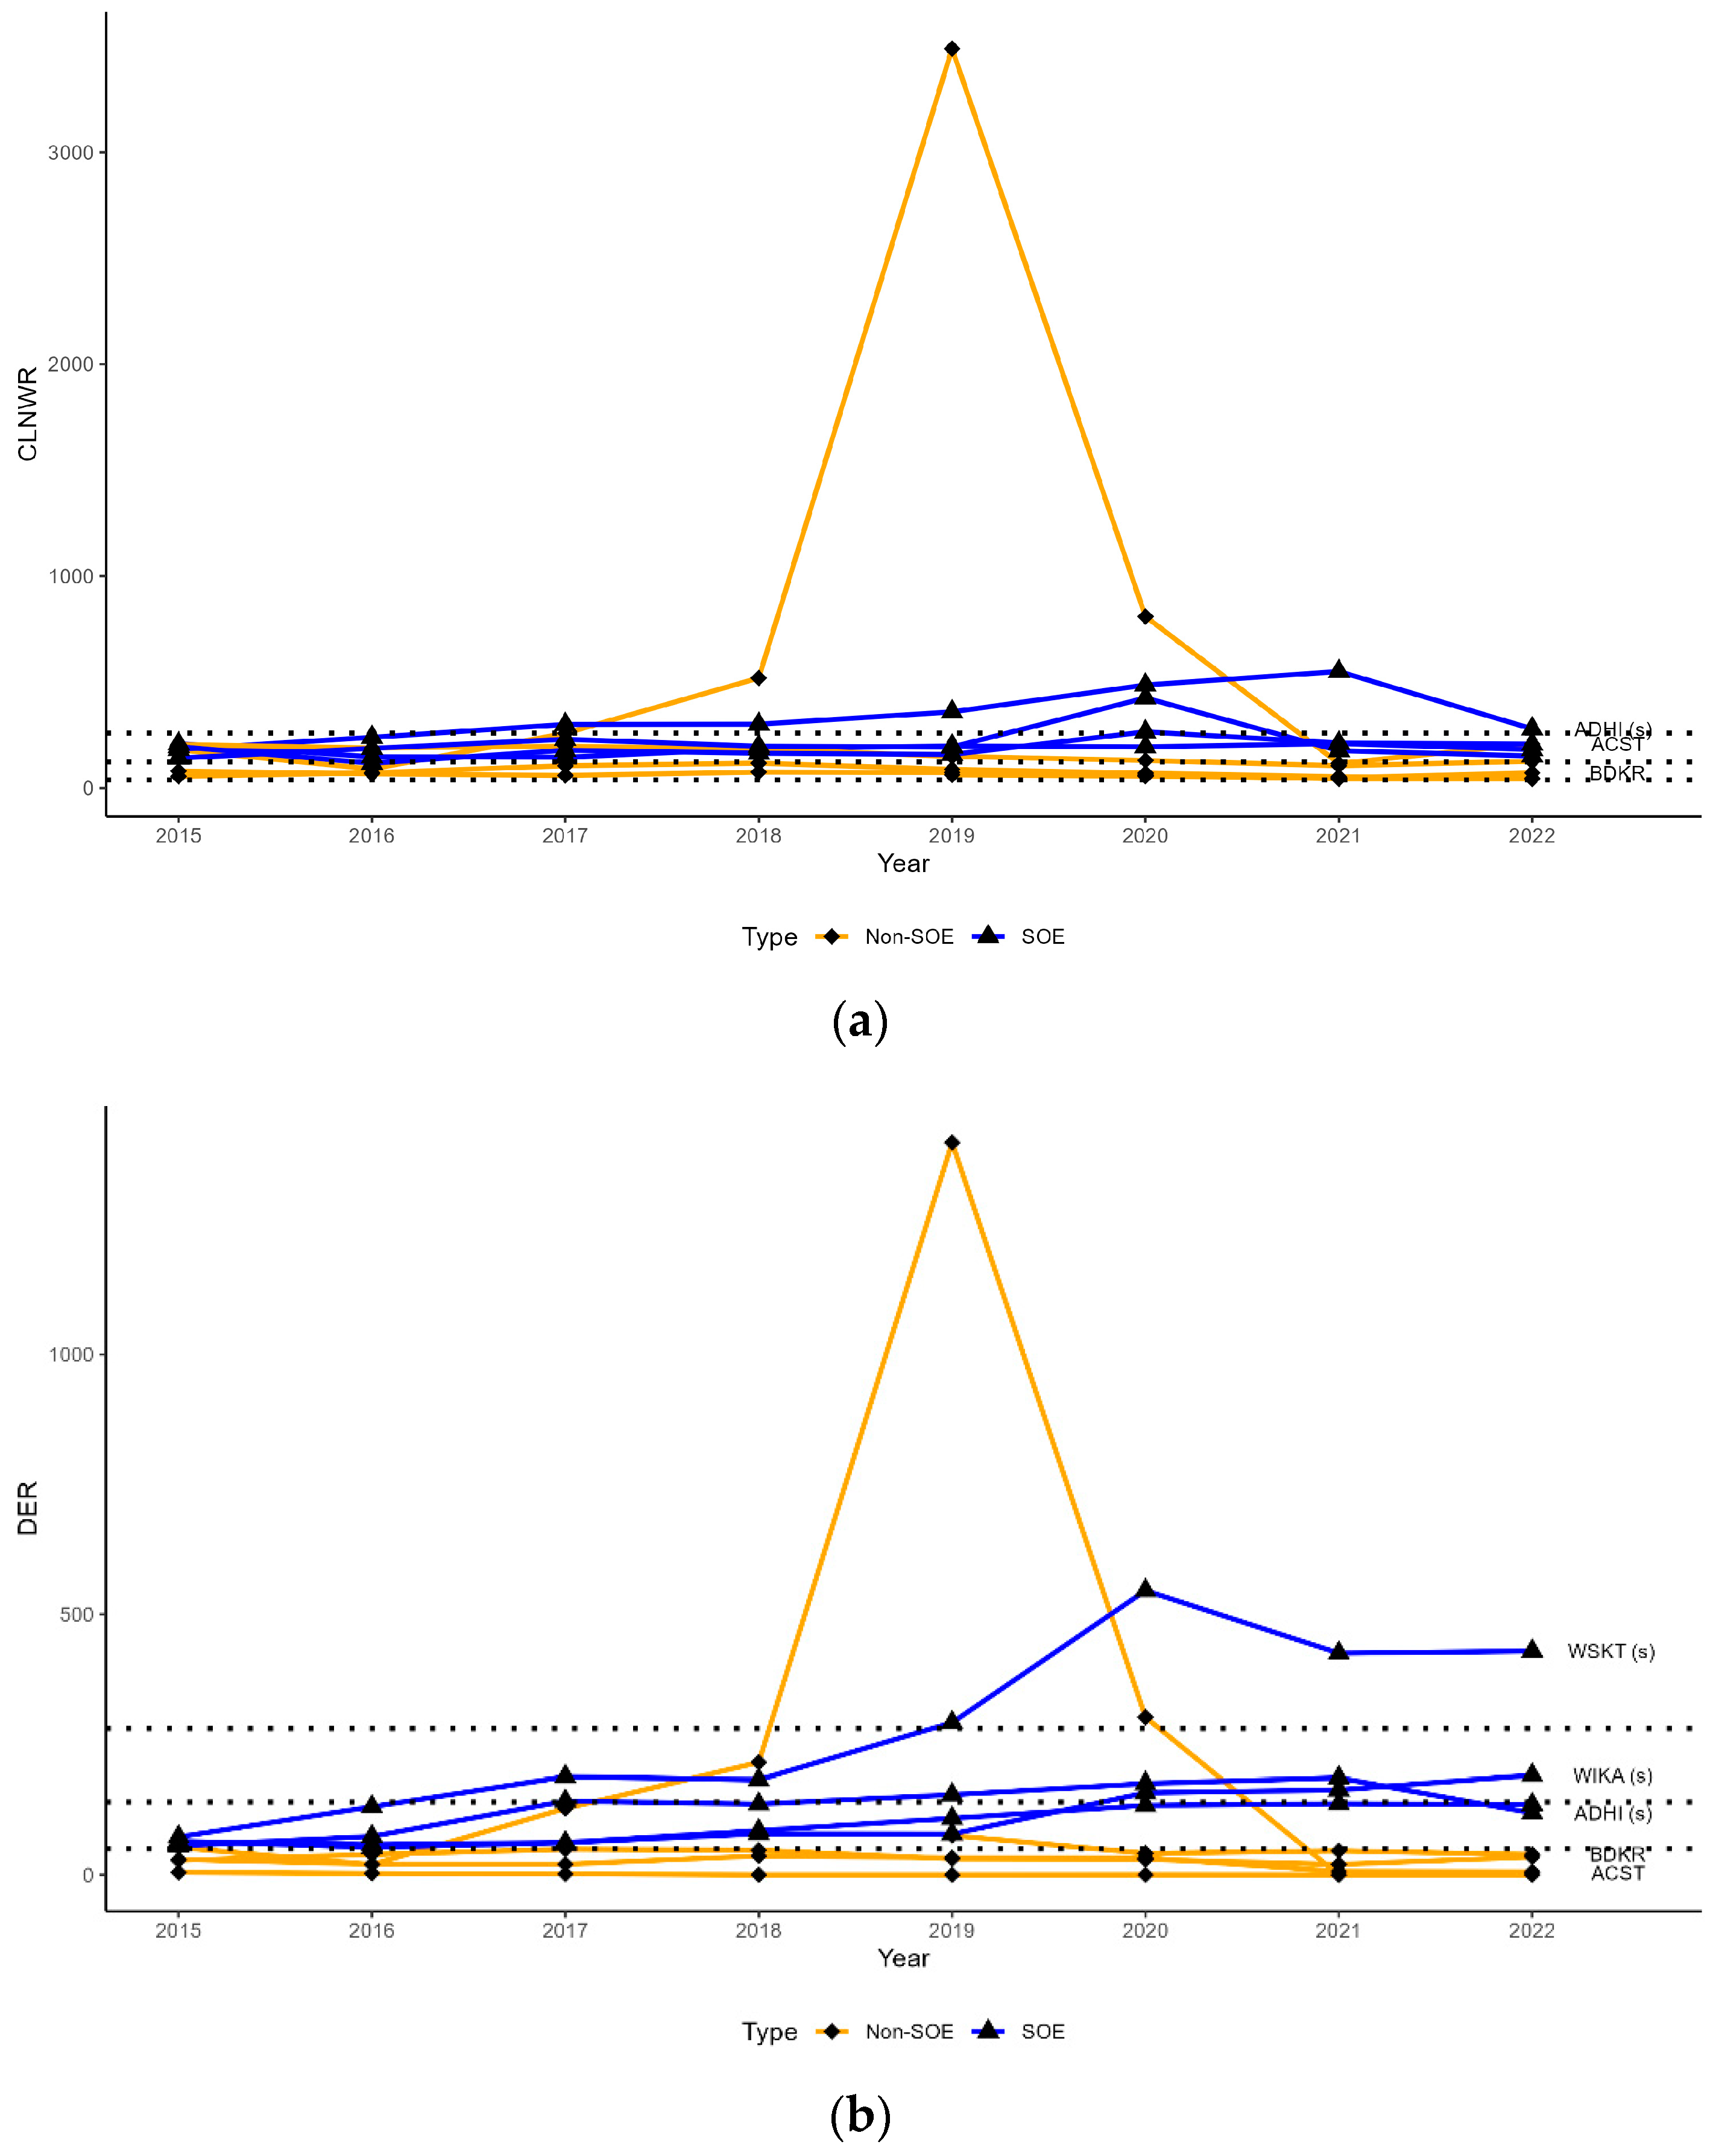
- Debt or leverage ratio: This ratio measures a company’s capital structure, specifically how much it relies on debt to fund its assets. Understanding this ratio is essential to understanding financial risk and the company’s ability to manage its long-term obligations. The debt ratio proxies in this study are current-liabilities-to-net-worth ratio (CLNWR), debt-to-equity ratio (DER), and accounts-payable-to-receivables ratio (APRR).
3.3. Efficiency Analysis
- CCR (Charnes–Cooper–Rhodes) Model: The basic DEA model that assumes Constant Return to Scale (CRS) (Charnes et al. 1978). This model is suitable when the scale of DMU operations does not affect efficiency, i.e., proportional input changes will result in proportional output changes. Assuming CRS, the CCR model calculates overall technical efficiency;
- BCC (Banker–Charnes–Cooper) Model: A model that assumes Variable Return to Scale (VRS) (Banker et al. 1984). This model is used when the scale of DMU operations affects efficiency, i.e., proportional input changes do not necessarily result in proportional output changes. The BCC model makes it possible to measure pure technical efficiency by considering different scales of operation.
- is the efficiency score sought;
- is the sum of the i-th input of DMU j;
- is the sum of the rth output of DMU j;
- and is the sum of the i-th input and r-th output of the evaluated DMU;
- is a decision variable that shows the relative weight of DMU j.
- Hypothesis:
- Null Hypothesis (H0): There is no difference in average efficiency between state-owned and private construction companies;
- Alternative Hypothesis (H1): There is a difference in average efficiency between state-owned and private construction companies;
- The t-test formula:where the variables represent the following:
- is the average difference of the sample pairs;
- is the standard deviation of the difference of the sample pairs;
- n is the number of sample pairs;
- Test Decision:
- If the calculated t value exceeds the critical t value, reject H0;
- If the calculated t value is less than or equal to the critical t value, fail to reject H0.
4. Research Results
4.1. Liquidity Ratio
4.2. Profitability Ratio
4.3. Leverage Ratio
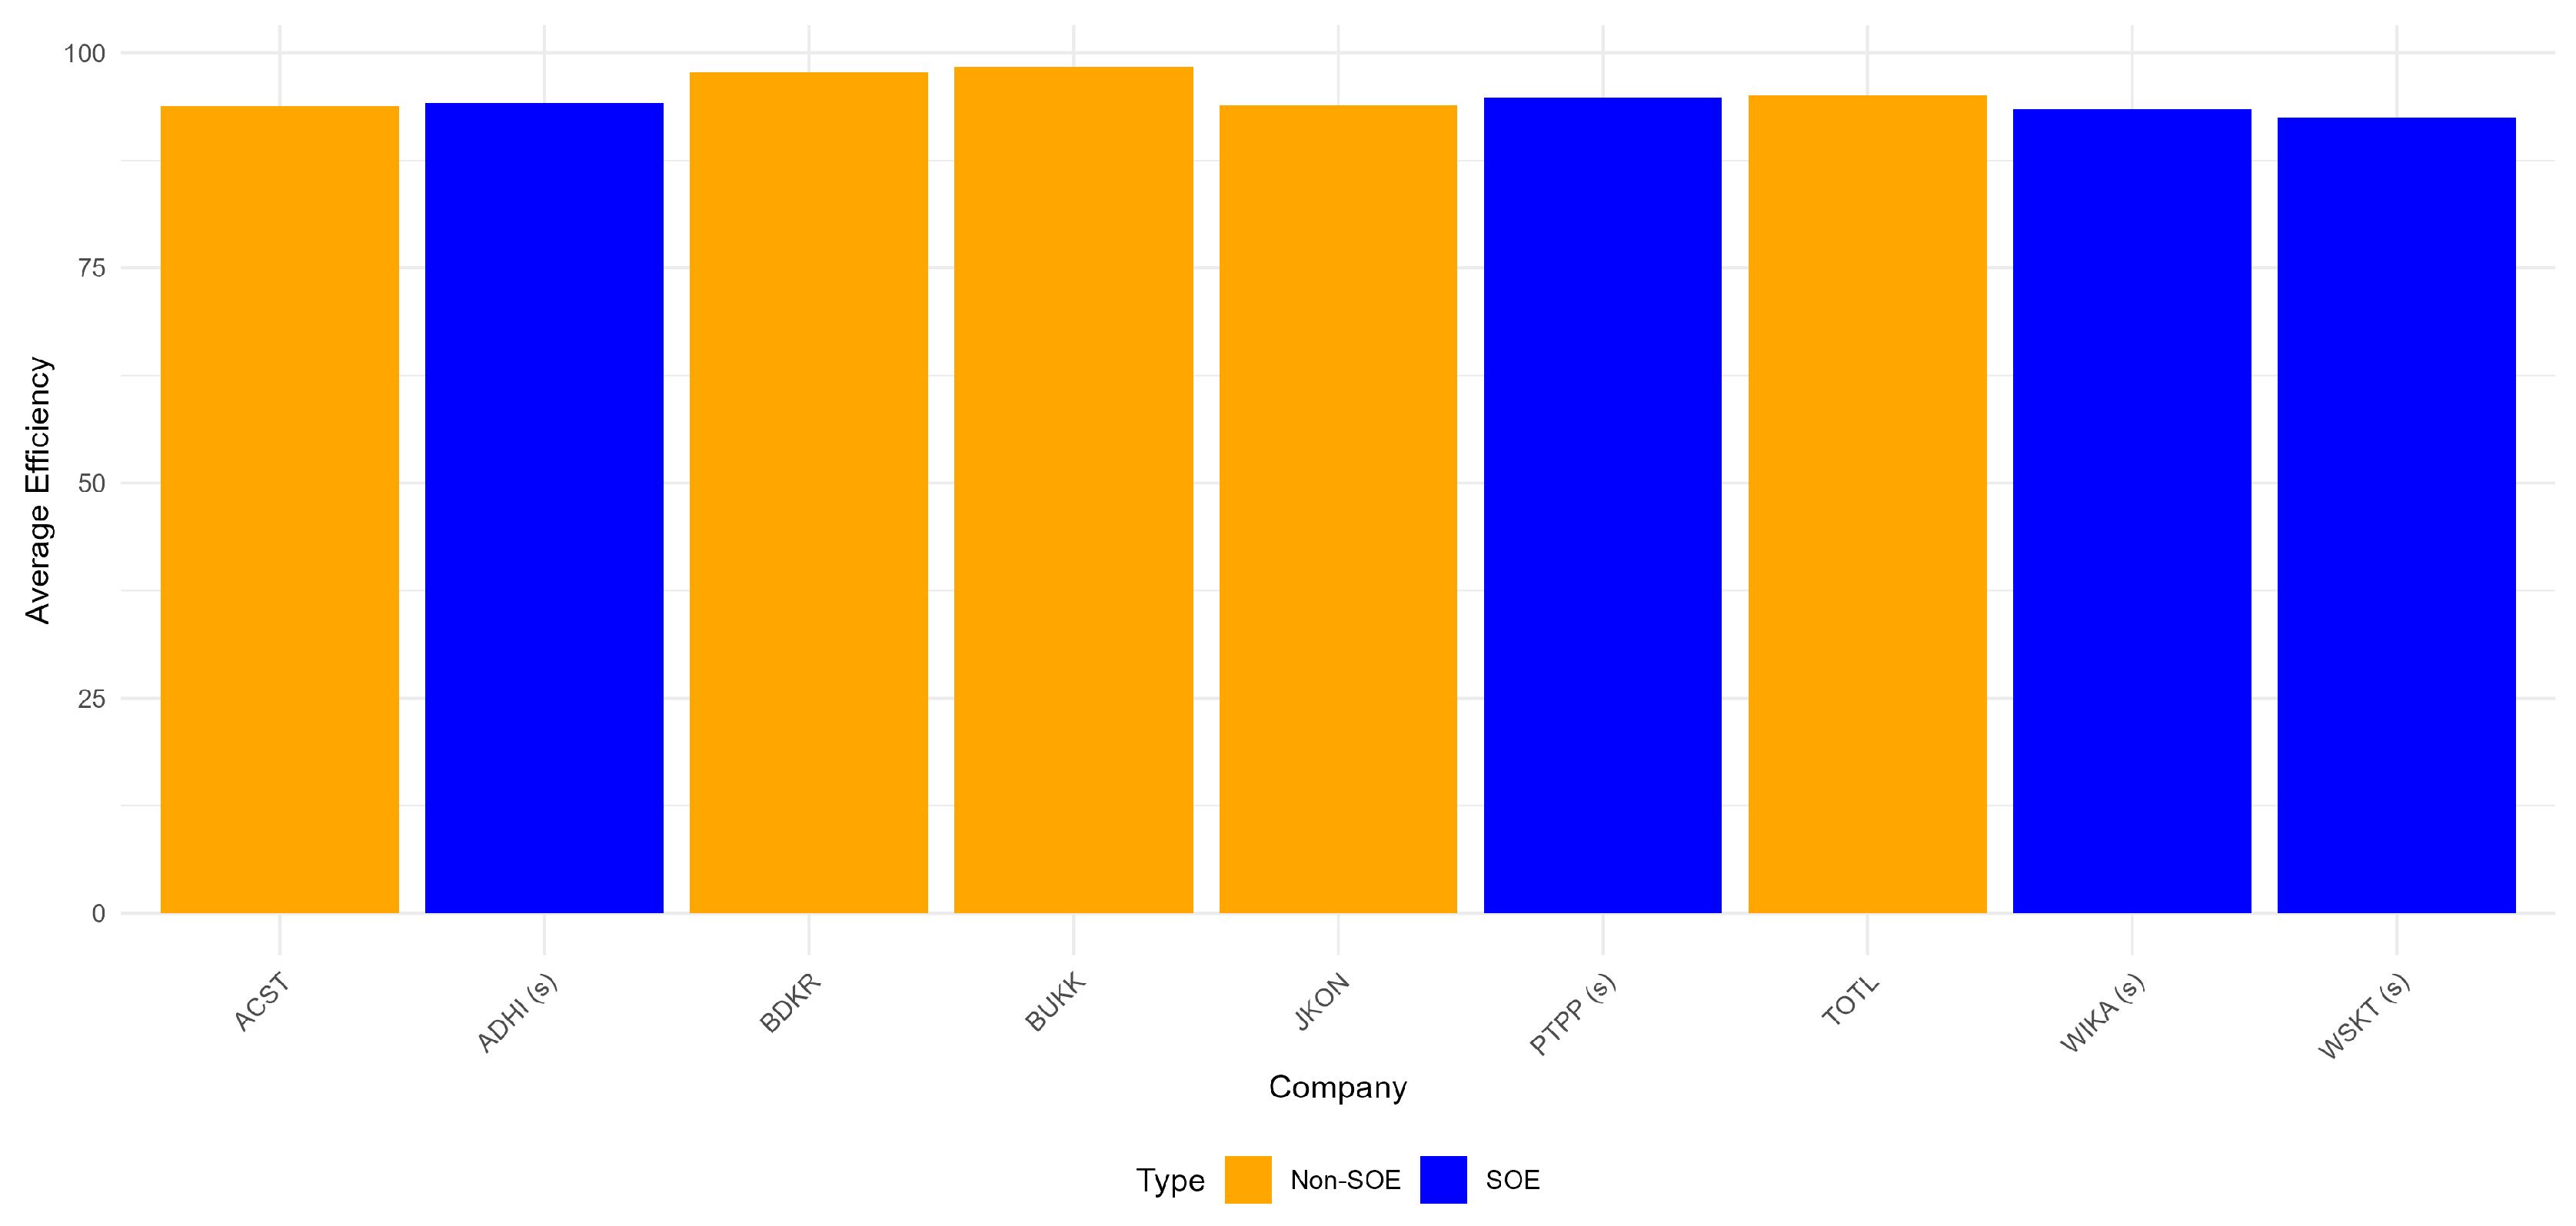
4.4. Efficiency Analysis with DEA
5. Discussion
6. Conclusions
Author Contributions
Funding
Data Availability Statement
Conflicts of Interest
Appendix A
| No. | Variables |
|---|---|
| Financial Ratio Variables | |
| 1. | Quick Ratio (QR) |
| 2. | Current Ratio (CR) |
| 3. | Gross Profit Margin (GPM) |
| 4. | After Tax Profit Margin Ratio (ATPM) |
| 5. | Return on Asset (ROA) |
| 6. | Return on Equity (ROE) |
| 7. | Current-Liabilities-to-Net-Worth Ratio (CLNWR) |
| 8. | Debt-to-Equity Ratio (DER) |
| 9. | Accounts-Payable-to-Revenue Ratio (APRR) |
| Input-Output Variables | |
| 1. | Revenue (Output) |
| 2. | Operating Expenses (Input) |
| 3. | Cost of Revenue (Input) |
| 4. | Total Assets (Input) |
Appendix B
| Company | Description |
|---|---|
| ACST | PT Acset Indonusa Tbk |
| ADHI(s) | PT Adhi Karya (Persero) Tbk |
| BDKR | PT Berdikari Pondasi Perkasa Tbk |
| BUKK | PT Bukaka Teknik Utama Tbk |
| JKON | PT Jaya Konstruksi Manggala Pratama Tbk |
| PTPP(s) | PT Housing Development (Persero) Tbk |
| TOTL | PT Total Bangun Persada Tbk |
| WIKA(s) | PT Wijaya Karya (Persero) Tbk |
| WSKT (s) | PT Waskita Karya (Persero) Tbk |
Appendix C
| No. | Ratio | Industry Average | Range |
|---|---|---|---|
| 1 | Quick Ratio (QR) | 120% | 60%–190% |
| 2 | Current Ratio (CR) | 150% | 120%–280% |
| 3 | Gross Profit Margin (GPM) | 16% | |
| 4 | After Tax Profit Margin Ratio (ATPM) | 1.9% | 0.5%–8.1% |
| 5 | Return on Asset (ROA) | 5.6% | 1.5%–21% |
| 6 | Return on Equity (ROE) | 15.1% | 4.2%–53% |
| 7 | Current-Liabilities-to-Net-Worth Ratio (CLNWR) | 123% | 38%–259% |
| 8 | Debt-to-Equity Ratio (DER) | 140% | 50%–280% |
| 9 | Accounts-Payable-to-Revenue Ratio (APRR) | 8.2% | 3.1%–13.3% |
Appendix D
| Liquidity Ratio | ||||
|---|---|---|---|---|
| Company | Quick Ratio | Benchmark | Current Ratio | Benchmark |
| ACST | 26% | Average: 120% Range: 60%–190% | 123% | Average: 150% Range: 120%–280% |
| ADHI(s) | 36% | 127% | ||
| BDKR | 98% | 124% | ||
| BUKK | 50% | 122% | ||
| JKON | 90% | 168% | ||
| PTPP(s) | 56% | 132% | ||
| TOTL | 82% | 139% | ||
| WIKA | 51% | 129% | ||
| WSKT | 33% | 116% | ||
Appendix E
| Profitability Ratio | ||||||||
|---|---|---|---|---|---|---|---|---|
| Company | GPM | Benhcmark | ATPM | Benhcmark | ROA | Benchmark | ROE | Benchmark |
| ACST | −0.1% | Average: 16% | −27% | Average: 1.9% Range: 1.5%–8.1% | −8.28% | Average: 5.6% Range: 1.5%–21% | −99.44% | Average: 15.1% Range: 4.2%–53% |
| ADHI(s) | 13.73% | 2.62% | 1.48% | 6.5% | ||||
| BDKR | 46.18% | 14.05% | 5.62% | 10.61% | ||||
| BUKK | 16.95% | 8.79% | 8.59% | 16.74% | ||||
| JKON | 15.96% | 4.1% | 4.61% | 8.66% | ||||
| PTPP(s) | 14.16% | 3.96% | 2.31% | 9.63% | ||||
| TOTL | 14.3% | 6.92% | 5.68% | 17.08% | ||||
| WIKA(s) | 11.31% | 3.92% | 2.28% | 8.42% | ||||
| WSKT(s) | 14.84% | −4.07% | 1.02% | −3.64% | ||||
Appendix F
| Leverage Ratio | ||||||
|---|---|---|---|---|---|---|
| Company | CLNWR | Benchmark | DER | Benchmark | APRR | Benchmark |
| ACST | 709% | Average: 123% Range: 38%–259% | 265.98% | Average: 140% Range: 5%–280% | 53% | Average: 8.2% Range: 3.1%–13.3% |
| ADHI(s) | 337% | 130.2% | 73% | |||
| BDKR | 59% | 50.62% | 5% | |||
| BUKK | 76% | 34.83% | 10% | |||
| JKON | 63% | 23.13% | 7% | |||
| PTPP(s) | 184% | 97.7% | 75% | |||
| TOTL | 161% | 1.15% | 7% | |||
| WIKA(s) | 187% | 106.04% | 50% | |||
| WSKT(s) | 212% | 283.22% | 45% | |||
References
- Adhi, Hutomo, and Mohamad Fany Alfarisi. 2019. Analysis of Factors Affecting Capital Structure/Leverage of Waskita Karya. ECONOMICA: Journal of Economic and Economic Education 8: 46–50. [Google Scholar] [CrossRef]
- Afriza, Eka Si Dana, and Wiwiek Mardawiyah Daryanto. 2019. Measuring and Comparing the Financial Performance of Construction Industry: An Indonesia Experience. International Journal of Business, Economics and Law 19: 59–73. [Google Scholar]
- Anggraini, Putri, and Febrianty. 2022. Analysis of the Company’s Financial Performance Using the Du Pont System in the Building Construction Sub-Sector on the Indonesia Stock Exchange. International Journal of Multidisciplinary Sciences and Arts 1: 48–69. [Google Scholar] [CrossRef]
- Asian Development Bank. 2020. Building the Future of Quality Infrastructure. Tokyo: ADB Institute. [Google Scholar]
- Baharuddin, Nurul Syuhada, Zaleha Khamis, Wan Mansor Wan Mahmood, and Hussian Dollah. 2011. Determinants of capital structure for listed construction companies in Malaysia. Journal of Applied Finance and Banking 1: 115. [Google Scholar]
- Banker, Rajiv D, Abraham Charnes, and William Wager Cooper. 1984. Some models for estimating technical and scale inefficiencies in data envelopment analysis. Management Science 30: 1078–1092. [Google Scholar] [CrossRef]
- BEI. 2023. Potential Mergers and Mounting Debt of BUMN Karya. Available online: https://www.idxchannel.com/market-news/potential-merger-and-debt-rising-bumn-karya/all (accessed on 4 March 2024).
- Bozgulova, Nadia Alexeyevna, and Aigerim Aidarbekovna Adambekova. 2023. Cost Accounting in the Construction Industry. Central Asian Economic Review 6: 63–79. [Google Scholar] [CrossRef]
- Brigham, Eugene F., and Louis C. Gapenski. 1994. Garenski: Financial Management, Theory and Practice. New York: The Dryden Press, Harcourt Brace College Publishers. [Google Scholar]
- Charnes, Abraham, William W. Cooper, and Edwardo Rhodes. 1978. Measuring the efficiency of decision making units. European Journal of Operational Research 2: 429–444. [Google Scholar] [CrossRef]
- Chong, K-Rine, Chee Foong Ben Yap, and Zulkiffli Mohamad. 2013. A study on the application of factor analysis and the distributional properties of financial ratios of Malaysian companies. International Journal of Academic Research in Management (IJARM) 2: 83–95. [Google Scholar]
- Daryanto, Wiwiek Mardawiyah, May Iffah, and Rizki Mahardhika. 2021. Financial Performance Analysis of Construction Company Before and during COVID-19 Pandemic in Indonesia. International Journal of Business, Economics and Law 24: 99–108. [Google Scholar]
- El-Kholy, Amr Metwally, and Ahmed Youssef Akal. 2021. Determining the stationary financial causes of contracting firms’ failure. International Journal of Construction Management 21: 818–33. [Google Scholar] [CrossRef]
- Emin, Öcal M., Emel Laptali Oral, Ercan Erdis, and Gamze Vural. 2007. Industry financial ratios-application of factor analysis in Turkish construction industry. Building and Environment 42: 385–92. [Google Scholar] [CrossRef]
- Hamid, Masdiah Abdul, Azizah Abdullah, and Nur Atiqah Kamaruzzaman. 2015. Capital structure and profitability in family and non-family firms: Malaysian evidence. Procedia Economics and Finance 31: 44–55. [Google Scholar] [CrossRef][Green Version]
- Hariandja, Nancy Megawati, Hermanto Siregar, Arif Imam Suroso, and Adler Haymans Manurung. 2022. Construction Capital Structure: SOE and Non-SOE in the Pandemic Era. Jurnal Manajemen Industri dan Logistik 6: 12. [Google Scholar]
- Jayiddin, Nur Faezah, Anita Jamil, and Saiyidi Mat Roni. 2017. Capital structure influence on construction firm performance. SHS Web of Conferences 36: 25. [Google Scholar] [CrossRef]
- Jung, Dae-Woon, and Kyung-Rai Kim. 2023. Efficiency Analysis of Specialty Construction Companies by Industry and Year Using DEA Model. Journal of the Architectural Institute of Korea 39: 267–75. [Google Scholar] [CrossRef]
- Manfei, Xu, Drew Fralick, Julia Z. Zheng, Bokai Wang, and Feng Changyong. 2017. The differences and similarities between two-sample t-test and paired t-test. Shanghai Archives of Psychiatry 29: 184. [Google Scholar]
- Mohammed, Ashraf Mohammed Sabry. 2007. Debt capacity of construction companies in Egypt. Arab Academy for Science, Technology and Maritime Transport. College of Engineering and Technology. Master’s thesis, Zagazig University, Zagazig, Egypt. [Google Scholar]
- Muhammad, Rachmadiosi, and Raden Aswin Rahadi. 2023. Financial Performance Analysis and Financial Distress Prediction of Indonesia State-Owned Enterprises in The Construction Industry Listed on IDX Before and during Economic Crisis in the Covid-19 Pandemic Era (Period 2019–2021). International Journal of Current Science Research and Review 6: 158–80. [Google Scholar] [CrossRef]
- Nur, Amalia Permata, and Choiroel Woestho. 2022. Financial Performance Analysis Based on Financial Ratios Before and during the Covid-19 Pandemic. Journal of Development Economics STIE Muhammadiyah Palopo 8: 28. [Google Scholar] [CrossRef]
- Peterson, Steven J. 2013. Construction Accounting and Financial Management. Upper Saddle River: Pearson, vol. 2. [Google Scholar]
- Putri, Trisandi Eka, and Syifa Ariella Putri. 2024. Determinants of financial distress in construction sub-sector companies in Indonesia and Malaysia. Proceeding International Conference on Accounting and Finance 2: 319–334. [Google Scholar]
- Saini, Arun, Dothang Truong, and Jing Yu Pan. 2023. Airline efficiency and environmental impacts—Data envelopment analysis. International Journal of Transportation Science and Technology 12: 335–53. [Google Scholar] [CrossRef]
- Seo, Kwang-Kyu, and Da-Young Choi. 2011. Efficiency analysis of construction firms using a combined AHP and DEA model. The Journal of the Korea Contents Association 11: 302–310. [Google Scholar] [CrossRef]
- Septian, Ridho, Ruth Esther Ambat, Mulyadi Yuswandono, and Ahmad Zulpanani. 2021. Assessment of Financial Performance in Construction Services Business Entities. Potential: Polytechnic Civil Journal 23: 120–127. [Google Scholar]
- Soetanto, Tessa V., and Liem Pei Fun. 2014. Performance evaluation of property and real estate companies listed on Indonesia Stock Exchange using data envelopment analysis. Journal of Management and Entrepreneurship 16: 121–130. [Google Scholar] [CrossRef][Green Version]
- Sowmya, D., and A. Malisetty. 2023. A Study on Need of Robust Financial Management and Accounting System with Reference to Construction Industry. ComFin Research 11: 30–33. [Google Scholar] [CrossRef]
- Sufian, Fadzlan, and Muzafar Shah Habibullah. 2010. Developments in the efficiency of the Thai banking sector: A DEA approach. International Journal of Development Issues 9: 226–245. [Google Scholar] [CrossRef]
- Sukandar, Beny Mulyana, Noer Azam Achsani, Roy Sembel, and Bagus Sartono. 2018. Efficiency of Construction Companies in Indonesia. Mix: A Scientific Journal of Management 8: 628. [Google Scholar] [CrossRef]
- Utamaningsih, Arni, and Chairul Muharis. 2020. Evaluation of the Financial Performance of Bumn Construction Companies for the 2015–2018 Period. Scientific Journal of Civil Engineering 17: 75–86. [Google Scholar] [CrossRef]
- Utomo, Nugroho Setyo, Sylvia Sandyazmara Devi, and Hermanto Siregar. 2022. Financial Performance Analysis of Construction State-Owned Enterprises Listed in Indonesia Stock Exchange during COVID-19. Journal of Islamic Economics and Finance 6: 244–68. [Google Scholar] [CrossRef]
- Van Horne, James C. 1983. Financial Management and Policy, 6th ed. Hoboken: Prentice-Hall, Inc. [Google Scholar]
- Vibhakar, Neelu Nandan, Kamalendra Kumar Tripathi, Sparsh Johari, and Kumar Neeraj Jha. 2023. Identification of significant financial performance indicators for the Indian construction companies. International Journal of Construction Management 23: 13–23. [Google Scholar] [CrossRef]
- Wang, Ziqian. 2023. Research on debt risk management and control of high liability enterprises. Academic Journal of Business and Management 5: 44–50. [Google Scholar]
- Zadorozhnyi, Zenovii-Mykhailo, and Iryna Ometsinska. 2020. Problematic aspects in accounting for financial performance in construction. Herald of Economics 3: 225–37. [Google Scholar] [CrossRef]


| Input | Output | |||||||
|---|---|---|---|---|---|---|---|---|
| Cost of Revenue (Billion IDR) | Operating Expenses (Billion IDR) | Total Assets (Billion IDR) | Revenue (Billion IDR) | |||||
| SOE | Private | SOE | Private | SOE | Private | SOE | Private | |
| Mean | 16,946 | 2423 | 1638 | 265 | 55,624 | 3681 | 19,737 | 2833 |
| Median | 14,295 | 2227 | 1125 | 193 | 51,805 | 3236 | 16,325 | 2629 |
| Stand dev | 7367 | 1318 | 1332 | 169 | 29,781 | 2006 | 9160 | 1555 |
| Minimum | 8415 | 226 | 395 | 93 | 16,761 | 819 | 9390 | 413 |
| Maximum | 39,926 | 5231 | 5433 | 786 | 124,392 | 10,447 | 48,789 | 6040 |
Disclaimer/Publisher’s Note: The statements, opinions and data contained in all publications are solely those of the individual author(s) and contributor(s) and not of MDPI and/or the editor(s). MDPI and/or the editor(s) disclaim responsibility for any injury to people or property resulting from any ideas, methods, instructions or products referred to in the content. |
© 2024 by the authors. Licensee MDPI, Basel, Switzerland. This article is an open access article distributed under the terms and conditions of the Creative Commons Attribution (CC BY) license (https://creativecommons.org/licenses/by/4.0/).
Share and Cite
Wibowo, F.A.; Satria, A.; Gaol, S.L.; Indrawan, D. Financial Risk, Debt, and Efficiency in Indonesia’s Construction Industry: A Comparative Study of SOEs and Private Companies. J. Risk Financial Manag. 2024, 17, 303. https://doi.org/10.3390/jrfm17070303
Wibowo FA, Satria A, Gaol SL, Indrawan D. Financial Risk, Debt, and Efficiency in Indonesia’s Construction Industry: A Comparative Study of SOEs and Private Companies. Journal of Risk and Financial Management. 2024; 17(7):303. https://doi.org/10.3390/jrfm17070303
Chicago/Turabian StyleWibowo, Febrianto Arif, Arif Satria, Sahala Lumban Gaol, and Dikky Indrawan. 2024. "Financial Risk, Debt, and Efficiency in Indonesia’s Construction Industry: A Comparative Study of SOEs and Private Companies" Journal of Risk and Financial Management 17, no. 7: 303. https://doi.org/10.3390/jrfm17070303
APA StyleWibowo, F. A., Satria, A., Gaol, S. L., & Indrawan, D. (2024). Financial Risk, Debt, and Efficiency in Indonesia’s Construction Industry: A Comparative Study of SOEs and Private Companies. Journal of Risk and Financial Management, 17(7), 303. https://doi.org/10.3390/jrfm17070303


