You are currently viewing a new version of our website. To view the old version click .
Journal of Risk and Financial Management
  • Article
  • Open Access

31 January 2024

The Impact of ESG Rating on Hedging Downside Risks: Evidence from a Weight-Tilted Hang Seng Index

,
and
1
Lee Shau Kee School of Business and Administration, Hong Kong Metropolitan University, Hong Kong, China
2
Citigroup, 388 Greenwich Street, New York, NY 10013, USA
3
College of Business Administration, University of Missouri, St. Louis, MO 63121, USA
*
Author to whom correspondence should be addressed.
This article belongs to the Special Issue Editorial Board Members’ Collection Series: Journal of Risk and Financial Management

Abstract

The study examines the return performance and resilience to market volatility of the recently introduced environment, social/sustainable, and governance (ESG) weight-tilted Hang Seng index compared to its parent, the Hang Seng index. The ESG-infused index has a higher mean return and lower return volatility than the parent index, although the differences are statistically and economically insignificant, a result consistent with the high correlation between the two index returns. Most importantly, the ESG weight-tilted index is more resilient to volatility spikes than the parent index and, therefore, has lower downside risks. The overall results show that stocks with high ESG ratings are less susceptible to trading pressures triggered by volatility-induced turnovers. The paper contributes to the literature by providing significant incremental information on the emerging market for ESG-related equity products in Hong Kong.
JEL Classification:
F64; G12; G15

1. Introduction

The environmental, social/sustainable, and governance (ESG) rating and performance of a company affect its market value (). On the supply side, a company may obtain government subsidies and/or reductions in levies by improving the firm’s ESG scores, while on the demand side, stocks with high ESG performance attract ESG-conscious individuals and norm-constrained institutional investors. Moreover, investors whose focus is on risk-adjusted returns can further fuel demand for stocks with high ESG ratings should the scores be priced in the market. All the above factors combine to produce a positive feedback loop, which in effect can create a win–win situation for the high-ESG-rated companies and their shareholders, which include ESG advocates, profit-oriented agents, and ESG norm-constrained and -unconstrained institutional investors. Consequently, firms with high ESG ratings have a lower cost of equity capital and a higher valuation than those at the other end of the measure. The existence of the ESG premium in firm values can propel both financial and real production activities to align economic goals with social welfare objectives.
() propose three channels through which fund ESG performance could affect fund downside risk: the firm channel in which the risk-mitigation effect of ESG is reflected at the firm level, the diversification channel in which the portfolio concentration of high-ESG funds can aggravate downside risk, and the flow channel in which high-ESG funds can attract investor flows and, consequently, reduce downside risk. The relationship between ESG ratings and downside risk depends on the relative force of these three channels.
We postulate that firms with high ESG ratings are more resilient to market volatility than those with low ESG ratings. Particularly, the preference for high-ESG firms makes them less susceptible to selling pressure in stressful market situations, as the ESG-conscious clientele (investors) are less prone to speculative trading; in addition, the speculative value of such firms is limited since they are already priced at a premium and less attractive to speculators.
Our main contribution is a direct test of the above hypothesis, leveraging the first ESG-enhanced stock market index (the ESG weight-tilted Hang Seng Index HSIESG) derived directly from the Hang Seng Index (HSI). We examine the performance of the HSIESG relative to its parent (HSI) under extreme market volatility conditions. A finding that HSIESG outperforms the parent index under extremely volatile market conditions will indicate the significance of the preference buffer.
The value-weighted free-float-adjusted HSI is the gauge of the blue-chip stocks listed on the Stock Exchange of Hong Kong (SEHK). The index is also the underlying asset of the first Hong Kong index exchange-traded fund (ETF)—that is, the Tracker Fund. The HSIESG is constructed by shifting the original HSI portfolio weights from the lower to higher ESG-rated firms while maintaining the set of constituent stocks of the parent index. The tilts are based on the ESG scores provided by the Hong Kong Quality Assurance Agency (HKQAA). This new setting that we identify allows a direct test of ESG’s marginal impact in terms of the tilted weights’ effect on the performance and volatility–return characteristics of the ESG-infused index relative to its parent.
However, unlike the highly distinguishable ESG-driven performance differential of a best-in-class index compared to its broad-based parent index, such as the S&P 500 (), we expect it would be difficult to discern how the tilted weights affect the performance of the narrow-based HSI because the ESG-infused index and parent index are highly correlated. Moreover, (), in their comprehensive meta-analysis, document a weak correlation between ESG and the performance of equities investments, a finding that further lowers the expectation that the HSIESG can significantly outperform the parent index. Indeed, our study finds that the returns of the weight-tilted HSIESG and the parent index have a correlation of over 99%, which explains why only minor improvements in the performance metrics (mean and volatility of returns) are found in the weight-tilted index. Nevertheless, the paper shows a subtle but significant negative and asymmetrical relationship between the average returns of the two indexes and the change in index option–implied market volatility. The asymmetrical volatility–return relationship is defined by an observation that the positive return associated with a drop in volatility is less than the magnitude of the negative return triggered by an equal rise in volatility.
We want to determine the performance of the ESG-enhanced index relative to its parent index. If the HSIESG underperforms the parent index, companies may not pursue ESG practices. The study is guided by (1) what we believe is crucial for driving companies to improve ESG ratings—that is, the return to shareholders (particularly during market downturns) from investing in high ESG firms, and (2) to explore whether the differential asymmetrical volatility–return relationships between the two indexes can explain the difference in the holding period return.
We report the performance comparisons between the HSIESG and HSI for different volatility conditions. We use both regression and non-parametric analyses to examine the asymmetrical relationships between the index returns and option-implied market volatility. We use the VHSI because the option-implied volatility index is a better measure for ex ante uncertainty than the standard deviation of stock returns. We also analyze the sensitivity of HSIESG and HSI returns to different systematic risk factors. We find that the returns in both indexes have a negative relationship with changes in the VHSI. Most importantly, this study finds that the response to the volatility of the ESG-infused index return is significantly weaker than that of the parent index during volatile periods, a crucial phenomenon that led to the substantially higher holding period return of the HSIESG than that of the HSI. This result supports the proposition that firms with high ESG ratings are less susceptible to trading pressures triggered by volatility-induced turnovers. The evidence also shows that the ESG weight-tilted index is more resilient to volatility spikes than the parent index, indicating that stocks with high ESG ratings can be a hedge against market downside risks. In particular, our results suggest that the firm-level channel and the flow channel are more important than the diversification channel postulated in (). This paper also contributes to the literature by providing significant incremental information on the emerging market for ESG-related equity products.
The rest of the paper is organized as follows. Section 2 reviews related studies. Section 3 describes the data and methodology for the empirical analysis. Section 4 summarizes and interprets the findings. Section 5 concludes the paper.

2. Literature Review

2.1. Evidence of the Market’s Preference for ESG-Related Financial Products

The () finds that the demand for ESG equity investment funds has accelerated in recent years. Conversely, ’s () survey reveals that ESG ETFs are among the top five ETF sectors that investors prefer to be available in the Hong Kong market. Furthermore, () study finds that stock indexes attract greater interest when the data compiler incorporates ESG factors in the index products. As ESG-related securities attract fund flows, the funding costs and capital constraints of firms with high ESG ratings can be substantially reduced through the issuance of equity securities. Consequently, the lower required return produces healthier valuations of the stocks and creates higher risk-adjusted returns for investors.
() show that the growth in fund flows into ESG-related equities was uninterrupted by the economic and financial turmoil caused by the COVID-19 pandemic. For instance, in the United States during Q1 2020, ESG-related open-end mutual funds and ETFs received close to USD 10 billion of capital inflows, an amount that is more than half of the total for the full year of 2019. During the same period, the market for ESG ETFs experienced only two weeks of insignificant outflows and the MSCI ESG Leaders Indexes outperformed their extremely volatile market benchmarks (). The above findings show that the prices of ESG-related equity products can weather the downside pressure with the support of norm-constrained institutions and ESG-advocate investors in general.
() emphasize the benefits to investors in incorporating ESG scores in index construction, as the ESG-tilted index portfolio combines the value of ESG and passive investment in a high-quality well-diversified portfolio. The available ESG-tilted index portfolios can attract large-scale investing toward companies with high ESG ratings, which creates a positive feedback effect, as good ESG practices increase demand for the ESG portfolio and enhance the risk-adjusted return. Conversely, if ESG practices can improve the risk-adjusted return to investors, then ESG-infused financial products and index funds or ETFs also appeal to investors whose main focus is on the potential financial benefits rather than social benefits, an aspect that can further fuel the demand for ESG-related index products.

2.2. Potential Financial Benefits from Investing in Companies with High ESG Ratings

An extensive number of studies have examined the association between ESG ratings and firms’ financial performance. () provide a comprehensive meta-analysis that covers over 2200 primary studies and survey articles published over 40 years since 1970. The study shows that over 62% of the primary studies find a positive relationship between ESG rating and corporate financial performance (CFP); the relationships are stable over time and are stronger for emerging markets. The CFP metrics used in the meta-analysis include accounting and market-based risk–return measures.
() argue that high ESG ratings and performance improve cash flows to shareholders, as ESG attributes strengthen a firm’s competitiveness, which raises the company’s profitability and dividends. Their argument is consistent with ’s () findings that high-ESG firms are more likely than those in the low-ESG group to attract and retain dedicated employees and loyal customers. () show that the MSCI ESG rating is positively associated with the firm’s financial performance but negatively related to its risk. To address the correlation-versus-causality criticism made by (), () provide an empirical analysis of economic explanations of causality. () report a positive relationship between ESG disclosure and firm performance (measured by EBIT) for large Italian companies. () suggest that regulators should include cultural dimensions in the development of a single global standard for ESG disclosure. Using data from G20 countries, () show that large firms tend to invest more in ESG activities and have better media coverage than small firms. This reduces the information asymmetry of major enterprises regarding ESG investments for their stakeholders.
() argue that ESG reduces systematic risk, as firms with strong ESG characteristics are less susceptible to market-wide shocks due to improvements in their operational efficiency. Therefore, such companies have lower costs of capital than those with weak ESG performance. () and () show that the cost of capital can also be a manifestation of information transparency and that such firms are favored by norm-constrained institutional investors. () and () report that ESG reduces financial risk, as a firm with a stronger ESG profile has higher compliance standards and better risk management and is, therefore, less vulnerable to idiosyncratic and operational risks than its counterparts. This allows high-ESG firms to avoid costly lawsuits and settlements. () also find among MSCI-rated firms that companies with high–MSCI ESG ratings have reduced idiosyncratic risk and an increased buffer against market risk. () show that social responsibility helps firms earn trust and social capital during market downturns; their results are further supported by (). See also, for example, () and () for evidence from the Chinese stock markets.
Conversely, there are concerns that the inclusion of ESG criteria may reduce returns (see, e.g., ) because the ESG tilts might underweight stocks with high risk-adjusted returns and overweight stocks with low risk-adjusted returns. The matter is serious as it is related to the investment fund manager’s fiduciary duty. However, such concern was lessened after the US Labor Department opined that ESG-related investment decisions made by pension plans do not violate the fiduciary duty of the sponsor and added that incorporating ESG ratings can create both social and financial benefits, according to (). Nevertheless, there are questions raised as to whether the ESG rating is precise. For example, () show that such ratings provided by the six prominent agencies are dispersed and mainly driven by divergences of scope and measurement methodology in addition to the assessor’s overall view of a firm. Furthermore, ESG rating might as well be a surrogate for known return predictors; hence, it does not present new valuable information to investors. For example, () show that ESG ratings have a negative association with the value factor (see, e.g., ). In a similar vein, () argues that ESG investing could be a watered-down version of growth investing, with certain sectors, such as technology and healthcare, being overweight.
Several recent papers provide different results and perspectives about the fund ESG performance. () propose three channels through which ESG performance will influence fund downside risk. First, the risk-mitigation effect of individual portfolio firms’ good ESG practices suggests a negative relationship between ESG ratings and downside risk (the firm-level channel). Second, the concentration of firms with high ESG ratings (or the elimination of firms with low ESG ratings) in a portfolio will lower the benefit of portfolio diversification, resulting in a positive relationship between ESG ratings and downside risk (the diversification channel). Third, firms with high ESG ratings may attract more investors (particularly long-term investors and during market turmoil) and fund flows, leading to a negative ESG rating–downside risk relationship (the flow channel). Zhang et al. report that the force of the flow channel dominates the other two channels in the Chinese market and find a positive relationship between fund ESG performance and downside risk.
() use advanced machine learning and regime-switching models to construct portfolios. They show that separating a time series into different regimes based on volatility and considering different metrics (in addition to historical return and volatility) can enhance fund performance. () examine whether shifts in investor tastes have led the market portfolio to capture ESG preferences. Their results suggest that “efforts by public authorities to promote improvements in corporate ESG performance translate into lower cost of capital, especially in periods of overall declines in corporate ESG performance”.
Our study examines whether the HSIESG is more resilient to market volatility than its parent, the HSI. However, unlike a best-in-class index—that is, an index portfolio constructed with a subset of top ESG-rated firms in a broad-based index, such as the S&P 500—it is widely known that a weight-tilted narrow-based index is expected to be highly correlated with the parent index (see, e.g., , ). Consequently, it is highly unlikely that the HSIESG can significantly outperform the parent HSI in any aspect. Therefore, the finding of a significant difference in the risk and return profiles between the HSIESG and its parent HSI would provide a strong testimony that the ESG-tilted weights have a material impact on the index performance and that the ESG-infused portfolio is more resilient to market volatility than the parent index due to a preference buffer. Following the arguments of (), our results suggest that the firm-level channel and the flow channel are more important than the diversification channel.

3. Data and Methodology

3.1. Data

Although ESG investing is new to the Hong Kong equities market, the asset management industry has already begun to internalize the opportunity. The Hang Seng Indexes Co. Ltd. (Hong Kong, China), the provider of the HSI and various major Hong Kong stock market benchmark indexes, launched the HSIESG on 14 May 2019. The HSIESG and its parent index are identical in all respects except that the HSIESG is constructed by shifting the index weights from firms with low ESG ratings to firms with high ESG ratings, where tilts are based on the ESG scores compiled by the HKQAA. The portfolio weight of a single stock has been capped at 8% for the parent index; the ceiling remains in effect for the tilt-adjusted weight of the HSIESG. Weightings are not fully disclosed by the HSI. There was no index exclusion from the HSI during the period. If a stock is (not) in the HSI, it is (not) in the HSIESG—survivorship should not affect the comparison made in the study. Furthermore, both indexes are subject to quarterly review.
The SEHK has required all listed companies to provide an annual ESG report to the public since 2016, which agrees with the Special Administrative Region (SAR) government’s vision to become China’s international green and sustainable financial hub. These conditions facilitate the index provider to launch the ESG weight-tilted index to meet the potential market demand.
The index provider has backdated the HSIESG to 8 September 2014. The overall sample covers 1751 daily observations for the period 8 September 2014–31 October 2021. The availability of the backdated sample allows a comparison of the findings between the prelaunch period (8 September 2014–13 May 2019; N = 1148) and the postlaunch period (14 May 2019–31 October 2021; N = 603). However, it is expected that as the ESG score data were also available during the prelaunch period, the market at large should have included the information in their index portfolio, and it is expected that the key results from the two subperiods are similar according to ’s () finding that the correlation between ESG and CFP is stable over time. Our paper uses daily data of the HSIESG, HSI, and VHSI retrieved from the Bloomberg terminal; the daily market factors for the Fama and Macbeth regression analysis are obtained from the Kenneth French library. We use daily data to capture the time-series dynamics of the index return in Hong Kong dollars. However, the main results (available upon request) are qualitatively the same using weekly and monthly returns.

3.2. Methodology

3.2.1. Performance Measurements and Comparisons

Conventional risk and return and other performance measures including the distributions of return, information ratio (IR), Sortino ratio, value at risk (VaR), expected shortfall (CVaR), and maximum drawdown are used to compare the risk and return between the ESG-infused index and the parent indexes for the overall period and between the prelaunch and postlaunch subperiods. The IR is r/σ, where r is the mean daily return and σ is the standard deviation of daily returns. The Sortino ratio is r/σd, where σd is the standard deviation of negative returns (downside deviation). VaR measures the greatest possible losses over a specific period at a particular percentile of return. Expected shortfall (also called conditional VaR) is the expected loss during the period, conditional on a loss greater than the particular percentile of the loss distribution. Maximum drawdown calculates the downside risk as the difference between the peak and trough index values in the percentage of the peak index value.

3.2.2. Tests for the Difference in Asymmetrical Volatility–Return Relationships between the HSIESG and HSI

We use the following conventional multiple regressions to examine the volatility–return relationships for both indexes and across the two subperiods. We examine the relationship of index returns (ΔlnHSIt) with the change (ΔVHSIt in Equation (1)) and percentage change (ΔlnVHSIt in Equation (2)) in the option-implied volatility. Equations (1) and (2) are as follows:
ΔlnHSIt = αo + α1ΔVHSIt α2Dt × ΔVHSIt + α3Dt + et
ΔlnHSIt = βo + β1ΔVHSIt + β2Dt × ΔlnVHSIt + β3Dt + et,
where ΔlnHSIt = lnHSItlnHSIt−1. Dt is a dummy variable with Dt = 1 if ΔVHSIt < 0 and 0 otherwise. α1 and β1 are expected to be negative. A negative α2 or β2 indicates an asymmetrical volatility–return relationship and that the negative market response to an increase in volatility is stronger than a decrease in volatility. We replicate the regressions with the HSIESG.
All time-series regressions use the heteroskedasticity and autocorrelation (HAC) Newey–West standard errors to account for both heteroskedasticity and autocorrelation in the error term. We use 10 lags in the Newey–West estimation, and the results are similar using different lags. Next, we group the returns of the 2 indexes within each of the 10 bins defined by the deciles of the rate of implied volatility change (ΔlnVHSI). Decile 1 (the bottom volatility change bin) contains the index returns on days with the sharpest drop in market volatility, while decile 10 (the top volatility change bin) includes the index returns on days with the steepest rise in market volatility.
We use the HAC standard errors of () to test the statistical significance of the difference of mean returns. Furthermore, we conduct a robustness check on the statistical significance of the mean returns and their differences using a bootstrapping method by resampling the returns 10,000 times to avoid the problem associated with the non-normality of the return distribution. For a return in a volatility change decile, from all the resampled means, we examine the observed distribution of the mean to see if the percentile range [0.5, 99.5] contains the value 0. If not, we define the mean of the return distribution to be 1% statistical significance. We report the results of the robustness tests in Appendix A.

3.2.3. Tests for Differential Exposure to Various Investment Factors

’s () five-factor models with a momentum factor are used in this paper to assess the differential exposure to various market factors between the ESG weight-tilted HSIESG and the parent index. We run the following factor model:
ΔlnHSIt = γo + γ1(Mkt-RF)t + γ2SMBt + γ3HMLt γ4RMWt + γ5CMAt + γ6WMLt + et,
where Mkt-RF is the market risk premium for developed international markets. SMB (size factor) is the return differential between small- and large-cap stocks. HML (P/B factor) is the return differential between high- and low-book-to-market stocks. RMW (profitability factor) is the return differential between stocks of high and low operating profitability. CMA (pro-growth factor) is the return differential between aggressive and conservative companies. WML (momentum factor) is the return differential between winners and losers. We replicate the regression with the HSIESG.
The results allow an examination of the relative performance between the ESG-infused index and the parent index. In their comparative study, () show that an ESG-tilt investment strategy that overweighs stocks with higher ESG ratings based on global MSCI data outperforms the benchmark. Finding similar results in Hong Kong would suggest that the ESG tilts have effectively incorporated and reflected the market’s relative preference for firms with high ESG scores.
We can provide more economic significance by adding suitable proxy variables for the ESG-individuals’ holdings of ESG stocks and norm-constrained institutional investors’ holdings of ESG stocks in the prelaunch and postlaunch periods to test the main hypothesis that high-ranked ESG stocks’ performance is resilient to market volatility. We reserve this issue for future research when data are available.

4. Empirical Results and Interpretations of the HSI and HSIESG

Table 1 shows the summary statistics of daily returns on the ESG weight-tilted HSIESG, the parent HSI, and daily closing levels of and returns on the option-implied volatility index derived from options written on the HSI. The mean and standard deviation of daily returns of the two indexes are not statistically significantly different for the overall period and the two subperiods.
Table 1. Summary statistics of daily returns of the ESG weight-tilted Hang Seng index (HSIESG), the parent Hang Seng index (HSI), and daily closing levels of and returns of the Hang Seng option-implied volatility index (VHSI).
Table 2 shows the correlations among daily returns of the HSIESG and HSI, and the levels and returns of the VHSI. All correlation coefficients are statistically significant at the 1% level. The high return correlation (>99%) between the two indexes suggests that finding any significant differences in the risk and return profiles between the weight-tilted index and the parent index is highly unlikely. The negative and over 60% correlation between the two measures of volatility change and index returns are consistent with the widely documented negative volatility–return relationship in the equity markets. The negative volatility–return relationships have strengthened in the recent period for both indexes, and the change in correlations is qualitatively identical for both indexes. It is useful to mention here that the subperiod results do not reveal significantly different correlation patterns between the prelaunch and postlaunch periods.
Table 2. Correlations among daily returns of the HSIESG and HSI and levels and returns of the VHSI.
Table 3 summarizes the key performance and risk metrics between the HSIESG and HSI. In general, the HSIESG has a higher return and a lower return standard deviation than those of the HSI, but, again, the differences are not statistically and economically significant. Specifically, the average (standard deviation of) daily returns are 0.0088% (0.0115) and 0.0084% (0.0119) for the HSIESG and HSI, respectively. The two subperiod results are qualitatively similar to those of the overall period. However, despite the insignificant differences in the arithmetic mean returns and return standard deviations between the two indexes, the holding period return of the HSIESG is substantially higher than its parent index by over 67% (i.e., 3.9657% vs. 2.369%), an important result that we will further explore in the subsequent sections.
Table 3. Performance comparisons between the HSIESG and HSI.
Table 4 summarizes the test results on the negative and asymmetrical relationships between the index returns and the change in option-implied market volatility. The regression results in Panel A show a highly significant negative relationship between index returns and the two measures in volatility changes. The slope coefficients for both measures of volatility change are negative at the 1% significance level, but the intercepts are mostly insignificant. Panel B shows that the intercept dummy and the slope coefficients are significantly negative at the 1% significance level concerning volatility change (ΔVHSI), an indication of the asymmetrical volatility–return relationship between the returns of the two indexes and the volatility change. Conversely, the slope coefficient has fully captured the volatility–return relationship for both indexes concerning volatility return (ΔlnVHSI). The regression test results further confirm the asymmetrical negative volatility–return relationship concerning the raw change in volatility. However, concerning the rate of volatility change, we find a highly significant negative volatility–return relationship in the slope coefficient but not in the intercept term. Furthermore, the subperiod results show no significant difference in the volatility–return relationship between the prelaunch and postlaunch periods.
Table 4. Tests of the negative and asymmetrical relationships between the index returns (HSIESG and HSIESG returns) and change in option-implied market volatility as measured by ΔVHSI and ΔlnVHSI for the overall sample period (N = 1751). Dependent variable: HSIESG or HSIESG returns.
Table 5 summarizes the mean daily returns for the HSIESG and HSI within each of the 10 bins defined by the deciles of the rate of implied volatility change. Decile 1 (the bottom volatility change bin) shows the mean index returns on days with the steepest drop in market volatility, while decile 10 (the top volatility change bin) shows the mean index returns on days with the sharpest rise in market volatility. Consistent with the regression results, the mean returns for both indexes are significantly positive in the bins with an average negative change in volatility and vice versa. The above findings are qualitatively similar for the two subperiods. We use the HAC standard errors of () to test the statistical significance of the results. Table A1 in Appendix A reports our robustness test via a bootstrapping method. The results from both tests are qualitatively identical. Most importantly, the asymmetrical response to the volatility of the ESG-infused index is significantly weaker than the parent index. For the overall period, the HSIESG has a lower mean return than the parent index (1.0496% vs. 1.1261%) for days with the highest drops in volatility. The opposite is true for days with the greatest spikes in volatility, where the HSIESG has a less negative mean return than the parent index (−1.6255% vs. −1.7235%).
Table 5. The mean returns of the HSIESG (ΔlnHSIESG) and HSI (ΔlnHSI) for each decile of option-implied volatility return (ΔlnVHSI) classification for the overall period and the prelaunch and postlaunch subperiods.
Table 6 shows that the above-mentioned mean return differentials particularly for the top and bottom decile bins are statistically significant at the 1% level. Moreover, the results from the two subperiods are consistent with those found in the overall period. We also consider whether the market cap is the main driver of the differential asymmetrical risk–return relationship and the significant holding return gap between the two indexes. By examining a sample of snapshots (since the portfolio weights are changing over time) of the two sets of portfolio weights, we find that the tilted weights have generally migrated downward for the largest stocks. The reason is that because the weights of the largest stocks have already reached the cap rate in the parent index, the ESG tilts can shift their weights only downward. Hence, it is unclear whether the ESG performance is related to the market cap of the largest stocks. The table also shows the difference between the mean returns between the HSIESG and HSI (ΔlnHSIESG − ΔlnHSI) within each bin defined according to the volatility change decile. We test the differences using a t-test with the HAC standard errors of (). The results show that the parent index HSI generally outperforms the ESG-infused HSIESG for days with the steepest volatility drop (within the volatility change decile 1 bin), while the opposite is true for days with the sharpest rise in volatility (within the volatility change decile 10 bin). The above findings are similar for the two subperiods. Table A2 in Appendix A reports the robustness test results via a bootstrapping method. The results from both tests are qualitatively the same.
Table 6. The differential mean returns between the HSIESG and HSI (ΔlnHSIESG − ΔlnHSI) for each decile of volatility return classification.
Results reported in Table 6 also shed some light as to why the ESG-infused index has a higher return than the parent index. Negative returns have a greater impact than positive returns on the holding period return. As noted in Table 6, we find that the ESG-infused index has a significantly less negative mean return than the parent index on days with the highest volatility spikes (i.e., the decile 10 bin) while the positive mean return differential (ΔlnHSIESG − ΔlnHSI > 0) in bin 10 is greater than the magnitude of the negative mean return differential (ΔlnHSIESG − ΔlnHSI < 0) in bin 1. Hence, the higher holding period return of the ESG-infused parent index is a result of the observed asymmetrical differential response to volatility shocks between the two indexes.
As noted in Table 3, the less negative mean return of the ESG-infused index on days with the sharpest rise in volatility produces a substantially higher holding period return than the parent index (i.e., 3.966% vs. 2.369%) despite the seemingly minor and statistically insignificant difference in the standard deviation of daily returns (i.e., 0.0115% vs. 0.0119%). Although the maximum drawdown of the ESG-tilted index is slightly higher than the parent index by 31 basis points for the overall period, the 95% VaR and the CVaRs of the HSIESG for both confidence intervals are lower than those of the parent index. Moreover, the holding period return difference is mainly attributed to the differences in mean returns between the two indexes on days with the greatest drop and the sharpest rise in market volatility (see the interpretation of results for Table 5 and Table 6).
To understand the large difference in the overall holding period return between the two indexes, we calculate the cumulative returns for days included in volatility change decile 1, decile 10, and the rest of the sample period. We find the following: (1) the cumulative return for days in decile 1 (the top 10% volatility change) is −380% and −399% for the HSIESG and HSI, respectively; (2) the cumulative return for days in decile 10 (the bottom 10% volatility change) is 343% and 355% for the HSIESG and HSI, respectively; (3) the cumulative returns for all other days (deciles 2–9, both deciles included) are 41.74% and 46.01% for the HSIESG and HSI, respectively. This result leads to the conclusion that the HSIESG has a substantially higher holding period return than the parent index because the ESG-infused index has significantly less negative returns than the parent index during days with the highest volatility spikes.
Table 7 and Table 8 summarize the test results on the sensitivity of the HSIESG and HSI returns to systematic risk measures via the Fama–French multifactor capital asset pricing model. Table 7 summarizes the results using market factors of the developed international markets, while Table 8 shows the results using the systematic risk factors of the Asia–Pacific markets excluding Japan. Both factors of SMB and HML for developed international markets (Table 7) and Asia–Pacific markets excluding Japan (Table 8) are used. The analysis is extended to examine whether the official launch (vis-à-vis the prelaunch period) of the ESG-tilted weights has a material impact on the performance of the HSIESG compared to the parent index. The overall results of Table 7 and Table 8 show that the HSI and HSIESG have similar sensitivities to the Fama–French five factors and the momentum factor, indicating that our results are not driven by the different sensitivities of these two indexes to the conventional factors. The results from the two subperiods are similar to those for the overall sample period. The two subperiods are the prelaunch and postlaunch periods as shown in
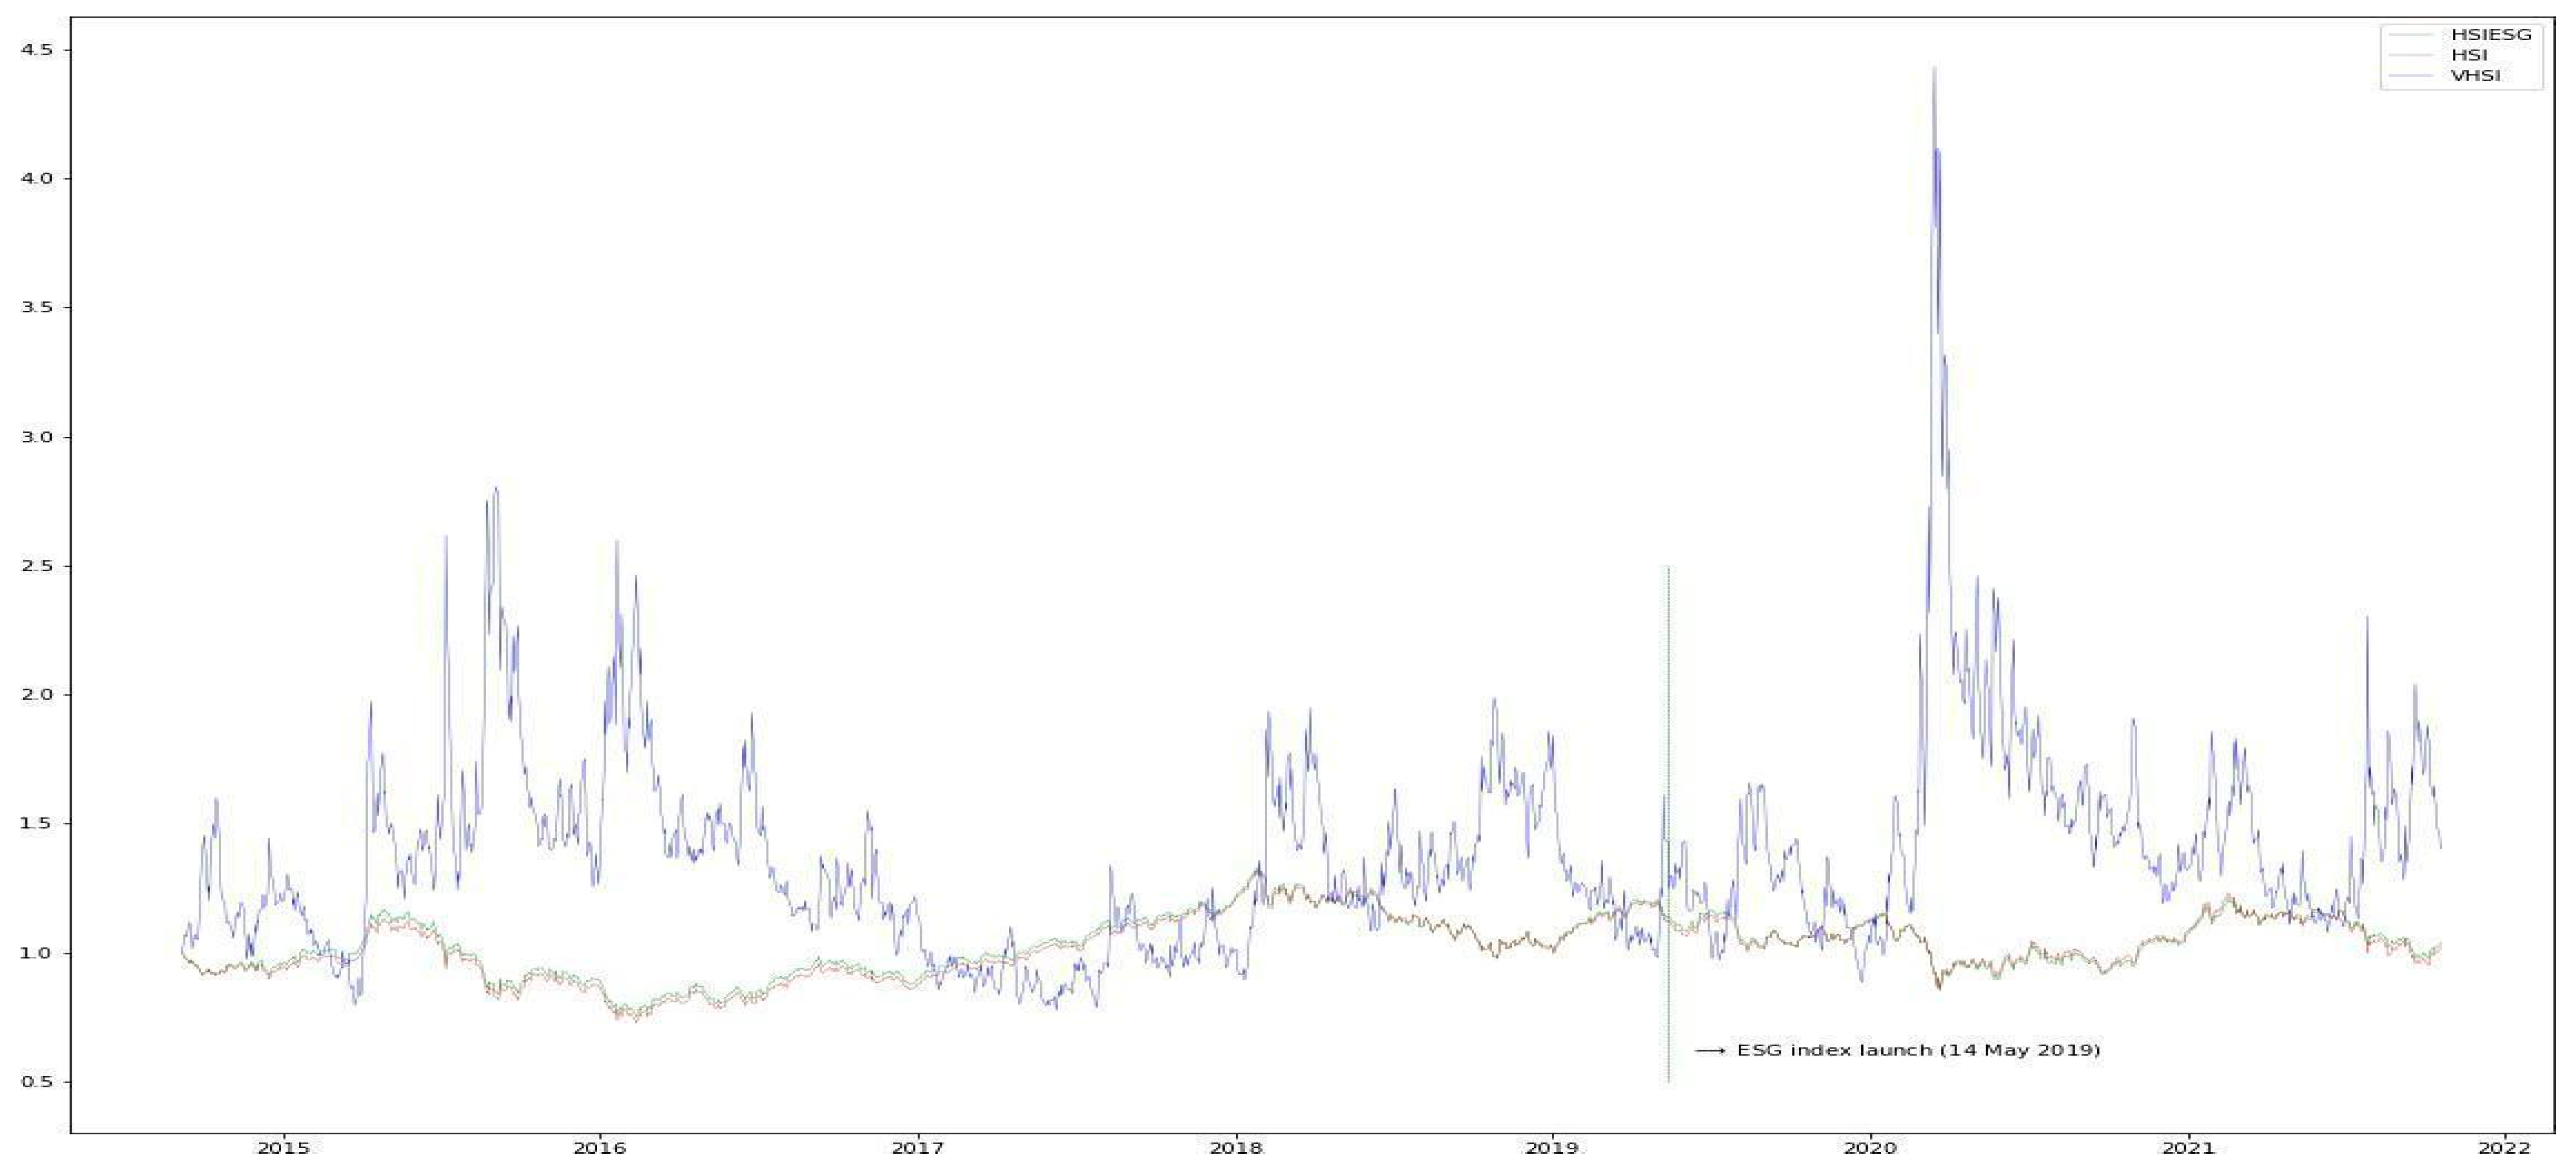
 Figure 1.
Table 7. Sensitivity of HSIESG and HSI returns to systematic risk factors in developed international markets.
Table 8. Sensitivity of HSIESG and HSI returns to systematic risk factors: Asia–Pacific markets excluding Japan.
Figure 1. Time-series plot of the daily observations of the levels of Hang Seng option-implied volatility index (VHSI) and the two stock indexes (HSIESG and HSI) for the period 8 September 2014–October 2021. The diagram shows the large variations in the perceived market volatility embedded in the Hang Seng Index options prices.

5. Conclusions

This study examines whether and to what extent the ESG-tilted weights change the performance of the index portfolio (HSIESG) relative to the parent index HSI. The paper shows that the daily returns of the two indexes are very highly correlated. However, the holding period return of the ESG-infused index is surprisingly higher than that of the parent index by over 67%. The unexpected result can be attributed to the difference in the strength of the asymmetrical volatility–return relationships between the two indexes for days with the highest and lowest volatility change, supporting our proposition that stocks with high ESG ratings are less susceptible to market volatility-induced trading pressures than firms with low ratings. The results also confirm our conjecture that ESG ratings are priced in the market, making high ESG companies less attractive to speculators, which increases these stocks’ tolerance against panic selling under market stress. Although our findings show that high-ESG stocks outperform their counterparts in market downturns, whether these companies can buffer against financial crises can be a theme for future studies by factoring in the implications of the volatility paradox discussed in ().
These findings suggest that ESG information can play a role as a financial factor in the valuation process in financial management. Moreover, by improving a company’s ESG performance, the board and management may enhance the stock’s resilience to market volatility. The findings also have implications for the prospects of financial market development. Although our results are primarily based on the newly introduced HSIESG, it sheds light on the potential economic benefits of incorporating ESG information into the construction of stock market indexes. ESG indexes may support the development of relevant index products, such as ESG-linked equity ETFs, derivatives, other exchange-traded products, and mutual funds. Currently, there are 36 and 34 investment products linked to the parent indexes, i.e., the HSI and Hang Seng China Enterprises Index, respectively. These products include local ETFs, ETFs listed around the world, leveraged and inverse products in Hong Kong, classification funds and listed open-end funds in China, mandatory provident funds in Hong Kong, and index funds worldwide. Growth in such markets may help promote Hong Kong as a major sustainability and green financial hub and reinforce its status as a global financial center.

Author Contributions

J.K.W.F.: Conceptualization, Software, Methodology, Administration, Writing. F.Y.E.L.: Conceptualization, Data curation, Software, Methodology, Writing. Y.T.: Supervision, Writing, Methodology, Administration. All authors have read and agreed to the published version of the manuscript.

Funding

The Thematic Research Fellowship from the Hong Kong Institute for Monetary and Financial Research.

Data Availability Statement

The daily market factors for the Fama and French regression analysis are obtained from the Kenneth French library, and the rest of the dataset is downloaded from Bloomberg terminal.

Acknowledgments

We would like to thank K. C. Kwok, Giorgio Valente, Hongyi Chan, and seminar participants from the Hong Kong Monetary Authority for their comments and suggestions. Fung acknowledges support in the form of the Thematic Research Fellowship from the Hong Kong Institute for Monetary and Financial Research. The research provided by Lam was completed during his posting at the Hong Kong Institute for Monetary and Financial Research. This paper represents the views of the authors, which are not necessarily the views of the Hong Kong Monetary Authority, Hong Kong Institute for Monetary and Financial Research, or its board of directors or council of advisers. The aforementioned entities except the authors take no responsibility for any inaccuracies or omissions contained in the paper.

Conflicts of Interest

Author F. Y. Eric Lam was employed by the company Citigroup. The remaining authors declare that the research was conducted in the absence of any commercial or financial relationships that could be construed as a potential conflict of interest.

Appendix A

Table A1. The mean returns of the HSIESG (ΔlnHSIESG) and HSI (ΔlnHSI) for each decile of volatility return (ΔlnVHSI) classification for the overall period and the prelaunch and postlaunch subperiods: A bootstrapping approach.
OverallPrelaunchPostlaunch
ΔlnVHSIΔlnHSIESGΔlnHSIΔlnVHSIΔlnHSIESGΔlnHSIΔlnVHSIΔlnHSIESGΔlnHSI
Decile
1−9.09531.0496 ***1.1261 ***−8.55210.9139 ***0.9788 ***−10.05221.3110 ***1.4060 ***
2−4.87530.6018 ***0.6380 ***−4.74050.5751 ***0.5965 ***−5.10770.6366 ***0.6991 ***
3−3.37320.4504 ***0.4737 ***−3.30770.4153 ***0.4319 ***−3.48040.5012 ***0.5462 ***
4−2.33670.3418 ***0.3534 ***−2.26520.2854 ***0.2977 ***−2.47340.4751 ***0.4931 ***
5−1.26890.1447 ***0.1519−1.19020.2009 ***0.2002 ***−1.41110.05820.0628
6−0.16990.03900.0515−0.09360.06100.0663−0.30350.01480.0408
71.0704−0.0478−0.06371.1353−0.0483−0.05870.9268−0.0775−0.1038
82.6172−0.2573 ***−0.2899 ***2.6346−0.1870−0.20402.5615−0.3746−0.4274 ***
94.9207−0.6085 ***−0.6334 ***4.7841−0.5562 ***−0.5867 ***5.2033−0.8251 ***−0.8652 ***
1012.7039−1.6255 ***−1.7235 ***11.9064−1.4779 ***−1.5480 ***14.0373−1.7779 ***−1.9015 ***
Daily index returns are grouped into 10 bins according to market volatility returns. The decile 1 bin contains the returns of the indexes on days with the greatest drop in market volatility, while the decile 10 bin contains the returns on days with the steepest rise in market volatility. The mean returns of the indexes are positive on days in the bins with a negative mean volatility return (i.e., deciles 1–6), while the mean returns of both indexes are positive on days in the bins with a positive mean volatility return. The results are consistent for the three periods. The 1% statistical significance level, indicated by ***, is determined via a bootstrapping method by resampling 10,000 times the returns. The positive mean returns for both indexes in the decile 10 bins are less than the magnitudes of the negative returns in the corresponding decile 1 bins, a result consistent for the overall period and the two subperiods. The findings show that an up jump in volatility has a greater impact on the index return than a down jump in volatility. Most importantly, the ESG-infused index has a significantly less asymmetrical volatility–return relationship than the parent index. For the overall period, the HSIESG has a lower mean return than the parent index (1.0496% vs. 1.1261%) for days with the highest drops in volatility; the opposite is true for days with the greatest spikes in volatility, and the HSIESG has a less negative mean return than the parent index (−1.6255% vs. −1.7235%).
Table A2. The differential mean returns between the HSIESG and HSI (ΔlnHSIESG − ΔlnHSI) for each decile of volatility return classification. A bootstrapping approach.
Overall PrelaunchPostlaunch
ΔlnVHSIΔlnHSIESG − ΔlnHSIΔlnVHSIΔlnHSIESG − ΔlnHSIΔlnVHSIΔlnHSIESG − ΔlnHSI
Decile
1−9.0953−0.0765 ***−8.5521−0.0649 ***−10.0522−0.095 ***
2−4.8753−0.0362 ***−4.7405−0.0214−5.1077−0.0625
3−3.3732−0.0233−3.3077−0.0166−3.4804−0.045
4−2.3367−0.0116−2.2652−0.0123−2.4734−0.018
5−1.2689−0.0072−1.19020.0007−1.4111−0.0046
6−0.1699−0.0125−0.0936−0.0053−0.3035−0.026
71.07040.01591.13530.01040.92680.0263
82.61720.0326 ***2.63460.0172.56150.0528
94.92070.0249 ***4.78410.0305 ***5.20330.0401
1012.70390.098 ***11.90640.0701 ***14.03730.1236 ***
The 1% statistical significance level, indicated by ***, is determined via a bootstrapping method by resampling 10,000 times the returns. The results show that the HSI generally outperforms the HSIESG for days with the largest volatility drop, as shown in the results from the decile 1 bin, while the opposite is true for days with the steepest rise in volatility, as shown in the results from the decile 10 bin. The above findings are similar for the two subperiods. As noted in Table 3, the less negative mean return of the ESG-infused index on days with the steepest rise in volatility produces a substantially higher holding period return than the parent index (i.e., 3.9657% vs. 2.369%) despite the seemingly minor and statistically insignificant difference in the standard deviation of daily returns (i.e., 0.0115% vs. 0.0119%). This result leads to the conclusion that the HSIESG has a substantially higher holding period return than the parent index because the ESG-infused index has a significantly less negative mean return than the parent index on days with the highest volatility spikes (i.e., the decile 10 bin). Moreover, the positive mean return differential (ΔlnHSIESG − ΔlnHSI > 0) in bin 10 is greater than the magnitude of the negative mean return differential (ΔlnHSIESG − ΔlnHSI < 0) in bin 1. To understand the large difference in the overall holding period return between the two indexes, we calculate the cumulative returns for days included in volatility change in decile 1, decile 10, and the rest of the sample period. We find the following: (1) the cumulative return for days in decile 1 (the top 10% volatility change) is −380% and −399% for the HSIESG and HSI, respectively; (2) the cumulative return for days in decile 10 (the bottom 10% volatility change) is −343% and −355% for the HSIESG and HSI, respectively; (3) the cumulative returns for all other days (deciles 2–9, both deciles included) are 41.74% and 46.01% for the HSIESG and HSI, respectively.

References

  1. Authers, John. 2020. ESG Investing Is Having a Good Crisis. It’s Also Killing Jobs, Bloomberg Markets. Paris: OECD. [Google Scholar]
  2. Berg, Florian, Julian F. Kölbel, and Roberto Rigobon. 2022. Aggregate Confusion: The Divergence of ESG Ratings. Review of Finance 26: 1315–44. [Google Scholar] [CrossRef]
  3. Bissoondoyal-Bheenick, Emawtee, Robert Brooks, and Hung Xuan Do. 2023. ESG and Firm Performance: The Role of Size and Media Channels. Economic Modelling 121: 106203. [Google Scholar] [CrossRef]
  4. Brown Brothers Harriman (Hong Kong) Limited. 2019. 2019 Global ETF Investor Survey: Greater China Results Supplement. Hong Kong: Brown Brothers Harriman. [Google Scholar]
  5. Cao, Mingyao, Keyi Duan, and Haslindar Ibrahim. 2023. Local Government Debt and Its Impact on Corporate Underinvestment and ESG Performance: Empirical Evidence from China. Sustainability 15: 11116. [Google Scholar] [CrossRef]
  6. Davoodi, Shayan, Ali Fereydooni, and Mohammad A. Rastegar. 2024. Can Portfolio Construction Considering ESG Still Gain High Profits? Research in International Business and Finance 67: 102126. [Google Scholar] [CrossRef]
  7. Deghi, Andrea, Peter Welz, and Dawid Żochowski. 2018. A new financial stability risk index to predict the near-term risk of recession. Financial Stability Review. Available online: https://www.ecb.europa.eu/pub/financial-stability/fsr/special/html/ecb.fsrart201805_1.en.html (accessed on 14 December 2023).
  8. Dunn, Jeff, Shaun Fitzgibbons, and Lukasz Pomorski. 2017. Assessing Risk through Environmental, Social and Governance Exposures. Journal of Investment Management 16: 4–17. [Google Scholar]
  9. Eccles, Robert G., Joannis Ioannou, and George Serafeim. 2014. The Impact of Corporate Sustainability on Organizational Processes and Performance. Management Science 60: 2835–57. [Google Scholar] [CrossRef]
  10. El Ghoul, Sadok, Omrane Guedhami, Chuck C. Y. Kwok, and Dev R. Mishra. 2011. Does Corporate Social Responsibility Affect the Cost of Capital? Journal of Banking and Finance 35: 2388–406. [Google Scholar] [CrossRef]
  11. Fama, Eugene F., and Kenneth R. French. 2015. A Five-Factor Asset Pricing Model. Journal of Financial Economics 116: 1–22. [Google Scholar] [CrossRef]
  12. Fatemi, Ali, Iraj Fooladi, and Hassan Tehranian. 2015. Valuation Effects of Corporate Social Responsibility. Journal of Banking & Finance 10: 182–92. [Google Scholar]
  13. Friede, Gunnar, Timo Busch, and Alexander Bassen. 2015. ESG and Financial Performance: Aggregated Evidence from More than 2000 Empirical Studies. Journal of Sustainable Finance & Investment 5: 210–33. [Google Scholar]
  14. Giese, Guido, Linda E. Lee, Dimitris Melas, Zoltán Nagy, and Laura Nishikawa. 2019a. Foundations of ESG Investing: How ESG Affects Equity Valuation, Risk, and Performance. Journal of Portfolio Management 45: 1–15. [Google Scholar] [CrossRef]
  15. Giese, Guido, Linda E. Lee, Dimitris Melas, Zoltán Nagy, and Laura Nishikawa. 2019b. Performance and Risk Analysis of Index-Based ESG Portfolios. Journal of Index Investing 9: 46–57. [Google Scholar] [CrossRef]
  16. Godfrey, Paul C., Craig B. Merrill, and Jared M Hansen. 2009. The Relationship between Corporate Social Responsibility and Shareholder Value: An Empirical Test of the Risk Management Hypothesis. Strategic Management Journal 30: 425–45. [Google Scholar] [CrossRef]
  17. Gregory, Alan, Rajesh Tharyan, and Julie Whittaker. 2014. Corporate Social Responsibility and Firm Value: Disaggregating the Effects on Cash Flow, Risk and Growth. Journal of Business Ethics 124: 633–57. [Google Scholar] [CrossRef]
  18. Hong, Harrison, and Marcin Kacperczyk. 2009. The Price of Sin: The Effects of Social Norms on Markets. Journal of Financial Economics 93: 15–36. [Google Scholar] [CrossRef]
  19. International Monetary Fund. 2019. Global Financial Stability Report: Lower for Longer. Washington, DC: International Monetary Fund (IMF). [Google Scholar]
  20. Jin, Yuqian, Qingfu Liu, Yiuman Tse, and Kaixin Zheng. 2023. Hedging COVID-19 Risk with ESG Disclosure. International Review of Economics and Finance 88: 27–46. [Google Scholar] [CrossRef]
  21. Krueger, Philipp. 2015. Corporate Goodness and Shareholder Wealth. Journal of Financial Economics 115: 304–29. [Google Scholar] [CrossRef]
  22. Li, Kunming, Linxing Huang, Jinshan Zhang, Zhencheng Huang, and Liting Fang. 2023. Can ESG Performance Alleviate the Constraints of Green Financing for Chinese Enterprises: Evidence from China’s A-Share Manufacturing Companies. Sustainability 15: 10970. [Google Scholar] [CrossRef]
  23. Lins, Karl V., Henri Servaes, and Ane Tamayo. 2017. Social Capital, Trust, and Firm Performance: The Value of Corporate Social Responsibility during the Financial Crisis. Journal of Finance 72: 1785–824. [Google Scholar] [CrossRef]
  24. Melas, Dimitris, Zoltán Nagy, and Padmakar Kulkarni. 2018. Factor Investing and ESG Integration, Factor Investing: From Traditional to Alternative Risk Premia. London: ISTE Press, Oxford: Elsevier, pp. 389–413. [Google Scholar]
  25. Moody’s. 2020. Beyond Passive, ESG Investing Is the Next Growth Frontier for Asset Managers, Moody’s Investor Service. New York: Moody’s. [Google Scholar]
  26. Nagy, Zoltán, Altaf Kassam, and Linda E. Lee. 2016. Can ESG Add Alpha? An Analysis of ESG Tilt and Momentum Strategies. Journal of Investing 25: 113–24. [Google Scholar]
  27. Newey, Whitney K., and Kenneth D. West. 1984. A Simple, Positive Semi-Definite Heteroskedasticity and Autocorrelation Consistent Covariance Matrix. Econometrica 55: 703–8. [Google Scholar] [CrossRef]
  28. Oikonomou, Ioannis, Chris Brooks, and Stephen Pavelin. 2012. The Impact of Corporate Social Performance on Financial Risk and Utility: A Longitudinal Analysis. Financial Management 41: 483–515. [Google Scholar] [CrossRef]
  29. Pulino, Silvia C., Mirella Ciaburri, Barbara S. Magnanelli, and Luigi Nasta. 2022. Does ESG Disclosure Influence Firm Performance? Sustainability 14: 7595. [Google Scholar] [CrossRef]
  30. Rojo-Suárez, Javier, and Ana B. Alonso-Conde. 2024. Have Shifts in Investor Tastes Led the Market Portfolio to Capture ESG Preferences? International Review of Financial Analysis 91: 103019. [Google Scholar] [CrossRef]
  31. Ward, Karen, and Jennifer Wu. 2019. How Is ESG Affecting the Investment Landscape? (On the Minds of Investors). New York: J.P. Morgan Asset Management. [Google Scholar]
  32. Wasiuzzaman, Shaista, Salihu A. Ibrahim, and Farahiyah Kawi. 2022. Environmental, Social and Governance (ESG) Disclosure and Firm Performance: Does National Culture Matter? Meditari Accoutancy Research 31: 1239–65. [Google Scholar] [CrossRef]
  33. Wu, Jennifer, and Vincent Juvyns. 2020. COVID-19 Shows ESG Matters More Than Ever (On the Minds of Investors). New York: J.P. Morgan Asset Management. [Google Scholar]
  34. Zhang, Ning, Yue Zhang, and Zhe Zong. 2023. Fund ESG Performance and Downside Risk: Evidence from China. International Review of Financial Analysis 86: 102526. [Google Scholar] [CrossRef]
Disclaimer/Publisher’s Note: The statements, opinions and data contained in all publications are solely those of the individual author(s) and contributor(s) and not of MDPI and/or the editor(s). MDPI and/or the editor(s) disclaim responsibility for any injury to people or property resulting from any ideas, methods, instructions or products referred to in the content.

Article Metrics

Citations

Article Access Statistics

Multiple requests from the same IP address are counted as one view.