



Market Volatility vs. Economic Growth: The Role of Cognitive Bias

Abstract
1. Introduction
2. Literature Review
3. Materials and Methods
3.1. Data
3.2. Methodology
3.3. Propositions
4. Results
5. Discussion
5.1. Market Volatility vs. Economic Growth
5.2. Summary and Discussion
6. Conclusions
- Exploring the role of other potential psychological factors and individual characteristics that could influence investment decisions and market behavior, such as overconfidence, anchoring bias, or risk perception.
- Investigating the impact of investor demographics, education levels, and cultural factors on the prevalence and manifestation of cognitive biases in different market contexts.
- Conducting field studies and longitudinal analyses to examine the relationship between risk tolerance, herding behavior, and market outcomes in real-world investment scenarios.
- Expanding the research scope to include a broader range of financial instruments, asset classes, and market environments to assess the generalizability of the findings.
- Incorporating qualitative data and analysis techniques to provide deeper insights into the underlying reasons for observed behavioral biases and their impact on investment decision-making processes.
Author Contributions
Funding
Data Availability Statement
Acknowledgments
Conflicts of Interest
References
- Akin, Isik, and Maryem Akin. 2024. Behavioral finance impacts on US stock market volatility: An analysis of market anomalies. Behavioural Public Policy, 1–25. [Google Scholar] [CrossRef] [Scilit]
- Ameziane, Karim, and Bouchra Benyacoub. 2022. Exchange rate volatility effect on economic growth under different exchange rate regimes: New evidence from emerging countries using panel CS-ARDL model. Journal of Risk and Financial Management 15: 499. [Google Scholar] [CrossRef] [Scilit]
- Babatunde, Onakoya Adegbemi. 2013. Stock market volatility and economic growth in Nigeria (1980–2010). International Review of Management and Business Research 2: 201–209. [Google Scholar]
- Cascão, Ana, Ana Paula Quelhas, and António Manuel Cunha. 2023. Heuristics and cognitive biases in the housing investment market. International Journal of Housing Markets and Analysis 16: 991–1006. [Google Scholar] [CrossRef] [Scilit]
- Chang, Mengmeng, and Yuqi Li. 2024. Impact of capital market volatility on economic growth-An analysis based on stochastic volatility model. Heliyon 10: e25679. [Google Scholar] [CrossRef] [Scilit]
- Christoffersen, Jeppe, and Simone Stæhr. 2019. Individual risk tolerance and herding behaviors in financial forecasts. European Financial Management 25: 1348–77. [Google Scholar] [CrossRef] [Scilit]
- Dhankar, Raj S., and Devesh Shankar. 2016. Relevance and evolution of adaptive markets hypothesis: A review. Journal of Indian Business Research 8: 166–79. [Google Scholar] [CrossRef] [Scilit]
- Erixon, Lennart, and Louise Johannesson. 2015. Is the psychology of high profits detrimental to industrial renewal? Experimental evidence for the theory of transformation pressure. Journal of Evolutionary Economics 25: 475–511. [Google Scholar] [CrossRef] [Scilit]
- Huttunen, Annamarie W., Hayley M. Reeve, and Eric M. Bowman. 2020. Bull, bear, or rat markets: Rat “stock market” task reveals human-like behavioral biases. Journal of Neuroscience, Psychology, and Economics 13: 204–29. [Google Scholar] [CrossRef] [Scilit]
- Kiruthika, R., and S. Ramya. 2023. Cognitive Bias Factors Influencing Investors Investment Decisions in Behavioural Finance Perception. Journal of Research Administration 5: 2809–25. Available online: https://journlra.org/index.php/jra/article/view/465 (accessed on 10 October 2024).
- Lo, Andrew W. 2004. The adaptive markets hypothesis. The Journal of Portfolio Management 30: 15–29. [Google Scholar] [CrossRef] [Scilit]
- McFadden, Brandon R., and Jayson L. Lusk. 2015. Cognitive biases in the assimilation of scientific information on global warming and genetically modified food. Food Policy 54: 35–43. [Google Scholar] [CrossRef] [Scilit]
- Mushinada, Venkata Narasimha Chary, and Venkata Subrahmanya Sarm Veluri. 2019. Elucidating investors rationality and behavioural biases in Indian stock market. RBF 11: 201–19. [Google Scholar] [CrossRef] [Scilit]
- Ni, Zhong-Xin, Da-Zhong Wang, and Wen-Jun Xue. 2015. Investor sentiment and its nonlinear effect on stock returns—New evidence from the Chinese stock market based on panel quantile regression model. Economic Modelling 50: 266–74. [Google Scholar] [CrossRef] [Scilit]
- Patel, Nayana Govindbhai. 2023. A Study on Influences of Psychological Biases on Investment decision of Indian Investors. Vidhyayana, 473–482. Available online: http://vidhyayanaejournal.org/journal/article/view/1456 (accessed on 10 October 2024).
- Sharma, Manika, and Mohammad Firoz. 2020. Do Investors’ Exhibit Cognitive Biases: Evidence from Indian Equity Market. IJFR 11: 26. [Google Scholar] [CrossRef] [Scilit]
- Silva, Sergio H. R. da, Benjamin M. Tabak, Daniel O. Cajueiro, and Dimas M. Fazio. 2017. Economic growth, volatility and their interaction: What’s the role of finance? Economic Systems 41: 433–44. [Google Scholar] [CrossRef] [Scilit]
- Shin, Heejeong, Hyejeong Shin, and Su-In Kim. 2019. The market sentiment trend, investor inertia, and post-earnings announcement drift: Evidence from Korea’s stock market. Sustainability 11: 5137. [Google Scholar] [CrossRef] [Scilit]
- Spulbar, Cristi, Ramona Birau, and Lucian Florin Spulbar. 2021. A critical survey on efficient market hypothesis (EMH), adaptive market hypothesis (AMH) and fractal markets hypothesis (FMH) considering their implication on stock markets behavior. Ovidius University Annals, Economic Sciences Series 21: 1161–65. [Google Scholar]
- Su, Chi Wei, Fangying Liu, Meng Qin, and Tsangyao Chnag. 2023. Is a consumer loan a catalyst for confidence? Economic Research—Ekonomska Istraživanja 36: 2142260. [Google Scholar] [CrossRef] [Scilit]
- Urquhart, Andrew, and Frank McGroarty. 2016. Are stock markets really efficient? Evidence of the adaptive market hypothesis. International Review of Financial Analysis 47: 39–49. [Google Scholar] [CrossRef] [Scilit]
- Vo, Duc Hong, Son Van Huynh, Anh The Vo, and Dao Thi-Thieu Ha. 2019. The importance of the financial derivatives markets to economic development in the world’s four major economies. Journal of Risk and Financial Management 12: 35. [Google Scholar] [CrossRef] [Scilit]
- Wang, Qian, Chunyan Zhou, Lei Wang, and Yu Wei. 2023. End-word tones of stock names and stock price anomalies: Empirical evidence from China’s IPO markets. Finance Research Letters 58: 104572. [Google Scholar] [CrossRef] [Scilit]
- Zielonka, Piotr, Wojciech Białaszek, Paweł Biedrzycki, and Bartłomiej Dzik. 2020. Don’t fight the tape! Technical analysis momentum and contrarian signals as common cognitive biases. Central European Management Journal 28: 98–110. [Google Scholar] [CrossRef] [Scilit]

| SN | Title | Findings | Research Gap |
|---|---|---|---|
| 1 | Don’t Fight the Tape! Technical Analysis Momentum and Contrarian Signals as Common Cognitive Biases. (Zielonka et al. 2020) | • Investors exhibit momentum and contrarian biases in evaluating technical analysis signals. • The disposition effect influences investors’ beliefs in technical analysis signals. | • Lack of analysis on the reasons why investors continue to use TA despite its doubtful effectiveness. • Future research could explore the psychological and behavioral factors that drive investors to use technical analysis despite its doubtful effectiveness. |
| 2 | Cognitive Bias Factors Influencing Investors’ Investment Decisions in Behavioral Finance Perception. (Kiruthika and Ramya 2023) | • Cognitive biases like confirmation bias, loss aversion, and the illusion of control significantly influence investment decisions. | • The study examined only five cognitive bias factors, leaving room to investigate other factors influencing investors’ decision-making. • The sample size was relatively small, and increasing it could provide more robust results. |
| 3 | A Study on Influences of Psychological Biases on Investment Decisions of Indian Investors (Patel 2023) | • Psychological biases, especially overconfidence, loss aversion, and herding behaviors, significantly affect investment decisions among Indian investors. • Socio-demographic factors like gender, income, and education level play a role in shaping investor behavior. | • The sample size may not be representative of the entire Indian investor population. • The study addressed only three psychological biases and did not consider other factors that may influence investor behavior. |
| 4 | Elucidating Investors Rationality and Behavioral Biases in Indian Stock Market (Mushinada and Veluri 2019) | • Individual investors’ cognitive biases play a significant role in their investment decision-making behavior. • Rationality has a significantly negative relationship with self-attribution bias and overconfidence bias. • Male investors exhibit higher levels of overconfidence bias than female investors. | • The study relies on a self-report questionnaire to collect subjective information from individual investors, which may be subject to social desirability bias and limit the generalizability of the findings. |
| 5 | Do Investors Exhibit Cognitive Biases: Evidence from Indian Equity (Sharma and Firoz 2020) | • Investors exhibit behavioral biases such as optimism bias, herding, mental accounting, and disposition effect. • These biases significantly affect their rational decision-making process. | • The study has a small sample size and an overemphasis on quantitative data. A qualitative study can supplement this study to provide insights into the underlying reasons for the observed behavioral biases and their impact on investment decision-making. |
| SN | Variable | Description (Dataset for the Period of April 2006 to March 2024) |
|---|---|---|
| 1. | GDPUS | Monthly percentage GDP growth in the United States. |
| 2. | SPX | Monthly closing price of the S&P 500 index. |
| 3. | GDPGB | Monthly percentage GDP growth in the United Kingdom. |
| 4 | UKX | Monthly closing price of the FTSE 100 index. |
| 5 | GDPIN | Monthly percentage GDP growth in India. |
| 6 | NIFTY | Monthly closing price of the Nifty 50 index. |
| 7 | GDPUS_T | Min–max transformed GDPUS. |
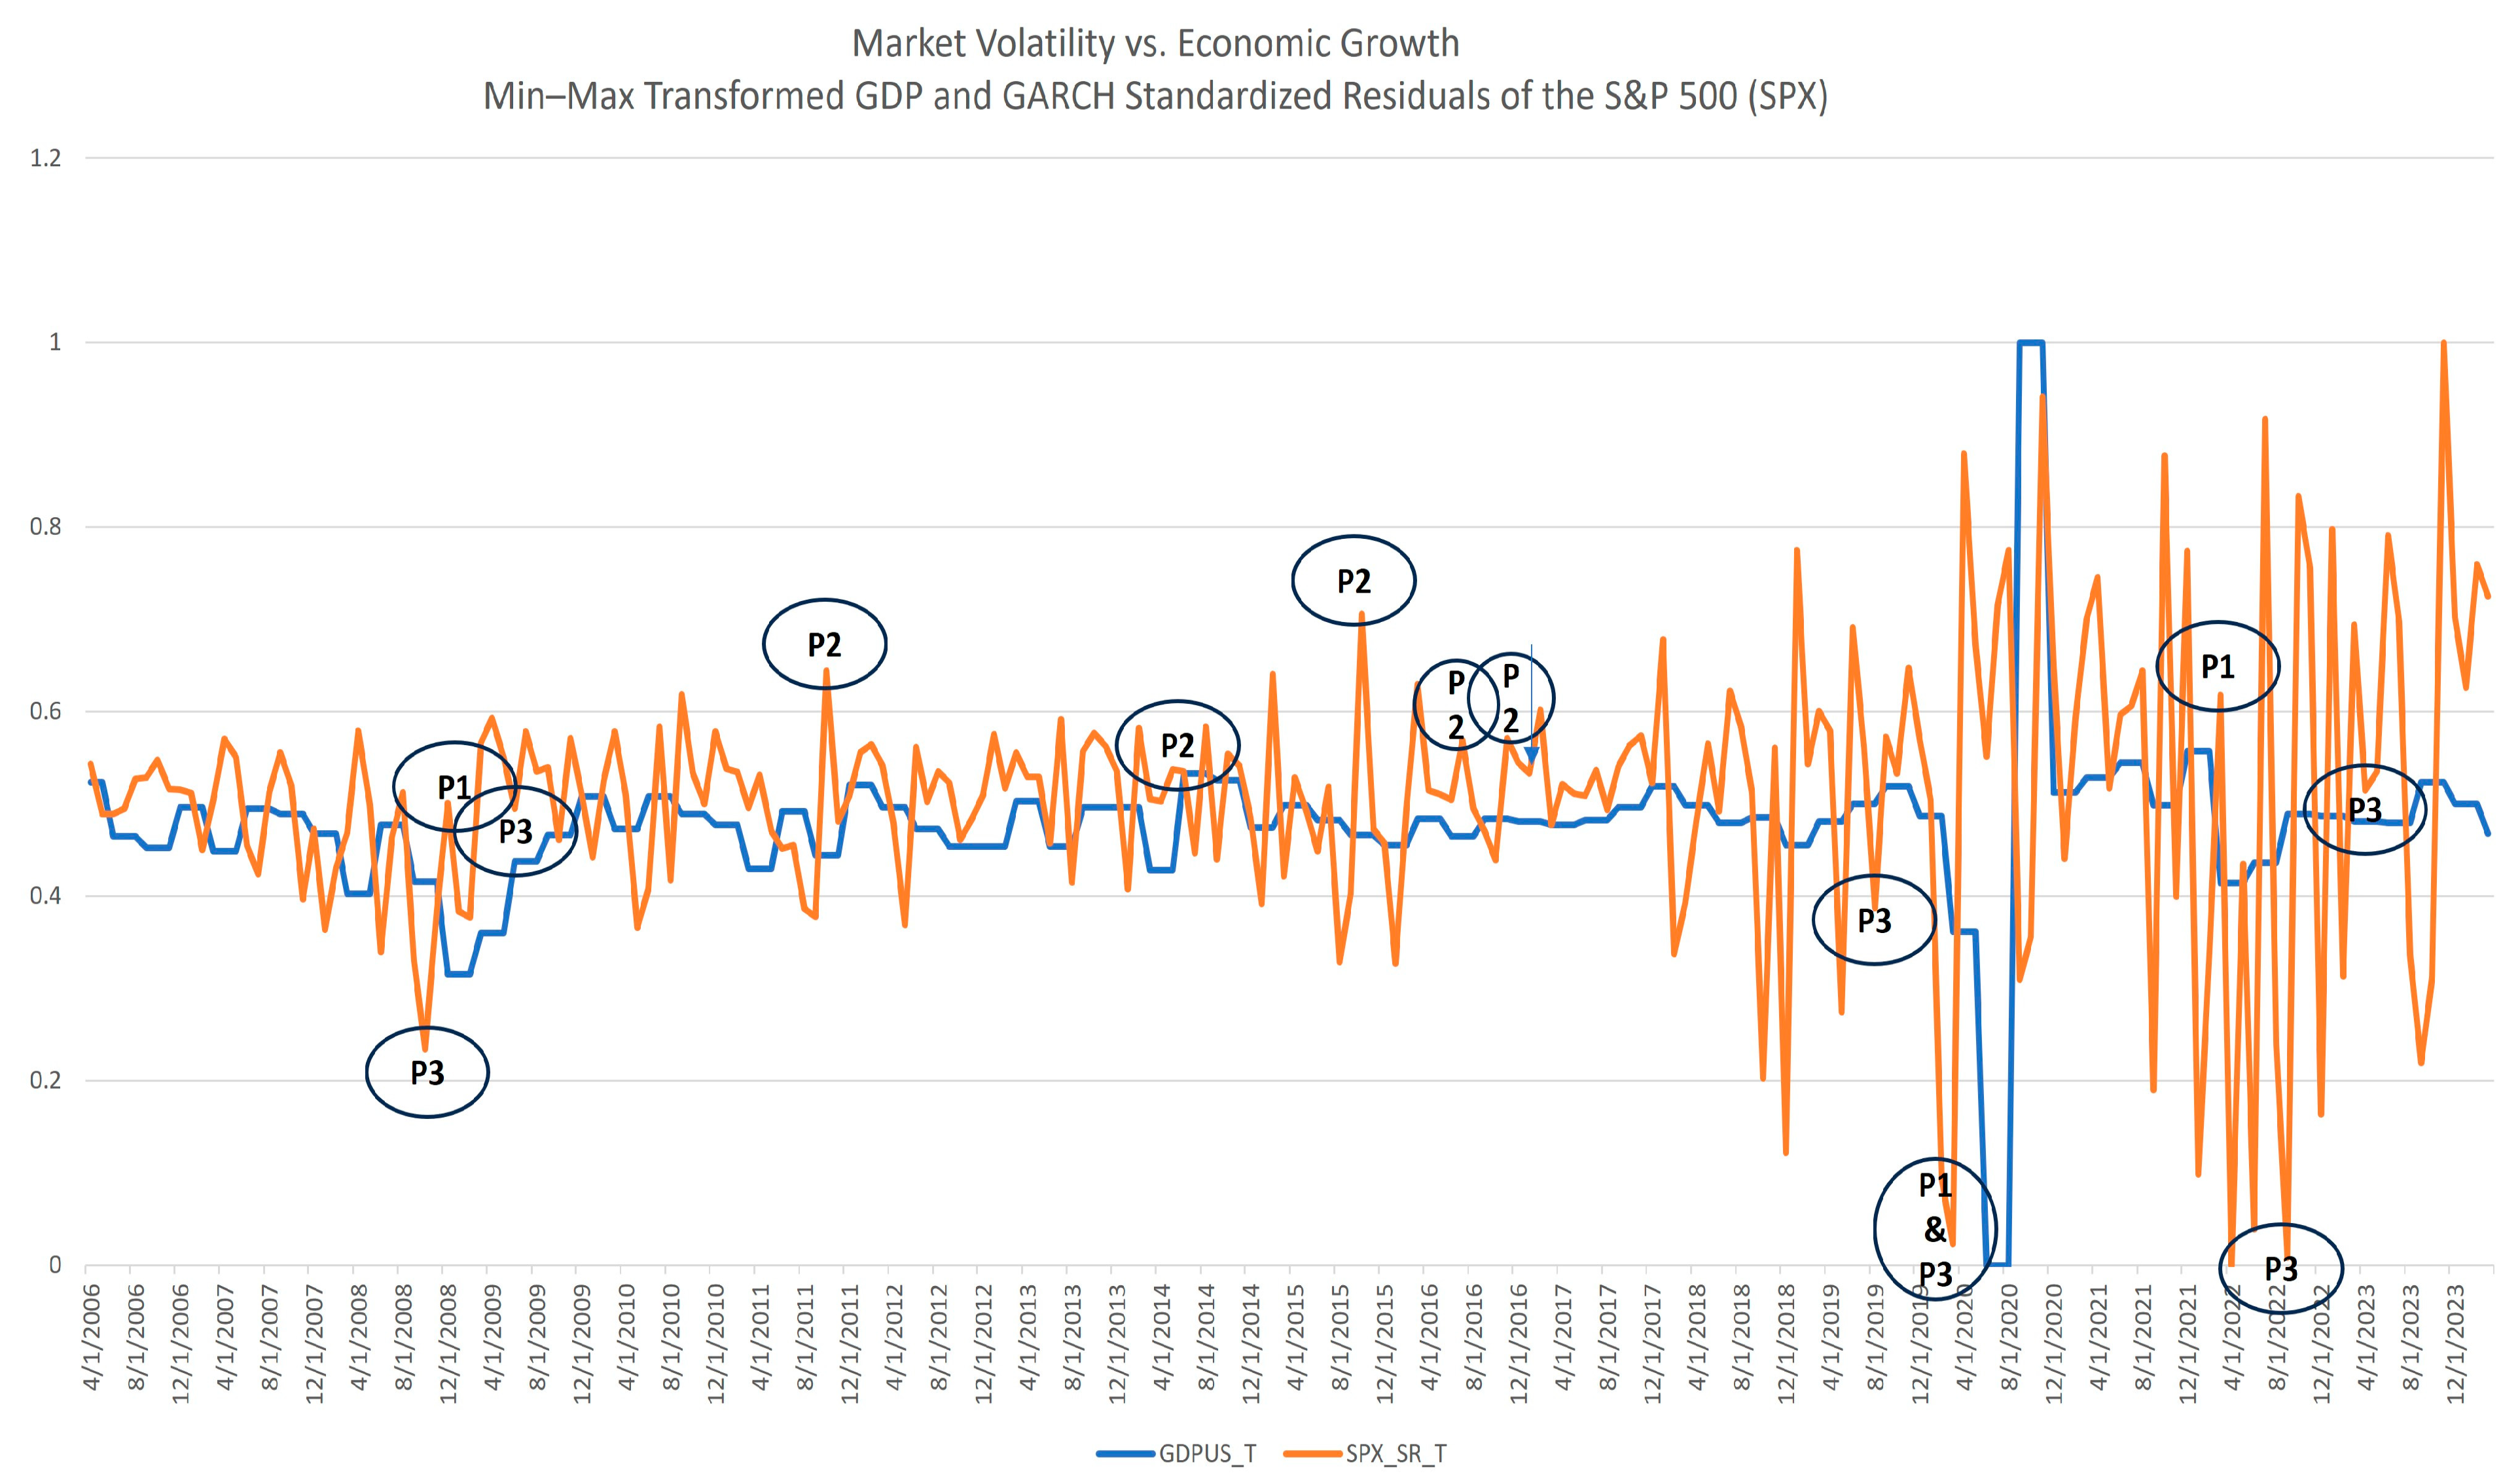
| 8 | SPX_SR_T | Min–max transformed standardized residual of SPX based on eGARCH (2,1) and ARFIMA (3,0,1). |
| 9 | GDPGB_T | Min–max transformed GDPGB. |
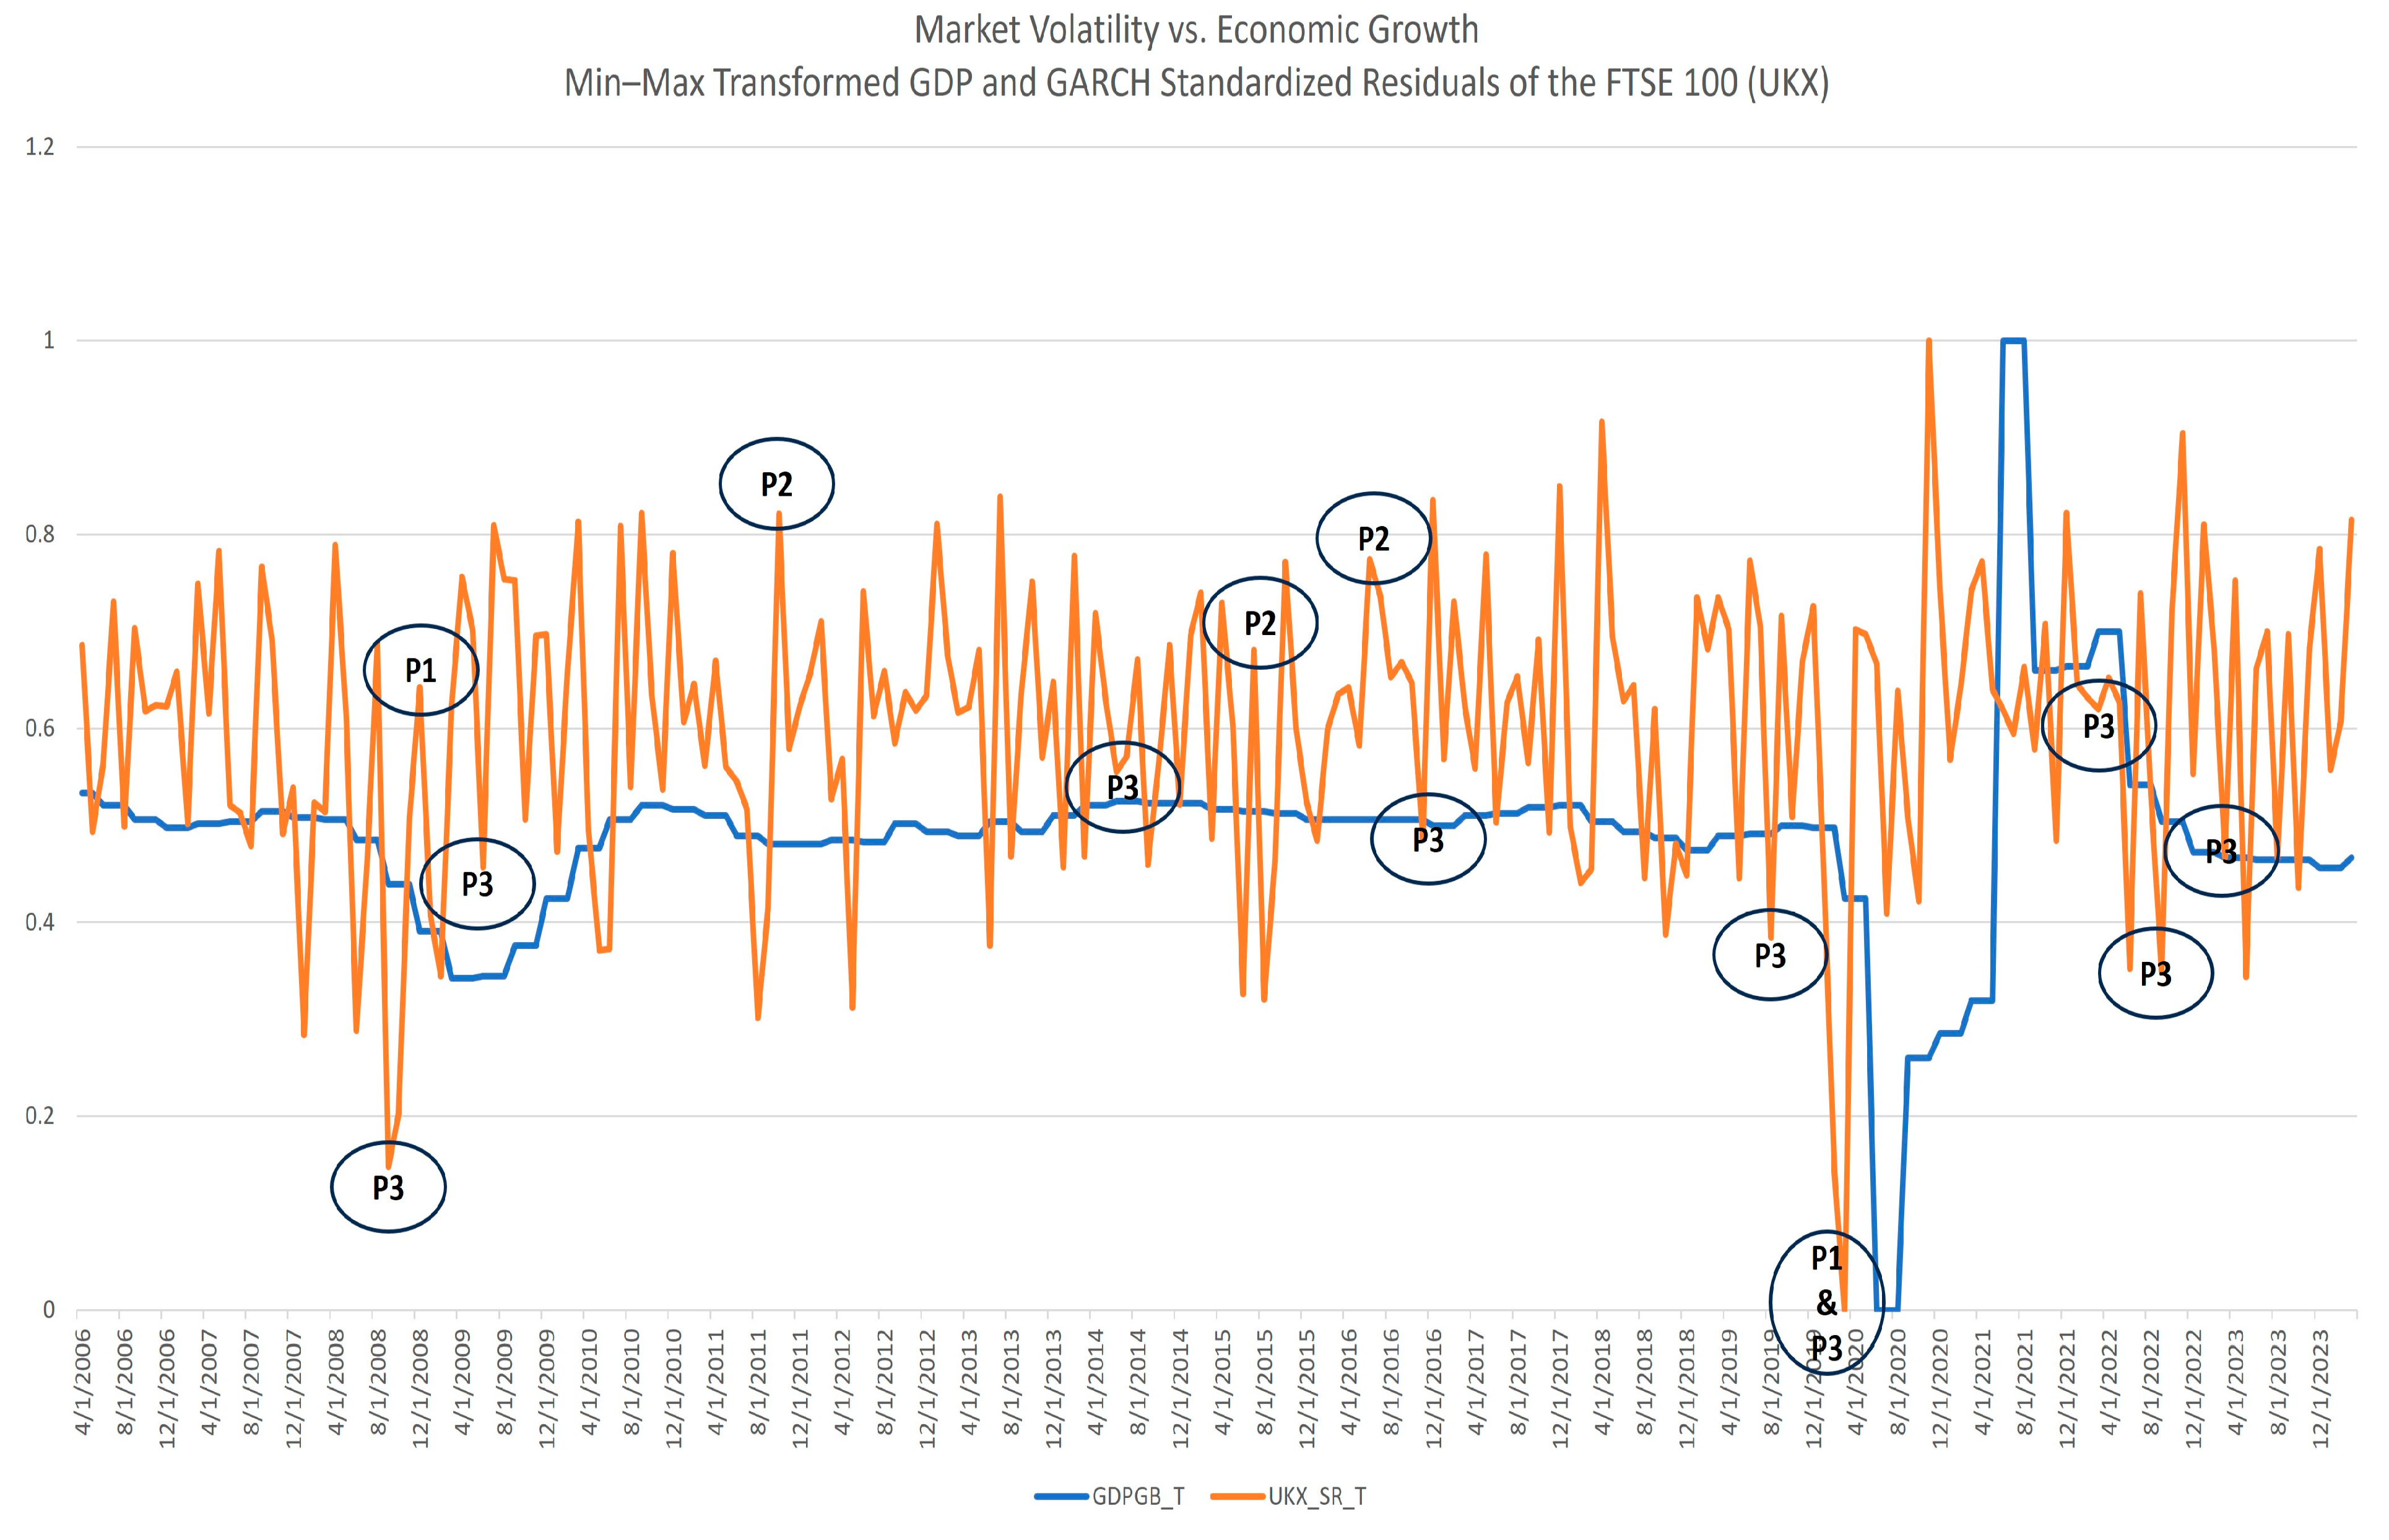
| 10 | UKX_SR_T | Min–max transformed standardized residual of UKX based on eGARCH (2,1) and ARFIMA (3,0,1). |
| 11 | GDPIN_T | Min–max transformed GDPIN. |
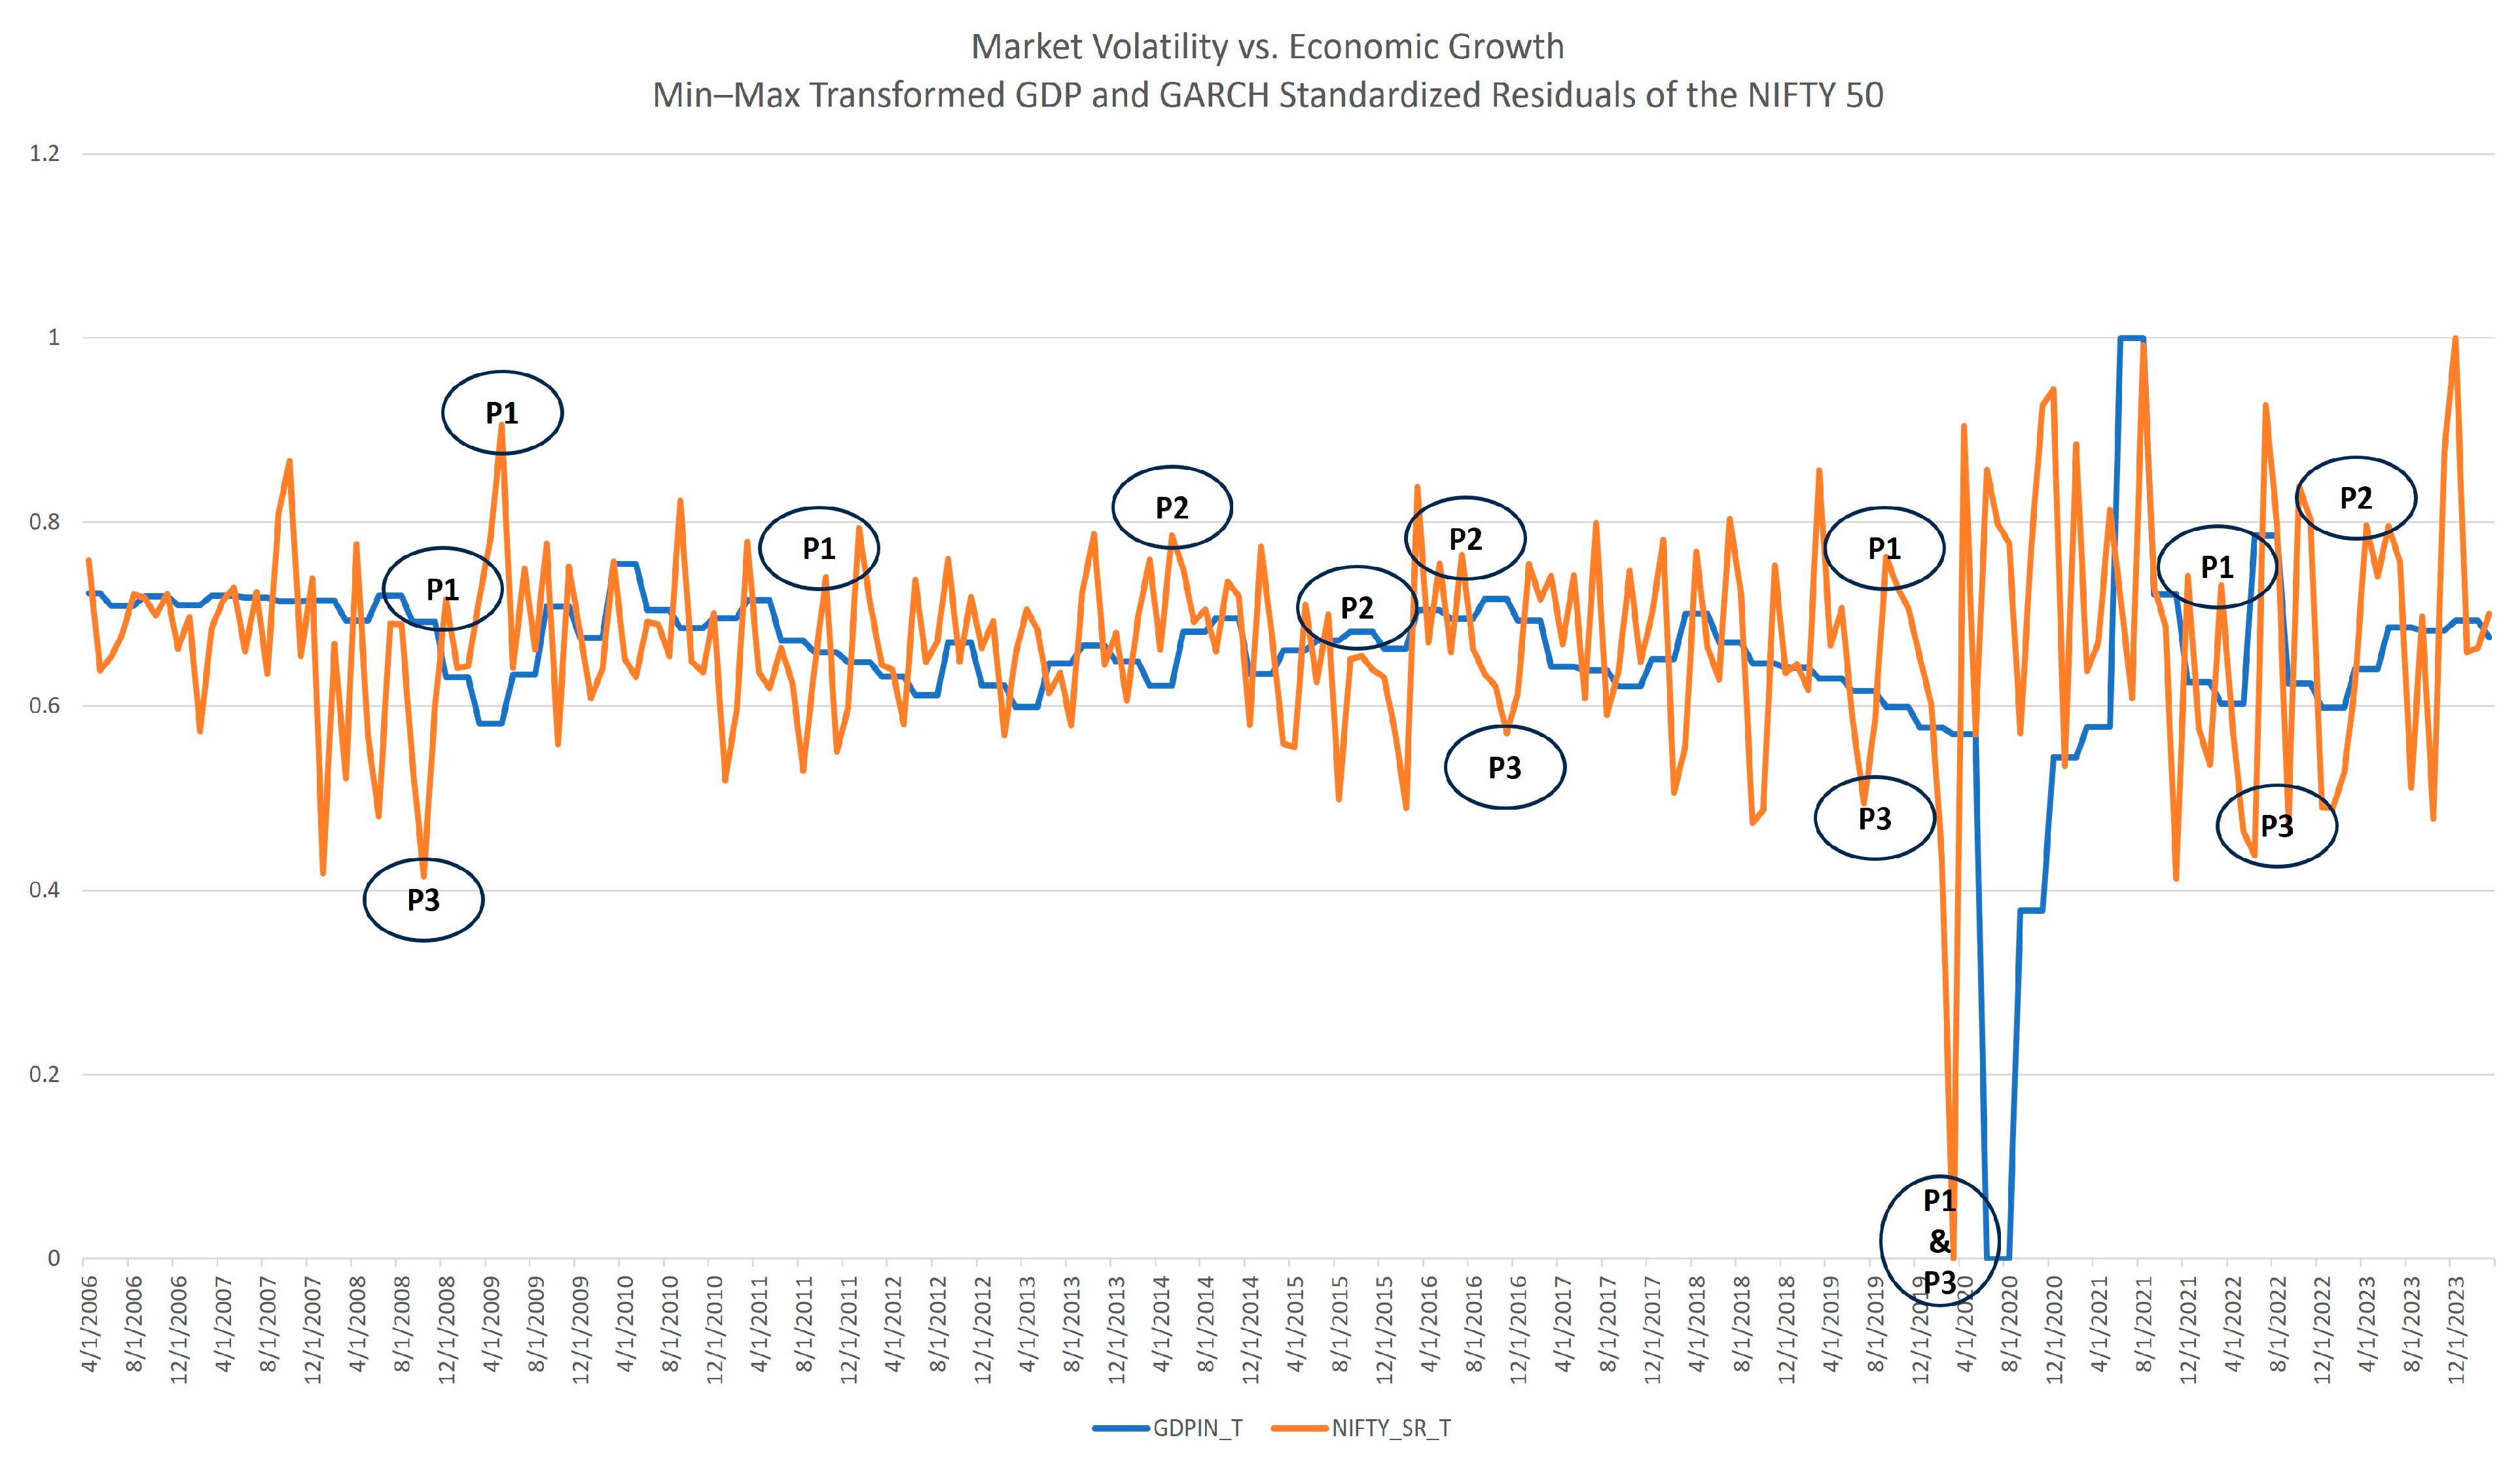
| 12 | NIFTY_SR_T | Min–max transformed standardized residual of NIFTY based on eGARCH (2,1) and ARFIMA (3,0,1). |
| GDPUS_T | SPX_SR_T | GDPGB_T | UKX_SR_T | GDPIN_T | NIFTY_SR_T | |
|---|---|---|---|---|---|---|
| Mean | 0.476962 | 0.509196 | 0.488426 | 0.601822 | 0.654952 | 0.669888 |
| Standard Error | 0.006324 | 0.010387 | 0.007315 | 0.010101 | 0.007112 | 0.007931 |
| Median | 0.482484 | 0.516874 | 0.502101 | 0.623942 | 0.667504 | 0.6651 |
| Mode | 0.496815 | N/A * | 0.506303 | N/A * | 0.692745 | N/A * |
| Standard Deviation | 0.09294 | 0.152653 | 0.10751 | 0.148457 | 0.104526 | 0.116556 |
| Sample Variance | 0.008638 | 0.023303 | 0.011558 | 0.02204 | 0.010926 | 0.013585 |
| Kurtosis | 21.5406 | 2.340556 | 11.52155 | 1.172003 | 21.60329 | 4.693334 |
| Skewness | 0.486687 | −0.40639 | 0.042541 | −0.67702 | −3.18787 | −0.72907 |
| Range | 1 | 1 | 1 | 1 | 1 | 1 |
| Minimum | 0 | 0 | 0 | 0 | 0 | 0 |
| Maximum | 1 | 1 | 1 | 1 | 1 | 1 |
| Sum | 103.0239 | 109.9864 | 105.5 | 129.9936 | 141.4696 | 144.6958 |
| Count | 216 | 216 | 216 | 216 | 216 | 216 |
| SPX | UKX | NIFTY | ||||||||||
|---|---|---|---|---|---|---|---|---|---|---|---|---|
| Estimate | Std. Error | t-Value | p-Value | Estimate | Std. Error | t-Value | p-Value | Estimate | Std. Error | t-Value | p-Value | |
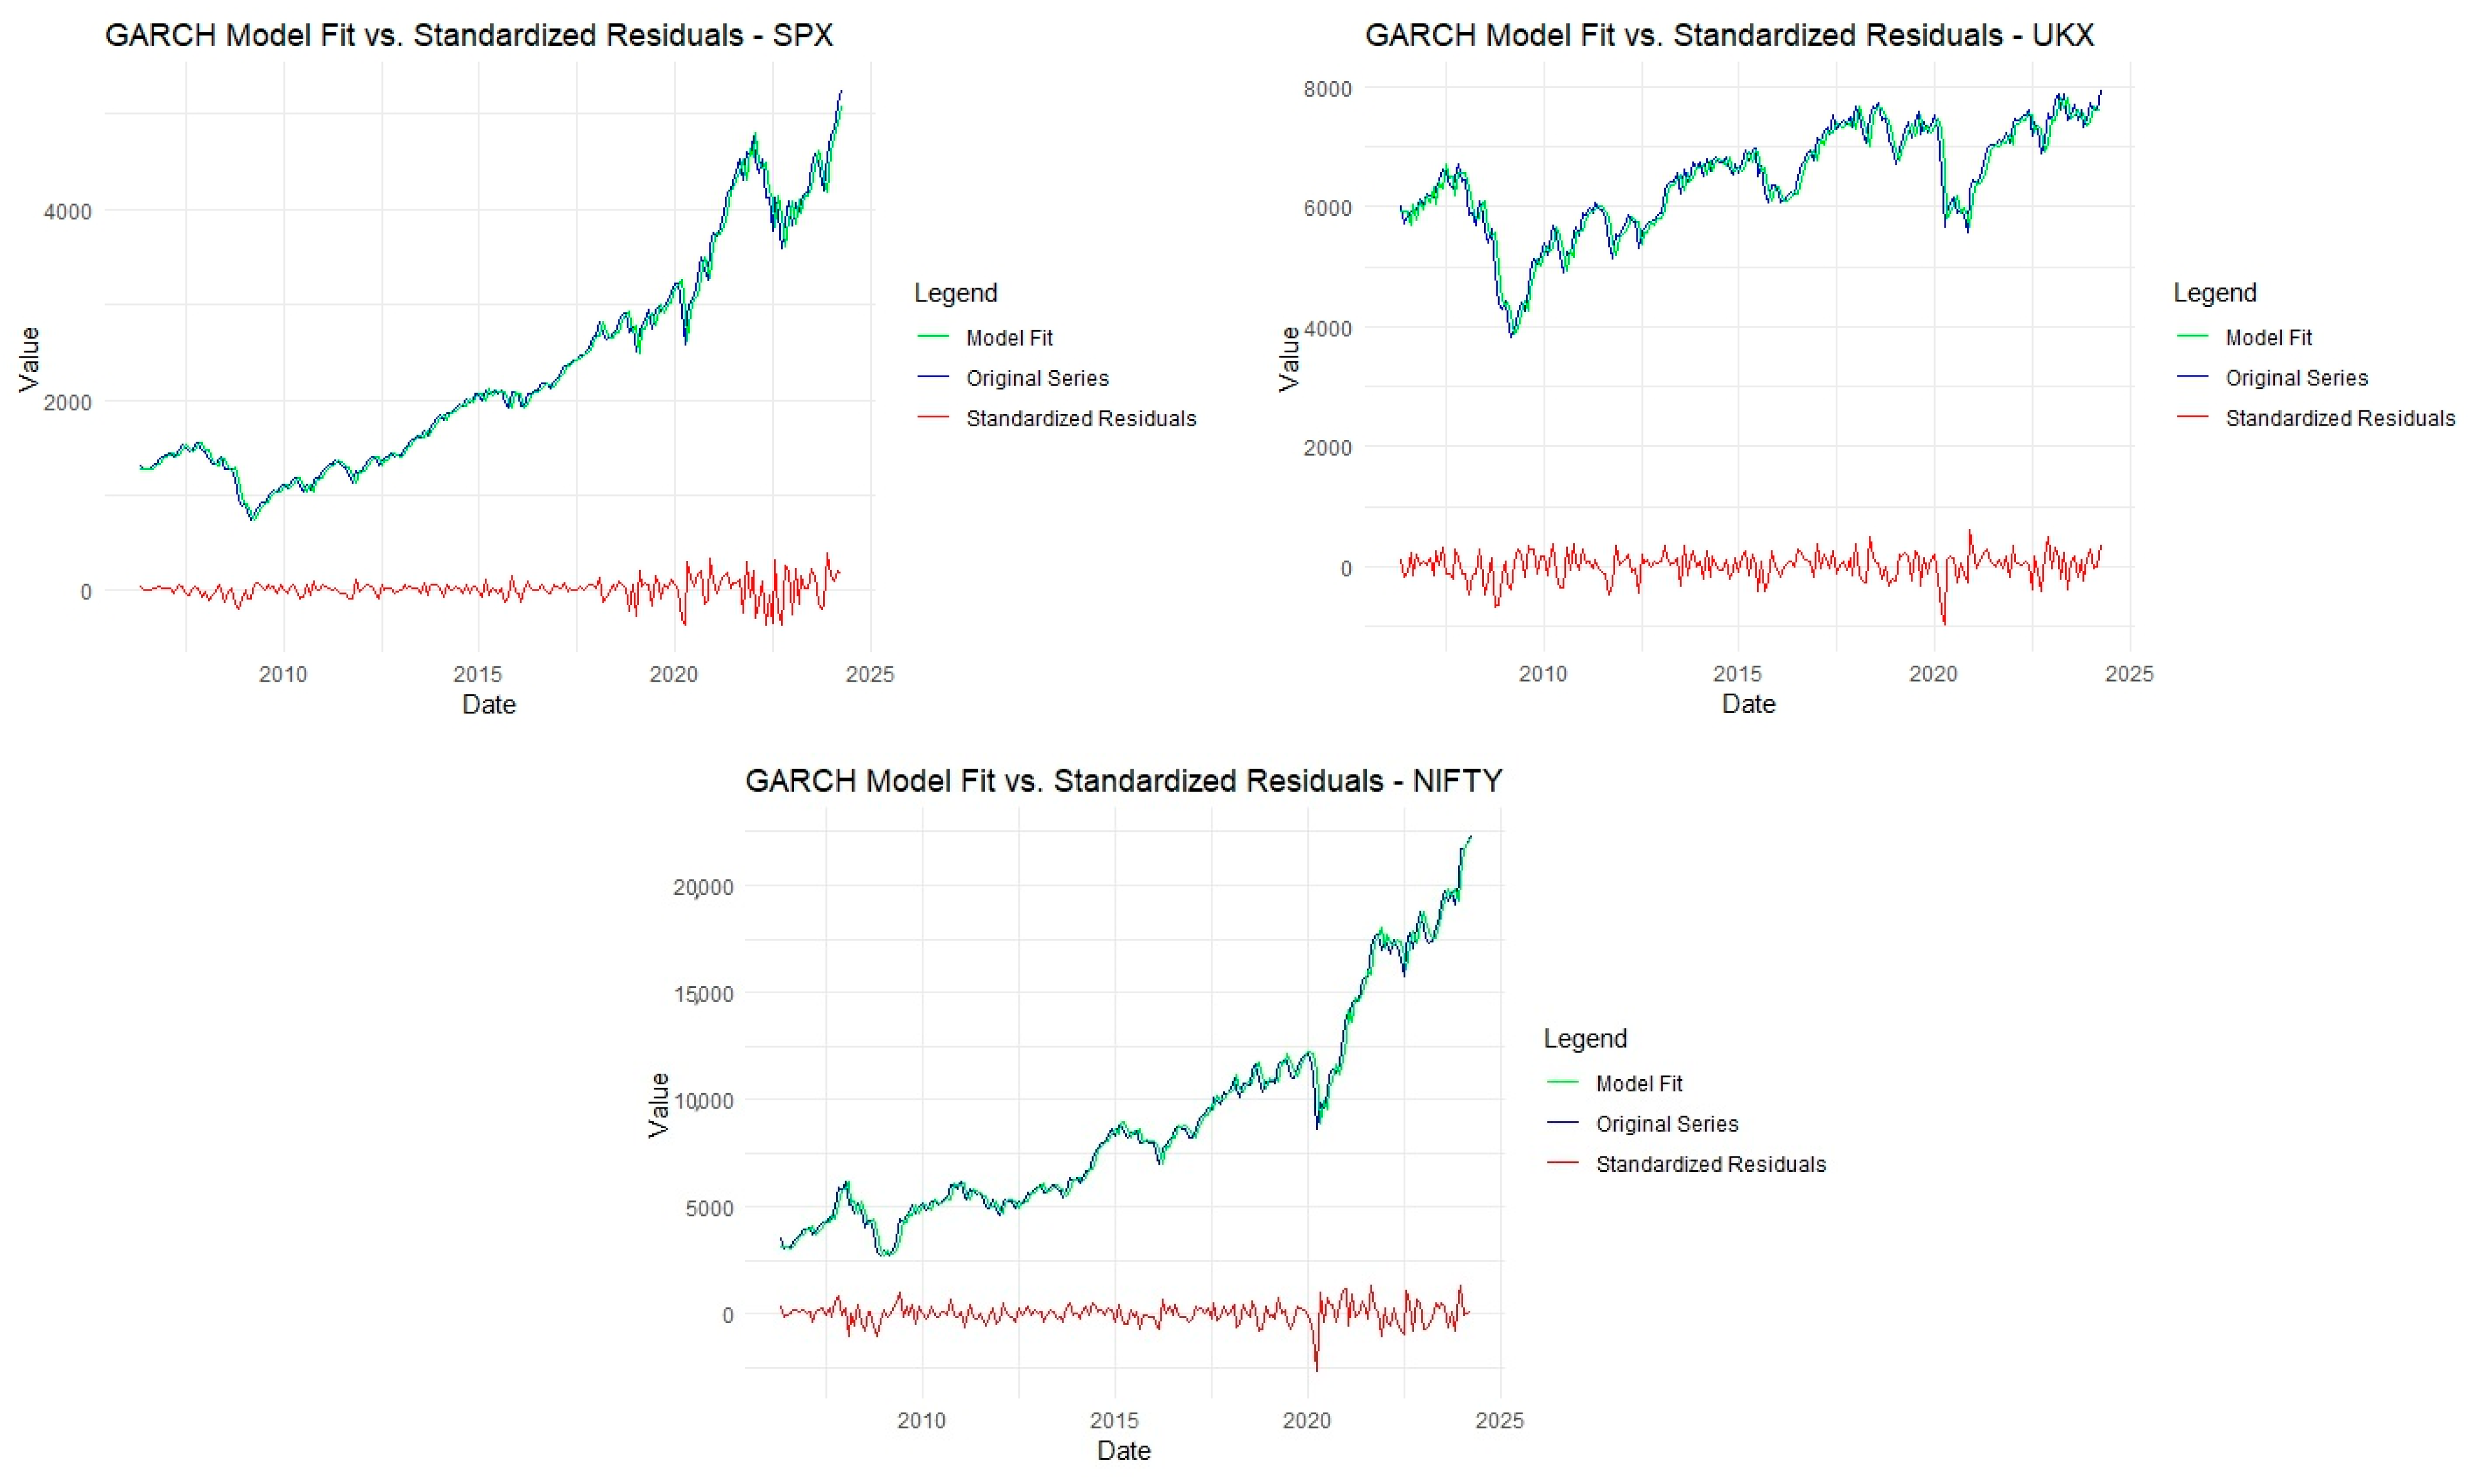
| mu | 1269.74 | 4.89 | 259.64 | 0.00 | 5871.09 | 43.47 | 135.05 | 0.00 | 3170.36 | 103.79 | 30.54 | 0.00 |
| ar1 | 0.02 | 0.04 | 0.36 | 0.72 | −0.04 | 0.06 | −0.69 | 0.49 | 0.01 | 0.00 | 2.17 | 0.03 |
| ar2 | 0.96 | 0.02 | 62.27 | 0.00 | 0.94 | 0.02 | 48.30 | 0.00 | 0.91 | 0.01 | 93.82 | 0.00 |
| ar3 | 0.03 | 0.05 | 0.69 | 0.49 | 0.07 | 0.06 | 1.10 | 0.27 | 0.11 | 0.01 | 14.09 | 0.00 |
| ma1 | 1.00 | 0.00 | 496.34 | 0.00 | 1.00 | 0.00 | 68,823.23 | 0.00 | 0.96 | 0.01 | 66.00 | 0.00 |
| omega | 0.26 | 0.06 | 4.21 | 0.00 | 8.06 | 0.71 | 11.39 | 0.00 | 0.12 | 0.01 | 15.10 | 0.00 |
| alpha1 | −0.46 | 0.10 | −4.71 | 0.00 | −0.53 | 0.11 | −4.96 | 0.00 | −0.28 | 0.11 | −2.65 | 0.01 |
| alpha2 | 0.48 | 0.11 | 4.43 | 0.00 | −0.16 | 0.12 | −1.35 | 0.18 | 0.31 | 0.11 | 2.73 | 0.01 |
| beta1 | 0.97 | 0.01 | 128.99 | 0.00 | 0.25 | 0.07 | 3.85 | 0.00 | 0.99 | 0.00 | 20,034.37 | 0.00 |
| gamma1 | 0.12 | 0.15 | 0.85 | 0.40 | −0.05 | 0.16 | −0.29 | 0.77 | 0.60 | 0.16 | 3.63 | 0.00 |
| gamma2 | 0.41 | 0.13 | 3.16 | 0.00 | 0.13 | 0.18 | 0.68 | 0.49 | −0.45 | 0.16 | −2.74 | 0.01 |
| SPX | UKX | NIFTY | |||||
|---|---|---|---|---|---|---|---|
| Test | Lag | Statistic | p-Value | Statistic | p-Value | Statistic | p-Value |
| Weighted Ljung-Box Test | Lag[1] | 0.9209 | 0.3372 | 0.439 | 0.5076 | 0.6754 | 0.4112 |
| Lag[2*(p+q)+(p+q)-1][11] | 5.6977 | 0.6831 | 3.518 | 1.0000 | 3.2310 | 1.0000 | |
| Lag[4*(p+q)+(p+q)-1][19] | 11.4383 | 0.2562 | 5.774 | 0.9787 | 9.7351 | 0.5129 | |
| Weighted ARCH LM Tests | ARCH Lag[4] | 1.388 | 0.2388 | 0.3023 | 0.5824 | 0.3629 | 0.5469 |
| ARCH Lag[6] | 2.254 | 0.4373 | 2.8136 | 0.3365 | 0.4850 | 0.8962 | |
| ARCH Lag[8] | 2.757 | 0.5899 | 4.0131 | 0.3735 | 3.2171 | 0.5036 | |
| Series | Causality Direction | F-Test | p-Value |
|---|---|---|---|
| SPX | Volatility does Granger-cause GDP_Growth | 4.5545 | 0.01105 |
| GDP_Growth does not Granger-cause Volatility | 0.0153 | 0.9848 | |
| UKX | Volatility does Granger-cause GDP_Growth | 11.3880 | 1.53 × 10⁻⁵ |
| GDP_Growth does not Granger-cause Volatility | 1.0588 | 0.3478 | |
| NIFTY | Volatility does Granger-cause GDP_Growth | 9.9916 | 5.777 × 10⁻⁵ |
| GDP_Growth does not Granger-cause Volatility | 0.2028 | 0.8165 |
| Month (Identified from the Plot) | Event | Price Change (%)/Proposition (US—S&P 500) | Price Change (%)/Proposition (UK—FTSE 100) | Price Change (%)/Proposition (INDIA—NIFTY 50) | Explanation |
|---|---|---|---|---|---|
| October 2008 | 2008 Global Financial Crisis | −16.94%/P3 | −10.71%/P3 | −26.41%/P3 | Loss aversion (P3) is evident across all regions, as investors overreacted to the financial crisis, triggering significant price drops. Despite the sharp declines in market prices, GDP growth was already on a downturn. Market volatility amplified the fear of economic downturn beyond the fundamentals. |
| December 2008 | 2008 Mumbai Attacks (India) | 0.78%/P1 | 3.75%/P1 | 7.41%/P1 | The herding behavior (P1) after the Mumbai attacks shows that despite the attacks being localized to India, all three regions exhibited a collective market reaction. The sharp price changes reflect heightened market volatility not aligned with GDP fundamentals but rather driven by fear and geopolitical risks. |
| May 2009 | 2009 Indian General Elections | 5.3%/P3 | 4.11%/P3 | 28.07%/P1 | Herding behavior (P1) in India led to an exaggerated price rise as investors speculated on political outcomes. In the US and the UK, despite a positive price change, the reaction reflects loss aversion (P3), with markets cautiously recovering, even though GDP growth remained stable post-elections. |
| October 2011 | 2011 Eurozone Debt Crisis | 10.77%/P1 | 8.11%/P2 | 7.76%/ P1 | Despite ongoing concerns about the Eurozone, markets reacted positively in October 2011 due to optimism surrounding bailout agreements and coordinated policy actions to stabilize the region. Herding behavior (P1) in the US and India drove market gains, whereas confirmation bias (P2) in the UK reflected relief from policy interventions. |
| May 2014 | 2014 Modi Government in India | 2.1%/P2 | 0.95%/P2 | 7.97%/P2 | Across all three markets, confirmation bias (P2) prevailed, as investors reacted optimistically to the anticipated pro-business policies of the new Indian government. Despite relatively stable GDP growth, the market movements were driven more by sentiment and expectations than by economic fundamentals. |
| October 2015 | 2015 Paris Climate Agreement | 8.3%/P2 | 4.94%/P2 | 1.47%/P2 | In all regions, confirmation bias (P2) drove market volatility, as investors speculated on the long-term impact of climate change policies. Despite this significant policy event, GDP growth remained stable, and the market reaction was based on expectations rather than immediate economic changes. |
| July 2016 | 2016 Brexit Vote (UK) | 3.56%/P2 | 3.38%/P2 | 4.23%/P2 | The Brexit vote caused volatility across global markets, driven by confirmation bias (P2), as investors reacted to the uncertainty surrounding the UK’s departure from the EU. Despite GDP growth not being immediately affected, the markets anticipated long-term economic disruptions, leading to increased volatility. |
| November 2016 | 2016 US Presidential Election (Trump) | 3.48%/P2 | −2.45%/P3 | −4.65%/P3 | In the US, confirmation bias (P2) led to a positive market reaction, as investors speculated on Trump’s pro-business policies. However, in the UK and India, loss aversion (P3) drove volatility, as investors reacted negatively to the political uncertainty and potential global economic implications. |
| August 2019 | 2019 India Revokes Article 370 | −1.81%/P3 | −5%/P3 | −0.85%/4.09% (September) P3/P1 | Loss aversion (P3) prevailed in the US, the UK, and India in August, as investors overreacted to the political risks posed by Article 370. However, in India, herding behavior (P1) took over in September, leading to a market rebound as investors speculated on the longer-term effects of the decision on the economy. |
| March 2020 | COVID-19 Pandemic (2020) | −12.51%/P1 & P3 | −13.81%/P1 & P3 | −23.25%/P1 & P3 | The COVID-19 pandemic led to sharp declines in all markets driven by herding behavior (P1) and loss aversion (P3), as investors globally panicked. The immediate price drops were much larger than warranted by GDP declines, indicating an exaggerated reaction to the uncertainty posed by the pandemic. |
| March 2022 | Russia–Ukraine War (2022) | 3.58%/P1 | 0.77%/P3 | 3.99%/P1 | Herding behavior (P1) is observed in the US and India, as investors reacted strongly to the geopolitical uncertainty caused by the war. In the UK, loss aversion (P3) is evident, as investors were more risk-averse, reflecting concerns about energy prices and the broader economic impact of the conflict. |
| September 2022 | 2022 Inflation and Energy Crisis | −9.34%/P3 | −5.36%/P3 | −3.74%/P3 | Across all three regions, loss aversion (P3) dominates as investors overreact to rising inflation and energy crises, driving significant price declines. Despite the short-term market volatility, the long-term GDP impact remained limited, indicating an exaggerated market reaction to these events. |
| April 2023 | 2023 India Overtakes China’s Population | 1.46%/P3 | 3.13%/P3 | 4.06%/P2 | In the US and the UK, loss aversion (P3) caused moderate market volatility, as investors speculated on the global economic implications of India’s population growth. In India, confirmation bias (P2) drove the market reaction, as investors viewed the demographic shift positively, anticipating long-term economic benefits. |
Disclaimer/Publisher’s Note: The statements, opinions and data contained in all publications are solely those of the individual author(s) and contributor(s) and not of MDPI and/or the editor(s). MDPI and/or the editor(s) disclaim responsibility for any injury to people or property resulting from any ideas, methods, instructions or products referred to in the content. |
© 2024 by the authors. Licensee MDPI, Basel, Switzerland. This article is an open access article distributed under the terms and conditions of the Creative Commons Attribution (CC BY) license (https://creativecommons.org/licenses/by/4.0/).
Share and Cite
Parashar, N.; Sharma, R.; Sandhya, S.; Joshi, A. Market Volatility vs. Economic Growth: The Role of Cognitive Bias. J. Risk Financ. Manag. 2024, 17, 479. https://doi.org/10.3390/jrfm17110479
Parashar N, Sharma R, Sandhya S, Joshi A. Market Volatility vs. Economic Growth: The Role of Cognitive Bias. Journal of Risk and Financial Management. 2024; 17(11):479. https://doi.org/10.3390/jrfm17110479
Chicago/Turabian StyleParashar, Neha, Rahul Sharma, S. Sandhya, and Apoorva Joshi. 2024. "Market Volatility vs. Economic Growth: The Role of Cognitive Bias" Journal of Risk and Financial Management 17, no. 11: 479. https://doi.org/10.3390/jrfm17110479
APA StyleParashar, N., Sharma, R., Sandhya, S., & Joshi, A. (2024). Market Volatility vs. Economic Growth: The Role of Cognitive Bias. Journal of Risk and Financial Management, 17(11), 479. https://doi.org/10.3390/jrfm17110479

