1. Introduction
We investigate whether cryptocurrency forks, which are similar to corporate spin-offs, are wealth-enhancing. A cryptocurrency fork occurs when a single crypto splits, with two currencies trading after. Forks have largely been due to a conflict of priority between speed and security on the blockchain. The mining and crypto development community can initiate a fork, and once enough people start using the forked blockchain, the new cryptocurrency gains popularity and increases in value. However, forks make the limited supply of cryptos, one of the main factors of their value, somewhat uncertain. Can cryptos keep forking?
We investigate whether cryptocurrency forks, like corporate spin-offs, are wealth-enhancing. A corporate spin-off involves the distribution by one parent firm of its ownership interest in a subsidiary to the parent’s shareholders so that, following the spin-off, there are two separately traded companies. If firms undertake spin-offs voluntarily, the managers of these firms must expect that the aggregate value of the two firms post-spin-off will be greater than the value of the one firm prior to the spin-off.
Miller (
1977) argues that the source of this increase in portfolio value is divergence in opinion among investors, including both shareholders and non-shareholders of the parent, regarding the relative values of the parent’s constituent parts.
Kudla and McInish (
1988) present evidence that the increase in the value following the spin-off of the portfolio comprising the two firms is directly related to a divergence of opinion about the value of the two parts. When a fork occurs, the owner still owns the parent cryptocurrency and also owns the new one, which leads us to the following questions: How much agency cost is involved in cryptocurrency forks? Why would developers acting as managers not initiate forks? Are there price run-ups before the forks? And are these gains short-term?
2. Literature Review
A divergence of opinions among the developer community members leads to the creation or fork of cryptocurrencies. There is a close linkage between cryptocurrency forks and corporate spin-offs.
Miller (
1977) states that if substantial numbers of investors have different opinions about the return distribution of shares, in the absence of short selling, voluntary corporate spin-offs increase shareholders’ wealth.
Kudla and McInish (
1988) investigate the divergence of opinions of corporate spin-offs and find that the combined value of the parent and spun-off firm is usually more valuable than that of the parent company prior to the spin-off due to different opinions about the components of a company. These authors give an example similar to this. Suppose that a company’s price is USD 46. Potential investors who think part A is worth USD 40 and part B is worth USD 4 would not invest in the company. This is likewise true for potential investors who think part A is worth USD 10 and part B is worth USD 35. While the company is trading intact at a price of USD 46, neither type of investors would buy the company, and also, there is little incentive to short the company’s stock. But if the company did a spin off, dividing the company into two parts, assuming that there are sufficient numbers of buyers, part A would be bid up to USD 40 and part B would be bid up to USD 35 so that the portfolio would be worth USD 75.
Market reactions for corporate spin-offs are generally positive in the short run, while the long-term impacts are less clear.
Hite and Owers (
1983) investigate 123 voluntary spin-offs and find positive gains in the two-day interval surrounding the announcement that they found positive excess returns for all groups.
Schnabel (
1992) uses Miller’s model to examine closed-end funds and finds that short sales constraints induce value subadditivity.
Krishnaswami and Subramaniam (
1999) find that the value of independently traded units increases due to spin-offs because it reduces information asymmetry about the firm. These authors find that firms that engage in spin-offs have higher levels of asymmetric information and that gains are higher for firms with more information asymmetry.
Banerjee and Kremer (
2010) examines the degree of investor disagreement and find a positive correlation between volume and volatility when investors disagree substantially.
Cusatis et al. (
1993) show that both spin-offs and their parents experience significantly positive abnormal returns for up to three years beyond the spin-offs’ announcement date.
Chemmanur and Yan (
2004) dissect this effect and find that almost all spin-offs have positive announcement effects, but only after a takeover are long-term positive abnormal returns present.
Studies have shown that focus-increasing spin-offs perform better. In general, cryptocurrency forks enable the developer community to choose which cryptocurrency they like and focus on those accordingly. The dedicated efforts are good news to the market and therefore drive up returns.
Desai and Jain (
1999) find that focus-increasing spin-offs have greater long-run abnormal returns than other spin-offs.
Veld and Veld-Merkoulova (
2004) validate
Desai and Jain’s (
1999) findings by looking at spin-offs in European markets from 1987 to 2000, using a 3-day event window, and find that the cumulative average abnormal returns of spin-offs that increase focus are 4.57%, while non-focus-increasing companies only experience an abnormal return of 0.67%. However, they do not find a better long-run performance.
Kim (
2012) uses
Banerjee and Kremer (
2010) to investigate differential interpretations of spinoff announcements and finds that when short-sales constraints are binding, the demand curve is downward-sloping and the slope increases with the level of investor disagreement regarding the firm value.
Vijh (
1994) looks at spin-off ex dates and finds that the average excess return on ex dates is roughly the same size, about 3%, as the average announcement date returns. Unlike U.S. equities, there is minimal settlement time with cryptocurrencies, so we also analyze both hours and minutes before forks.
3. Hypotheses
We study Bitcoin–Bitcoin Cash and Ethereum–Ethereum Classic forks and find that forks more often bring in new people rather than split the community in two, similar to the findings of
Kudla and McInish (
1988).
In our study, most of the forks are over a disagreement of investors’ needs and preferences of transaction speed vs. security, and once investors are able to invest more specifically in the feature that interests them, they are able to be more precisely valued and consequently priced, as indicated by less volume.
With less centralized decision-making, forks are more likely to occur and provide value.
Azouvi et al. (
2019) find that the levels of centralization of governance for Ethereum and Bitcoin differ. By web scraping open-source-code bases and improvement proposals, these authors find that a handful of individuals—at the most, 18 for the cryptos in their study—account for a majority of the design improvement suggestions. Examining forks of Ethereum and Bitcoin, these authors find that there is little intersection between the currencies’ original communities and the individuals instigating forks.
Azouvi et al. (
2019) note that votes on decisions such as forks are proportional to the users’ computational power rather than per person, which explains why decisions are made by a small fraction of the overall participants. Relative to Bitcoin, they find that Ethereum is more centralized for improvement proposals.
3.1. Value Hypotheses
When investigating the divergence of opinions of corporate spin-offs,
Kudla and McInish (
1988) find that the sum of two parts of a company is usually more valuable than the company as a whole; we expect the sum of the value of the original cryptocurrency and the new cryptocurrency that iss a product of a fork to have a higher value than the original cryptocurrency. In addition,
Kudla and McInish (
1988) find that involuntary spin-offs reduce wealth. These findings lead us to the following hypotheses:
H1. The total value before a fork is the same as its total value after a fork; H1b: Voluntary forks provide the same benefits as forced forks.
H2. Returns are greatest the day following the fork.
H3. The wealth gains from forks are short-lived.
3.2. Information Asymmetry/Volume/Microstructure Hypotheses
Banerjee and Kremer (
2010) finds that volume and volatility are positively correlated when investors disagree substantially. We expect the divergence of opinions to decrease following forks, leading us to the following hypotheses:
H4a. Volume decreases following a fork.
H4b. Price volatility decreases following a fork.
3.3. Agency Cost Hypotheses
H5a. There is not a price run-up before forks occur.
H5b. The percentage of miner ownership does not affect the shareholders’ returns following a fork.
4. Forks Background
Bitcoin (Voluntary) Forks
Bitcoin (BTC)–Bitcoin Cash (BCH), 1 August 2017
Bitcoin (BTC)–Bitcoin Gold (BTG), 24 October 2017
Bitcoin (BTC)–Bitcoin Diamond (BCD), 24 November 2017
Bitcoin Cash (BCH)–Bitcoin SV (BSV), 15 November 2018
Bitcoin (BTC)–Bitcoin cash (BCH): All holders of Bitcoin received an equal amount of BitcoinCash and retained their ownership in Bitcoin. Bitcoin cash was developed to allow larger blocks to improve the processing speed. Many said the larger block size was necessary if Bitcoin was to act as a currency rather than an investment, since one of the major strengths of Bitcoin is supposed to be the short processing time.
Bitcoin Cash split into Bitcoin ABC and Bitcoin SV on 15 November 2018. Bitcoin ABC maintained the block size of 32MB, while Bitcoin SV increased the block size to 128 MB. At the split, investors holding Bitcoin cash then owned one share of Bitcoin Cash SV and one share of Bitcoin Cash ABC for each share of Bitcoin Cash. Bitcoin ABC was upgraded to support smart contracts with an adjustable block size (ABC) and plans to eliminate a block limit in the future. Bitcoin SV, however, was built as “Satoshi’s Version” and designed with the aim of being a global currency, more in line with Satoshi’s original plan, and a platform for Bitcoin. Since splitting bitcoin cash into two parts, the two versions have been in competition, as miners can choose which type they prefer to be rewarded with and will in turn mine on that blockchain. In June 2019, Bitcoin SV doubled in value, while Bitcoin ABC, now referred to as Bitcoin Cash, stayed relatively flat.
Bitcoin Gold (BTG) was created to grant users with lower-quality graphic processing units the ability to mine. This was done because Jack Liao, a Hong Kong CEO, felt that too few people controlled the existing blockchain. To alleviate this, the barrier to entry must be reduced for miners. Once again, all owners of Bitcoin received an equal share of Bitcoin gold.
Bitcoin Diamond (BCD) was created to have a better transaction processing speed due to the larger 8mb blocks, which can process 100 transactions per second. It also added improved security and larger scalability. Ten shares of Bitcoin diamond were distributed to every holder of Bitcoin.
Litecoin (LTC) was built off the Bitcoin protocol, but transactions are generally smaller, cheaper, and much faster than Bitcoin transactions. It was invented primarily for speed improvement to make paying with a crypto around two and a half minutes per block rather than ten minutes with cryptos. If you were trying to buy something peer-to-peer, this transaction speed increase is a huge difference. Litecoins were not distributed to existing holders of any crypto but were rather earned by miners.
Digibite (DGB) prioritizes security and scalability and has a maximum supply of 21 million like Bitcoin. It is used to facilitate transactions and as fuel to validate smart contracts.
Dogecoin (DOGE) has an unlimited supply and is decentralized, similar to its parent cryptocurrency Bitcoin, which has a very decentralized ownership. It was estimated that 0.002% of wallets hold two-thirds of all Dogecoins.
Dash was built off the Bitcoin protocol, but transactions take only 1.85 s, and the dash offers improved security.
Ripple (XRP) allows for global transactions in 3–5 s on an open source. They call miners validators, 6 of 36 of which are ran internally by Ripple. The Ripple network handles 1500 transactions per second, similar to the VISA network. In comparison, Bitcoin handles five transactions per second, which is one of Bitcoin’s major criticisms.
Stellar (XLM) provides a common network for sending tokens and fiat currencies, using the XLM token to send these transactions. It is more decentralized than its parent token Ripple.
Ravencoin (RVN) is a fork of Bitcoin and is also limited to a supply of 21 million, offers a fast block time of 1 min, and had no ICO, so there is not a large portion owned by its creators.
Polygon (MATIC) is a fork of Ethereum and offers much faster processing times while also offering lower processing fees. It has an interconnected blockchain network to help with flexibility and governance.
Forced Fork
Ethereum Classic–Ethereum, 20 July 2016
Ethereum–Ethereum Classic split Decentralized Autonomous Organization (DAO) was a decentralized venture capital group that people invested in using Ether to fund Ethereum decentralized applications, which acted as voting rights for future applications. Once an application received 20% of the vote, it would be developed. When investors wanted to get out of their equity stake in DOA, they would request the splitting function and would receive ether, but there was a flaw in the code where a hacker was able to make the same request multiple times for the same token. On 17 June 2016, this unknown person exploited this error until they had taken around USD 50 million of the USD 150 million the DOA had raised in capital, which was 14% of all outstanding Ether at the time. After this setback, the majority of stakeholders voted to build a new blockchain, which is what is currently being used for Ethereum. Those who wanted could continue using the old blockchain, which is now known as Ethereum Classic.
Hard Fork–Block Reward Reduction
Constantinople upgrade Ethereum, 28 February 2019
Other Cryptocurrency forks (in the top 100 market caps as of March 2021)
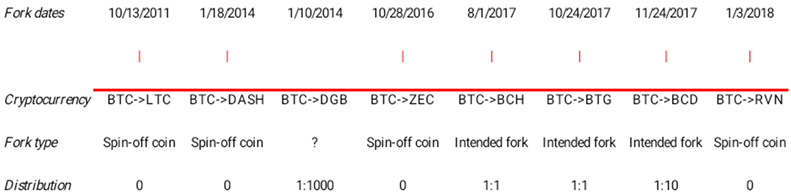
| Fork Dates | 6 Dec 2013 | 5 Aug 2014 | 20 Jul 2016 | 15 Nov 2018 | 20 Mar 2019 | 29 Apr 2019 | 27 Aug 2020 |
| | | | | | | | | | | | | | |
| Cryptocurrency | LTC->DOGE | XRP->XLM | ETH->ETC | BCH->BSV | BTC-THETA->TFUE L | ETH->MATIC | UNI->SUSHI |
| Fork type | Spin-off coin | Spin-off coin | Involuntary fork | Intended fork | Intended fork | Spin-off coin | Intended fork |
| Distribution | 0 | 0 | 1:1 | 1:1 | 1:5 | 0 | 0 |
5. Data
We obtain market capitalization data from coinmarketcap.com for all our cryptocurrencies and from tradingview.com for cryptocurrency total volumes. We cross-check the market cap data with the exchange-specific price data of exchanges regulated by the U.S. Department of Treasury by using data provided by bitcoincharts.com. Outstanding shares are consistent across sources due to the nature of Bitcoin’s growth algorithm. To double-check the price data on bitcoincharts.com, we examine the complete history of Bitcoin, Ether, and Bitcoin Cash transactions on the Bitstamp Exchange. These data are proprietary and provided directly by the London office of the Bitstamp exchange.
6. Methodology
To compute market capitalization, we use the data provided by coinmarketcap.com and confirm it is reasonable by using the prices of actual transactions on the Bitstamp Exchange multiplied by outstanding shares.
We confirm that the percentage changes in the market cap, volume, and volatility are similar for the aggregated market data provided by coinmarketcap.com to the percentage changes on Bitstamp data, which are regulated by the U.S. Department of Treasury and by the State of New York. Bitstamp is among the primary exchanges used in pricing CME futures contracts, along with setting the Bloomberg Bitcoin Index Price.
Bitwise Asset Management (
2019) and
Jain et al. (
2019) show that it is especially important to use data from strictly regulated exchanges when setting an index or conducting an analysis based on bitcoin price and volume, as cryptocurrency prices among unregulated exchanges vary greatly, and quoted prices can deviate greatly from regulated exchanges.
We test the effects of forks on the market cap, return, volume, and volatility for 7-day and 30-day windows around both the fork date and the first day of trading for the new crypto, as they are not always the same.
7. Results
When examining the top 100 cryptocurrencies in terms of market cap on 21 March 2021, we find that 15 of the largest cryptos are products of forks, 8 of which are from Bitcoin or its child fork Bitcoin Cash. Some forks result in the distribution of the new cryptocurrency to the holder of the parent, while others are solely earned by miners, sold using an ICO, or airdropped.
We only include cryptos that rewarded child cryptos to the original owners because they compare more closely to corporate spin-offs. These cryptos are more comparable to the divergence of opinion in
Miller (
1977) and voluntary spin-offs in
Kudla and McInish (
1988).
Of the cryptos that are products of Bitcoin forks and rewarded to current holders, not only did the new crypto add value, but the parents’ value also increased. This makes it clear that planned Bitcoin forks increase the total wealth for investors. We attribute this to the forks being planned, and miners who are managers and shareholders only choose to fork if they expect the value of the coin to increase.
In
Table 1, we examine the top 100 cryptocurrencies ranked by market capitalization to determine our sample and include all cryptos that were the results of forks. In Panel A, Forks 1–4 are all forks of Bitcoin, and them, along with the Bitcoin Cash–Bitcoin Cash SV and Ethereum–Ethereum Classic forks, resulted in the child crypto being paid out to its owners. Bitcoin–Bitcoin Cash, Bitcoin–Bitcoin Gold, Bitcoin Cash–Bitcoin Cash SV, and Ethereum–Ethereum Classic were all at ratios of 1:1, while Bitcoin Diamond and DigiByte were distributed at 1:10 and 1:1000, respectively. All other cryptos, which are shown in Panel B, were not given to holders of their parents’ crypto, and we analyze them separately.
We identify forks among the top 100 cryptocurrencies in terms of market capitalization from coinmarketcap.com as of 11 March 2021. The Date column refers to the fork date. The tickers in the ParentCrypto and ChildCrypto columns refer to the cryptocurrency before a fork and the cryptocurrency that is a fork of the ParentCrypto, respectively. The Fork Payout is the number of ChildCryptos rewarded to each ParentCrypto.
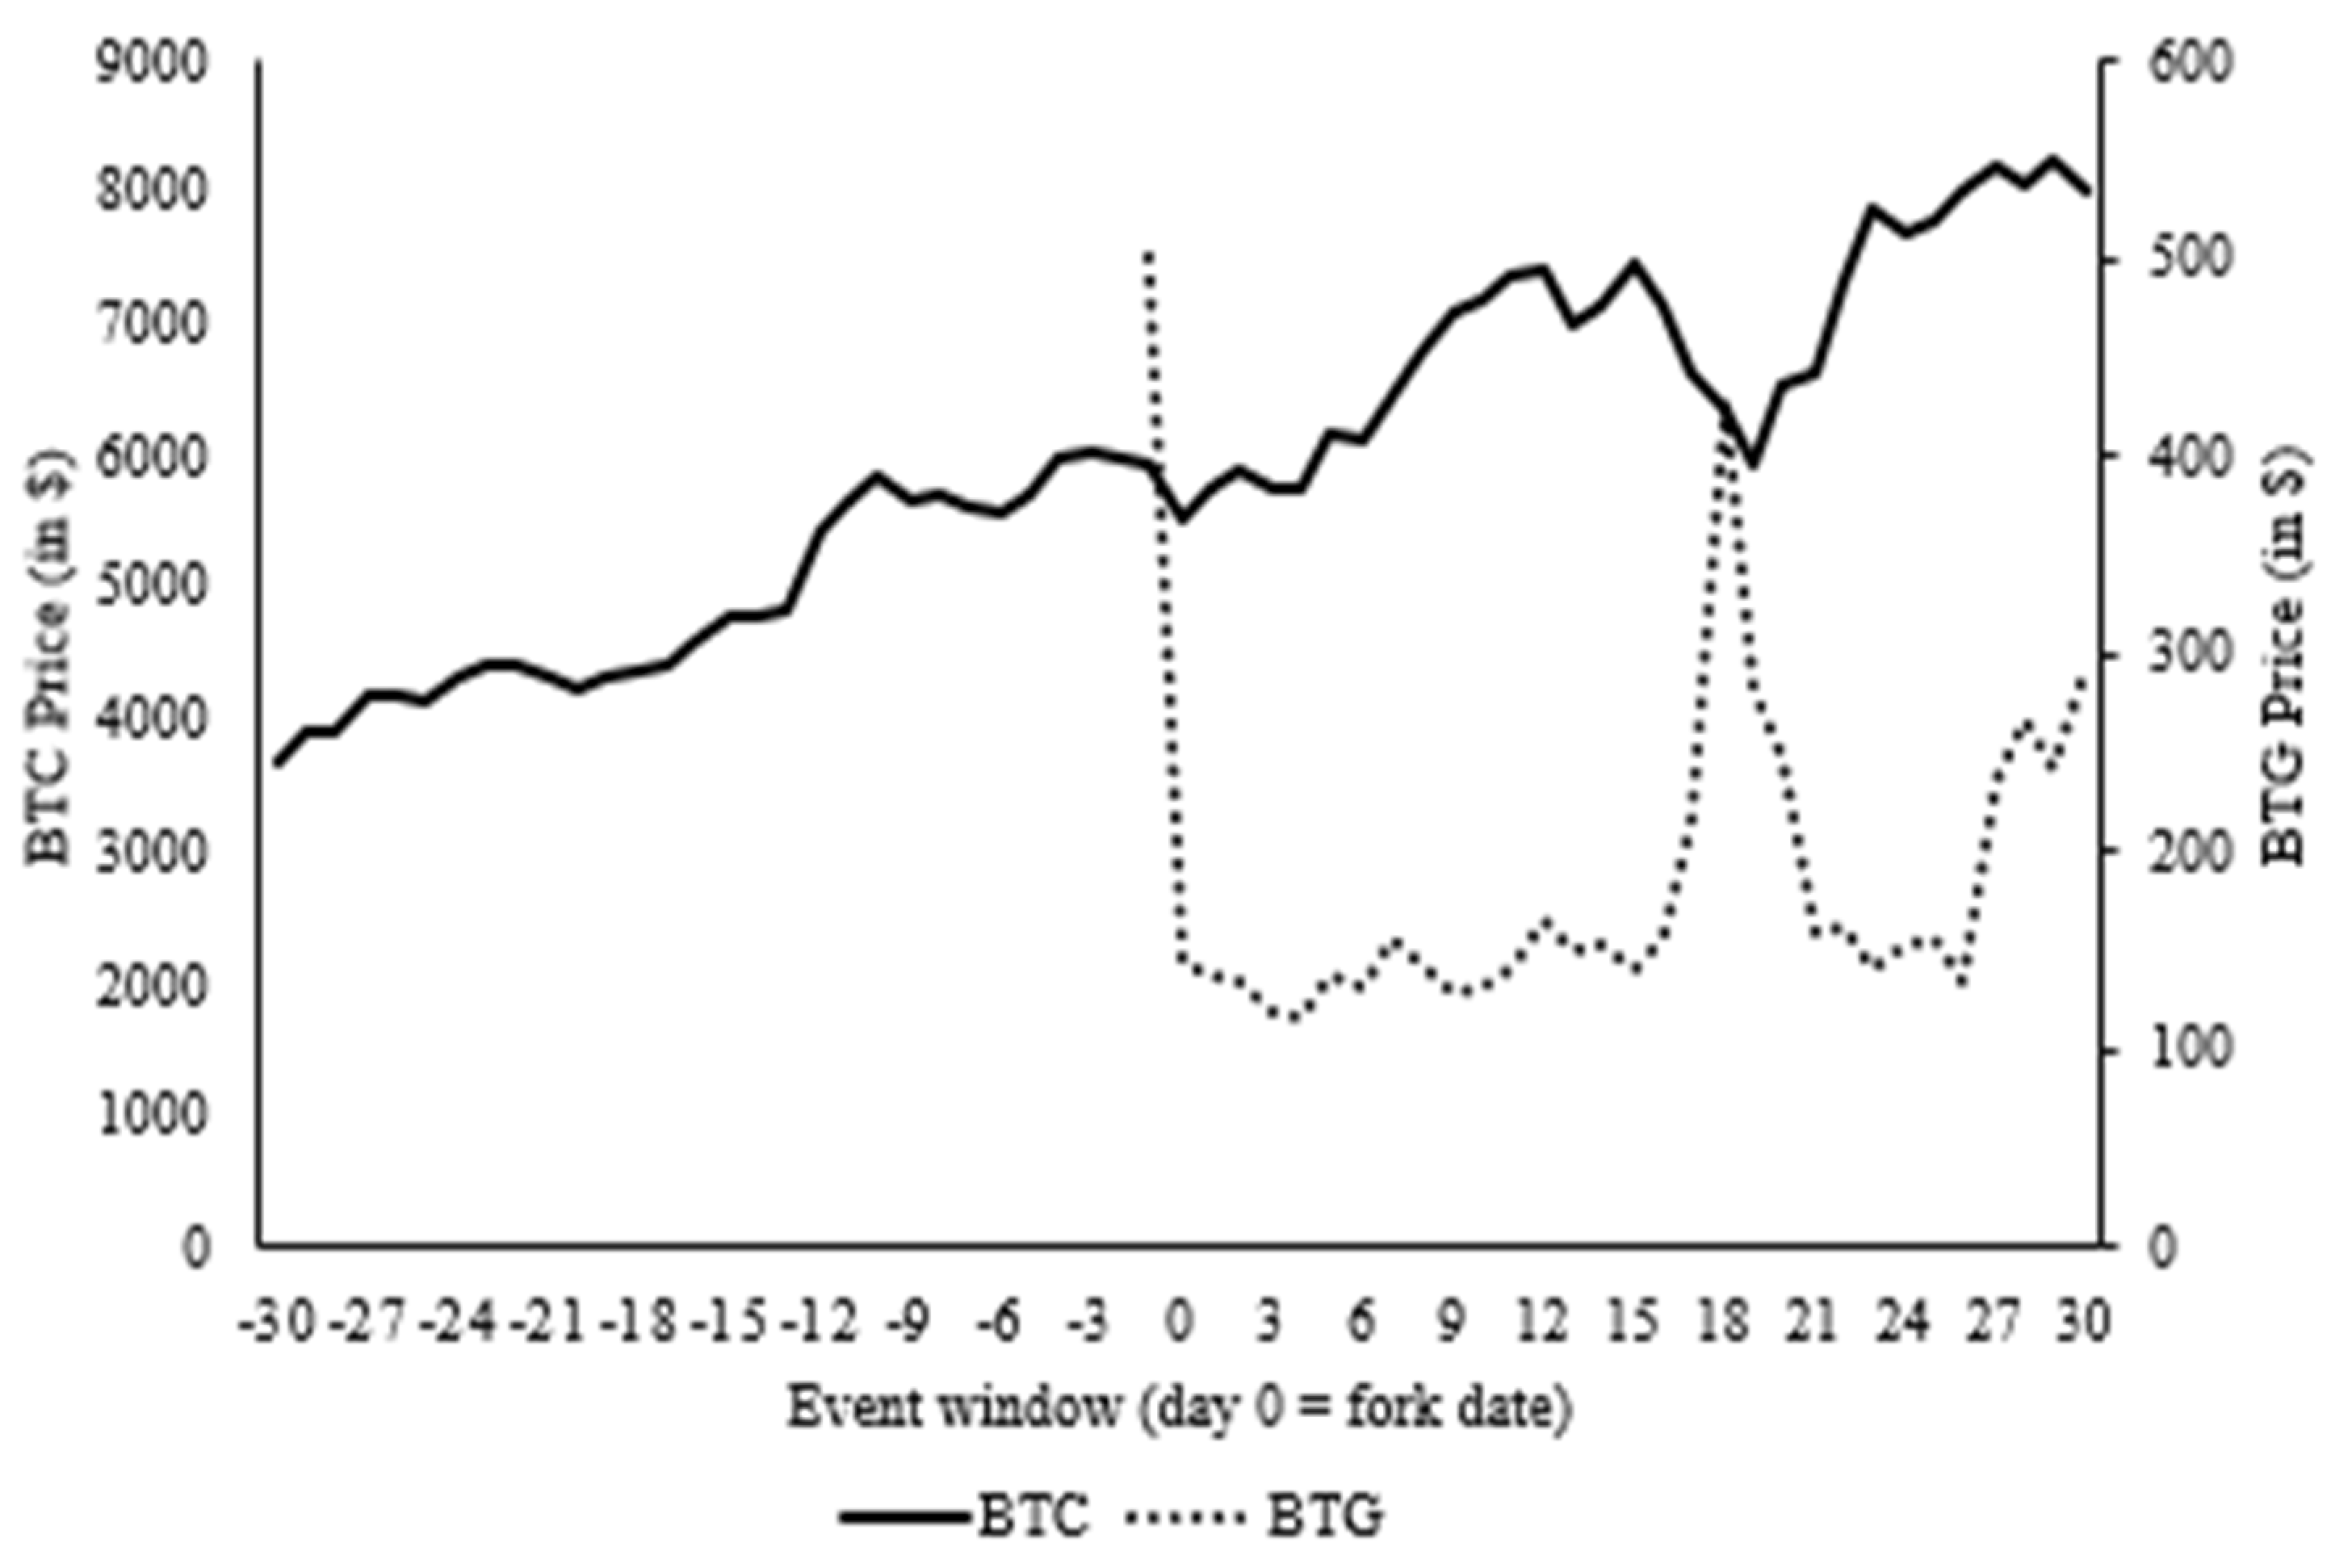
We present the Bitcoin-to-Bitcoin Gold fork, which occurred on 24 October 2017. One Bitcoin Gold was given for every Bitcoin owned. We examine 30 days before the fork to 30 days after the fork using daily data as shown in
Figure 1.
We present the Bitcoin-to-Bitcoin Cash fork, which occurred on 1 August 2017. One Bitcoin Cash was given for every Bitcoin owned. We examine 30 days before the fork to 30 days after the fork using daily data as shown in
Figure 2.
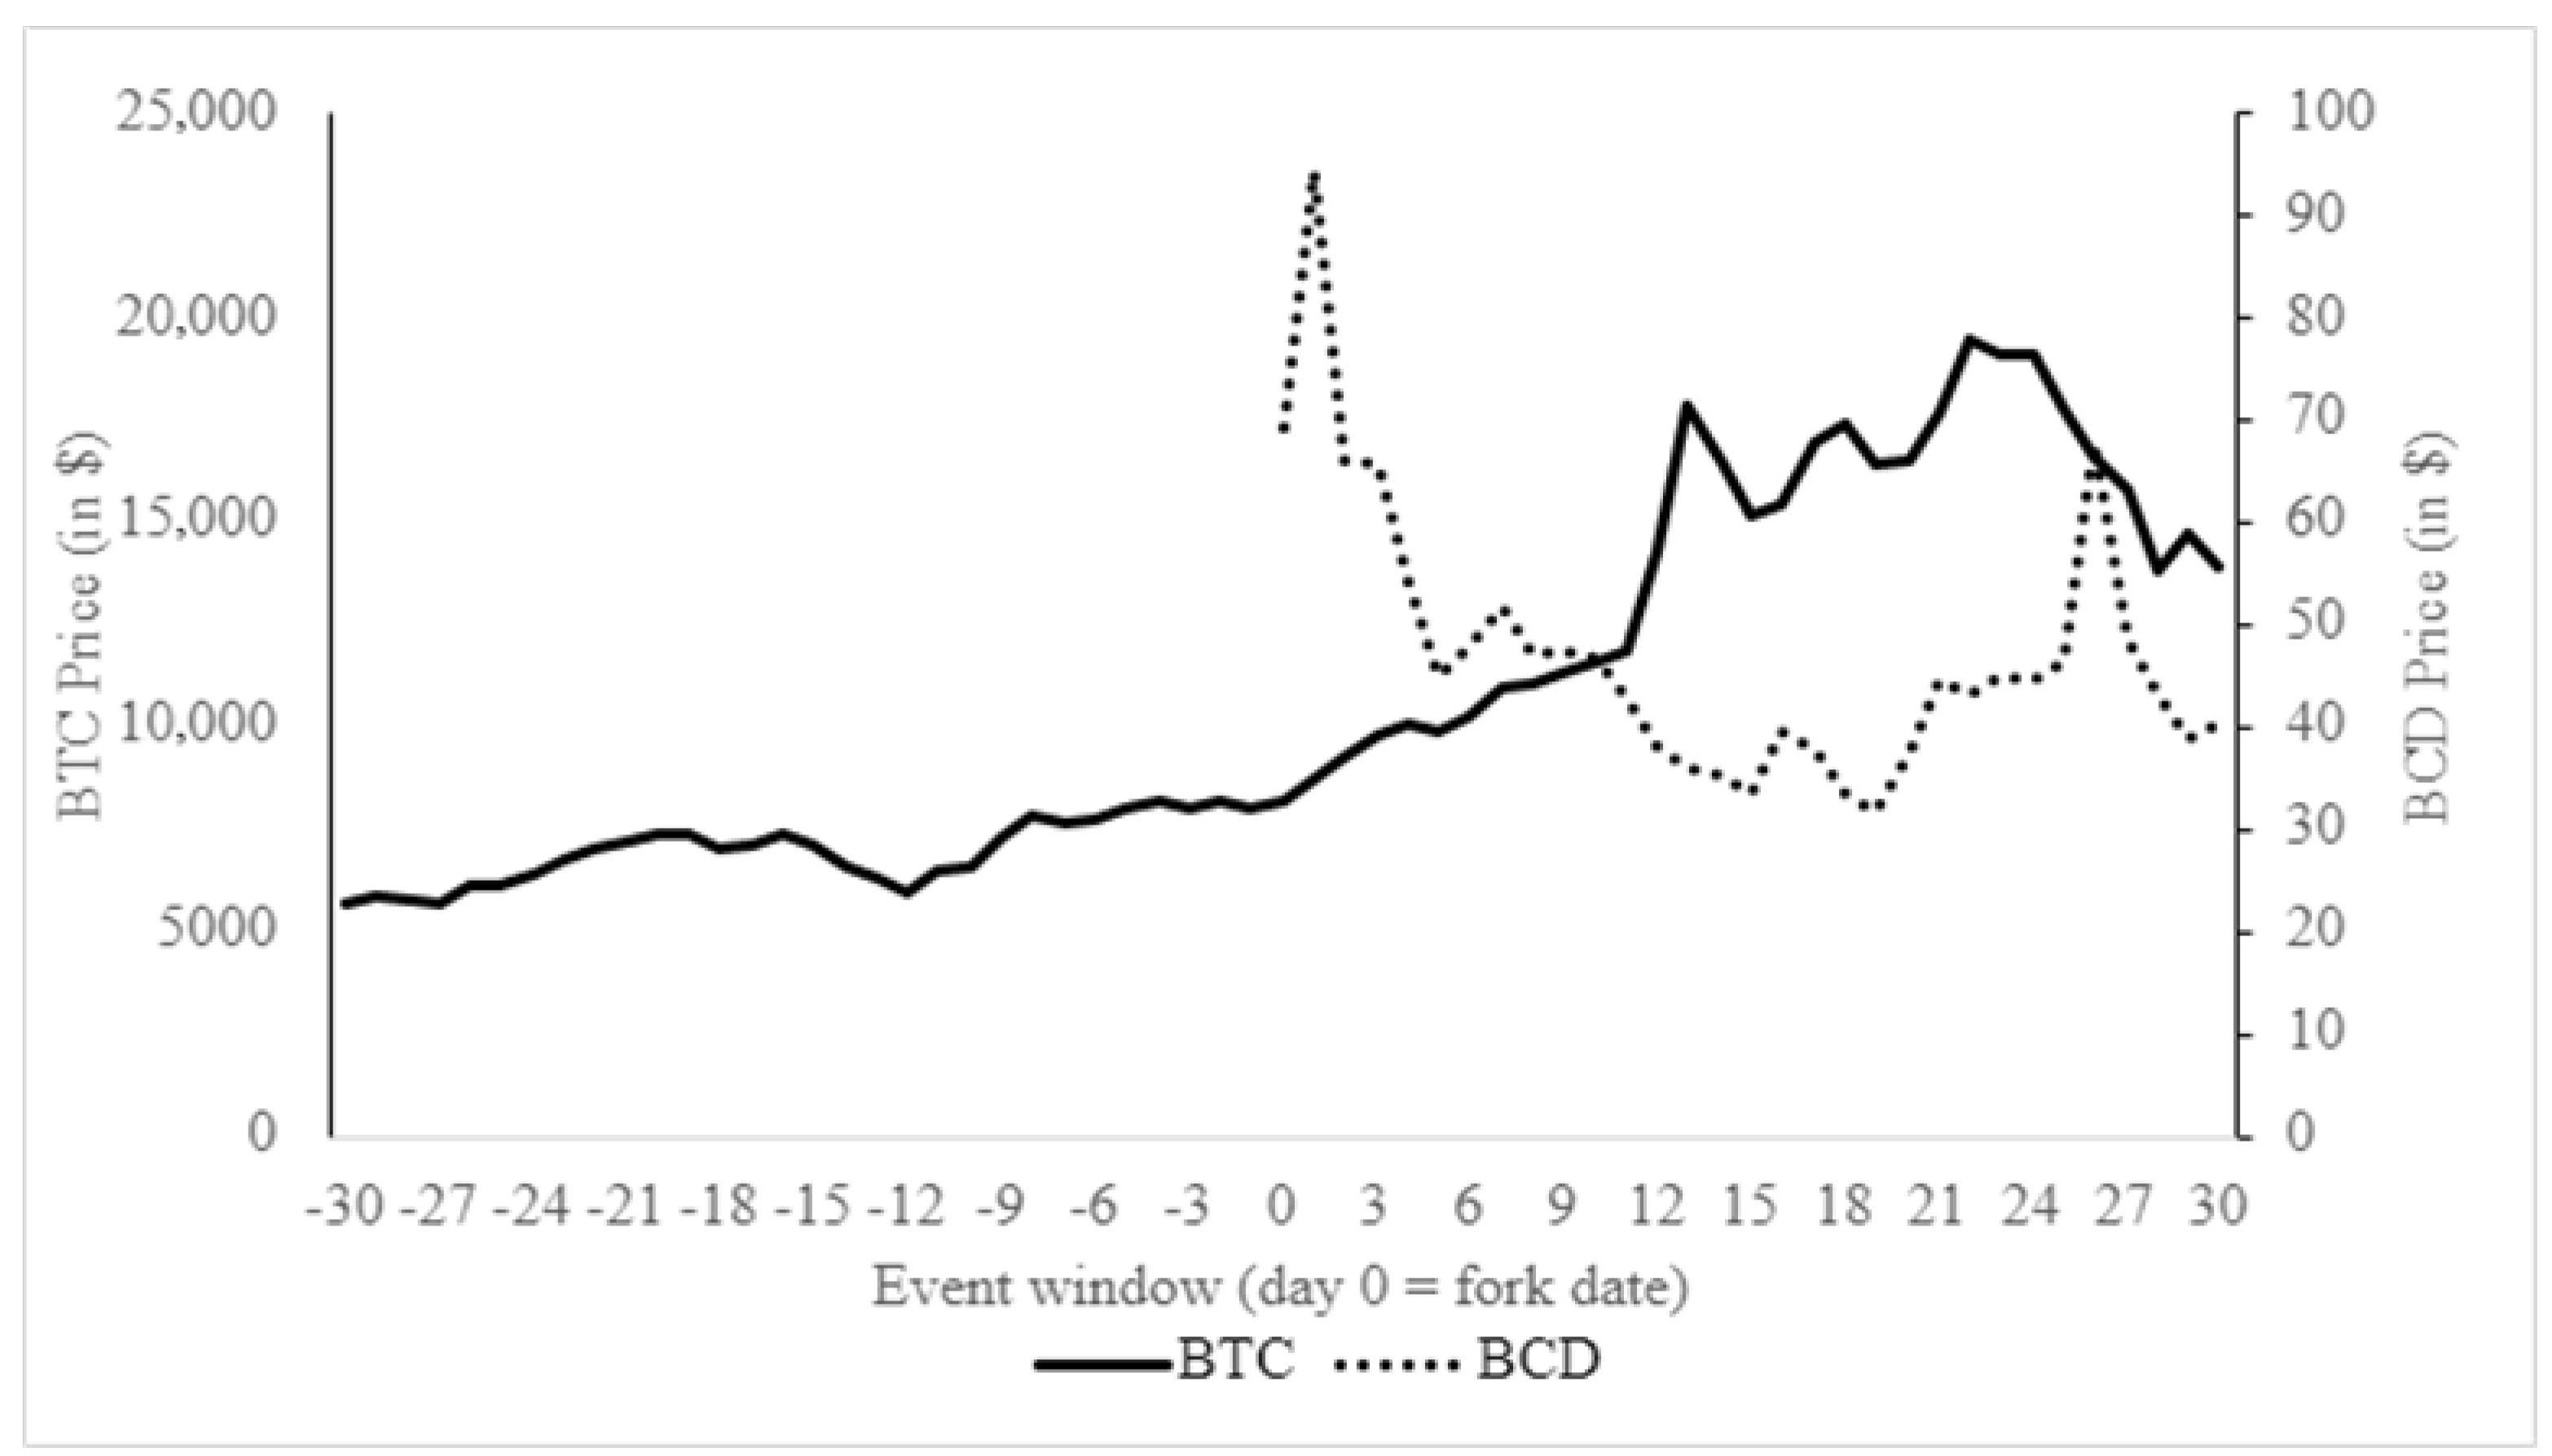
We present the Bitcoin-to-Bitcoin Diamond fork, which occurred on 24 November 2017, one month after the Bitcoin Gold Fork. Ten Bitcoin Diamonds were given for every Bitcoin owned. We examine 30 days before the fork to 30 days after the fork using daily data as shown in
Figure 3.
In the last row of
Table 2, the Bitcoin Gold dollar volume increased with the fork of Bitcoin and Bitcoin Diamond, significant at the 10% level. The Bitcoin Cash dollar volume decreased, and the market cap increased following the fork of Bitcoin and Bitcoin Diamond, significant at the 10% and 1% levels, respectively. This decrease in volume indicates a reduction in the difference in opinion among investors, and the increase in the market cap is driven by the divergence of opinion before the split.
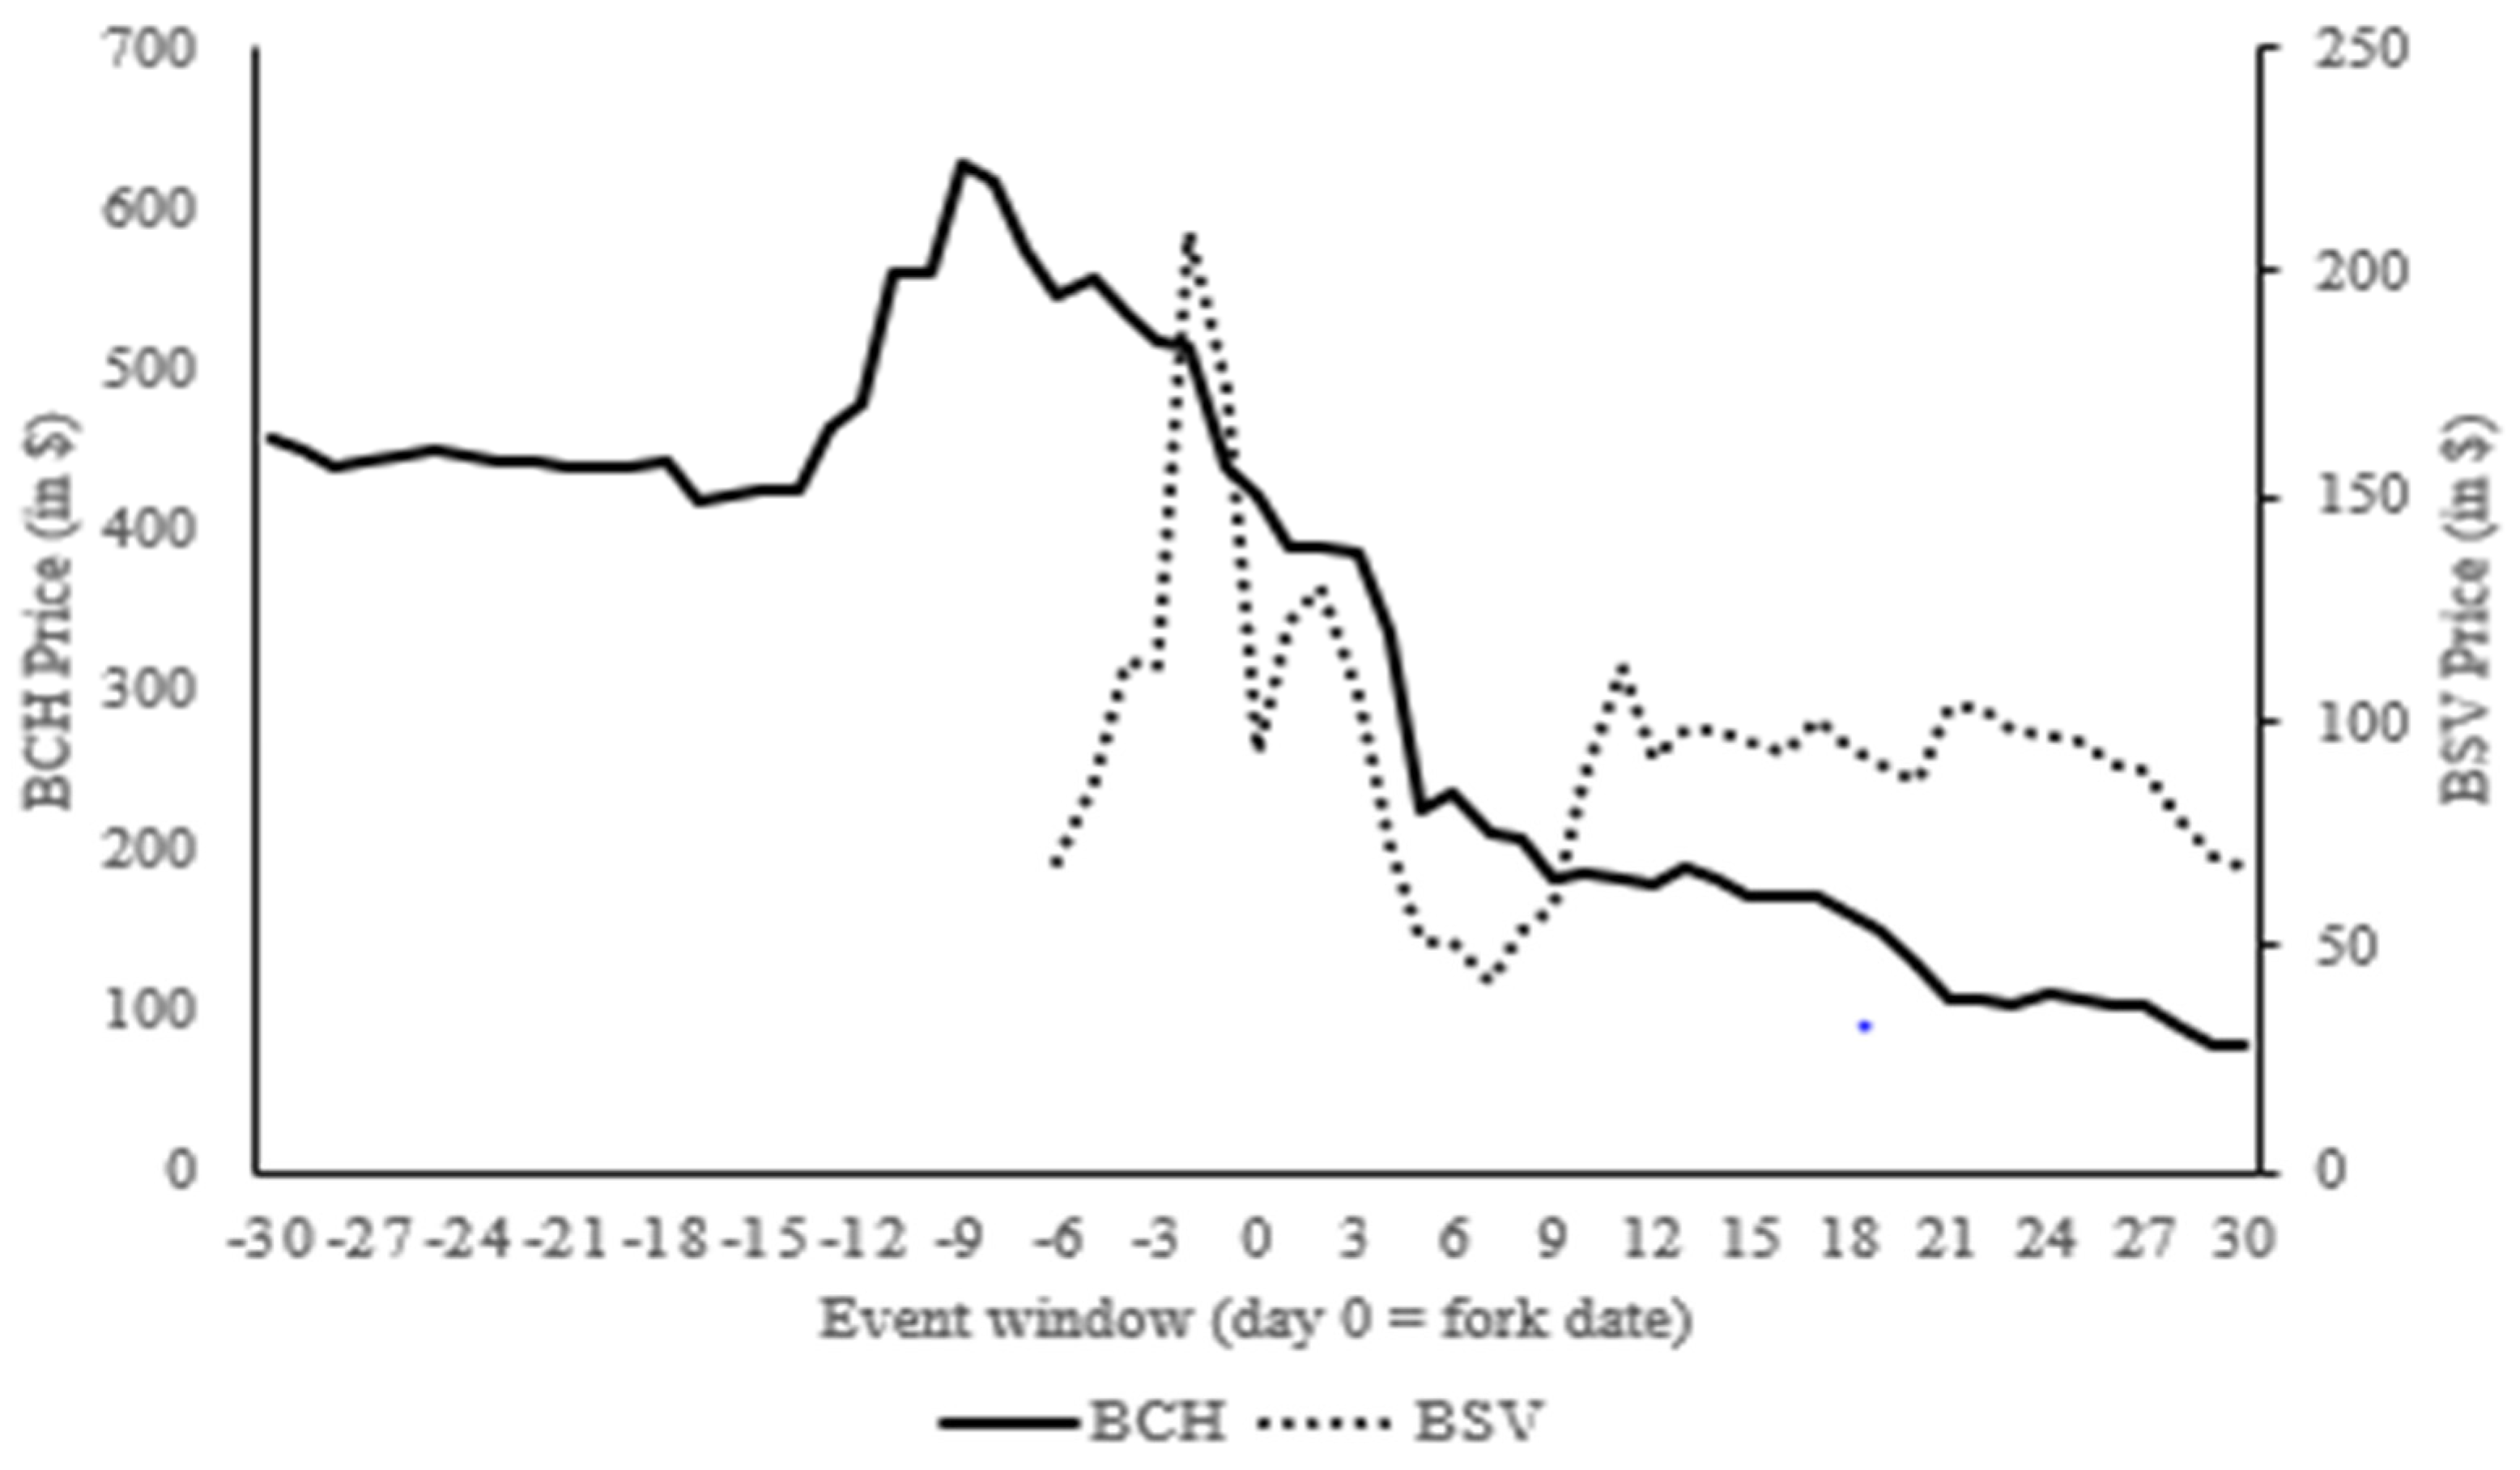
We present the Bitcoin Cash-to-Bitcoin Cash SV fork, which occurred on 15 November 2018. One Bitcoin Cash SV was given for every Bitcoin Cash owned. We examine 30 days before the fork to 30 days after the fork using daily data as shown in
Figure 4.
We present the Ethereum–Ethereum Classic SV fork, which occurred on 15 November 2018. One Ethereum was given for every Ethereum owned. We examine 30 days before the fork to 30 days after the fork using daily data as shown in
Figure 5.
In
Table 2 Sample A, we show the change in the market capitalization of the parent cryptocurrency for our 13 forks, both 30 days before and after the fork along with 7 days before and after the event. For all of our Bitcoin forks [(–30, 0) (0, 30)], for observations 1–4, we find an increase in the market cap of the parent cryptocurrency that is significant at the 1% level. We reject our null hypothesis H1 “The total value before the fork is the same as its total value after the fork” for all voluntary forks. What we did not expect, however, is that the parent company alone was larger than pre-fork, our expectation is that the sum of the parent + child market cap would be larger. We recognize this may be partially attributed to the bull Bitcoin market.
Panel B (second half of cryptos) consists of seven cryptocurrencies that were not distributed to the parent cryptos holders. Of these seven cryptocurrencies, three experienced no significant change in value, three increased in value, and one decreased in value.
When looking at [(–7, 0) (0, 7)], we find less consistent results, with no significant change for two of our four Bitcoin forks. In addition to these two, we see an increase in the market cap for Bitcoin in the Bitcoin–Bitcoin Diamond fork (133.77B to 164.92B) and a decrease in Bitcoin’s market cap in the Bitcoin Cash–Bitcoin Cash SV fork (9.17B to 5.42B), both consistent with our t − 30 t + 30 results.
We obtain the top 100 cryptocurrencies in terms of market capitalization from coinmarketcap.com. We then identify crypto forks. Day 0 refers to the fork date for panel (a) and the first trading date of ChildCrypto for panel (b). Event window [–30, 0) indicates the period 30 days prior to the event date. The square bracket indicates including the date and the non-square bracket indicates excluding the date. The reported statistic is the market cap for ParentCrypto.
Table 3 Sample A shows the market capitalization of the parent cryptocurrency before the fork vs. the combined total market cap of the parent + child cryptocurrency after the fork. For all of our Bitcoin forks [(–30, 0) (0, 30)], for observations 1–4, we find an increase in the market cap of the combined parent and child post-fork vs. that of the parent pre-fork, significant at the 1% level. This is in line with our expectation of H1, which states a gain in wealth from a voluntary fork. Of the seven cryptocurrencies that were not paid out to parent crypto holders, two experienced no significant change in value, four increased in value thirty days after the fork compared to thirty days before the fork, and one decreased in value.
We obtain the top 100 cryptocurrencies in terms of market capitalization data from coinmarketcap.com on 11 March 2021. We then identify the cryptocurrency that is a result of a fork. The Day 0 column refers to the event date, which is the fork date for panel (a) and the first trading date of ChildCrypto for panel (b). The event window [−30, 0) indicates the period 30 days prior to the event date. The square bracket indicates including the date and the non-square bracket indicates excluding the date. The reported statistic is the mean of the combined market cap for both ParentCrypto and ChildCrypto.
In
Table 4, we examine the dollar volume t − 30 t + 30 around the date of the fork and find a significant increase in volume for three of our four Bitcoin forks, excluding Digibyte. We expected the share volume to decrease as an indication of a reduction in uncertainty post-fork, but for the most part, we did not find a significant effect. The Day 0 column refers to the event date, which is the fork date for panel (a) and the first trading date of ChildCrypto for panel (b). The event window [−30, 0) indicates the period 30 days prior to the event date. The square bracket indicates including the date and the non-square bracket indicates excluding the date. The reported statistic is the mean of the daily dollar volume for the ParentCrypto.
We obtain the top 100 cryptocurrencies in terms of market capitalization data from coinmarketcap.com on 11 March 2021. We then identify the cryptocurrency that is a result of a fork. The Day 0 column refers to the event date, which is the fork date for panel (a) and the first trading date of ChildCrypto for panel (b). The event window [−30, 0) indicates the period 30 days prior to the event date. The square bracket indicates including the date and the non-square bracket indicates excluding the date. The reported statistic is the return volatility for the ParentCrypto.
Most forks show no significant change in the share trading volume, with the share volume decreasing only after the Bitcoin Cash–Bitcoin Cash SV fork. When looking at the same time period for the rest of our sample, we do not find consistent results for changes in the price of non-distribution forks.
For the shorter time window around the fork, t − 7 to t + 7, we find a significant decrease in shares traded after the Digibyte fork, a significant increase in shares traded after the Bitcoin–Bitcoin Diamond fork, and no effect on trading volume following the other Bitcoin forks. Of our non-distribution forks, we find that the share volume increased for Ethereum–Ethereum Classic, Bitcoin–ZCASH, and Bitcoin–Ravencoin and decreased for the Bitcoin–Bitcoin Cash fork, and there was no significant change for the four other non-distribution forks (XLM, DASH, DOGE, and LTC).
In
Table 4, Panel A, we look at the volume −30, +30 around when forks occur and find that the parent cryptos’ volume increased for 10 of our 12 cryptos, with exceptions for BCH (BSV) and BTC (RVN). In the next columns, we analyze −7, +7 and −3, +3 around the fork date, and the results are not as clear, as many parent cryptos increased in volume, while almost an equal number decreased in trading volume. In
Table 4, Panel B, we find that the dollar volume of the parent crypto decreases for 10 of our 12 forks when looking −7, +7 and −3, +3 days around the start of trading for the child crypto. In
Table 5 for return volatility, we examine the return volatility t − 30 to t + 30 around the date of the fork and find a significant decrease in volatility for our first two Bitcoin distributed forks Digibyte and Bitcoin Cash, no change for Bitcoin Gold, and an increase in volatility for our fourth Bitcoin fork Bitcoin Diamond. Bitcoin Cash–Bitcoin Cash SV, Bitcoin–Litecoin, and Bitcoin–ZCASH showed increases in volatility following the fork, while the return volatility decreases for Bitcoin–DASH and Ripple XLM. We see no significant change in volatility for Litecoin–Dogecoin, Ethereum–Ethereum Classic, Bitcoin–ZCASH, and Ethereum–Matic. When looking at the shorter t − 7 to t + 7 window around the fork date, we find no change in volatility for all cryptocurrencies in our sample aside from Bitcoin Cash–Bitcoin Cash SV.
For the forks that were not distributed to owners of the parent cryptos, we focus on their value and the value of their parents separately, displayed in Panel B. Bitcoin’s market cap increased following the three forks: BTC to BCH and BTC to BCD, significant at the 1% level, and BTC to BCD, significant at the 5% level.
The total cryptocurrency market cap increased for two of the three Bitcoin forks: the Bitcoin–Bitcoin Gold fork at the 1% level and the Bitcoin–Bitcoin Diamond fork at the 5% level. The Bitcoin–Bitcoin Cash fork showed no significant change.
8. Conclusions
Planned cryptocurrency forks, like voluntary corporate spin-offs, are wealth-creating, while involuntary forks are not. Miners, who are commonly owners, choose to initiate forks, potentially for their own gains.
Alleviating the concern of forks diminishing the importance of the limited supply of cryptocurrencies, we find subsequent forks provide marginally diminishing benefits.
Interestingly we find that the trading volume of the parent cryptocurrency decreases following the start of the trading of the child cryptocurrency, which represents a decrease in investor uncertainty. This indicates the anticipation of non-miner investors pre-fork.
Our primary findings for cryptocurrencies are in line with those of
Miller (
1977) and
Kudla and McInish (
1988). The U.S. Equity results are: shareholder wealth increases for voluntary forks but not for forced forks.


