Article

Comparison of the Asymmetric Relationship between Bitcoin and Gold, Crude Oil, and the U.S. Dollar before and after the COVID-19 Outbreak

by
Yadong Liu
1,2,*,
Nathee Naktnasukanjn
1,
Anukul Tamprasirt
1 and
Tanarat Rattanadamrongaksorn
1
1
International College of Digital Innovation, Chiang Mai University, Chiang Mai 50200, Thailand
2
College of Innovation and Entrepreneurship, Shandong Institute of Commerce and Technology, Jinan 250013, China
*
Author to whom correspondence should be addressed.
J. Risk Financial Manag. 2023, 16(10), 455; https://doi.org/10.3390/jrfm16100455
Submission received: 11 August 2023 / Revised: 15 October 2023 / Accepted: 17 October 2023 / Published: 20 October 2023

Abstract

:
This paper aims to reveal the asymmetric co-integration relationship and asymmetric causality between Bitcoin and global financial assets, namely gold, crude oil and the US dollar, and make a comparison for their asymmetric relationship before and after the COVID-19 outbreak. Empirical results show that there is no linear co-integration relationship between Bitcoin and global financial assets, but there are nonlinear co-integration relationships. There is an asymmetric co-integration relationship between the rise in Bitcoin prices and the decline in the US Dollar Index (USDX), and there is a nonlinear co-integration relationship between the decline of Bitcoin and the rise and decline in the prices of the three financial assets. To be specific, there is a Granger causality between Bitcoin and crude oil, but not between Bitcoin and gold/US dollar. Before the outbreak of the COVID-19 pandemic, there was an Asymmetric Granger causality between the decline in gold prices and the rise in Bitcoin prices. After the outbreak of the pandemic, there is an asymmetric Granger causality between the decline in crude oil prices and the decline in Bitcoin prices. The COVID-19 epidemic has led to changes in the causality between Bitcoin and global financial assets. However, there is not a linear Granger causality between the US dollar and Bitcoin. Last, the practical implications of the findings are discussed here.

1. Introduction

Bitcoin, as well as traditional gold, crude oil, and the US dollar, are globally important financial assets that have received widespread attention from financial investors, financial institutions, and economists (Li et al. 2021). It seems that Bitcoin is more sought after by investors as a new financial asset. Bitcoin is favored due to its independence from central banks, with its value dependent on scarcity and mining costs (Dyhrberg 2016a; Abdullah and Mutawa 2023). As it were, Bitcoin is a product of the distrust and uncertainty in the existing financial system. With the opening of the Bitcoin market, its trading volume and value have been increased, attracting more investors and financial institutions. Bitcoin has similar characteristics to gold, and many scholars believe that Bitcoin is also a safe-haven asset (Long et al. 2021). As a result, Bitcoin is often referred to as digital gold (Selmi et al. 2018).
In recent years, scholars have studied Bitcoin from many aspects, such as the hedging ability of Bitcoin (Wei et al. 2023; Madichie et al. 2023; Wang et al. 2019), factors influencing Bitcoin price (Bouoiyour and Selmi 2015), Bitcoin price predictions (Zhu et al. 2023; Chen 2023; Detzel et al. 2021), and spillover effect of Bitcoin (
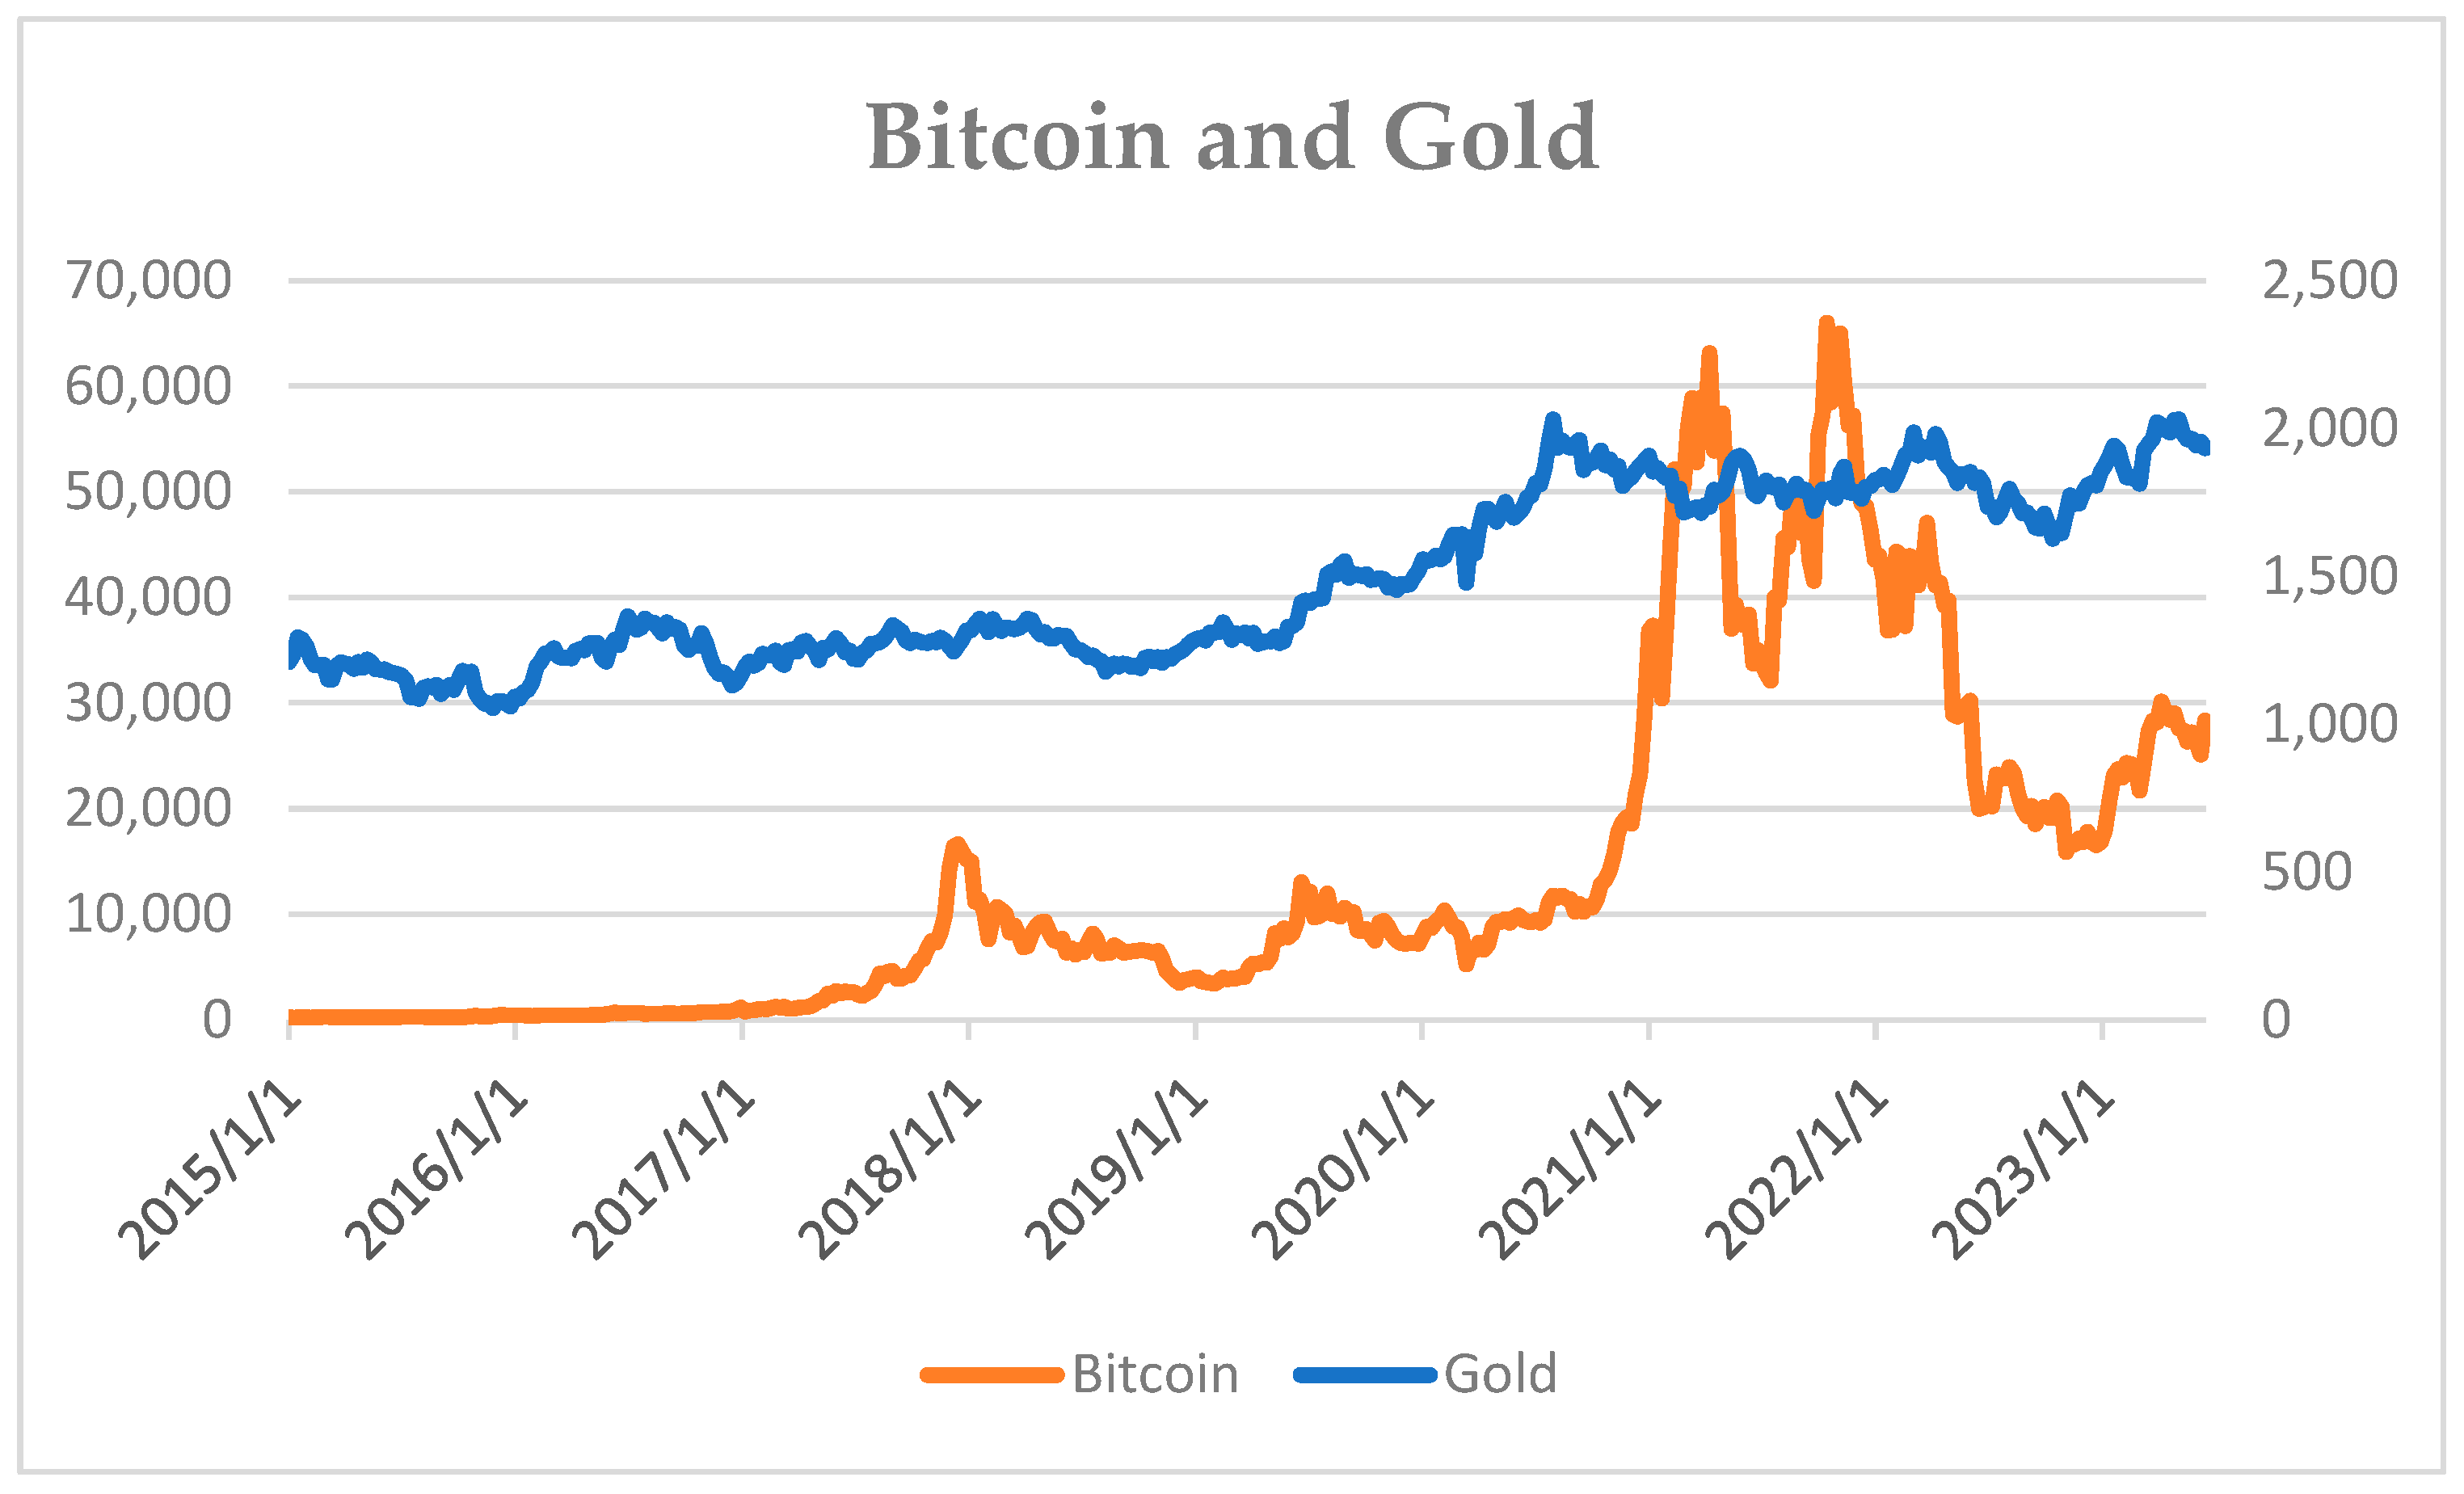
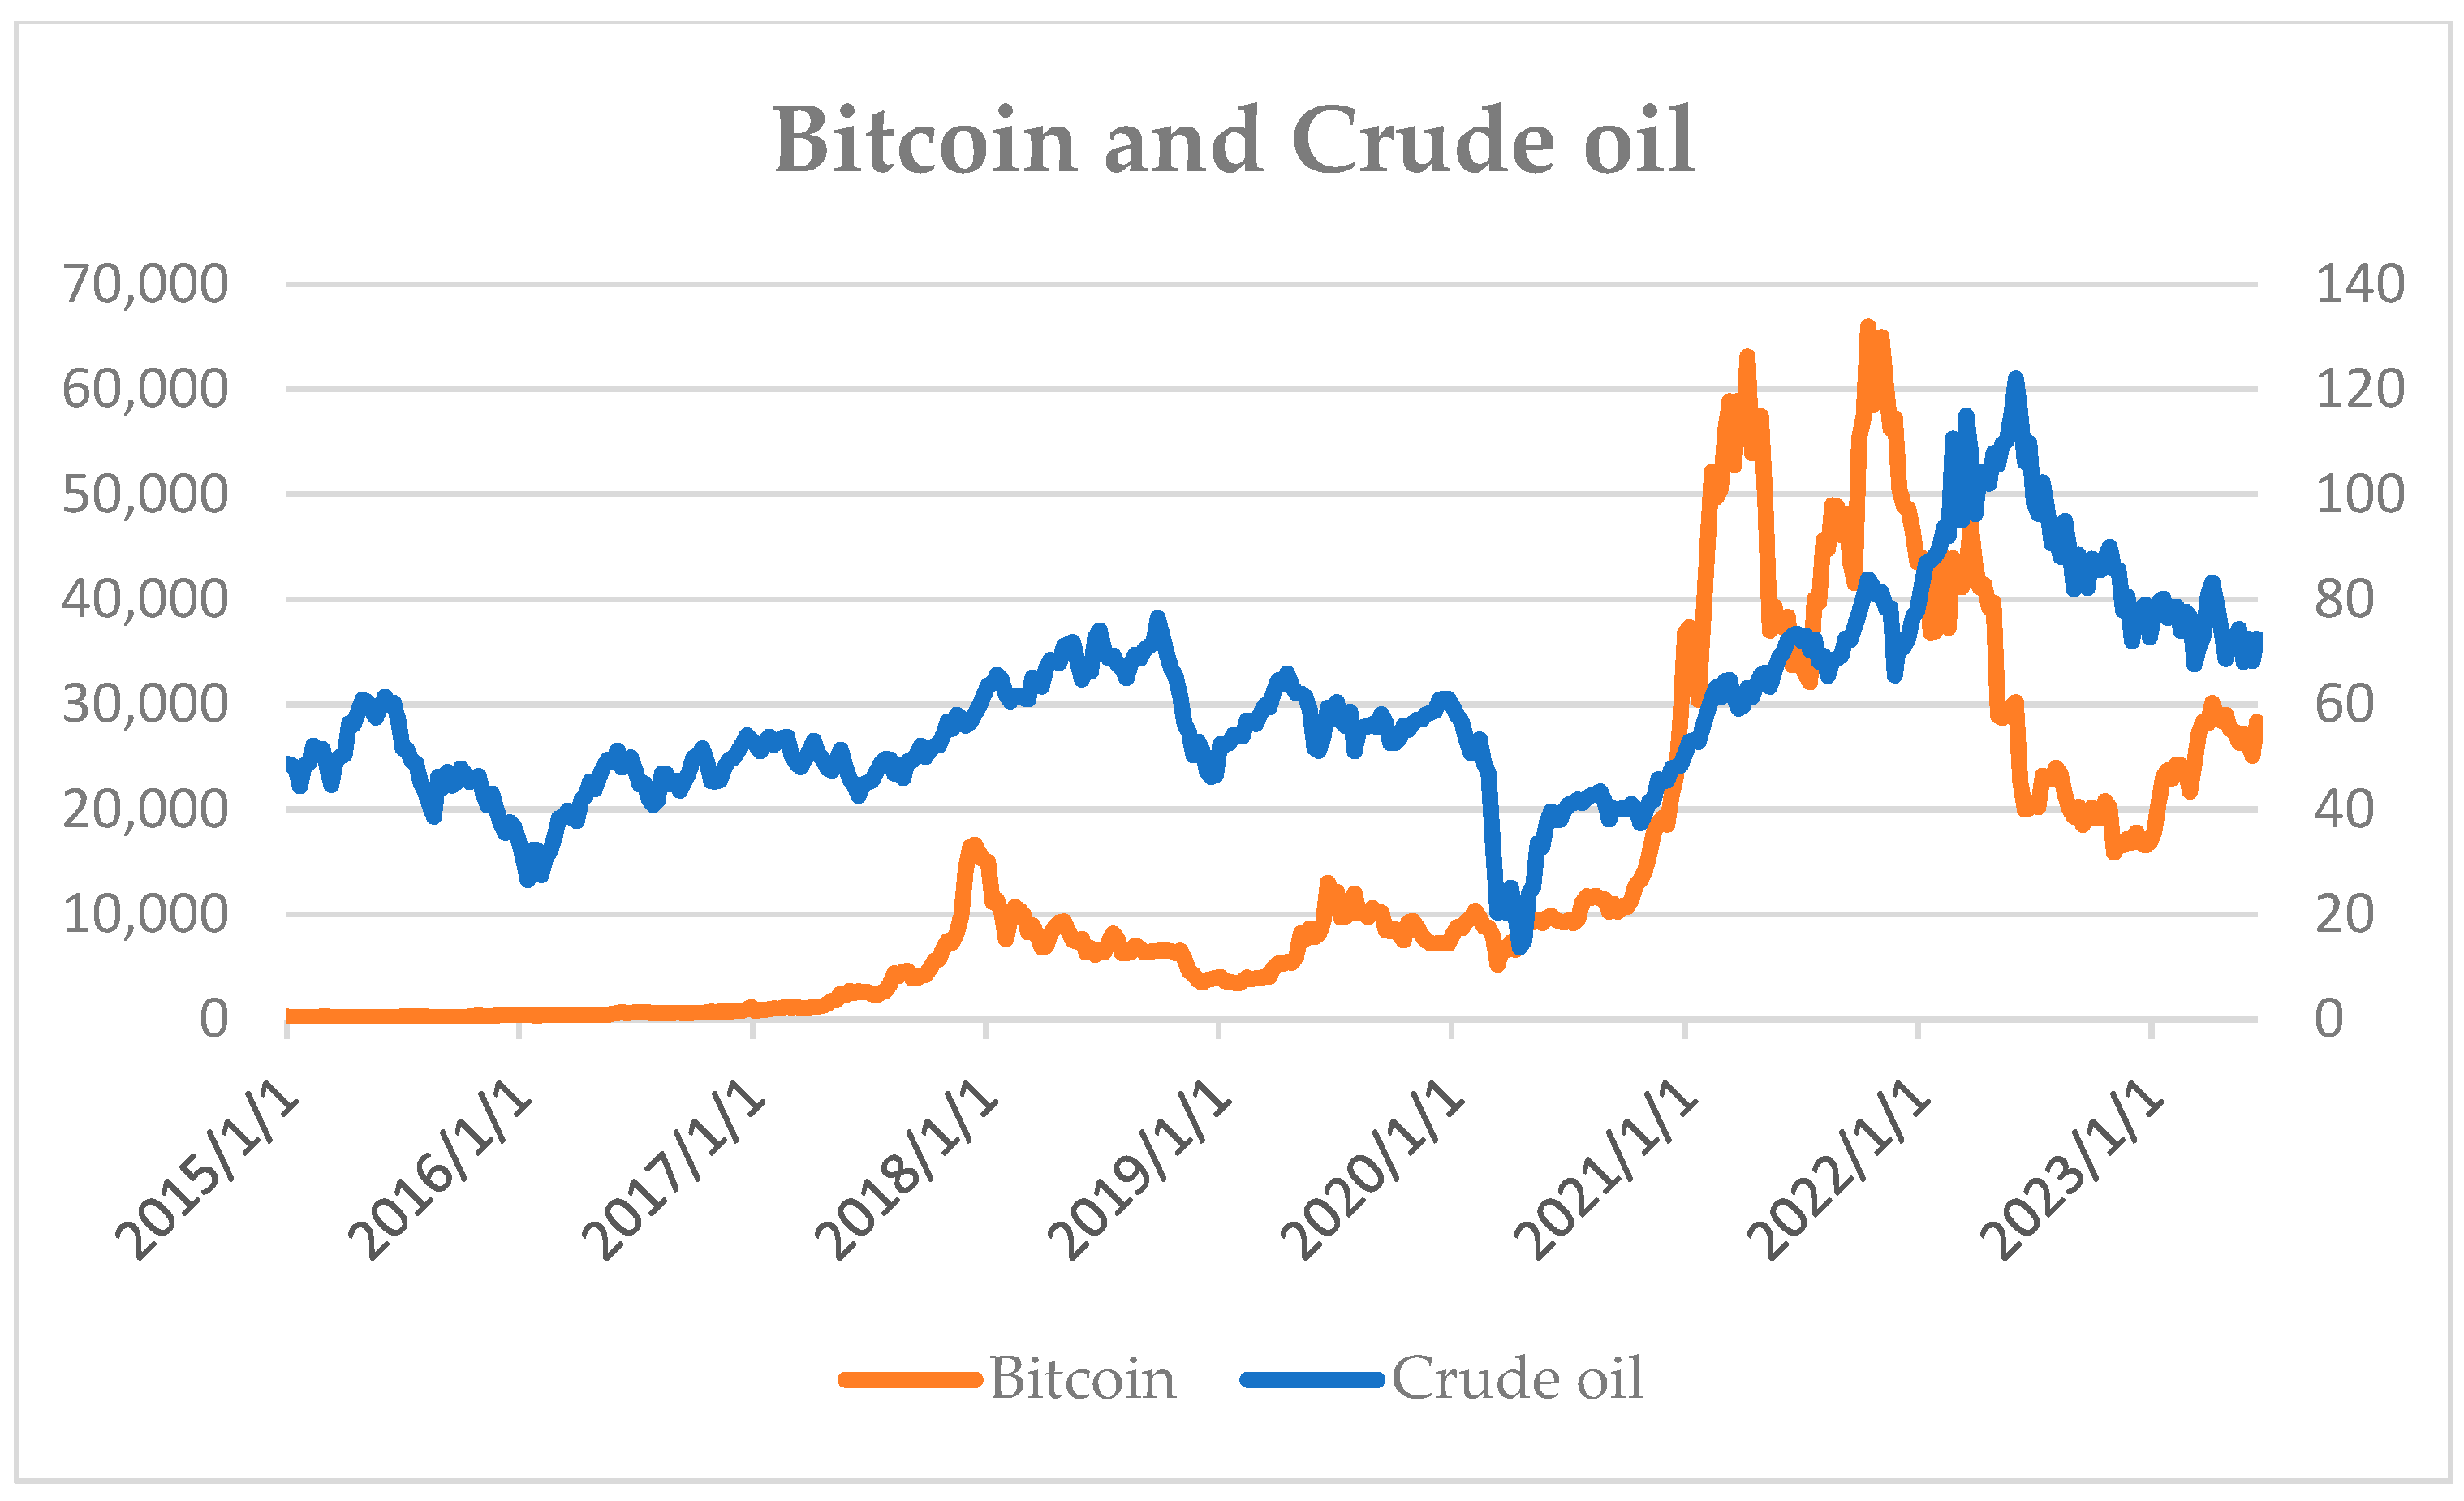
Fasanya et al. 2021). Although Bitcoin is a new investment product, it brings substantial investment returns. The price of Bitcoin fell below USD 5000 in the early days of the COVID-19 pandemic, but by November 2021, it almost reached USD 65,000 (Long et al. 2021). The impact of the COVID-19 pandemic on the Bitcoin market is significant (Khan et al. 2023). The COVID-19 pandemic and Bitcoin not only had a positive correlation, but also caused the rise of Bitcoin (Goodell and Goutte 2021). A few studies showed that Bitcoin, stock markets, and the global financial assets had different volatility and co-movement during the COVID-19 pandemic (Abdul-Rahim et al. 2022; Chan et al. 2023). This shows that Bitcoin has become a very popular investment asset. High returns inevitably come with high risks. More Bitcoin investors are paying attention to the relationship between Bitcoin and global financial assets, namely gold, crude oil, and the US dollar. Among them, gold has long been considered a safe-haven asset (Cunado et al. 2019). Crude oil is also commonly used to hedge against the risks brought by the rise in commodity financialization (Chen et al. 2018; Tang and Xiong 2012). And the US dollar is a store of value. Studying the relationships between Bitcoin and global financial assets helps diversify the investment risk of Bitcoin and ensure return on investment.
The purpose of this paper is to examine whether there is a co-integration relationship, especially asymmetric co-integration, between Bitcoin and global financial assets, namely gold, crude oil, and the US dollar. Through co-integration analysis, the causality, particularly asymmetric causality, between Bitcoin and global financial assets is further determined. The other objective of this study is to investigate whether the co-integration relationship and causality changes before and after the COVID-19 outbreak. The findings of this study will help investors and financial institutions understand the relationships between Bitcoin and gold, crude oil, and the US dollar, providing valuable insights for Bitcoin investment decision making and risk management.
The reminder of this study is as follows: Section 2 is a literature review that evaluates the relevant studies on Bitcoin and gold, Bitcoin and crude oil, and Bitcoin and the US dollar. Section 3 provides a detailed description of the data. Section 4 introduces the asymmetric co-integration test and asymmetric Granger causality test. Section 5 demonstrates the empirical results and discussions, and Section 6 draws a conclusion.

2. Literature Review

2.1. Bitcoin and Gold

Bitcoin, being an emerging asset and having some similar properties to gold, is often referred to as “digital gold” or “Gold 2.0” (Baur and Hoang 2021; Jareño et al. 2020). Consequently, many scholars have paid particular attention to the correlation and differences between Bitcoin and gold. Dyhrberg (2016b) found that Bitcoin and gold exhibit similar hedging features. Some scholars hold an opinion that there is a strong correlation between Bitcoin and gold (Shahzad et al. 2019; Bouoiyour et al. 2019). Likewise, Selmi et al. (2018) and Shahzad et al. (2021) further identified Bitcoin and gold as safe-haven assets, especially during periods of economic instability. However, there are opposing views as well. For instance, Long et al. (2021) and Baur et al. (2018) found that Bitcoin does not have the same hedging properties as gold. The correlation between Bitcoin and gold is weak (Kang et al. 2019; Wu et al. 2019). Al-Khazali et al. (2018) even claimed that Bitcoin and gold are independent. Ibrahim and Ali Basah (2022) found that there is no Granger causality between gold and Bitcoin. Moreover, scholars have also focused on the spillover effect between Bitcoin and gold (Yu et al. 2021; Aliu et al. 2023), dynamic linear correlations (Kang et al. 2019; Jin et al. 2019; Klein et al. 2018), and nonlinear correlations (Jareño et al. 2020; Zwick and Syed 2019; Kim et al. 2020; Kumar et al. 2023).

2.2. Bitcoin and Crude Oil

There is a natural positive correlation between Bitcoin and crude oil due to the fact that Bitcoin mining requires the consumption of crude oil (Das et al. 2020). The rise in crude oil prices may lead to inflationary pressure, resulting in the depreciation of fiat currencies. The depreciation of fiat currencies implies an increase in the demand for Bitcoin, resulting in an increase in Bitcoin prices (Kilian 2009). Recently, Wang et al. (2022) and Hsu et al. (2023) also revealed the positive correlation between crude oil and Bitcoin. Given this, scholars have been focused on the study of the relationship between Bitcoin and crude oil. Some scholars, such as the authors of Hsu et al. (2023); Li et al. (2022); Su and Li (2020); Zha et al. (2023), investigated the risk spillover effect and transmission path of Bitcoin, crude oil, and other financial assets. Some pay attention to the dynamic correlation between Bitcoin and crude oil and their volatility (Attarzadeh and Balcilar 2022; Ozturk 2020).

2.3. Bitcoin and the US Dollar

Apart from gold and crude oil, the US dollar is the asset that Bitcoin investors are most concerned about. A significant number of scholars have focused on the correlation between Bitcoin, gold, crude oil and the US dollar. For instance, Cao and Ling (2022) examined the asymmetric dependence structure of Bitcoin, the US dollar, and gold. Das et al. (2020) revealed the hedging and safe-haven properties of Bitcoin against crude oil, and compared it with gold and the US dollar. Dyhrberg (2016a) compared the volatility of Bitcoin, gold, and the US dollar, highlighting their roles in investment portfolios and risk management. Bhuiyan et al. Bhuiyan et al. (2021) revealed the lead–lag relationship between Bitcoin, crude oil, gold, and the US dollar, interpreting it as a causality. There are also studies that focus solely on the relationship between Bitcoin and the US dollar. For instance, Szetela et al. (2016) assessed the interdependence between Bitcoin and multiple currencies, including the US dollar. Antoniadis et al. (2018) and Ciaian et al. (2016) examined the impact of Bitcoin on the USDX, highlighting the asymmetric relationship between Bitcoin and the US dollar. Mokni and Ajmi (2021) compared the extremum Granger causality between cryptocurrencies and the US dollar before and after the pandemic.
The research on Bitcoin and the global financial assets is extensive, laying a solid foundation for this study. In spite of the abundant literature studying Bitcoin, we believe there are still questions that deserve further exploration. First, many studies have inconsistent findings, and ways in which the relationship between Bitcoin and the global financial assets changes before and after the COVID-19 pandemic are open to discussion. Second, many scholars have examined the hedging and safe-haven properties of Bitcoin, as well as the asymmetric risk spillover effect, while less attention has been paid to the long-term relationship between Bitcoin and the global financial assets. Third, only a few scholars have looked into the causality between Bitcoin and the US dollar or crude oil, without comprehensively determining the asymmetric causality between Bitcoin and the global financial assets. Therefore, it is necessary to study the asymmetric co-integration relationship and asymmetric causality between Bitcoin and the global financial assets, namely gold, crude oil, and the US dollar.
The contributions of this study mainly reflected in the following aspects: First, the asymmetric co-integration relationship between Bitcoin and global financial assets was examined through comparing the views of Tadi and Kortchemski (2021) and Tiffani et al. (2023) on the co-integration relationship. It was proven that asymmetric co-integration relationships can reveal more economic phenomena: there is no co-integration relationship between Bitcoin and the global financial assets, but there is a significant asymmetric co-integration relationship. Second, the asymmetric causality between Bitcoin and the global financial assets was examined. It was found that there is the Granger causality between crude oil and Bitcoin, and between the negative impact of crude oil and Bitcoin price decline. Third, further comparison was made on the asymmetric Granger causality between Bitcoin and global financial assets before and after the COVID-19 outbreak while drawing on the practice of Mokni and Ajmi (2021). The results indicated that the decline in gold prices due to the pandemic is no longer a Granger cause of the rise in Bitcoin prices, but the decline in crude oil prices becomes a Granger cause of the decline in Bitcoin prices.

3. The Data

Data on Bitcoin, gold, crude oil and the USDX were sourced from Yahoo Finance. To ensure temporal alignment, we obtained weekly data from 1 January 2015 to 15 June 2023. Figure 1, Figure 2 and Figure 3 depict the price trends of Bitcoin and the aforementioned three assets. As can be observed, the prices of Bitcoin and crude oil are highly volatile (Phoong et al. 2020), and there appears to be a certain correlation between their peaks and troughs, which may be a phenomenon revealed by causality. Comparatively speaking, the USDX shows the smallest fluctuations, followed by gold.

4. Methodology

4.1. Asymmetric Co-Integration Approach

Since Granger and Yoon (2002) proposed an idea of transforming data into both cumulative positive and negative changes, most of scholars contributed to the study of asymmetric cointegration, such as the authors of (Lardic and Mignon 2008; Hatemi-J 2020), etc.
Following Lardic and Mignon (2008), the cumulative positive and negative changes of Bitcoin can be expressed as follows:
B i t c o i n t + = i = 0 t 1   I Δ B i t c o i n t i 0 Δ B i t c o i n t i
B i t c o i n t = i = 0 t 1   1 Δ B i t c o i n t i < 0 Δ B i t c o i n t i
where I{} represents an indicator function, and _ B i t c o i n t i stands for the first difference of Bitcoin at time t − i. Obviously, B i t c o i n t = B i t c o i n t + + B i t c o i n t . Similarly, we express the cumulative positive (negative) changes in gold, crude oil, and the US dollar as G o l d t + ( G o l d t ), O i l t + ( O i l t ), and U S D t + ( U S D t ), respectively. Taking Bitcoin and gold as an example, we suppose that a linear combination e t is constructed by
e t = α 1 B i t c o i n t + + α 2 B i t c o i n t + α 3 G o l d t + + α 4 G o l d t
If there exists a vector α = α 1 , α 2 , α 3 , α 4 ) with α 1 α 2 or α 3 α 4 (and α 1  or  α 2 0 and α 3  or  α 4 0 ) such that e t is a stationary process, then B i t c o i n t and G o l d t are asymmetrically or directionally cointegrated. The idea is that the relationship between the variables might not be the same whenever they increase or decrease. To simplify, and without loss of generality, we suppose that only one component of each series appears in the cointegrating relationship, that is,
e 1 t = B i t c o i n t + β + G o l d t +   or   e 2 t = B i t c o i n t β G o l d t
e 3 t = B i t c o i n t + β G o l d t   or   e 4 t = B i t c o i n t β + G o l d t +
where β + ( β )  represents the coefficient of cointegration where a rise (fall) in gold affects a rise or fall in Bitcoin. Due to the nonlinear properties of e j t , j = 1, 2, 3, 4, OLS in Equations (4) and (5) is likely to be biased in a finite sample. For this reason, Schorderet (2003) suggests to estimate by OLS the auxiliary models:
e 1 t = B i t c o i n t + β + G o l d t +   or   e 2 t = B i t c o i n t β G o l d t
B i t c o i n t + + Δ B i t c o i n t = β G o l d t + ε 3 t   or   B i t c o i n t + Δ B i t c o i n 1 t + = β + G o l d t + + ε 4 t
where  ε i t , i = 1, 2, 3, 4, stands for the error term. As proven by West (1988), since the regressor has a linear time trend in mean, the OLS estimate of Equations (6) or (7) is asymptotically normal, and usual statistical inference can be performed. In order to test the null hypothesis of no cointegration against the alternative of asymmetric cointegration, the traditional Engle and Granger procedure can be applied to Equations (6) and (7).

4.2. Asymmetric Causality Test

Hatemi-J (2012) first invented the asymmetric causality test using the framework of a VAR(p) model. To facilitate understanding, we set up a VAR(2) model for preforming an asymmetric causality test. Again, with the exception of Bitcoin and gold, the VAR(2) models for pair ( B i t c o i n t + , G o l d t + ) can be expressed as follows:
B i t c o i n t + = β 10 + β 11 B i t c o i n t 1 + + β 12 G o l d t 1 + + γ 11 B i t c o i n t 2 + + γ 12 G o l d t 2 + + u 1 t
G o l d t + = β 20 + β 21 B i t c o i n t 1 + + β 22 G o l d t 1 + + γ 21 B i t c o i n t 2 + + γ 22 G o l d t 2 + + u 2 t
where β i j and γ i j represent parameters of lag variables, and u i t , i = 1, 2 is the error term. Similarly, VAR models for pairs ( B i t c o i n t , G o l d t ), ( B i t c o i n t + , G o l d t ), and ( B i t c o i n t , G o l d t + ) can also be constructed. The null hypothesis is H0 β 12 = γ 12 = 0 , and the alternative hypothesis is H1 β 12 0   o r   γ 12 0   o r   b o t h 0 . Once we reject the null hypothesis, it is implied that positive gold shock does Granger-cause positive Bitcoin shock. An F test or Wald test are usually used to test the null hypothesis. Although both variables are likely to be non-stationary, we can still estimate the VAR model and perform the Wald test. Toda and Yamamoto (1995)showed that we can estimate the levels of VAR and test the general restrictions on the parameter matrices even if the processes may be integrated or cointegrated in an arbitrary order. Referring to Toda and Yamamoto (1995), an additional unrestricted lag is included in the VAR model in order to take into account the effect of one unit root.
A generalized VAR(p) model for the asymmetric causality test can be constructed as follows:
y t + + = B 0 + B 1 y t 1 + + B 2 y t 2 + + + B P y t P + + u t + ,
where y t + + = ( y 1 t + ,   y 2 t + ) represents the cumulative positive changes in Bitcoin and one of the global financial assets. B 0 is the 2 by 1 intercepts, B P is the parameter matrix, and u t + is the 2 by 1 error term. Similarly, the VAR(p) models are easy to construct for y t + , y t + , and y t . To determine the number of lag order p, we employed the Hatemi-J criterion (HJC) to select the optimal lag order. Following Hatemi-J (2012), the HJC is expressed as
H J C = ln Ω ^ j + j n 2 l n T + 2 n 2 ln l n T 2 T ,           j = 0,1 , , p
where j is the lag order, n is the number of variables and T is the number of observations. | Ω ^ j |  is the determinant of the variance–covariance matrix of the error term in the VAR model based on the lag order p. The smaller the HJC, the better the model.
If the residuals are normally distributed, the Wald statistics is an asymptotic χ 2 distribution. However, financial data are not normally distributed, and there exist autoregressive conditional heteroskedasticity (ARCH) effects (Liu et al. 2020). A bootstrap test is a better way than the standard test when the data are not normal and there is constant variance(Hatemi-J et al. 2017). To overcome this issue, the bootstrap Wald test is used in this study. The procedure of the bootstrap Wald test is demonstrated as follows: (1) we estimate the VAR model by OLS and obtain the estimated coefficients and residuals; (2) the bootstrapped residuals are randomly drawn from residuals; (3) the bootstrapped residuals are mean-corrected to make sure the mean of the bootstrapped residuals is zero at each bootstrap sample; (4) we obtain the bootstrap data by using the estimated coefficients, the original data and the bootstrapped residuals; (5) we estimate the VAR model for the bootstrap data; (6) we repeat the above process 1000 times, and each time the Wald test is estimated; (7) finally, we can compare the Wald statistics from the original data with the bootstrap critical value (see details in (Hatemi-J et al. 2017)). The Wald test is performed by using the “VAR.etp” package in the R software 4.2.1.

5. Empirical Results

This study aims to solve two problems concerning the asymmetric long-term relationship between Bitcoin and global financial assets, namely crude oil, gold, and the US dollar, as well as the asymmetric causality between them. To answer the above two questions, we first take the natural logarithm of Bitcoin and global financial assets and perform unit root tests. Second, we employ the Engle–Granger method to test the long-term relationship between Bitcoin and crude oil, Bitcoin and gold, and Bitcoin and the US dollar, respectively. Based on this, we examine the asymmetric long-term relationship between Bitcoin and global financial assets. Last, we test the asymmetric causality between Bitcoin and global financial assets.

5.1. Results of Unit Root Tests

Table 1 shows the unit root test results of Bitcoin, crude oil, gold and the US dollar. ADF and PP methods are used for the unit root test. The null hypothesis of ADF and PP methods is that the sequence has a Root of unity. It can be observed that neither Bitcoin nor crude oil, gold, or the US dollar challenge the null hypothesis at a 5% confidence level, indicating that the level data are all non-stationary. The unit root test results of first-order difference data show that all first-order difference data challenge the null hypothesis at a 1% confidence level, indicating that all first-order difference data are stationary. Many scholars including Zhang et al. (2022) and Dyhrberg (2016a) have also proved that the logarithmic return of financial assets is stationary. On this basis, the ADF, PP, and KPSS methods are employed to examine the stationarity of the residuals with logbitcoin as the dependent variable and global financial assets as independent variables for regression analysis. If the test result is stationary, it indicates the presence of a co-integration relationship between Bitcoin and global financial assets. Table 2 shows the unit root test results of the residuals. In the ADF test, the Akaike information criterion (AIC) is used to select the appropriate lag length for dependent variables. In the PP and KPSS tests, the Newey–West automatic method is adopted to determine the bandwidth parameters (Newey and West 1994). The null hypothesis of ADF and PP tests is that there is a unit root, while that of the KPSS test is that data are stationary. It is evident that the null hypothesis cannot be challenged in both ADF and PP tests, while it is challenged in the KPSS test. That is to say, the three residual sequences are not stationary. Therefore, there is no co-integration or long-term relationship between Bitcoin and the said three global financial assets. First, some scholars support this viewpoint, too. For example, the long-term relationships between Bitcoin and crude oil and between Bitcoin and the US dollar were refuted, respectively, by Ciaian et al. (2016) and Ünvana (Ünvan 2021). The relationship between Bitcoin and global financial assets is not long-lasting but close, including, for example, time-varying correlation (Liu and Li 2022), nonlinear correlation (Wei et al. 2023), and the spillover effect (Liu and Li 2022).

5.2. Results of Asymmetric Co-Integration and Causality Tests

Although no co-integration relationship exists between Bitcoin and global financial assets, positive (negative) fluctuation of global financial assets may affect Bitcoin and the impact may last for a long time. Table 3 shows the results of the asymmetric co-integration test between the positive/negative fluctuation of global financial assets and the positive fluctuation of Bitcoin. First, in ADF and PP tests, only the US dollar - and Bitcoin + are significant when the confidence level is set to 5%, while in the KPSS test, only the residual sequence of the US dollar - is non-significant. Therefore, a nonlinear long-term relationship exists between the negative fluctuation of the US dollar and the positive fluctuation of Bitcoin. The negative fluctuation of the US dollar represents an appreciation of the currency, which is the base currency of Bitcoin. Therefore, a lower USDX causes a positive fluctuation of Bitcoin (Oad Rajput et al. 2022). Second, no co-integration relationship exists between the impact on gold and crude oil, positive or negative, and the positive impact on Bitcoin. Table 4 shows the results of the asymmetric co-integration test between the positive/negative fluctuation of global financial assets and the negative fluctuation of Bitcoin. ADF and PP test results show that all the residual sequences are significant at least when the confidence level is set to 10%. None of the KPSS tests challenge the null hypothesis. Therefore, an asymmetric co-integration relationship exists between global financial assets (gold, crude oil, the US dollar) and negatively fluctuating Bitcoin. That is to say, when Bitcoin depreciates, there is a co-integration relationship between gold, crude oil or the US dollar, regardless of whether they appreciate or depreciate, and Bitcoin.
Table 5 shows the estimation of the long-term relationship. As variables consist of the accumulation of positive or negative impacts, the slope coefficient has no economic significance. However, the operators and values of the slope coefficients still indicate something. First, all the slope coefficients are significant when the confidence level is set to 1%, supporting the existence of asymmetry. Second, compared with gold and crude oil, the asymmetric impact of USDX on Bitcoin is high. The decline in USDX, equivalent to the appreciation of the US dollar, has the strongest impact on the appreciation of Bitcoin. This may be because Bitcoin is denominated in the US dollar. It could also be found that, compared with the positive impact, the negative impact on global financial assets has a strong influence on the depreciation of Bitcoin. As expected, the appreciation and depreciation of gold, crude oil and the US dollar have opposite impacts on the depreciation of Bitcoin. Table 6 and Table 7 display the asymmetric co-integration of Bitcoin and the global financial assets before and after the outbreak of the COVID-19 pandemic, respectively. Table 6 shows that the rise of gold has a long-run relationship with the rise of Bitcoin, and the rise of the US dollar has a long-run relationship with the fall of Bitcoin. Overall, we cannot reject the null hypothesis in all ADF and PP tests and reject the null hypothesis in the KPSS test. Clearly, this implies that there is no asymmetric cointegration between Bitcoin and the global financial assets during the COVID-19 pandemic. Then, again, for negative shocks to crude oil and Bitcoin, the ADF statistic is significant at the 10% credit level, while the KPSS test is insignificant at the 5% level. However, we cannot reject the null hypothesis of the PP test. The results of the PP test are not consistent with the results of the ADF and PP tests. We may not be able to determine whether there is a long-run relationship between crude oil and Bitcoin for negative shocks.
The multivariate normality test and the ARCH test were first conducted to determine whether the Granger causality test is applicable. Test results are shown in Table 8. The Jarque–Bera test showed a non-binary normal distribution of Bitcoin and all the other assets. Most multivariate ARCH tests challenged the null hypothesis, too, indicating a potential ARCH fluctuation of Bitcoin and most financial assets. Therefore, standard test methods are not applicable to the causality. Table 9 shows the results of tests for causality using the bootstrap simulations. First, there is a Granger causality between crude oil (but not gold or the US dollar) and Bitcoin. Second, an asymmetric causality exists between Bitcoin and crude oil, too. There is a causality between the negative impact on crude oil and the positive/negative fluctuation of Bitcoin. Second, there is no causality between gold/US dollar, regardless of whether a positive or negative impact is suffered, and Bitcoin fluctuation. Is there any difference in the asymmetric causality between Bitcoin and global financial assets before and after the COVID-19 outbreak? Table 10 and Table 11, respectively, show the asymmetric causality test results between Bitcoin and global financial assets before and after the COVID-19 outbreak. The COVID-19 pandemic did cause changes in the causality between Bitcoin and the global financial assets. Before the pandemic, a negative impact on gold would cause a positive impact on Bitcoin. There is neither Granger nor asymmetric causality between crude oil/US dollar and Bitcoin. Regarding the data on the time after the outbreak of the pandemic, however, Table 11 shows results in line with those of Table 9.

5.3. Further Analysis

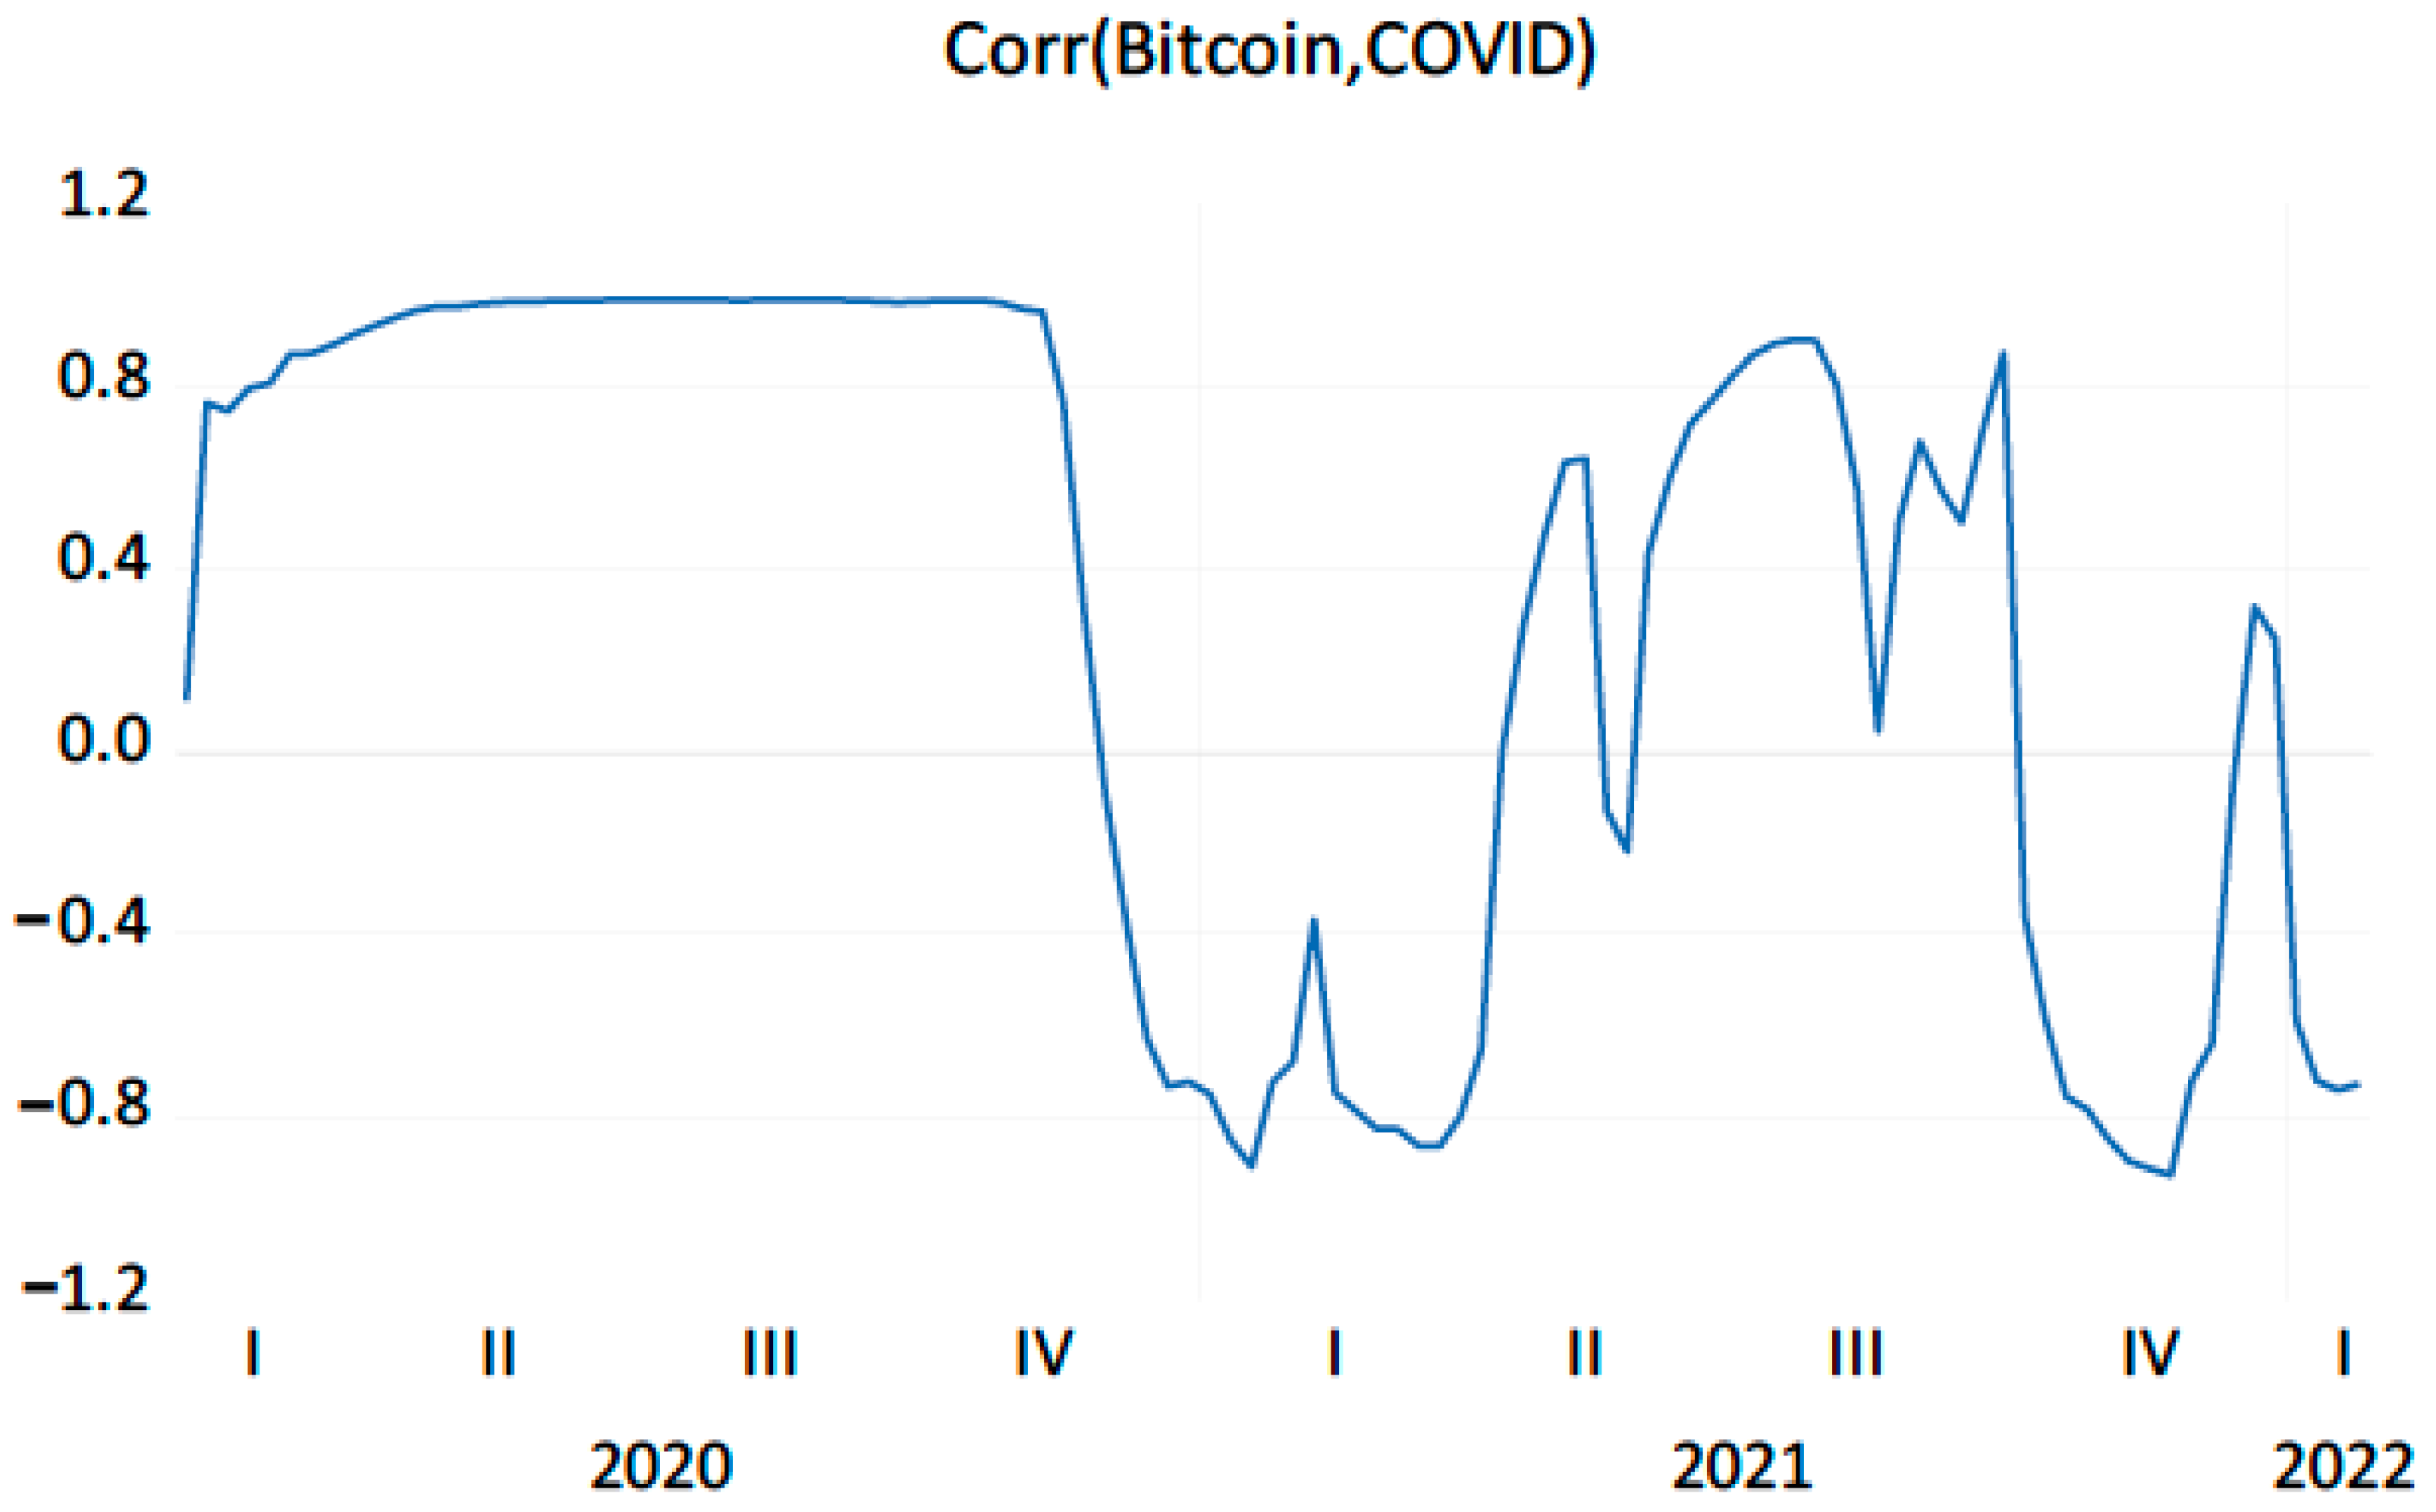
The above empirical results confirm that the asymmetric cointegration and causality between Bitcoin and the global financial assets before and after the COVID-19 pandemic outbreak are significantly different. This suggests that the COVID-19 pandemic has some relationship with such changes at least. Therefore, we need to further investigate the co-movement between Bitcoin and the COVID-19 pandemic. We measured the co-movement between Bitcoin and the global weekly number of confirmed cases using the DCC-GARCH model. The global weekly number of confirmed cases was derived from the Coronavirus Government Response Tracker (OxCGRT) produced by researchers at the Blavatnik School of Government, University of Oxford (Hasell et al. 2020). The DCC-GARCH model is a common measure of co-movement. For this reason, we did not provide a detailed description of the DCC-GARCH models in this paper. We ran the DCC-GARCH model using Eviews version 10 software. Figure 4 shows the dynamic correlation between Bitcoin and the COVID-19 pandemic from January 2020 to January 2022. We found a high time-varying correlation between Bitcoin and the COVID-19 pandemic. Bitcoin has a high positive correlation of over 0.9 with the COVID-19 pandemic, especially in the first year of the COVID-19 pandemic. It is safe to say that the price of Bitcoin rose rapidly with the number of confirmed cases in 2020. The high correlation between Bitcoin and the COVID-19 pandemic aptly indicates that Bitcoin was affected by the COVID-19 pandemic, and the COVID-19 pandemic changed the causal relationship between Bitcoin and global financial assets. In addition, we tested for Granger causality between Bitcoin and the COVID-19 pandemic using a VAR model. The results showed that the Chi-square statistic was 8.798 in the Wald test, which rejects the null hypothesis that the COVID-19 pandemic does not Granger-cause Bitcoin at the 5% level. This implies that the COVID-19 pandemic does Granger-cause Bitcoin, which again indirectly supports the suspicion that the COVID-19 pandemic changes the causality of Bitcoin with the global financial assets.

5.4. Discussion

The empirical results have identified the asymmetric co-integration relationship and causality between Bitcoin and the global financial assets. Only a better understanding of these phenomena and findings could help the investors and financial institutions make more informed decisions. First, the relationship between Bitcoin and global financial assets changed somewhat before and after the COVID-19 pandemic. The fall of Bitcoin had a long-run relationship with the rise and fall of gold, crude oil, and the US dollar, but this relationship ceased to exist during the COVID-19 pandemic. There are studies confirming that the New Crown epidemic caused an upward movement of Bitcoin’s price (Goodell and Goutte 2021), and also revealing a huge volatility change in the relationship between the New Crown epidemic and the energy market (Maneejuk et al. 2021). This may all indirectly confirm our view. On the one hand, this suggests that the COVID-19 pandemic hit global economic development, leading to a more complex relationship between Bitcoin and global financial assets. On the other hand, during the COVID-19 pandemic, because Bitcoin did not have a long-term relationship with gold, crude oil, and the US dollar, financial institutions and investors could no longer make investment decisions based on the fact that they had a long-term relationship due to the fact that the relevance of Bitcoin and traditional financial assets during tranquil and turbulent periods is significantly different (Elsayed et al. 2022). Second, the causality between Bitcoin and the global financial assets also changed significantly before and after the outbreak of the COVID-19 pandemic. Before the COVID-19 pandemic, only the fall in the price of gold was a Granger causality for Bitcoin’s rise. No other global financial assets were Granger causality for Bitcoin. During periods of economic tranquility, the price of gold falls if there is a drop in market demand, which causes some investors to look for higher returns on Bitcoin, which causes the price of Bitcoin to rise (Kyriazis 2020). After the outbreak of the COVID-19 pandemic, crude oil was the Granger causality for the rise and fall of Bitcoin price. Li et al. (2021) substantially supported the view that there is an asymmetric Granger causality between crude oil and Bitcoin.
Bitcoin investors can benefit from following fluctuations in the price of gold and crude oil over time, which can be used to make Bitcoin investment decisions. In periods of economic stability, Bitcoin seekers can refer to movements in the price of gold to formulate investment strategies. In a turbulent economy, movements in the price of crude oil become more important. The US dollar has the lowest reference value compared to gold and crude oil. However, in the long run, when the dollar falls, the risk of Bitcoin falling is higher, and investors and financial institutions need to keep an eye on it frequently.

6. Conclusions

Bitcoin is always popular among investors. A clear understanding of the relationship between Bitcoin and global financial assets is essential to investors and financial institutions. Based on existing studies, asymmetric co-integration and causality tests are adopted to explore the asymmetric co-integration and causality between Bitcoin and gold, Bitcoin and crude oil and Bitcoin and gold. The test results are shown as below: first, using Engle–Granger co-integration test, we found that there is no co-integration relationship between Bitcoin and the global financial assets. Second, there is a significant co-integration relationship between the negative impact on the US dollar and the positive impact on Bitcoin. Third, there is a co-integration relationship between a positive (negative) impact on the global financial assets and a negative impact on Bitcoin. Fourth, there is a Granger causality between crude oil and Bitcoin, wherein a negative impact on crude oil causes a negative impact on Bitcoin too. Fifth, there is no causality between gold/US dollar and Bitcoin. These findings identify the relationship between Bitcoin and global financial assets from an asymmetric perspective, and may facilitate decision making and risk avoidance for investments in Bitcoin and the global financial assets.
The results of this paper are not only supported by other literature, but also further extend previous research. The relationship between Bitcoin and crude oil became stronger during the COVID-19 pandemic (Yousaf et al. 2022), which just shows that the epidemic changed the relationship between Bitcoin and crude oil. This finding also validates the idea that the relationship between Bitcoin and the global financial assets changed before and after the COVID-19 pandemic in this paper. Similarly, the relationship between Bitcoin and gold, and Bitcoin and the US dollar increased during the epidemic (González et al. 2021). It may not be accurate to test the cointegration and causality between Bitcoin and the global financial assets using data from the early stages of the outbreak. Ibrahim and Ali Basah (2022) found no causal relationship between Bitcoin and gold, crude oil, and the US dollar. Instead, we further analyze their asymmetric causality and cointegration.
This paper, despite its findings in the asymmetric relationship between Bitcoin and global financial assets, has its limitations. Both the asymmetric co-integration test and asymmetric Granger causality test are static and unable to reflect the dynamic relationship between Bitcoin and global financial assets. Also, the trends of Bitcoin and global financial assets may have their own cycles. The co-integration relationship or causality may vary with the economic cycles. In addition, the Engle–Granger method leads to severe downward bias in the long-run (cointegration) parameter, and the Johansen Cointegration Test is preferable to the Engle and Granger procedures (Bilgili 1998). Therefore, future studies require us to explore the dynamic relationship between Bitcoin and global financial assets, as well as the co-integration and causality in different time periods. How to use the Johansen approach in the asymmetric cointegration test is also worth exploring.

Author Contributions

Conceptualization, Y.L. and N.N.; methodology, Y.L.; software, Y.L.; validation, N.N.; formal analysis, A.T.; investigation, A.T. and T.R.; resources, N.N.; data curation, Y.L.; writing—original draft preparation, Y.L. and N.N.; writing—review and editing, N.N. and Y.L.; supervision, N.N. and A.T.; project administration, Y.L.; funding acquisition, Y.L. All authors have read and agreed to the published version of the manuscript.

Funding

This research received no external funding.

Institutional Review Board Statement

Not applicable.

Data Availability Statement

The data presented in this study are available on request from the authors.

Acknowledgments

We would like to express our appreciation to the editor and the anonymous reviewers for your in-depth comments, suggestions, and corrections, which have greatly improved the manuscript.

Conflicts of Interest

The authors declare no conflict of interest.

References

  1. Abdullah, Ali, and A. M. Mutawa. 2023. An Invitation Model Protocol (Imp) for the Bitcoin Asymmetric Lightning Network. Symmetry 15: 1273. [Google Scholar] [CrossRef]
  2. Abdul-Rahim, Ruzita, Airil Khalid, Zulkefly Abdul Karim, and Mamunur Rashid. 2022. Exploring the Driving Forces of Stock-Cryptocurrency Comovements During Covid-19 Pandemic: An Analysis Using Wavelet Coherence and Seemingly Unrelated Regression. Mathematics 10: 2116. [Google Scholar] [CrossRef]
  3. Al-Khazali, Osamah, Elie Bouri, and David Roubaud. 2018. The impact of positive and negative macroeconomic news surprises: Gold versus Bitcoin. Economics Bulletin 38: 373–82. [Google Scholar]
  4. Aliu, Florin, Alban Asllani, and Simona Hašková. 2023. The Impact of Bitcoin on Gold, the Volatility Index (Vix), and Dollar Index (Usdx): Analysis Based on Var, Svar, and Wavelet Coherence. Studies in Economics and Finance. ahead-of-print. [Google Scholar] [CrossRef]
  5. Antoniadis, I., N. Sariannidis, and S. Kontsas. 2018. The Effect of Bitcoin Prices on Us Dollar Index Price. In Advances in Time Series Data Methods in Applied Economic Research. Edited by N. Tsounis and A. Vlachvei. Berlin: Springer, pp. 511–21. [Google Scholar] [CrossRef]
  6. Attarzadeh, Amirreza, and Mehmet Balcilar. 2022. On the Dynamic Return and Volatility Connectedness of Cryptocurrency, Crude Oil, Clean Energy, and Stock Markets: A Time-Varying Analysis. Environmental Science and Pollution Research 29: 65185–96. [Google Scholar] [CrossRef]
  7. Baur, Dirk G., and Lai Hoang. 2021. The Bitcoin Gold Correlation Puzzle. Journal of Behavioral and Experimental Finance 32: 100561. [Google Scholar] [CrossRef]
  8. Baur, Dirk G., Kihoon Hong, and Adrian D. Lee. 2018. Bitcoin: Medium of Exchange or Speculative Assets? Journal of International Financial Markets, Institutions and Money 54: 177–89. [Google Scholar] [CrossRef]
  9. Bhuiyan, Rubaiyat Ahsan, Afzol Husain, and Changyong Zhang. 2021. A Wavelet Approach for Causal Relationship between Bitcoin and Conventional Asset Classes. Resources Policy 71: 101971. [Google Scholar] [CrossRef]
  10. Bilgili, Faik. 1998. Stationarity and Cointegration Tests: Comparison of Engle-Granger and Johansen Methodologies. Erciyes University 13: 131–41. [Google Scholar]
  11. Bouoiyour, Jamal, and Refk Selmi. 2015. What Does Bitcoin Look Like. Annals of Economics and Finance 16: 449–92. [Google Scholar]
  12. Bouoiyour, Jamal, Refk Selmi, and Mark E. Wohar. 2019. Bitcoin: Competitor or Complement to Gold? Economics Bulletin 39: 186–91. [Google Scholar]
  13. Cao, Guangxi, and Meijun Ling. 2022. Asymmetry and Conduction Direction of the Interdependent Structure between Cryptocurrency and Us Dollar, Renminbi, and Gold Markets. Chaos Solitons Fractals 155: 111671. [Google Scholar] [CrossRef]
  14. Chan, Jireh Yi-Le, Seuk Wai Phoong, Seuk Yen Phoong, Wai Khuen Cheng, and Yen-Lin Chen. 2023. The Bitcoin Halving Cycle Volatility Dynamics and Safe Haven-Hedge Properties: A Msgarch Approach. Mathematics 11: 698. [Google Scholar] [CrossRef]
  15. Chen, Junwei. 2023. Analysis of Bitcoin Price Prediction Using Machine Learning. Journal of Risk and Financial Management 16: 51. [Google Scholar] [CrossRef]
  16. Chen, Hongtao, Li Liu, and Xiaolei Li. 2018. The Predictive Content of Cboe Crude Oil Volatility Index. Physica A Statistical Mechanics and its Applications 492: 837–50. [Google Scholar] [CrossRef]
  17. Ciaian, Pavel, Miroslava Rajcaniova, and d’Artis Kancs. 2016. The Digital Agenda of Virtual Currencies: Can Bitcoin Become a Global Currency? Information Systems and E-Business Management 14: 883–919. [Google Scholar] [CrossRef]
  18. Cunado, Juncal, Luis A. Gil-Alana, and Rangan Gupta. 2019. Persistence in Trends and Cycles of Gold and Silver Prices: Evidence from Historical Data. Physica A Statistical Mechanics and its Applications 514: 345–54. [Google Scholar] [CrossRef]
  19. Das, Debojyoti, Corlise Liesl Le Roux, Rabin K. Jana, and Anupam Dutta. 2020. Does Bitcoin Hedge Crude Oil Implied Volatility and Structural Shocks? A Comparison with Gold, Commodity and the Us Dollar. Finance Research Letters 36: 101335. [Google Scholar] [CrossRef]
  20. Detzel, Andrew, Hong Liu, Jack Strauss, Guofu Zhou, and Yingzi Zhu. 2021. Learning and Predictability Via Technical Analysis: Evidence from Bitcoin and Stocks with Hard-to-Value Fundamentals. Financial Management 50: 107–37. [Google Scholar] [CrossRef]
  21. Dyhrberg, Anne Haubo. 2016a. Bitcoin, Gold and the Dollar—A Garch Volatility Analysis. Finance Research Letters 16: 85–92. [Google Scholar] [CrossRef]
  22. Dyhrberg, Anne Haubo. 2016b. Hedging Capabilities of Bitcoin. Is It the Virtual Gold? Finance Research Letters 16: 139–44. [Google Scholar] [CrossRef]
  23. Elsayed, Ahmed H., Giray Gozgor, and Chi Keung Marco Lau. 2022. Risk Transmissions between Bitcoin and Traditional Financial Assets During the Covid-19 Era: The Role of Global Uncertainties. International Review of Financial Analysis 81: 102069. [Google Scholar] [CrossRef]
  24. Fasanya, Ismail Olaleke, Oluwatomisin Oyewole, and Temitope Odudu. 2021. Returns and Volatility Spillovers among Cryptocurrency Portfolios. International Journal of Managerial Finance 17: 327–41. [Google Scholar] [CrossRef]
  25. González, Maria de la O., Francisco Jareño, and Frank S. Skinner. 2021. Asymmetric interdependencies between large capital cryptocurrency and Gold returns during the COVID-19 pandemic crisis. International Review of Financial Analysis 76: 101773. [Google Scholar] [CrossRef]
  26. Goodell, John W., and Stephane Goutte. 2021. Co-movement of COVID-19 and Bitcoin: Evidence from wavelet coherence analysis. Finance Research Letters 38: 101625. [Google Scholar] [CrossRef]
  27. Granger, Clive W. J., and Gawon Yoon. 2002. Hidden Cointegration. Econometrics Journal 1: 1–48. [Google Scholar] [CrossRef]
  28. Hasell, Joe, Edouard Mathieu, Diana Beltekian, Bobbie Macdonald, Charlie Giattino, Esteban Ortiz-Ospina, Max Roser, and Hannah Ritchie. 2020. A cross-country database of COVID-19 testing. Science Data 7: 345. [Google Scholar] [CrossRef] [PubMed]
  29. Hatemi-J, Abdulnasser. 2012. Asymmetric causality tests with an application. Empirical Economics 43: 447–56. [Google Scholar] [CrossRef]
  30. Hatemi-J, Abdulnasser. 2020. Hidden Panel Cointegration. Journal of King Saud University-Science 32: 507–10. [Google Scholar] [CrossRef]
  31. Hatemi-J, Abdulnasser, Abdulrahman Al Shayeb, and Eduardo Roca. 2017. The Effect of Oil Prices on Stock Prices: Fresh Evidence from Asymmetric Causality Tests. Applied Economics 49: 1584–92. [Google Scholar] [CrossRef]
  32. Hsu, Tzu-Kuang, Wan-Chu Lien, and Yao-Hsien Lee. 2023. Exploring Relationships among Crude Oil, Bitcoin, and Carbon Dioxide Emissions: Quantile Mediation Analysis. Processes 11: 1555. [Google Scholar] [CrossRef]
  33. Ibrahim, Jerina, and Mohamad Yazis Ali Basah. 2022. A Study on Relationship between Crypto Currency, Commodity and Foreign Exchange Rate. The Journal of Muamalat and Islamic Finance Research 19: 1–12. [Google Scholar] [CrossRef]
  34. Jareño, Francisco, María de la O González, Marta Tolentino, and Karen Sierra. 2020. Bitcoin and Gold Price Returns: A Quantile Regression and Nardl Analysis. Resources Policy 67: 101666. [Google Scholar] [CrossRef]
  35. Jin, Jingyu, Jiang Yu, Yang Hu, and Yue Shang. 2019. Which One Is More Informative in Determining Price Movements of Hedging Assets? Evidence from Bitcoin, Gold and Crude Oil Markets. Physica A: Statistical Mechanics and its Applications 527: 121121. [Google Scholar] [CrossRef]
  36. Kang, Sang Hoon, Ron P. McIver, and Jose Arreola Hernandez. 2019. Co-Movements between Bitcoin and Gold: A Wavelet Coherence Analysis. Physica A: Statistical Mechanics and its Applications 536: 120888. [Google Scholar] [CrossRef]
  37. Khan, Maaz, Umar Nawaz Kayani, Mrestyal Khan, Khurrum Shahzad Mughal, and Mohammad Haseeb. 2023. COVID-19 Pandemic & Financial Market Volatility; Evidence from GARCH Models. Journal of Risk and Financial Management 16: 50. [Google Scholar]
  38. Kilian, Lutz. 2009. Not All Oil Price Shocks Are Alike: Disentangling Demand and Supply Shocks in the Crude Oil Market. American Economic Review 99: 1053–69. [Google Scholar] [CrossRef]
  39. Kim, Jong-Min, Seong-Tae Kim, and Sangjin Kim. 2020. On the Relationship of Cryptocurrency Price with Us Stock and Gold Price Using Copula Models. Mathematics 8: 1859. [Google Scholar] [CrossRef]
  40. Klein, Tony, Hien Pham Thu, and Thomas Walther. 2018. Bitcoin Is Not the New Gold—A Comparison of Volatility, Correlation, and Portfolio Performance. International Review of Financial Analysis 59: 105–16. [Google Scholar] [CrossRef]
  41. Kumar, Suresh, Ankit Kumar, and Gurcharan Singh. 2023. Gold, Crude Oil, Bitcoin and Indian Stock Market: Recent Confirmation from Nonlinear Ardl Analysis. Journal of Economic Studies 50: 734–51. [Google Scholar] [CrossRef]
  42. Kyriazis, Nikolaos A. 2020. Is Bitcoin similar to gold? An integrated overview of empirical findings. Journal of Risk and Financial Management 13: 88. [Google Scholar] [CrossRef]
  43. Lardic, Sandrine, and Valerie Mignon. 2008. Oil Prices and Economic Activity: An Asymmetric Cointegration Approach. Energy Economics 30: 847–55. [Google Scholar] [CrossRef]
  44. Li, Dongxin, Yanran Hong, Lu Wang, Pengfei Xu, and Zhigang Pan. 2022. Extreme Risk Transmission among Bitcoin and Crude Oil Markets. Resources Policy 77: 102761. [Google Scholar] [CrossRef]
  45. Li, Zhenghui, Zhiming Ao, and Bin Mo. 2021. Revisiting the Valuable Roles of Global Financial Assets for International Stock Markets: Quantile Coherence and Causality-in-Quantiles Approaches. Mathematics 9: 1750. [Google Scholar] [CrossRef]
  46. Liu, Xin, and Bowen Li. 2022. Safe-haven or speculation? Research on price and risk dynamics of Bitcoin. Applied Economics Letters. ahead-of-print. [Google Scholar] [CrossRef]
  47. Liu, Jianxu, Quanrui Song, Yang Qi, Sanzidur Rahman, and Songsak Sriboonchitta. 2020. Measurement of systemic risk in global financial markets and its application in forecasting trading decisions. Sustainability 12: 4000. [Google Scholar] [CrossRef]
  48. Long, Shaobo, Hongxia Pei, Hao Tian, and Kun Lang. 2021. Can Both Bitcoin and Gold Serve as Safe-Haven Assets?—A Comparative Analysis Based on the Nardl Model. International Review of Financial Analysis 78: 101914. [Google Scholar] [CrossRef]
  49. Madichie, Chekwube V., Franklin N. Ngwu, Eze A. Eze, and Olisaemeka D. Maduka. 2023. Modelling the Dynamics of Cryptocurrency Prices for Risk Hedging: The Case of Bitcoin, Ethereum, and Litecoin. Cogent Economics Finance 11: 2196852. [Google Scholar] [CrossRef]
  50. Maneejuk, Paravee, Sukrit Thongkairat, and Wilawan Srichaikul. 2021. Time-varying co-movement analysis between COVID-19 shocks and the energy markets using the Markov Switching Dynamic Copula approach. Energy Reports 7: 81–88. [Google Scholar] [CrossRef]
  51. Mokni, Khaled, and Ahdi Noomen Ajmi. 2021. Cryptocurrencies Vs. Us Dollar: Evidence from Causality in Quantiles Analysis. Economic Analysis and Policy 69: 238–52. [Google Scholar] [CrossRef]
  52. Newey, Whitney K., and Kenneth D. West. 1994. Automatic Lag Selection in Covariance Matrix Estimation. The Review of Economic Studies 61: 631–53. [Google Scholar] [CrossRef]
  53. Oad Rajput, Suresh Kumar, Ishfaque Ahmed Soomro, and Najma Ali Soomro. 2022. Bitcoin sentiment index, bitcoin performance and US dollar exchange rate. Journal of Behavioral Finance 23: 150–65. [Google Scholar] [CrossRef]
  54. Ozturk, Serda Selin. 2020. Dynamic Connectedness between Bitcoin, Gold, and Crude Oil Volatilities and Returns. Journal of Risk and Financial Management 13: 275. [Google Scholar] [CrossRef]
  55. Phoong, Seuk Wai, Seuk Yen Phoong, and Kok Hau Phoong. 2020. Analysis of Structural Changes in Financial Datasets Using the Breakpoint Test and the Markov Switching Model. Symmetry 12: 401. [Google Scholar] [CrossRef]
  56. Schorderet, Yann. 2003. Asymmetric Cointegration. Geneva: Université de Genève. [Google Scholar]
  57. Selmi, Refk, Walid Mensi, Shawkat Hammoudeh, and Jamal Bouoiyour. 2018. Is Bitcoin a Hedge, a Safe Haven or a Diversifier for Oil Price Movements? A Comparison with Gold. Energy Economics 74: 787–801. [Google Scholar] [CrossRef]
  58. Shahzad, Syed Jawad Hussain, Elie Bouri, David Roubaud, Ladislav Kristoufek, and Brian Lucey. 2019. Is Bitcoin a Better Safe-Haven Investment Than Gold and Commodities? International Review of Financial Analysis 63: 322–30. [Google Scholar] [CrossRef]
  59. Su, Xianfang, and Yong Li. 2020. Dynamic Sentiment Spillovers among Crude Oil, Gold, and Bitcoin Markets: Evidence from Time and Frequency Domain Analyses. PLoS ONE 15: e0242515. [Google Scholar] [CrossRef]
  60. Szetela, Beata, Grzegorz Mentel, and Stanisław Gędek. 2016. Dependency Analysis between Bitcoin and Selected Global Currencies. Dynamic Econometric Models 16: 133–44. [Google Scholar] [CrossRef]
  61. Tadi, Masood, and Irina Kortchemski. 2021. Evaluation of Dynamic Cointegration-Based Pairs Trading Strategy in the Cryptocurrency Market. Studies in Economics and Finance 38: 1054–75. [Google Scholar] [CrossRef]
  62. Tang, Ke, and Wei Xiong. 2012. Index Investment and the Financialization of Commodities. Financial Analysts Journal 68: 54–74. [Google Scholar] [CrossRef]
  63. Tiffani, Ingrid, Claudia Calvilus, and Shinta Amalina Hazrati Havidz. 2023. Investigation of Cointegration and Causal Linkages on Bitcoin Volatility During Covid-19 Pandemic. Global Business and Economics Review 28: 195–217. [Google Scholar] [CrossRef]
  64. Toda, Hiro Y., and Taku Yamamoto. 1995. Statistical inference in vector autoregressions with possibly integrated processes. Journal of econometrics 66: 225–50. [Google Scholar] [CrossRef]
  65. Ünvan, Yüksel Akay. 2021. Impacts of Bitcoin on USA, Japan, China and Turkey Stock Market Indexes: Causality Analysis with Value at Risk Method (Var). Communications in Statistics-Theory and Methods 50: 1599–614. [Google Scholar] [CrossRef]
  66. Wang, Pengfei, Wei Zhang, Xiao Li, and Dehua Shen. 2019. Is Cryptocurrency a Hedge or a Safe Haven for International Indices? A Comprehensive and Dynamic Perspective. Finance Research Letters 31: 1–18. [Google Scholar] [CrossRef]
  67. Wang, Yizhi, Brian Lucey, Samuel Alexandre Vigne, and Larisa Yarovaya. 2022. An Index of Cryptocurrency Environmental Attention (Icea). China Finance Review International 12: 378–414. [Google Scholar] [CrossRef]
  68. Wei, Li, Ming-Chih Lee, Wan-Hsiu Cheng, Chia-Hsien Tang, and Jing-Wun You. 2023. Evaluating the Efficiency of Financial Assets as Hedges against Bitcoin Risk During the Covid-19 Pandemic. Mathematics 11: 2917. [Google Scholar] [CrossRef]
  69. West, Kenneth D. 1988. Asymptotic Normality, When Regressors Have a Unit Root. Econometrica 56: 1397–417. [Google Scholar] [CrossRef]
  70. Wu, Shan, Mu Tong, Zhongyi Yang, and Abdelkader Derbali. 2019. Does Gold or Bitcoin Hedge Economic Policy Uncertainty? Finance Research Letters 31: 171–78. [Google Scholar] [CrossRef]
  71. Yousaf, Imran, Shoaib Ali, Elie Bouri, and Tareq Saeed. 2022. Information transmission and hedging effectiveness for the pairs crude oil-gold and crude oil-Bitcoin during the COVID-19 outbreak. Economic Research-Ekonomska Istraživanja 35: 1913–34. [Google Scholar] [CrossRef]
  72. Yu, Jiang, Yue Shang, and Xiafei Li. 2021. Dependence and Risk Spillover among Hedging Assets: Evidence from Bitcoin, Gold, and Usd. Discrete Dynamics in Nature and Society 2021: 2010705. [Google Scholar] [CrossRef]
  73. Zha, Rui, Lean Yu, Yi Su, and Hang Yin. 2023. Dependences and Risk Spillover Effects between Bitcoin, Crude Oil and Other Traditional Financial Markets During the Covid-19 Outbreak. Environmental Science and Pollution Research 30: 40737–51. [Google Scholar] [CrossRef] [PubMed]
  74. Zhang, Hongwei, Huojun Hong, Yaoqi Guo, and Cai Yang. 2022. Information Spillover Effects from Media Coverage to the Crude Oil, Gold, and Bitcoin Markets During the Covid-19 Pandemic: Evidence from the Time and Frequency Domains. International Review of Economics & Finance 78: 267–85. [Google Scholar] [CrossRef]
  75. Zhu, Yingjie, Jiageng Ma, Fangqing Gu, Jie Wang, Zhijuan Li, Youyao Zhang, Jiani Xu, Yifan Li, Yiwen Wang, and Xiangqun Yang. 2023. Price Prediction of Bitcoin Based on Adaptive Feature Selection and Model Optimization. Mathematics 11: 1335. [Google Scholar] [CrossRef]
  76. Zwick, Hélène Syed, and Sarfaraz Ali Shah Syed. 2019. Bitcoin and Gold Prices: A Fledging Long-Term Relationship. Theoretical Economics Letters 9: 2516–25. [Google Scholar] [CrossRef]
Figure 1. The prices of Bitcoin and gold from January 2015 to June 2023.
Jrfm 16 00455 g001
Figure 2. The prices of Bitcoin and crude oil from January 2015 to June 2023.
Jrfm 16 00455 g002
Figure 3. The prices of Bitcoin and US dollar from January 2015 to June 2023.
Jrfm 16 00455 g003
Figure 4. The co-movement between Bitcoin and the COVID-19 pandemic.
Jrfm 16 00455 g004
Table 1. Unit root tests of the Bitcoin, gold, crude oil and the US dollar.
VariablesADFPP
Logbitcoin−1.341−1.485
Loggold−2.919−2.828
Logoil−3.281−3.105
Logusd−2.362−2.327
1st Difference
VariablesTrendtrend
Dlogbitcoin−20.282 ***−20.313 ***
Dloggold−22.563 ***−22.586 ***
Dlogoil−7.645 ***−20.928 ***
Dlogusd−11.617 ***−20.364 ***
Note: *** denotes statistical significance at the 1% significance level.
Table 2. Unit root tests on residual series.
ADFPPKPSS
gold−2.215−2.2840.378 ***
oil−2.330−2.5280.382 ***
USD−1.331−1.4730.335 ***
Note: *** denotes statistical significance at the 1% significance level.
Table 3. Unit root tests on residual series: tests for asymmetric cointegration for positive Bitcoin.
PositiveADFPPKPSS
gold+−0.950−1.2260.404 *
oil+−0.782−1.1690.498 *
USD+−1.325−1.6020.219 ***
gold−−1.314−1.4080.398 *
oil−−1.051−1.5570.296 *
USD−−2.102 **−2.309 **0.195
Note: ***, **, and * denote statistical significance at the 1%, 5%, and 10% significance levels.
Table 4. Unit root tests on residual series: tests for asymmetric cointegration for negative Bitcoin.
NegativeADFPPKPSS
gold+−1.864 *−2.043 **0.183
oil+−1.800 *−2.013 **0.255
USD+−2.824 ***−2.777 ***0.117
gold−−2.312 **−2.239 **0.289
oil−−1.635 *−1.748 *0.195
USD−−2.427 **−2.315 **0.133
Note: ***, **, and * denote statistical significance at the 1%, 5%, and 10% significance levels.
Table 5. Long-run relationships.
PositiveConstants.e.Slopes.e.
USD−−1.243 ***0.186−13.379 ***0.210
negative
gold+0.213 *0.120−4.033 ***0.049
oil+0.1160.121−1.411 ***0.015
USD+1.348 ***0.189−9.343 ***0.167
gold−0.725 ***0.1474.873 ***0.066
oil−0.285 *0.1431.494 ***0.022
USD−1.098 ***0.2089.610 ***0.209
Note: *** and * denote statistical significance at the 1% and 10% significance levels.
Table 6. Unit root tests on residual series: tests for asymmetric cointegration for Bitcoin before the outbreak of the COVID-19 pandemic.
PositiveADFPPKPSS
gold+−1.622 *−1.545 *0.345
oil+−2.111−1.7290.365 *
USD+−2.450−2.4490.264 ***
gold−−2.237−1.8620.353 *
oil−−1.570−1.5770.298 ***
USD−−2.419−2.0530.387 *
NegativeADFPPKPSS
gold+−1.109−1.0930.462 ***
oil+−1.086−1.1660.484 ***
USD+−1.738 *−1.841 *0.515
gold−−1.041−0.9810.505 ***
oil−−1.122−1.5510.451 ***
USD−−0.942−0.9350.523 ***
Note: *** and * denote statistical significance at the 1% and 10% significance levels.
Table 7. Unit root tests on residual series: tests for asymmetric cointegration for Bitcoin during the COVID-19 pandemic.
PositiveADFPPKPSS
gold+−0.990−1.2530.291 ***
oil+−1.750−1.7360.195 **
USD+−0.829−0.8460.404 ***
gold−−1.587−1.5100.362 ***
oil−−2.458−1.7540.264 ***
USD−0.047−0.4880.325 ***
NegativeADFPPKPSS
gold+−2.079−2.0390.239 ***
oil+−2.211−2.3110.258 ***
USD+−1.434−1.3890.324 ***
gold−−2.136−2.0350.266 ***
oil−−3.279 *−3.1270.173
USD−−1.043−1.0790.208 ***
Note: ***, **, and * denote statistical significance at the 1%, 5%, and 10% significance levels.
Table 8. Tests for multivariate normality and ARCH in the VAR model.
LevelJarque–BeraMultivariate ARCHVAR Order
gold<0.001<0.0011
oil<0.001<0.0011
USD<0.0010.22611
PositiveJarque–BeraMultivariate ARCHVAR Order
gold+<0.0010.51731
oil+<0.001<0.0011
USD+<0.0010.64321
gold−<0.0010.97571
oil−<0.001<0.0012
USD−<0.0010.016131
NegativeJarque–BeraMultivariate ARCHVAR Order
gold+<0.001<0.0011
oil+<0.001<0.0011
USD+<0.0010.96641
gold−<0.0010.99751
oil−<0.001<0.0012
USD−<0.0010.025651
Table 9. The results of tests for causality using the bootstrap simulations.
Null HypothesisTest ValueBootstrap p Value
gold does not Granger-cause Bitcoin0.8500.378
oil does not Granger-cause Bitcoin4.8840.018
USD does not Granger-cause Bitcoin1.2880.268
gold+ does not cause Bitcoin+0.4100.716
oil+ does not cause Bitcoin+0.0750.850
USD+ does not cause Bitcoin+0.0960.886
gold− does not cause Bitcoin+0.5280.712
oil− does not cause Bitcoin+3.6920.284
USD− does not cause Bitcoin+5.6340.148
gold+ does not cause Bitcoin−0.8390.618
oil+ does not cause Bitcoin−0.0660.900
USD+ does not cause Bitcoin−0.0660.890
gold− does not cause Bitcoin−2.5400.284
oil− does not cause Bitcoin−2.5900.096
USD− does not cause Bitcoin−2.1960.312
Table 10. The results of tests for causality before the COVID-19 pandemic using the bootstrap simulations.
Null HypothesisTest ValueBootstrap p Value
gold does not Granger-cause Bitcoin0.0060.948
oil does not Granger-cause Bitcoin0.0430.86
USD does not Granger-cause Bitcoin0.0810.786
gold+ does not cause Bitcoin+3.8510.24
oil+ does not cause Bitcoin+2.7510.338
USD+ does not cause Bitcoin+2.2640.234
gold− does not cause Bitcoin+5.9660.072
oil− does not cause Bitcoin+1.3420.418
USD− does not cause Bitcoin+4.8900.136
gold+ does not cause Bitcoin−2.0990.49
oil+ does not cause Bitcoin−1.1330.578
USD+ does not cause Bitcoin−0.8030.552
gold− does not cause Bitcoin−1.7170.356
oil− does not cause Bitcoin−2.2880.162
USD− does not cause Bitcoin−2.0750.4
Table 11. The results of tests for causality after the COVID-19 pandemic using the bootstrap simulations.
Null HypothesisTest ValueBootstrap p Value
gold does not Granger-cause Bitcoin0.4900.518
oil does not Granger-cause Bitcoin5.3540.048
USD does not Granger-cause Bitcoin3.2140.146
gold+ does not cause Bitcoin+0.5400.722
oil+ does not cause Bitcoin+0.0090.958
USD+ does not cause Bitcoin+0.0140.958
gold− does not cause Bitcoin+0.6300.656
oil− does not cause Bitcoin+6.3620.014
USD− does not cause Bitcoin+1.7860.334
gold+ does not cause Bitcoin−0.0350.886
oil+ does not cause Bitcoin−0.0030.956
USD+ does not cause Bitcoin−0.1330.896
gold− does not cause Bitcoin−1.7360.27
oil− does not cause Bitcoin−3.0710.056
USD− does not cause Bitcoin−0.1820.83
Disclaimer/Publisher’s Note: The statements, opinions and data contained in all publications are solely those of the individual author(s) and contributor(s) and not of MDPI and/or the editor(s). MDPI and/or the editor(s) disclaim responsibility for any injury to people or property resulting from any ideas, methods, instructions or products referred to in the content.

