Abstract
This paper investigates the drivers of the market’s reaction to share repurchase announcements in the UK and the related abnormality in stock performance. It uniquely captures the impact of globalisation in tandem with a variety of firm-level and macro-level determinants. We undertake multivariate OLS regression to test the determinants of the market’s reaction and find a negative influence when repurchases are tax-friendlier than dividends if there is high debt exposure and economic globalisation is rising, with a positive influence when the company has a history of distributing above average dividends. To quantify the short-term price abnormality, we employ event study analysis, and the findings compute positive (insignificant) stock price abnormality for nonfinancial (financial) firms. For long-term stock price abnormality, we compare against the FTSE 100 by computing annual geometric stock performances. The findings indicate a negative (insignificant) stock price abnormality for nonfinancial (financial) firms. The results can aid corporate management in improving repurchase timing, aid in the decision making of financial practitioners when trading or investing in repurchasing firms, and assist policymakers in mapping more efficient fiscal and cross-market trade frameworks.
JEL Classification:
G32; G34; G35
1. Introduction
In principle, repurchases have multiple benefits over dividend distribution, as they are better communicators of a firm’s prospects (Allen et al. 2000), help in offsetting asymmetric information bias (Lin et al. 2017; Liu et al. 2023) and stock undervaluation (D’Mello and Shroff 2000; Baker et al. 2003) while also remaining free from payout-commitment (Fenn and Liang 2001). The UK is the world’s second-largest share repurchasing country behind the US (Sonika et al. 2014) and the largest in Europe by a decisive margin. For instance, between 1989 and 2005, the UK accounted for nearly 50% of all repurchases witnessed in the EU15 industrialised countries1 (Von Eije and Megginson 2008). This highlights a unique British managerial outlook from a European perspective. Continental European countries follow a debt preferential structure similar to the US, which is repurchase friendly, unlike the UK’s equity preferential structure (Demirguc-Kunt and Levine 1999; Dobrica 2007; Antoniou et al. 2008), which is dividend friendly, yet the repurchase patterns are contrasting. The managerial uniqueness is further evident, as despite the traditional viewpoint of repurchases being dividend substitutes (Jiang et al. 2013), in the UK, repurchases are not seen as dividend replacements, rather the two payouts are complementary (Ferris et al. 2006; Burns et al. 2015).
Also, repurchases are popularising in the UK, as Geiler and Renneboog (2015) found that repurchases grew post-2002, while Renneboog and Trojanowski (2011) found that 4% of firms used them in 1992, and in 2004 this increased to 15%. According to Goldman Sachs (Cornish 2018) even though the level of repurchases dropped after the global crisis (2008–2010), it successfully recovered by 2012 to the pre-2006 figures. Annual peaks were seen in 2006 and 2018 at GBP 33 billion worth of repurchases, and in 2022 this record was topped with the annual value being worth more than GBP 55 billion (Goodacre 2023). Another reason for the rising popularity was the 2004 EU Market Abuse Directive that allowed for storing repurchased shares in the treasury (Andriosopoulos and Lasfer 2015), thus permitting stock option financing. This is a strong repurchase promoter (Griffin and Zhu 2010) but has a downside, as excess outstanding employee stock options can reduce the repurchase announcement-induced stock performance by two-thirds (Jun et al. 2009).
Thus, when looking at the UK from an international perspective, the British managerial attitude is idiosyncratic. They implemented a share repurchasing policy that is more aggressive than Continental European countries, which conflicts with its market structure but makes it the largest repurchasing country for the continent and the second largest globally while simultaneously maintaining the levels of the preferred dividend payout. For instance, in 2023 the value of dividends is expected to be more than GBP 80 billion (Goodacre 2023). Further, from a regulatory viewpoint, the UK follows a strict six-directives framework2, with the only comparable Continental European country’s framework being France’s, while the US mandates one of the weakest frameworks (Dhanani and Roberts 2009), as their regulations are found to be lax (Fried 2014). Only in July 2023 did they tighten their disclosure directives to be more frequent and transparent (SEC 2023).
Perhaps this is the reason why repurchases in the UK are steadily growing without any real resistance; for instance, a mandatory shareholder approval directive is supported by evidence that mandatory shareholder voting curbs mismanagement of funds by CEOs in acquisition decisions (Becht et al. 2016). Thus, a replicable benefit is seen with repurchases. While in the US there are active conversations about their curtailment via regulatory intervention (Palladino and Lazonick 2022) because of reasons such as insider owners misusing information to reap unethical benefits (Palladino 2020; Cziraki et al. 2021). This is also being opposed because of repurchases playing a key role in minimising overinvestment (DeAngelo 2023) and repurchase-related stock price impact being nonmanipulative and transitionary (Bargeron and Farrell 2021; Guest et al. 2023).
In light of the rising popularity of repurchases, which are independent of dividends, we investigated the conditions surrounding open market repurchase announcements in the UK. This included the testing of the factors that drive the market’s reaction to repurchase announcements and quantifying the announcement-triggered market reaction over the short and long run. We define ‘market reaction’ as an abnormal stock performance, which is the difference between the expected stock return and the realised stock return. This discrepancy in stock performance is attributed to the repurchase announcement. Three hypotheses individually test if the market reaction to repurchases is influenced by the UK’s equity market structure (represented by taxation and firm-level leverage), board independence, and economic globalisation. Further testing quantifies the market’s reaction to repurchases in the short-term and long-term periods. The short-term period is defined as—two weeks around announcement day (0), while the long-term period is defined as three years after the announcement.
The uniqueness of our investigation can be sectioned into the macro-level and firm-level. From a macro-level perspective, we are the first to empirically test the influence of economic globalisation on the market’s reaction. This will be an important contribution to the literature because of three important fundamentals. The first is the above discussed rising popularity of repurchases, which is combined with the second important aspect: the UK’s internationalised status. The UK’s stock market integration with global markets, such as the US, Germany, and France, has increased over the past four decades (Berger and Pozzi 2013), with the business activities of British firms being characterised by a considerable degree of internalisation (Oehler et al. 2016; Oehler et al. 2017a). Such an operational pattern has shown to influence stock pricing due to market-driving events, for instance, the 2016 EU referendum (Oehler et al. 2017b). Finally, the third important aspect is the record-level of foreign direct investment (FDI) being seen in recent years (Department for International Trade 2016), with the FDI-to-GDP ratio growing at an average annual rate of 4.75% between 1993 and 2010 (World Bank 2023), and FDI levels impact stock market valuation (Bayraktar 2014). Furthermore, the newly received money inflow can be argued as not being temporary investments, as arbitrageurs are not inclined towards FDI (Baker et al. 2009). In light of this evidence, combined with the fact that signalling stock undervaluation is among the top three reasons why British managers undertake repurchases (Dhanani 2016), the aggregate level of the economy’s globalisation is potentially important in determining the market attitude towards repurchases. A further contribution to the macro-level perspective is the influence of payout-related taxation, which is important, firstly, because of the continual fiscal evolution, which makes repurchases more tax efficient than dividends (see Section 2—Literature Review). Secondly, shareholder-level taxation of payouts, rather than indirectly via companies, (such as withholding) is more efficient (Anagnostopoulos et al. 2022), and the UK is applying this approach.
The firm-level uniqueness of our investigation is to differentiate between nonfinancial and financial firms. This meant calculating the abnormality in stock performances independently for nonfinancial and financial firms. This differentiation was conducted because financial firms adhere to different reporting standards and are extremely important to the UK’s economy; they are the largest taxpayer amongst industries and are highly responsible for the UK’s internationalisation (Cadman 2016; The City UK 2022). We further controlled for them in the testing of the drivers of market reaction, and we also controlled for firms listed on the Alternative Investment Market (AIM).
The results found that the equity market structure influenced the market reaction, as a higher firm-level leverage and a tax regime favouring repurchases over dividends have a negative impact on the market’s response. The level of economic globalisation in the country has a negative influence on the market’s reaction, while board independence does not have any influence on the market reaction. Further, it is also seen that firms with a good dividend distribution history witness a more positive market response; however, a negative influence on the market reaction is observed if firms announce a repurchase following the annual reporting of a net loss. Moreover, in the case of nonfinancial firms, the market shows a consistent positive reaction in the short-term, but in the long-term their reaction is consistently negative. In the case of financial firms, the market reaction is insignificant in the short-term and long-term.
The remainder of this paper is structured as follows: Section 2 provides a literature review, which assesses the extant literary evidence; Section 3 presents the data, and it discusses the tested sample; Section 4 is the research objectives and methodologies, which constructs the objectives for testing and explains the empirical models applied; Section 5 is the results, which produces and analyses the findings; and Section 5 is the conclusion, which summarises the key findings and states their implications for academics, practitioners, and policymakers.
2. Literature Review
Aggregately, the UK is one of the top OECD countries in terms of cash distributed via corporate payouts (Valeeva et al. 2023). The UK’s repurchase announcement-induced stock performance was positive prior to 20003, but post-20004 the magnitude of reaction strengthened to align with the US5. Supporting this is the positive reaction by long-term investors and the negative reaction by margin traders (Liu 2021). It can be seen that repurchases reduce the stock price volatility in developed countries like the in UK (Akturk et al. 2022).
Dhanani (2016)’s survey of British managers found that undertaking repurchases for adjusting the reported EPS is among the top three reasons why they initiate a payout. Thus, the EPS can be adjusted to meet performance targets that would trigger employee performance-related compensation or offset the effect of an earlier issuance of shares to fulfil the covenants of the employee compensation scheme. This is important as earnings management intentions can be detected by tracking repurchase decisions (Chen and Liu 2021), as the payout’s usage for enhancing CEO compensation is reaching peak levels (Shilon 2021). However, there is also evidence that the value creation executives seek via repurchases is not significant (Oded and Michel 2018). Nonetheless, there are other ethical reasons for undertaking repurchases (Hamouda and McMillan 2021), such as dividend substitution and increasing market liquidity (Kulchania and Sonika 2023).
In terms of the determinants of the market’s reaction to repurchases, the impact of stock valuation has shown to differ between being negative (Lee et al. 2010) and insignificant (Padgett and Wang 2007; Crawford and Wang 2012). This remains partially consistent with stock overvaluation, causing managers to withdraw repurchases (Sonika et al. 2014). The influence of leverage on the market reaction conflicts, from being positive (Andriosopoulos and Lasfer 2015) to insignificant (Lee et al. 2010), which is highly inconsistent with the existing literature, citing that leverage has a negative influence on firm-level repurchase decision making (Lee and Suh 2011; Burns et al. 2015; Cesari and Ozkan 2015). The influence of dividend distribution, too, shows inconsistencies, as its impact on the market’s reaction remains insignificant (Lee et al. 2010; Andriosopoulos and Lasfer 2015); however, it has a positive impact on managerial decision making (Burns et al. 2015). Furthermore, the pre-announcement stock performance also shows contradictions, having a negative (Andriosopoulos and Lasfer 2015) to insignificant (Crawford and Wang 2012) influence on the market’s reaction, while it has a negative impact on managerial repurchase decision making (Burns et al. 2015).
From a macro-institutional perspective, the relationship between repurchases and taxation is ridden with contradictory evidence. Andriosopoulos and Lasfer (2015) find that a tax regime that makes repurchases more economical than dividends has a positive influence on the market’s reaction to a repurchase announcement; however, this is inconsistent with Oswald and Young (2008)’s finding that taxation has no bearing on the success of a repurchase. There is also evidence that taxation does not influence the viability of repurchases (Oswald and Young 2004; Geiler and Renneboog 2015). This is surprising since repurchases’ tax efficiency over dividends is seminally a driving force (Barclay and Smith 1988), and the UK’s tax framework is simplistic6 when compared to major economies, while tax reforms in European countries such as Finland have driven repurchase policies (Korkeamaki et al. 2010). However, we argue that the inconsistencies are due to the evolving tax rates (Table 1) and the changes to the tax treatment of institutional investors (Geiler and Renneboog 2015), which skew the tested sample of past studies; these aspects are underpinned by the market’s equity-preferring structure.

Table 1.
Tax rates summary.
The importance of this aspect remains in the conclusion that closely held ownership is a strong managerial tool for monitoring corporate payout-related decision making (Alzahrani and Lasfer 2012), and information sharing amongst them is crucial for avoiding stock price declines (Hong et al. 2017). If the governance mechanisms are weak, managers tend to exploit high-leverage positions (Florackis and Ozkan 2009), as debt financing is popular for payout financing (Frank and Sanati 2021). High debt exposure even positively influenced repurchases during the COVID-19 pandemic (Mazur et al. 2023), perhaps to exploit record low levels of central bank interest rates.
This is relevant as the UK has an equity preferential market structure (Demirguc-Kunt and Levine 1999; Dobrica 2007; Antoniou et al. 2008), which means that their preferred source of financing is equity rather than debt, but this may evolve over time. Andriosopoulos and Lasfer (2015) found that closely held ownership does not influence the market’s repurchase reception, despite being an effective regulator in decision making. From an internal decision-making process, Renneboog and Trojanowski (2011) found different payout preferences for closely held owners, as executive managers preferred dividends to repurchases, while industrialised and commercial blockholders did not prefer undertaking any corporate payouts to avoid precommitment issues. Combining this with the influences discussed with taxation, even in the US where firm ownership is not as fragmented (Sun et al. 2016), the taxation blockholders association influences repurchases (Cesari et al. 2012). Given the fact that British PLCs generally have a more fragmented ownership structure, which gives rise to greater possible contradictions, the level of low repurchase preferences seen with closely held owners, and the market being uninfluenced by ownership circumstances, the efficacy in ownership structure being a determinant of repurchases as a payout-monitoring tool, or otherwise, is questionable and unreliable. In light of this conclusion, we forewent its testing.
3. Sample
We obtained the announcement data via Alacra Inc., a data vendor affiliated with Thomson Reuters. The data are for open market repurchases undertaken during the period 1985–2014, as this method of repurchasing accounts for the majority of repurchases (Rau and Vermaelen 2002; Oswald and Young 2004). The testing only used the initial announcement, as according to Andriosopoulos and Lasfer (2015), they are more informative than the subsequent repurchase transaction announcements. The timeline was trimmed to 1993–2010 according to the application of two data criteria. The first criterion was that the firm must be currently listed as a PLC, as the stock data of non-existent PLCs is inaccessible. The second criterion is that the firm must be listed as a PLC for at least five years pre- and post-announcement (−/+5 years), thus being existent for at least 10 years around the announcement. This constraint was applied because of the methodology’s requirements (see Section 4.2); however, it also receives support from Chen et al. (2013)’s finding that firms that repurchase shares within three years of going public witness abnormally low operating and stock performances. To the best of our knowledge, this paper’s timeframe of investigation (1993–2010) is the lengthiest compared to like-for-like UK studies. The paper that currently holds the lengthiest sample is Lee et al. (2010)’s testing of the period 1990–2005. Thus, our paper’s timeline is a novel aspect, as it also covers the effects of the Great Recession on the market’s overall reception of repurchases. This is important since ‘investor requirement’ is among the top five repurchase motives in Britain (Dhanani 2016), and this is best captured over long time periods.
Thus, the final sample (Table 2) consisted of 67 initial announcements stating that a repurchase would be undertaken, which had a combined nominal value of GBP 140 billion, with each announcement on average representing a repurchase of 11% outstanding market capitalisation. Upon splitting the firms based on their type, nonfinancial (66%) and financial (34%) firms both on average announced a repurchase of 11% outstanding volume. The sample’s average of 11% highlights stability, as this is identical to that seen between 1999 and 2004 (Padgett and Wang 2007) and similar to the 10% seen during 1985–1998 (Rau and Vermaelen 2002) and 1990–2005 (Lee et al. 2010). This recurring attitude of announcements, which is at least two-thirds of the regulatory restricted 15% level, indicates corporate pragmatism, as regulations do not mandate firms to repurchase the entire shareholder-approved value, rather it just caps the repurchase at that level. Thus, the authorisation of a higher value provides implementation flexibilities, such as resource allocation and market timing, which is highly crucial to success even in repurchase-favouring countries like the US (Cesari et al. 2012).
Table 2.
Dataset.
The stock market data were sourced from Datastream and Morningstar, while the data required for constructing firm-level variables were obtained from annual filings, which were sourced from the Companies House. Taxation data were obtained from HMRC, Institute for Fiscal Studies, and generic government archives, and the globalisation data were from the KOF Swiss Economic Institute.
4. Research Objectives and Methodologies
4.1. Drivers of the Market Reaction to Repurchase Announcements
(i) Equity Market Structure: Taxation and Debt Exposure
In line with the literature review, to test this hypothesis we used two control variables: a macro-level and a firm-level representative. We dually embody debt exposure alongside taxation, as a firm-level characteristic will complement the macro-institutional perspective. The reason for this being that we do not agree with Geiler and Renneboog (2015)’s finding that repurchases in the UK are motivated by higher debt exposure, as this contradicts the market’s equity structure and the fundamental tenets of the traditional motive, the capital restructuring hypothesis, which has been consistently visible in the UK (Lee and Suh 2011; Burns et al. 2015; Cesari and Ozkan 2015). The macro-level variable is the tax differential, the dividend tax rate relative to the capital gains tax rate; as explained in Alzahrani and Lasfer (2012)’s paper on 23 OECD countries and in line with this paper, we expect a negative influence. We support this influence’s expectation based on the erstwhile discussions of the UK being a dividend-preferential market. The firm-level variable is the leverage ratio, with the total book value of the debt being relative to the shareholders’ equity, and we expect a negative influence, which is in line with the abovementioned studies providing evidence of a lower leverage promoting repurchases in the UK.
H10.
The equity market structure does not influence the market reception to repurchases.
H11.
The equity market structure influences the market reception to repurchases.
(ii) Board Independence: Managers only call for a repurchase approval vote when they favour the payout, stemming from principal–agent conflicts. Thus, if managers receive support from independent directors their credibility improves, which maximises the probability of receiving shareholder approval. We used board independence (number of independent directors relative to the total board size) to construct a proxy board. A positive influence is expected, as even in the US governance mechanisms, such as board independence, have a positive impact on the market’s reaction to repurchase announcements (Manconi et al. 2019), with similar positive influences seen on the viability of undertaking repurchases (John et al. 2015) and on the post-announcement operating performance (Caton et al. 2016). As an additional supplement, a short summary of the UK’s governance framework is detailed. The framework, the Combined Code, founded in 1992, is based on a ‘comply or explain’ principle. It is a ‘soft’ approach that mandates certain directives, while most are applicable at the firm’s discretion, subject to shareholder satisfaction. Antonymous is the US’ framework, which is ‘legislative led’ and mandates almost all directives (Jackson 2012). Thus, since the post-dot-com bubble, there has been a consensus in favour of the UK’s approach (Walker-Arnott 2010). The European Confederation of Directors Association (ecoDa 2015) explains that the UK’s system is the reference template for the frameworks of many European countries, including Germany’s Kodex and France’s AFEP-MEDEF.
H20.
Board independence does not positively influence the market reception to repurchases.
H21.
Board independence positively influences the market reception to repurchases.
(iii) Economic Globalisation: Lazonick (2016) theorises a positive repurchase–globalisation relationship for the US, but to the best of knowledge no prior paper has empirically investigated the influence of globalisation on the UK’s repurchases. This is despite the United Nations (2016) reporting that globalisation has successfully contributed to the overall growth of developed economies like the UK. Milberg and Winkler (2010)’s survey of US firms found that those with a globalised supply chain were more prone to repurchases, and according to the World Bank (2023), the UK’s manufacturing sector’s contribution to the GDP decreased from 15.50% in 1993 to 9.50% in 2010, while in the same period the country’s trade relative to GDP increased from 50% to 59%, indicating a wave of possibly internationalised supply chains. Combined with the fact that the rising level of year-on-year FDI reaching its peak (Department for International Trade 2016; ONS 2017), the inflow of new funds into the market may impact the general attitude towards repurchases. This assertion is supported by the existing literature. Foreign investment promotes repurchases in countries like Japan by relinquishing surplus cash (Tong and Bremer 2016), and British managers state that distributing excess cash is the leading motive for undertaking repurchases (Dhanani 2016). Also, since Bayraktar (2014) found that FDI growth impacts stock market valuation, this phenomenon may have a tangible impact on repurchases. Thus, we expect globalisation to have a positive influence.
Despite the discussions on the absence of the repurchase–globalisation empirical literature for the UK, we recognise the complexity of economic globalisation and the sensitivity in the proxy selection. Thus, the KOF Swiss Economic Institute’s Index of the UK’s Economic Globalisation was chosen, represented by the variable Globalisation. The index’s computation uses FDI and portfolio investment data, which are normalised with GDP while controlling for hidden import barriers, tariff rates, international trade taxes, and capital controls. We also recognise that the proxy captures the country’s aggregate globalisation level and are not that specific to the equity market, but this is not unintuitive since a similar rationale for using aggregate macro-institutional data is the premise for the discussed repurchase–taxation inquiries for the UK. Studies such those as by Renneboog and Trojanowski (2011), Alzahrani and Lasfer (2012), and Geiler and Renneboog (2015) constructed proxies using government-regulated tax rates.
H30.
Globalisation does not positively influence the market reception to repurchases.
H31.
Globalisation positively influences the market reception to repurchases.
We tested the hypotheses using cross-sectional pooled regression (Equation (1)), as conducted by Andriosopoulos and Lasfer (2015); this approach offsets the impact of time.
where is the 3-day (−1, 0, 1) cumulative abnormal return of the ith firm; (yearly lagged) are the hypotheses’ proxies; is the matrix of the K firm-specific variables (yearly lagged); is the vector of the error terms; and is the alpha. We summarise the control variables’ descriptions and the expected influences in Table 3.
Table 3.
Description of the control variables.
4.2. Market Reaction to Repurchase Announcements
Alongside the reactionary determinants, we quantified the market reaction independently for nonfinancial and financial firms over short-term and long-term periods. The periodic differentiation is important, as the announcement itself does not guarantee instant repurchase transactions, which are usually realised over the regulatory-mandated 18 month period.
4.2.1. Short-Term Market Reaction
Regulations mandate that shareholders must receive a two-week notice to appear for a repurchase vote, and since this notification is publicly disseminated, the stock price may witness pre-emptive fluctuations. Thus, pragmatism indicates that upon approval an announcement will follow the next day, and the investigation corresponds to this intuition. We cover two weeks around the announcement day (0), thus 10 trading days before (−10) and after (10), resulting in a total of 21 trading days. The ‘market reaction’ is represented by the abnormality in the stock price, which is computed using an event studies analysis through the application of CAPM (Sharpe 1964; Lintner 1965)9. The parameter estimation data were collected on a monthly frequency for −/+ 5 years around the announcement, minimising the statistical noise and beta bias. The stock abnormality was thus computed from various perspectives (Equation (2) through (4)):
where is the daily abnormal return for firm i on day t = 21 trading days (−10, −9, −8…8, 9, 10) surrounding the announcement day (0); is the realised stock return; and is the expected stock return.
where RAR is the rolling abnormal return, which is computed using the traditional cumulative frequency approach starting from the sum of the pre-announcement 10th and 9th days’ AR and then adding each consecutive day: (−10, −9), (−10, −8)…(−10, 0, 10). This approach reveals the announcement-induced progressive change in a shareholder’s equity ownership.
where is the cumulative abnormal return for 10 symmetrically constructed event windows around the announcement day (0), stretching from T1 = −10, −9…−1 to T2 = 1, 2…10; (−1, 0, 1), (−2, 0, 2)…(−10, 0, 10). We also computed DCAR, the average daily abnormal return for each CAR event window. Since CARs are symmetrically evolving, DCAR indicates the relative stability in the stock’s abnormality.
4.2.2. Long-Term Market Reaction
A repurchase is presumed to fully or partially complete within the regulatory permitted 18 months, and this may be attributed to either one or multiple transactions. If a transaction occurs on the final possible day, it is plausible that its influence will trickle into the beginning of the 3rd year. Thus, the reaction, represented by the long-term stock price abnormality, will be computed for three years post-announcement using a geometric monthly abnormal returns approach (Equation (5) through (7)).
where are the monthly long-term abnormal return for the 1st, 2nd, and 3rd post-announcement years, respectively, of the ith firm, t is the post-announcement month = 1st, 2nd…36th, is the realised stock return, and is the return on the FTSE 100 index (similar to the short-term analysis approach).
4.3. Robustness Testing
4.3.1. Determinants of Achieving a Stronger Market Reaction
For ensuring the reliability of the hypotheses testing, a two-stage robustness checking was undertaken. The first stage focused on the determinants of achieving a stronger short-term market reaction; thus, an ordered probit regression was undertaken for three periods (Equation (8) through (10)): (i) the pre-announcement period (−10, −1), addressing the pre-emptive market response due to the notice of a shareholder assembly for approval being publicly available; (ii) the announcement period (−1, 0, 1), directly verifying the results yielded from Equation (1); and (iii) the post-announcement period (0, 10), quantifying the realised influence due to the spreading of the repurchase’s news throughout the market.
where the and of the ith firms are the ordinal variables = 1, 2 or 3 if the value of the CAR of their associated event window is in the 1st, 2nd, or 3rd tercile10, respectively; and are the cut-off points (upper most levels) of the 1st and 2nd terciles, respectively; (yearly lagged) are the hypotheses’ proxies; is the matrix of the K firm-specific variables (yearly lagged); and is the vector of the error terms. We summarise the control variables’ description and the expected influences in Table 3.
4.3.2. Leamer’s Global Sensitivity Analysis
The second-stage robustness check is based on Leamer (1985)’s advocacy of the global sensitivity analysis. It argues that continual alteration in the testing environment discerns the initial outcome’s sensitivity which, in turn, reveals the reliability. Thus, Equation (1) is replicated under four conditions: (i) exclusion of each announcement; (ii) exclusion of each year; (iii) separating firms based on their operational sector and financial versus nonfinancial institution; and (iv) sequentially dropping each control variable.
5. Results
5.1. Summary Statistics
The summary statistics of the independent variables used in the multivariate empirical testing are reported in Table 4. The tax differential indicates that in 1993, the dividends were 63% tax-friendlier than the repurchases, which is compliant with the then repurchases’ lower popularity. However, with time this figure narrowed, and from the late-1990s it went in favour of repurchases; by 2008, they were 55% tax-friendlier than dividends. The tax changes in 2010 marginally increased the dividend friendliness, but since then further changes resulted in the current differential being 1.90 (HMRC 2017), thus making repurchases almost twice more tax efficient. The average leverage ratio of 2 was higher than the country’s average of 0.41 (Dobrica 2007), consistent with Geiler and Renneboog (2015)’s finding that high leverage promotes repurchases over dividends. The dissimilarity between nonfinancial firms (1.20) and financial firms (3.75) is attributable to the differences in their intangibility.
Table 4.
Summary statistics of the control variables.
The average Board is was 58%, indicating good governance practices since the general board independence in the UK is 41% (Guest 2008) as opposed to 70% in the US (Boone et al. 2007). Board independence is not a standalone performance enhancer; its combination with factors such as centrality results in lower leverage (Mateus et al. 2015), which is conducive to the UK’s equity structure, and the governance’s flexibilities allow for attaining an optimum mix. Nonfinancial firms are less independent (47%) than financial firms (80%), compliant with European literature (Fernandes et al. 2017). Complementarily, the board independence of financial firms is positively associated with performance during economic crises (Fernandes et al. 2016a) and access to bailouts (Fernandes et al. 2016b); thus, the sample’s financial firms reveal board-level stability in favour of supporting survival during distress. Based on the sample data, Globalisation witnesses witnessed an average annual increase of 0.56%, which is encouraging given the maturity of the highly industrialised economy. The achievement is dominantly attributed to the service sector’s growth; its GDP contribution reached a record 80% in 2016 (Cadman 2016) and trade surplus of over GBP 90 billion in 2020 (The City UK 2022).
Dividend revealed that 52% of the firms had a strong distribution history, with nonfinancial firms (61%) surpassing financial firms (35%). The average M/B Ratio (2.80) was slightly higher than the country’s average (2) for the period 1979–2015 (Keimling 2016). However, financial firms were relatively less overvalued (1.59) than nonfinancial firms (3.41), which is intuitive since the sensitivity of the former attracted surplus attention. As a perfect market condition is improbable (Latif et al. 2011), a certain degree of overvaluation is presumable, and the magnitude seen with the sample is unalarming. The average Stock Performance for nonfinancial firms (0.70%) was positive opposed to that of financial firms (−0.30%). For a broader ascertainment, the figures were deconstructed over 5-year blocks (Table 5), with a subsplitting to highlight the impact of the Great Recession (2008–2009). It is revealed that the performance revolved in a restricted range of −1% to 1%, diminishing the contention of repurchases being used for artificially supporting a falling stock price. Also, the Great Recession did not show any major impact on the performance pattern, highlighting some insulation from the crisis. Net Loss reveals revealed that on average 16% of the firms suffered a loss prior to the announcement, while loss-making financial firms were more likely (30%) to undertake a repurchase than nonfinancial firms (9%).
Table 5.
Long-term stock performance.
The subcategorisation based on the operational sector unveiled strong repurchase-specific idiosyncrasies. A typical financial firm, when compared to a nonfinancial firm, was more leveraged, had greater board independence, witnessed milder overvaluation, bore greater dividend substitution propensities, and its stock realised negative pre-announcement long-term returns and remained unrestrained towards repurchases when financially constrained.
5.2. Drivers of the Market Reaction to Repurchase Announcements
The reaction drivers were tested under different environments (Table 6). Tax Differential has had a negative influence, thus revealing that according to our expectations, the market reaction to repurchase announcements was deterred when the tax framework made repurchases more economical than dividends. This is also consistent with the repurchase–taxation relationship seen in the UK (Alzahrani and Lasfer 2012). It can be attributed to the market using this approach as a signalling tool for ensuring a curb on any intentions of using repurchases as possible dividend replacements, which is supported by the two payouts’ complementary nature (Ferris et al. 2006; Denis and Osobov 2008). Further, Leverage Ratio, too, has a negative influence, which is consistent with our expectations and with the past UK literature stating that repurchases–debt exposure have an inverse relationship (Lee and Suh 2011; Burns et al. 2015; Cesari and Ozkan 2015). This is encouraging, as during instances when the firm is highly leveraged, the market sends a cautionary message to the firm regarding the payout’s implications due to a reduction in the stock volume. In light of Tax Differential and Leverage Ratio both having significant negative influences, we accept the alternative hypothesis H11: the equity market structure influences the market reception to repurchases.
Table 6.
Drivers of the market reaction to repurchase announcements.
The insignificance of Board is inconsistent with our expectations, which indicates that the market does not find the presence of independent directors relevant to repurchases. This can be attributed to the regulatory directive that the firm must gain shareholder approval for a repurchase (Dhanani and Roberts 2009), and the market sees that shareholders agree with the management, thus making independent directors’ influence irrelevant. This is consistent with past UK findings indicating that independent directors often feel that their role is more advisory, as opposed to being monitory (Franks et al. 2001; Ozkan 2007). Given the insignificance of Board, we accept the null hypothesis H20: board independence does not positively influence the market reception to repurchases.
The influence of Globalisation is negative, which is a new contribution to the existing literature. This indicates that the repurchases-globalisation relationship theorised for the US (Lazonick 2016), cannot be empirically restated for the UK. A further addition to knowledge is the concept of the rising inflow of foreign money into British markets causing a negative market perception of repurchases. This can be attributed to the possibility that a greater investment supply causes a surge in stock price, and the market presumes that repurchases are announced to establish the price rise. In light of Globalisation’s negative influence, we accept the null hypothesis H30: globalisation does not positively influence the market reception to repurchases.
It can be seen that Dividend had a positive influence, which is consistent with our expectations and the historical viewpoint that the UK is dividend-preferring (Renneboog and Trojanowski 2011) and repurchases and dividends are complementary (Ferris et al. 2006; Denis and Osobov 2008; Burns et al. 2015). Thus, if firms wish to witness a positive market reaction to repurchases, then they must first undertake substantial dividend distribution. The influence of Net Loss is negative, which is consistent with our expectations and remains aligned with past results. British managers have stated in Dhanani (2016)’s survey that surplus cash distribution is the key reason for undertaking repurchases, and empirical evidence has supported this association (Lee et al. 2010; Lee and Suh 2011; Burns et al. 2015; Cesari and Ozkan 2015).
The influence of M/B Ratio was positive, which remains inconsistent with our expectations, as it indicates that overvalued stocks tend to generate a positive market reaction. This finding contradicts the past literature (Crawford and Wang 2012; Andriosopoulos and Lasfer 2015; Geiler and Renneboog 2015); however, given that the positive influence is restrictive, it is not highly concerning. Similarly, Firm Type, too, contradicts our expectations by having a positive influence, but given the weak influence, there is not enough evidence to state that the market reaction is for financial firms. Finally, the influence of Stock Performance was insignificant, indicating that past long-term stock performance does not affect the market’s attitude. This finding remains inconsistent with our expectations and the past UK literature (Andriosopoulos and Lasfer 2015; Burns et al. 2015).
5.3. Market Reaction to Repurchase Announcements
5.3.1. Short-Term Market Reaction
The repurchase announcement-induced short-term stock abnormality is reported in Table 7. The stock of nonfinancial firms witnessed continuous positive performance, while disconcert towards financial firms is iterated as the market reaction towards them is insignificant. However, from a grass root perspective, the insignificance was briefly ignored and the ARs, which are the computational foundation of the remaining abnormal returns, were compared to the expected return, realised return, and the benchmark FTSE 100’s performance (Figure 1 and Figure 2). Over the tested 21-trading days the expected return of nonfinancial firms (financial firms) remained below (above) the FTSE 100 performance, thus revealing the difference in their systemic risks, which is aligned with their characteristics. Given the insignificance of the financial firms’ results, further analysis will solely focus on the reaction towards nonfinancial firms.
Table 7.
Short-term abnormal stock returns.
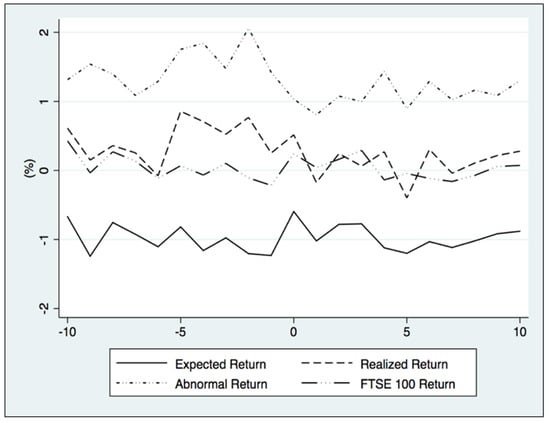
Figure 1.
Comparing ARs—nonfinancial firms.
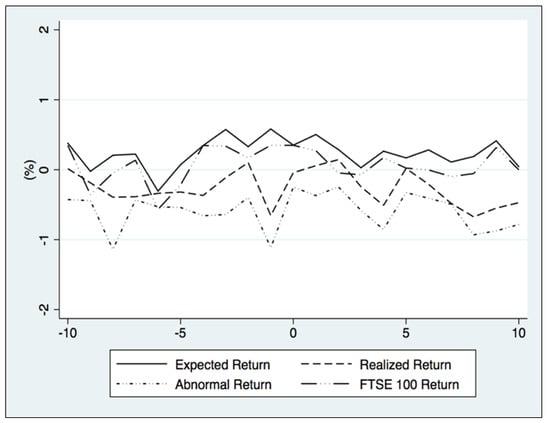
Figure 2.
Comparing ARs—financial firms.
The positive pre-announcement ARs reveal the significant impact caused by the shareholder notification for an authorisation vote, which is compliant with the methodology’s intuition and supports the assertion that for ensuring information efficiency the announcement must follow immediately after gaining shareholder approval. This market efficiency of responding to relevant news is visible with not just corporate events but also political circumstances; the market swiftly responded to the Brexit vote result with instant price corrections observable (Oehler et al. 2017b).
The average pre-announcement AR (1.52%) is greater than the post-announcement average (1.11%), which is explainable by a reactionary saturation due to the pre-emptive response towards the shareholder notification. The Mann–Whitney test (Table 8) concludes that this fall was significant at the 1% level, thus supporting our assertion. The continuous positive RAR further reveals that from the moment the market became aware of a potential repurchase in the imminent term, the value of a shareholder’s equity holding continually snowballed until at least two weeks after the payout’s official announcement was realised.
Table 8.
Mann–Whitney rank-sum test.
The 3-day CAR (3.26%) was higher than the post-2000 literature (Lee et al. 2010; Andriosopoulos and Lasfer 2015) and twice that of the US (Chang et al. 2009). The magnitude, thus, corresponded to the rising repurchase popularity over the past decades and reiterates the market’s efficiency of price adjustment to maintain market capitalisation. The DCAR shows stability across the event windows; thus, the price rise was less likely to be temporary, as seen in the case of Germany (Stehle and Seifert 2003), and was rather absorbed into the intrinsic value. The market’s consistent positive reaction contends whether they have the ability to spot circumstances that require a negative reaction, such as when repurchases were undertaken due to managerial overconfidence in judging the market, which negatively influences the repurchase (Shu et al. 2013). However, using a real market example helps mitigate this contention, e.g., the negative reaction seen in 2014 when WPP PLC announced a repurchase programme (Jones 2014). The market discerned that the repurchase was a pre-emptive tool to artificially inflate the stock value and accounting ratios in the imminent-term, so the immediate-term announcement of the firm missing its revenue target would only eat into the recently yielded false gains. Thus, the market’s robust determination of the overall circumstances surrounding a repurchase is observable in a real-world setting.
5.3.2. Long-Term Market Reaction
The results from the testing of the market’s long-term reaction to repurchase announcements are presented in Table 9, which reveal the annualised performance of a shareholder equity holding relative to the FTSE 100 benchmark. The basic essence of the short-term reaction is replicated with the long-term results, as the market continues to react insignificantly towards financial firms while having a significant response towards nonfinancial firms. However, the directionality is negative, which is coherent with Rees (1996) but not with the positive findings of Oswald and Young (2004) and Crawford and Wang (2012). In the long-term, repurchase transactions are realised and the outstanding stock volume reduces, which increments the firm’s debt exposure; thus, the equity structure’s ethos causes the market to react negatively. This also bridges the disparity with the short-term results; the instant positivity is accredited to efforts of ensuring the theoretically necessary proportionate stock price increase, which ensures a firm’s key financial ratios are maintained and not necessarily because of market liking. Thus, the market’s aggregate individuality is revealed. Since frequent announcements reduce the market’s long-term positive reaction magnitude in the US (Yook 2010), British managers may benefit from similar reactionary saturation, as this will reduce the negative impact of repurchases. Such tact will either mean undertaking frequent repurchases and/or increase its longevity via re-authorisations.
Table 9.
Long-term abnormal stock returns: annualised MLTAR.
5.4. Robustness Testing
5.4.1. Determinants of Stronger Market Reaction
The results of the ordered probit regression are presented in Table 10 and Table 11. The primary intention is the reliability checking of the hypotheses; thus, their proxies will receive the dominant analytical focus. In Table 10, the coefficients are presented, and in Table 11, the marginal effects are presented. Within them there are three panels, A, B and C, which house the results for the pre announcement (−10, −1), actual announcement (−1, 0, 1), and post announcement (0, 10) periods, respectively. The empirical set-up within these panels is identical to that applied to the initial testing of drivers of the market reaction to repurchase announcements (Table 6). The marginal effects of the 1st (3rd) tercile represents the likelihood of the abnormal return being in the lowest (highest) one-third values.
Table 10.
Robustness check: coefficients of the determinants of stronger market reaction.
Table 11.
Robustness check: Marginal effects of the determinants of stronger market reaction.
The influence of Tax Differential remains significantly negative only around the market’s instant reaction, which directly attests to the initial results; however, the influence for the remaining periods is insignificant. Leverage Ratio had an absolute negative influence, remaining consistent with our expectations and the initial results. Thus, the influences remain consistent with the H1 hypothesis’ expectations. Thus, we continue to accept the alternative hypothesis H11: the equity market structure influences the market reception to repurchases. Board had an absolute positive influence, which is misaligned with the initial results but conforms to the H2 hypothesis’ expectations. Thus, indicating the market’s assumed assurance that independent directors effectively monitor the entire repurchase process, from the period when shareholders are called for authorisation until the payout is successfully announced and the news settles into the market. The pattern also infers that independent directors are considered unbiased despite having a closer relationship with the ‘agent’ than the ‘principal’. Considering the results being consistent with our expectations but inconsistent with the initial results, the outcomes of the second stage of robustness checking will be considered for better clarity. Globalisation had an absolute negative influence, adhering to the initial results and the H3 hypothesis’ expectations. Thus, we continue to accept the alternative hypothesis H31: globalisation negatively influences the market’s reception to repurchases.
Regarding the influences of the additional control variables, a strong level of stability is continually realised. The positive influences of Dividend, M/B Ratio, and Firm Type were consistent with the initial results, while a negative influence of Net Loss was realised, which is also consistent with the initial results. A discrepancy was seen with Stock Performance, as a series of positive influences were realised, which is inconsistent with the initial results finding that the factor had an insignificant influence on the market’s reaction. However, this indicates the presence of the momentum effect, as firms with high-performing stocks witnessed a better market reception to repurchase announcements, which is also compatible with the positive influence realised for M/B Ratio.
5.4.2. Leamer’s Global Sensitivity Analysis
A series of looped regressions were undertaken by applying Leamer (1985)’s four criteria on the empirical Model VI in Table 6, which were derived by applying Equation (1). This outputs 95 regressions, which translates to 95 coefficients for each hypothesis’s proxy(s). The summary statistics of these proxies are presented in Table 12. Given the nature of the initial testing, only the proxies of the tested hypotheses are discussed, and not of the additional control variables. The coefficients of Tax Differential and Leverage Ratio are consistently negative, which conforms to the expectations of the H1 hypothesis, the initial results, and the first-stage robustness check. Thus, we continue to accept the alternative hypothesis H11: the equity market structure influences the market reception to repurchases. All coefficients of Board were positive; upon combining this with the expectations of the H2 hypothesis, the initial results, and the first-stage robustness check, an unstable pattern is observed. Thus, we accept the null hypothesis H20: Board independence does not positively influence the market reception to repurchases. However, we leave room for the possibility of a different set of results if board independence is tested via a differing methodological approach. Globalisation had an absolute negative influence, which conforms to the expectations of the H3 hypothesis, the initial results, and the first-stage robustness check. Thus, we accept the alternative hypothesis H31: globalisation negatively influences the market reception to repurchases.
Table 12.
Robustness check: summary statistics of leamer regression coefficients.
6. Conclusions
The paper encompasses various aspects associated with the market’s relationship with a repurchase and concludes an illustrative view of the association. This is ascertained by combining the rising popularity of British repurchases and inconsistencies within the extant literature, which resulted in a set of empirical objectives investigating the factors that determine the market’s reaction towards repurchase announcements and the real reaction itself over the short-term and long-term periods following the announcement. We underpin the dominant level of results with the equity-preferring market structure, as a negative influence is seen when repurchases are tax-friendlier than dividends and if the repurchasing firm is highly leveraged and if these are backed by the positive influence of a good dividend history. This assertion is grounded by the market’s reaction to repurchases of nonfinancial firms. In the short-term, they react positively; however, in the long-term their reaction turns negative. The reaction analyses also reveal that the market pre-emptively responds once the shareholders receive a notice to appear for voting on a repurchase. This novel inquiry reveals the negative influence of economic globalisation and is a notable addition to the existing literature.
Thus, after undertaking a two-stage robustness check, we conclude that the market’s equity structure, the country’s economic globalisation, and the firm’s operational sector significantly shape the market’s reaction to repurchase announcements. This investigation will facilitate academics to use our findings as a foundation and advance them to offset the length limitation by pursuing testing beyond 2014. Corporate managers can employ the findings to better time repurchases. Practitioners can employ the findings to optimise their portfolio positions when the invested/traded firm announces a repurchase, while policymakers can capitalise on the findings specifically related to taxation and globalisation and enhance trade and fiscal mechanisms.
Author Contributions
Conceptualisation, A.S. (Adhiraj Sodhi), C.M. and A.S. (Aleksandar Stojanovic); methodology, A.S. (Adhiraj Sodhi), C.M., I.M. and A.S. (Aleksandar Stojanovic); validation, C.M., I.M. and A.S. (Aleksandar Stojanovic); formal analysis, A.S. (Adhiraj Sodhi), C.M. and I.M.; investigation, A.S. (Adhiraj Sodhi), C.M. and I.M.; data curation, A.S. (Adhiraj Sodhi); writing—original draft and presentation, A.S. (Adhiraj Sodhi); writing—review and editing, I.M. and A.S. (Aleksandar Stojanovic); supervision, C.M. and A.S. (Aleksandar Stojanovic). All authors have read and agreed to the published version of the manuscript.
Funding
The research received no external funding.
Data Availability Statement
Restrictions apply to the availability of these data. Data were purchased from Aalcra Inc., a vendor of Thomson Reuters, with the transaction limiting the use of data by the corresponding author.
Conflicts of Interest
The authors declare no conflict of interest.
Notes
| 1 | These include Austria, Belgium, Denmark, Finland, France, Germany, Greece, Ireland, Italy, Luxembourg, the Netherlands, Portugal, Spain, Sweden, and the UK. |
| 2 | Requiring shareholder approval, a time limit on the payout’s completion, restriction on the repurchase price, cap on the volume of shares, disclosing transactions on the next working day, and restricting insider trading. |
| 3 | The 11-Day CAR (−5, 0, 5) is between 1% and 2% (Rees 1996; Oswald and Young 2004). |
| 4 | The 3-day CAR (−1, 0, 1) is between 2% and 2.50% (Lee et al. 2010; Andriosopoulos and Lasfer 2015). |
| 5 | The 3-day CAR (−1, 0, 1) is between 1.70% and 2.50% (Peyer and Vermaelen 2005; Chang et al. 2009). |
| 6 | The tax codes of the UK (HMRC 2017) and France (Deloitte 2017a) differentiate between repurchases and dividends, but the US and Germany (Deloitte 2017b; IRS 2016) do not. |
| 7 | The rates differ based on the marginal income tax rate. |
| 8 | In 1999, the rate for basic taxpayers remained restricted at 20%, rather than the marginal tax rate. |
| 9 | Benchmark = FTSE 100. The sample is composed of firms listed on any FTSE index, but we still chose this as the benchmark, since it represents 80% of the market (Cattlin 2021). Risk-free rate = 3-month T-Bill. |
| 10 | A tercile divides data into three equal sets, and the 1st (3rd) tercile houses the lowest (highest) one-third of the values. |
| 11 | The total number of firms is 67 (100%) of which 44 (66%) were nonfinancial and 23 (34%) were financial. |
References
- Akturk, Esen, Mehmet Baha Karan, and Burak Pirgaip. 2022. Is the effect of dividend policy on the volatility of stock prices stable? An empirical study on European countries. Spanish Journal of Finance and Accounting 51: 484–504. [Google Scholar]
- Allen, Franklin, Antonio E. Bernardo, and Ivo Welch. 2000. A theory of dividends based on tax clienteles. Journal of Finance 55: 2499–536. [Google Scholar] [CrossRef]
- Alzahrani, Mohammed, and Meziane Lasfer. 2012. Investor protection, taxes and dividends. Journal of Corporate Finance 18: 745–62. [Google Scholar] [CrossRef]
- Anagnostopoulos, Alexis, Orhan Erem Atesagaoglu, and Eva Carceles-Poveda. 2022. Financing corporate tax cuts with shareholder taxes. Quantitative Economics 13: 315–54. [Google Scholar] [CrossRef]
- Andriosopoulos, Dimitris, and Meziane Lasfer. 2015. The market valuation of share repurchases in Europe. Journal of Banking and Finance 55: 327–39. [Google Scholar] [CrossRef]
- Antoniou, Antonios, Yilmaz Guney, and Krishna Paudyal. 2008. The determinants of capital structure: Capital market oriented versus bank oriented institutions. Journal of Financial and Quantitative Analysis 43: 59–92. [Google Scholar] [CrossRef]
- Baker, H. Kent, Gary E. Powell, and E. Theodore Veit. 2003. Why companies use open-market repurchases: A managerial perspective. Quarterly Review of Economics and Finance 43: 483–504. [Google Scholar] [CrossRef]
- Baker, Malcolm, C. Fritz Foley, and Jeffery Wurgler. 2009. Multinationals as arbitrageurs: Stock market valuations on foreign direct investment. Review of Financial Studies 22: 337–69. [Google Scholar] [CrossRef]
- Barclay, Michael, and Clifford Smith. 1988. Corporate payout policy: Cash dividends versus open market repurchases. Journal of Financial Economics 22: 61–82. [Google Scholar] [CrossRef]
- Bargeron, Leonce, and Michael Farrell. 2021. The price effect of stock repurchases: Evidence from dual class firms. Management Science 67: 6568–80. [Google Scholar] [CrossRef]
- Bayraktar, Nihal. 2014. Measuring relative development level of stock markets: Capacity and effort of countries. Borsa Istanbul Review 14: 74–95. [Google Scholar] [CrossRef]
- Becht, Marco, Andrea Polo, and Stefano Rossi. 2016. Does mandatory shareholder voting prevent bad acquisitions? The Review of Financial Studies 29: 3035–67. [Google Scholar] [CrossRef]
- Berger, Tino, and Lorenzo Pozzi. 2013. Measuring time-varying financial market integration: An unobserved components approach. Journal of Banking and Finance 37: 463–473. [Google Scholar] [CrossRef]
- Boone, Audra L., Laura Casares Field, Jonathan M. Karpoff, and Charu G. Raheja. 2007. The determinants of corporate board size and composition: An empirical analysis. Journal of Financial Economics 85: 66–101. [Google Scholar] [CrossRef]
- Burns, Natasha, Brian C. McTier, and Kristina Minnick. 2015. Equity-incentive compensation and payout policy in Europe. Journal of Corporate Finance 30: 85–97. [Google Scholar] [CrossRef]
- Cadman, Emily. 2016. Services Close to 80% UK Economy. Available online: https://www.ft.com/content/2ce78f36-ed2e-11e5-888e-2eadd5fbc4a4 (accessed on 14 September 2023).
- Caton, Gary L., Jeremy Goh, Yen Teik Lee, and Scott C. Linn. 2016. Governance and post-repurchase performance. Journal of Corporate Finance 39: 155–73. [Google Scholar] [CrossRef]
- Cattlin, Rebecca. 2021. FTSE 100 Trading Guide: Constituents, Market Hours and How to Trade. Available online: https://www.forex.com/en/market-analysis/latest-research/ftse-100-trading-guide/ (accessed on 14 September 2023).
- Cesari, Amedeo D., and Neslihan Ozkan. 2015. Executive incentives and payout policy: Empirical evidence from Europe. Journal of Banking and Finance 55: 70–91. [Google Scholar] [CrossRef]
- Cesari, Amedeo D., Susanne Expenlaub, Arif Khurshed, and Michael Simkovic. 2012. The effects of ownership and stock liquidity on the timing of repurchase transactions. Journal of Corporate Finance 18: 1023–50. [Google Scholar] [CrossRef]
- Chang, Shao-Chi, Sheng-Syan Chen, and Li-Yu Chen. 2009. Does prior record matter in the wealth effect of open-market share repurchase announcements? International Review of Economics and Finance 19: 427–35. [Google Scholar] [CrossRef]
- Chen, Ni-Yun, and Chi-Chun Liu. 2021. Share repurchases and market signalling: Evidence from Earnings Management. International Review of Finance 21: 1203–24. [Google Scholar] [CrossRef]
- Chen, Sheng-Syan, Kim Wai Ho, Chia-Wei Huang, and Yanzhi Wang. 2013. Buyback behaviour of initial public offering firms. Journal of Banking and Finance 37: 32–42. [Google Scholar] [CrossRef]
- Cornish, Chloe. 2018. UK Share Buybacks Accelerate as Market Lags Behind. Available online: https://www.ft.com/content/df9bad78-2770-11e8-b27e-cc62a39d57a0 (accessed on 14 September 2023).
- Crawford, Ian, and Zhiqi Wang. 2012. Is the market underreacting or overreacting to open market share repurchases? A UK perspective. Research in International Business and Finance 26: 26–46. [Google Scholar] [CrossRef]
- Cziraki, Peter, Evgeny Lyandres, and Roni Michaely. 2021. What do insiders know? Evidence from insider trading around share repurchases and SEOs. Journal of Corporate Finance 66: 101544. [Google Scholar] [CrossRef]
- D’Mello, Ranjan, and Previn Shroff. 2000. Equity undervaluation and decisions related to repurchase tender offers: An empirical investigation. Journal of Finance 60: 2399–421. [Google Scholar] [CrossRef]
- DeAngelo, Harry. 2023. The attack on share buybacks. European Financial Management 29: 389–98. [Google Scholar] [CrossRef]
- Deloitte. 2017a. Taxation and Investment in France. Available online: https://www2.deloitte.com/content/dam/Deloitte/global/Documents/Tax/dttl-tax-franceguide-2017.pdf (accessed on 14 September 2023).
- Deloitte. 2017b. Taxation and Investment in Germany. Available online: https://www2.deloitte.com/content/dam/Deloitte/global/Documents/Tax/dttl-tax-germanyguide-2017.pdf (accessed on 14 September 2023).
- Demirguc-Kunt, Asli, and Ross Levine. 1999. Bank-Based and Market-Based Financial Systems: Cross Country Comparisons. World Bank Policy Research Papers. Washington, DC: World Bank, pp. 1–72. [Google Scholar] [CrossRef]
- Denis, David J., and Igor Osobov. 2008. Why do firms pay dividends? International evidence on the determinants of dividend policy. Journal of Financial Economics 89: 62–82. [Google Scholar] [CrossRef]
- Department for International Trade. 2016. UK Remains Number One Investment Destination in Europe. Available online: https://www.gov.uk/government/news/uk-remains-number-one-investment-destination-in-europe (accessed on 14 September 2023).
- Dhanani, Alpa. 2016. Corporate share repurchases in the UK: Perceptions and practices of corporate managers and investors. Journal of Applied Accounting Research 17: 331–55. [Google Scholar] [CrossRef]
- Dhanani, Alpa, and Roydon Roberts. 2009. Corporate Share Repurchases: The Perceptions and Practices of UK Financial Managers and Corporate Investors. Edinburgh: The Institute of Chartered Accountants of Scotland, pp. 1–151. [Google Scholar]
- Dobrica, Floarea Iosub. 2007. UK and US multinational corporations capital structure: Different approaches to shareholder value maximization. Analele ŞTiinţIfice Ale Universitatii Alexandru Ioan Cuza Din Iasi 54: 126–32. [Google Scholar]
- ecoDa. 2015. Corporate Governance Compliance and Monitoring Systems across the EU. ecoDa in Brussels Collaboration with MAZARS, pp. 1–56. Available online: https://ecoda.eu/wp-content/uploads/2019/08/31719_EcoDa_CGC_report_v2.pdf (accessed on 14 September 2023).
- Fenn, George W., and Nellie Liang. 2001. Corporate payout policy and managerial stock incentives. Journal of Financial Economics 60: 45–72. [Google Scholar] [CrossRef]
- Fernandes, Catarina, Jorge Farinha, Francisco Vitorino Martins, and Cesario Mateus. 2016a. Supervisory boards, financial crisis and bank performance: Do board characteristics matter? Journal of Banking Regulation 18: 310–37. [Google Scholar] [CrossRef]
- Fernandes, Catarina, Jorge Farinha, Francisco Vitorino Martins, and Cesario Mateus. 2016b. Determinants of European banks’ bailouts following 2007–2008 financial crisis. Journal of International Economic Law 19: 707–42. [Google Scholar] [CrossRef]
- Fernandes, Catarina, Jorge Farinha, Francisco Vitorino Martins, and Cesario Mateus. 2017. Bank governance and performance: A survey of the literature. Journal of Banking Regulation 19: 236–56. [Google Scholar] [CrossRef]
- Ferris, Stephen P., Nilanjan Sen, and Ho Pei Yui. 2006. God save the Queen and her dividends: Corporate payouts in the United Kingdom. Journal of Business 79: 1149–73. [Google Scholar] [CrossRef]
- Florackis, Chris, and Aydin Ozkan. 2009. Managerial incentives and corporate leverage: Evidence from the United Kingdom. Accounting and Finance 49: 531–33. [Google Scholar] [CrossRef]
- Frank, Murray, and Ali Sanati. 2021. Financing corporate growth. The Review of Financial Studies 34: 4926–98. [Google Scholar] [CrossRef]
- Franks, Julian, Colin Mayer, and Luc Renneboog. 2001. Who disciplines management in poorly performing companies? Journal of Financial Intermediation 10: 209–48. [Google Scholar] [CrossRef]
- Fried, Jesse M. 2014. Insider trading via the corporation. University of Pennsylvania Law Review 162: 801–39. [Google Scholar] [CrossRef]
- Geiler, Philipp, and Luc Renneboog. 2015. Taxes, earnings payout and payout channel choice. Journal of International Financial Markets, Institutions and Money 37: 178–203. [Google Scholar] [CrossRef]
- Goodacre, Harry. 2023. The Increasing Popularity of Share Buybacks Outside the US. Available online: https://www.schroders.com/en-gb/uk/intermediary/insights/the-increasing-popularity-of-share-buybacks-outside-the-us/ (accessed on 14 September 2023).
- Griffin, Paul A., and Ning Zhu. 2010. Accounting rules? Stock buybacks and stock options: Additional evidence. Journal of Contemporary Accounting and Economics 6: 1–17. [Google Scholar] [CrossRef]
- Guest, Paul M. 2008. The determinants of board size and composition: Evidence from the UK. Journal of Corporate Finance 14: 51–72. [Google Scholar] [CrossRef]
- Guest, Nicholas, Shriprakash Kothari, and Parth Venkat. 2023. Share repurchases on trial: Large-sample evidence on share price performance, executive compensation, and corporate investment. Financial Management 52: 19–40. [Google Scholar] [CrossRef]
- Hamouda, Foued, and David McMillan. 2021. Identifying economic shocks with stock repurchase programs. Cogent Economics and Finance 9: 1968112. [Google Scholar] [CrossRef]
- HMRC. 2017. Income Rax Rates and Allowances: Current and Past. Available online: https://www.gov.uk/government/publications/rates-and-allowances-income-tax/income-tax-rates-and-allowances-current-and-past (accessed on 14 September 2023).
- Hong, Hyun, Jeong-Bon Kim, and Michael Welker. 2017. Divergence of cash flow and voting rights, opacity, and stock price crash risk: International evidence. Journal of Accounting Research 55: 1167–212. [Google Scholar] [CrossRef]
- IRS. 2016. Individual Income Tax Rates, 2016. Available online: https://www.irs.gov/pub/irs-soi/16intaxrates.pdf (accessed on 14 September 2023).
- Jackson, Gregory. 2012. Understanding corporate governance in the United States. Hans Bockler Stiftung Arbeitspapier 223, 1–90. Available online: https://www.econstor.eu/bitstream/10419/116681/1/hbs_arbp_223.pdf (accessed on 14 September 2023).
- Jiang, Zhan, Kenneth A. Kim, Erik Lie, and Sean Yang. 2013. Share repurchases, catering and dividend substitution. Journal of Corporate Finance 21: 36–50. [Google Scholar] [CrossRef]
- John, Kose, Anzhela Kynazea, and Diana Knyazeva. 2015. Governance and payout precommitment. Journal of Corporate Finance 33: 101–17. [Google Scholar] [CrossRef]
- Jones, Ceri. 2014. WPP to Crank Up Buyback Programme Despite Disappointing Results. Available online: http://www.iii.co.uk/articles/150161/wpp-crank-buyback-programme-despite-disappointing-results (accessed on 14 September 2023).
- Jun, Sang-Gyung, Mookwon Jung, and Ralph A. Walkling. 2009. Share repurchases, executive options and wealth changes to stockholders and bondholders. Journal of Corporate Finance 15: 212–29. [Google Scholar] [CrossRef]
- Keimling, Norbert. 2016. An improvement towards traditional value indicators? In Predicting Stock Market Returns Using the Shiller Cape. January edition. London: Star Capital Research, pp. 1–32. [Google Scholar]
- Korkeamaki, Timo, Eva Lilijeblom, and Daniel Pasternack. 2010. Tax reform and payout policy: Do shareholder clienteles or payout policy adjust? Journal of Corporate Finance 16: 572–87. [Google Scholar] [CrossRef]
- Kulchania, Manoj, and Rohit Sonika. 2023. Flexibility in share repurchases: Evidence from UK. European Financial Management 29: 196–246. [Google Scholar] [CrossRef]
- Latif, Madiha, Shanza Arshad, Mariam Fatima, and Samia Farooq. 2011. Market efficiency, market anomalies, causes, evidences and some behavioural aspect of market anomalies. Research Journal of Finance and Accounting 2: 1–14. [Google Scholar]
- Lazonick, William. 2016. How Stock Buybacks Make Americans Vulnerable to Globalization; Mega-Regionalism-New Challenges for Trade and Innovation. Available online: https://papers.ssrn.com/sol3/papers.cfm?abstract_id=2745387 (accessed on 14 September 2023).
- Leamer, Edward E. 1985. Sensitivity analyses would help. American Economic Review 75: 308–13. [Google Scholar]
- Lee, Bong Soo, and Jungwon Suh. 2011. Cash holdings and share repurchases: International evidence. Journal of Corporate Finance 17: 1306–29. [Google Scholar] [CrossRef]
- Lee, Chun I., Demissew Diro Ejara, and Kimberly C. Gleason. 2010. An empirical analysis of European stock repurchases. Journal of Multinational Financial Management 20: 114–25. [Google Scholar] [CrossRef]
- Lin, Tsui-Jung, Yi-Pei Chen, and Han-Fang Tsai. 2017. The relationship among information asymmetry, dividend policy and ownership structure. Finance Research Letters 20: 1–12. [Google Scholar] [CrossRef]
- Lintner, John. 1965. The valuation of risk assets and the selection of risk investments in stock portfolios and capital budgets. Review of Economics and Statistics 47: 13–37. [Google Scholar] [CrossRef]
- Liu, Ying-Sing. 2021. Investor sentiment, trading activity and effect of the open-market share repurchase based on firm characteristics. Spanish Journal of Finance and Accounting 50: 39–64. [Google Scholar] [CrossRef]
- Liu, Huan, Nan Sun, Yongwei Ye, Yunqing Tao, and Yiwei Kan. 2023. The impact of corporate public market share repurchases on capital market information efficiency. Emerging Markets Finance and Trade 59: 3220–40. [Google Scholar] [CrossRef]
- Manconi, Alberto, Urs Peyer, and Theo Vermaelen. 2019. Are buybacks good for long-term shareholder value? Evidence from buybacks around the world. Journal of Financial and Quantitative Analysis 54: 1899–935. [Google Scholar] [CrossRef]
- Mateus, Cesario, Irina B. Mateus, and Thomas Hall. 2015. Are listed firms better governed: Empirical evidence on board structure and financial performance. Corporate Ownership and Control 13: 736–54. [Google Scholar] [CrossRef]
- Mazur, Mieszko, Man Dang, and Thi Thuy Anh Vo. 2023. Dividends and share repurchases during the COVID-19 economic crisis. The Journal of Financial Research 46: 291–314. [Google Scholar] [CrossRef]
- Milberg, William, and Deborah Winkler. 2010. Financialization and the dynamics of offshoring in the USA. Cambridge Journal of Economics 34: 275–93. [Google Scholar] [CrossRef]
- Oded, Jacob, and Allen Michel. 2018. Stock repurchases and EPS enhancement fallacy. Financial Analysts Journal 64: 62–75. [Google Scholar] [CrossRef]
- Oehler, Andreas, Stephan Wendt, and Matthias Horn. 2016. Internationalisation of blue-chip versus mid-cap stock indices: An empirical analysis for France, Germany and the UK. Atlantic Economic Journal 44: 501–18. [Google Scholar] [CrossRef]
- Oehler, Andreas, Stephan Wendt, and Matthias Horn. 2017a. Are investors really home-biased when investing at home? Research in International Business and Finance 40: 52–60. [Google Scholar] [CrossRef]
- Oehler, Andreas, Stephan Wendt, and Matthias Horn. 2017b. Brexit: Short-term price effects and the impact of firm-level internationalisation. Finance Research Letters 22: 175–81. [Google Scholar] [CrossRef]
- ONS. 2017. Ownership of UK Quoted Shares: 2016. Statistical Bulletin. Wales: Office for National Statistics, pp. 1–36. [Google Scholar]
- Oswald, Dennis, and Steven Young. 2004. What role taxes and regulation? A second look at open market share buyback activity in the UK. Journal of Business, Finance and Accounting 31: 257–92. [Google Scholar]
- Oswald, Dennis, and Steven Young. 2008. Share reacquisitions, surplus cash, and agency problems. Journal of Banking and Finance 32: 795–806. [Google Scholar]
- Ozkan, Neslihan. 2007. Do corporate governance mechanisms influence CEO compensation? An empirical investigation of UK Companies. Journal of Multinational Financial Management 17: 349–64. [Google Scholar] [CrossRef]
- Padgett, Carol, and Zhiqi Wang. 2007. Short-Term Returns of UK Share Buyback Activity. ICMA Centre. Available online: https://core.ac.uk/download/pdf/6565339.pdf (accessed on 14 September 2023).
- Palladino, Lenore. 2020. Do corporate insiders use stock buybacks for personal gains? International Review of Applied Economics 34: 152–74. [Google Scholar] [CrossRef]
- Palladino, Lenore, and William Lazonick. 2022. Regulating stock buybacks: The $6.30 trillion question. International Review of Applied Economics. in press. [Google Scholar] [CrossRef]
- Peyer, Urs C., and Theo Vermaelen. 2005. The many facets of privately negotiated stock repurchases. Journal of Financial Economics 75: 361–95. [Google Scholar] [CrossRef]
- Rau, P. Raghavendra, and Theo Vermaelen. 2002. Regulation, taxes and share repurchases in the United Kingdom. Journal of Business 75: 245–82. [Google Scholar] [CrossRef]
- Rees, William. 1996. The impact of open market equity repurchases on UK equity prices. European Journal of Finance 2: 353–70. [Google Scholar] [CrossRef]
- Renneboog, Luc, and Grzegorz Trojanowski. 2011. Patterns in payout policy and payout channel choice. Journal of Banking and Finance 35: 1477–90. [Google Scholar] [CrossRef]
- SEC. 2023. Share Repurchase Disclosure Modernization. Available online: https://www.sec.gov/corpfin/secg-share-repurchase-disclosure-modernization (accessed on 14 September 2023).
- Sharpe, William F. 1964. Capital asset Prices: A theory of market equilibrium under conditions of risk. Journal of Finance 19: 425–42. [Google Scholar]
- Shilon, Nitzan. 2021. Stock buyback ability to enhance CEO compensation: Theory, evidence, and policy implications. Lewis & Clark Law Review 25: 303–59. [Google Scholar]
- Shu, Pei-Gi, Yin-Hua Yeh, Tsui-Lin Chiang, and Jui-Yi Hung. 2013. Managerial overconfidence and share repurchases. International Review of Finance 13: 39–65. [Google Scholar] [CrossRef]
- Sonika, Rohit, Nicholas F. Carline, and Mark B. Shackleton. 2014. The option and decision to repurchase stock. Financial Management 43: 833–55. [Google Scholar] [CrossRef]
- Stehle, Richard, and Udo Seifert. 2003. Stock Performance Around Share Repurchase Announcements in Germany. Humboldt University of Berlin. Available online: https://www.econstor.eu/bitstream/10419/22262/1/dpsfb200348.pdf (accessed on 14 September 2023).
- Sun, Ji, Li Ding, Jie Michael Guo, and Yichen Li. 2016. Ownership, capital structure and financing decisions: Evidence from the UK. British Accounting Review 48: 448–63. [Google Scholar] [CrossRef]
- The City UK. 2022. Key Facts About UK-Based Financial and Related Professional Services. Available online: https://www.thecityuk.com/media/ubgldxnm/key-facts-about-uk-based-financial-and-related-professional-services-2022.pdf (accessed on 14 September 2023).
- Tong, Jiao, and Marc Bremer. 2016. Stock repurchases in Japan: A solution to excessive corporate saving? Journal of Japanese and International Economies 41: 41–56. [Google Scholar] [CrossRef]
- United Nations. 2016. Development and Globalisation: Facts and Figures. United Nations UNCTAD. Available online: https://unctad.org/publication/development-and-globalization-facts-and-figures-2016 (accessed on 14 September 2023).
- Valeeva, Diliara, Tobias Klinge, and Manuel Aalbers. 2023. Shareholder payouts across time and space: An internationally comparative and cross-sectional analysis of corporate financialisaton. New Political Economy 28: 173–89. [Google Scholar] [CrossRef]
- Von Eije, Henk, and William L. Megginson. 2008. Dividends and share repurchases in the European Union. Journal of Financial Economics 89: 347–74. [Google Scholar] [CrossRef]
- Walker-Arnott, Edward. 2010. Company law, corporate governance and the banking crisis. International Corporate Rescue 7: 12–14. [Google Scholar]
- World Bank. 2023. United Kingdom. Available online: https://data.worldbank.org/country/united-kingdom (accessed on 13 September 2023).
- Yook, Ken C. 2010. Long run stock-performance following stock repurchases. Quarterly Review of Economics and Finance 50: 323–31. [Google Scholar] [CrossRef]
Disclaimer/Publisher’s Note: The statements, opinions and data contained in all publications are solely those of the individual author(s) and contributor(s) and not of MDPI and/or the editor(s). MDPI and/or the editor(s) disclaim responsibility for any injury to people or property resulting from any ideas, methods, instructions or products referred to in the content. |
© 2023 by the authors. Licensee MDPI, Basel, Switzerland. This article is an open access article distributed under the terms and conditions of the Creative Commons Attribution (CC BY) license (https://creativecommons.org/licenses/by/4.0/).