Abstract
We examine the complex relationship between taxes and local economies at the county level. Specifically, we explore the impacts of different types of state-level taxes, including income and payroll taxes, property and other taxes, as well as sales tax, on key economic performance indicators. Our study aims to comprehensively analyze how state-level taxation influences entrepreneurship, innovation, labor markets, and overall economic growth in local communities. The findings consistently demonstrate that taxes harm local economies, although the magnitude of the impact varies depending on the specific type of tax. Notably, a 10 percent increase in income and payroll taxes leads to a 3 percent drop in the nonfarm proprietors employment rate, 0.3 fewer patents per 1000 people, and a USD 3000 decrease in GDP per capita. A similar tax hike in sales taxes results in a 4.5 percent decline in the nonfarm employment rate and a 0.2 patent reduction per 1000 people. Property and other taxes also harm the economy: a 10 percent increase is linked to a 5.3 percent fall in the nonfarm proprietors employment rate, a 7.5 percent rise in local unemployment, and a USD 55,000 drop in regional GDP per capita.
JEL:
H20; H71; O31; R32; R51
1. Introduction
The topic of taxes has been intensely debated by policymakers and academics alike. While taxes serve as a crucial tool for governments to generate revenue, fund public services, and advance socioeconomic objectives, they can also challenge the prosperity of a region. The effects of taxes on economies are multifaceted, with far-reaching implications for individuals, businesses, and overall economic growth. Understanding the intricate relationship between taxation and these key stakeholders is essential, as it sheds light on the complex dynamics that influence economic outcomes.
In this paper, we focus on the multifaceted impacts of various state-level taxes on key indicators of local economies at the county level. Specifically, our analysis delves into the effects of distinct tax types, including income and payroll taxes, property and other taxes, as well as sales tax. We analyze how these taxes affect county-level entrepreneurship, innovation, labor markets, and overall economic growth. By examining these dimensions, we aim to provide a comprehensive understanding of the relationships between state-level taxation and local economic dynamics.
We consistently find that taxes have a negative impact on local economies, although the extent of these impacts varies depending on the type of tax involved. For instance, when income and payroll taxes are increased by 10 percent, we observe declines of 3 percent in the nonfarm proprietors employment rate (nonfarm proprietors employment as a percentage of the population), 0.3 patents per 1000 people, and USD 3000 in GDP per capita. Similarly, a 10 percent increase in sales taxes results in a reduction of approximately 4.5 percent in the nonfarm proprietors employment rate and 0.2 patents per 1000 people. Property and other taxes also have significant negative effects on entrepreneurship, the labor market, and economic growth. A 10 percent increase in these taxes is associated with a significant decline of approximately 5.3 percent in the nonfarm proprietors employment rate. Moreover, when property taxes specifically experience a 10 percent increase, this results in a substantial rise of about 7.5 percent in the local unemployment rate and a decrease of USD 55,000 in regional GDP per capita.
Our findings are robust to several sensitivity analyses. First, to lessen concerns of endogeneity and obtain more accurate estimates of the effects of taxes, we employ various econometric models, ensuring the robustness of our analysis. Second, to address the heterogeneous effects of taxes across different regions, we reanalyze the data based on Metropolitan Statistical Area (MSA) status, dividing observations into MSA/urban and non-MSA/rural counties. The findings consistently demonstrate that taxes harm local economies in both urban and rural areas. Last, although we exclude the top marginal tax rates on top earners from the baseline analysis, we show that our results are robust when considering this tax.
Our paper is related to several strands of literature. First, our paper joins the studies that analyze the impact of taxes on employment. Moretti and Wilson (2017) examine the impact of state taxes on the migration patterns of highly skilled professionals, specifically star scientists. They find that higher state taxes lead to a decrease in the number of star scientists moving to a particular state. Agrawal and Foremny (2019) investigate how changes in the top tax rates affect the migration choices of high-income individuals in Spain. Their research reveals that higher tax rates are associated with an increased probability that wealthy individuals leave a given region. However, the additional tax revenue generated from the higher rates outweighs the revenue lost by the net outflow of individuals. Kleven et al. (2020) review recent studies and conclude that certain groups, such as high-income individuals and professionals with transferable skills, are more likely to be influenced by taxes when deciding where to live. The authors caution, however, that mobility elasticities vary depending on factors such as the specific population under analysis, the size of the tax jurisdiction, the level of tax policy coordination, and other nontax policies (Kleven et al. 2020).
Furthermore, our paper is connected to the literature on the determinants of innovation, which include taxes. Mukherjee et al. (2017) examine whether higher corporate taxes discourage firms from engaging in innovative activities. The findings of the study suggest that higher corporate taxes do indeed hinder innovation. The researchers observe that firms facing higher tax burdens tend to invest less in research and development, reducing innovation. Additionally, they find that firms in industries with higher tax sensitivity exhibit a stronger negative association between corporate taxes and innovation. Akcigit et al. (2022) investigate the impact of corporate and personal taxes on innovation in the United States throughout the twentieth century. The researchers compiled a comprehensive dataset of inventors who had obtained patents since 1920, and gathered historical information on state-level corporate tax rates and tax bases, which they connected to existing data on personal income taxes and other economic indicators. The authors show that higher taxes, at both the corporate and personal levels, have negative consequences for innovation, primarily impacting its quantity and location, though not the average quality of innovation.
Our paper is related to previous works that study the impacts of taxes on overall economies. Romer and Romer (2010) use a narrative approach to study the effects of taxation on U.S. output. They reveal that tax increases have a substantial contractionary impact; a 1 percent increase in tax leads to a reduction of about 2–3 percent of real GDP. Jones (2022) explores the implications of top-income taxation in the context of economic growth fueled by new ideas and the resulting high incomes from successful innovation. The author theorizes that when top-income taxation inhibits the generation of new ideas that drive overall economic output, it has a broader impact on incomes, affecting not only top earners but also everyone else in the economy.
Finally, this study is broadly related to the literature examining the determinants of regional economic development. Some of those determinants include minimum wages (Card and Krueger 2000; Dube 2019; Hean and Deng 2023), entrepreneurship (Audretsch 2002; Caliendo et al. 2014; Carree and Thurik 2008; Fritsch 2008; Hean and Chairassamee 2023; Koster et al. 2012; Valliere and Peterson 2009), innovation (Hean 2022; Helmers and Rogers 2010; Romer 1990), and trade (Chairassamee and Hean 2023; Feenstra and Hanson 1999).
2. Data
Our data are at the county level and cover all 50 U.S. states from 2005 to 2015, resulting in a comprehensive and well-balanced panel dataset that includes all the relevant economic variables. We obtained the nonfarm employment rate and GDP per capita data from the Bureau of Economic Analysis (BEA), while the unemployment rate data are sourced from the Bureau of Labor Statistics (BLS). Additionally, the United States Patent and Trademark Office (USPTO) provided information on patents granted.
We obtain the tax variables from the state-level dataset constructed by Stansel et al. (2021). Specifically, our key tax variables include:
- Income and payroll tax revenue as a percentage of personal income. This tax revenue includes all personal and corporate income taxes, as well as the payroll taxes used to fund social insurance schemes.
- Property and other taxes as a percentage of personal income. These taxes include all forms of taxation other than income, payroll, and sales tax, but exclude tax revenue from natural resources.
- Sales tax as a percentage of personal income. Sales tax revenue includes all sales and gross receipt taxes, including excise taxes.
Stansel et al. (2021) also provide information on the top marginal income tax rates. However, given the comprehensive analysis conducted in previous studies, such as Agrawal and Foremny (2019), Akcigit et al. (2022), and Moretti and Wilson (2017), which utilize more detailed data to examine the impacts of top marginal income and corporate taxes, we decided not to include this tax variable in our study. Nevertheless, to ensure the robustness of our findings, we perform a sensitivity analysis where we incorporate the top marginal income tax rate in our regression models. Our results remain unaffected by the inclusion of this variable.
In our analysis, we incorporate Stansel et al.’s (2021) state-level labor market regulation index and state-level government spending index as covariates. The labor market regulation index encompasses factors including the minimum wage, government employment as a proportion of total state employment, and union density. Additionally, the government spending index comprises general government expenditure, transfers and subsidies, and insurance and retirement payments. To ease the interpretation, we transform Stansel et al.’s (2021) indices using the following equation:
Here, and are the original and new/transformed indices, respectively. The lower score on these transformed indices signifies reduced labor regulations or decreased government spending. While Stansel et al.’s indices range from 0 to 10, we adjust the scale to make our indices range from 0 to 1. Specifically, our indices are an inverse of their indices, offering a different perspective on the same underlying data.
Figure 1 shows that there are a few substantial year-to-year changes in state-level taxes throughout the period of this study. Table 1 presents summary statistics for the key variables. On average, nonfarm proprietors employment accounts for around 11 percent of the population. The regional patent intensity varies significantly, ranging from zero to nearly 8, indicating a substantial dispersion of patenting activities across different areas.
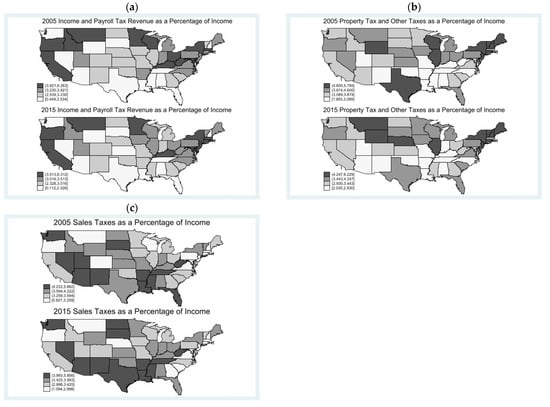
Figure 1.
Evolution of taxes from 2005 to 2015. (a) Income and payroll taxes; (b) property and other taxes; (c) sales tax. Note: Tax data are sourced from Stansel et al. (2021).

Table 1.
Descriptive statistics.
On average, the regional unemployment rate is approximately 7 percent, while the county-level GDP per capita is USD 40,500. On average, state-level income and payroll tax revenues account for approximately 3 percent of the total personal income. The average revenues from property and other taxes, as well as sales tax, are slightly higher than those from income and payroll taxes.
3. Methodology
To study the effects of state-level taxes on regional economies, we estimate the following regression specification:
where is nonfarm proprietors employment as a percentage of the population (the nonfarm proprietors employment rate), the number of patents granted per 1000 people (patent intensity), the unemployment rate, or the GDP per capita of county in state s and year . We utilize these economic indicators to comprehensively assess various aspects of economic dynamics. Nonfarm proprietors employment serves as a metric for gauging entrepreneurial activity, effectively capturing the significant contributions made to the economy by self-employed individuals and small business owners (see Goetz and Rupasingha (2009) and Stephens et al. (2013)). In evaluating innovation within a region, patent data assume a crucial role by reflecting the presence of novel ideas, technological advancements, and the overall inventive spirit that permeates the area (see Agrawal et al. (2014); Hean et al. (forthcoming); Hean and Partridge (2022); Kogan et al. (2017)). Furthermore, we employ the unemployment rate as a measure to gauge the health of labor markets. Finally, to evaluate overall economic growth, we rely on the GDP as a comprehensive measure that encompasses the total value of goods and services produced within the region.
is a set of government taxations varying at state level , including income tax, payroll tax, property and other taxes, and sales tax. These taxes are expressed as percentages of personal income. is a set of control variables at the state level, including labor market regulation and government spending indices. are state fixed effects to capture socioeconomic conditions at the state level.
It is worth mentioning that our dependent variables are measured at the county level, while our independent variables are measured at the state level. Consequently, our state-level tax variables could be plausibly exogenous to any omitted variables at the county level. To mitigate potential endogeneity concerns, we implement two strategies. First, we incorporate a one-period lag for our independent variables, which addresses endogeneity and allows sufficient time for taxes to have an impact. Second, in addition to estimating regression (2) using state fixed effects, we also estimate specification (2) using county fixed effects. The outcomes of these estimations are comparable, thus providing reassurance.
4. Empirical Results
Table 2 presents the estimates of regression specification (2). Columns (1), (3), (5), and (7) display the estimations with state fixed effects, while the remaining columns depict the results using county fixed effects. Notably, the comparable results obtained from state and county fixed effects indicate the robustness of our estimates. Additionally, the results show a negative relationship between taxes and economic indicators, although the magnitude of the impact varies across different types of taxes.
Table 2.
Baseline regression results.
According to the estimated results in Table 2, a 10 percent increase in income and payroll taxes reduce the nonfarm proprietors employment rate by approximately 3 percent. Additionally, property and other taxes negatively impact entrepreneurial activities: a 10 percent increase in these taxes is associated with a decline of about 5.3 percent in the nonfarm proprietors employment rate. Similarly, an increase of 10 percent in sales tax leads to a decrease of 4.5 percent in employment among nonfarm proprietors. These results indicate that these taxes pose a significant burden for workers and entrepreneurs. Consequently, such tax burdens act as discouraging factors for entrepreneurs and firms considering locating in areas with higher tax rates, impacting economic growth and development (Goetz and Rupasingha 2009).
Furthermore, these taxes negatively impact innovation, as measured by patents per 1000 people, or patent intensity. Notably, income and payroll taxes negatively affect innovation, with a 10 percent increase in these taxes resulting in a decrease in patent intensity by 0.3 patents per 1000 people. Similarly, a 10 percent increase in sales tax is associated with a reduction of approximately 0.2 patents per 1000 people. On the other hand, the impact of property and other taxes on innovation does not show statistically significant results. These findings are in line with previous studies, such as Akcigit et al. (2022) and Moretti and Wilson (2017), which also highlight the harmful effects of taxes on high-skilled workers and inventors. Taken together with the aforementioned detrimental effects, we find strong evidence that tax increases can hinder innovation.
Finally, we find that these taxes have adverse effects on local labor markets and overall economic growth. Specifically, a 10 percent increase in income and payroll taxes significantly impacts the GDP per capita, resulting in a decline of approximately 3 percent. Additionally, when property taxes increase by 10 percent, the local unemployment rate rises by about 7.5 percent and the regional GDP per capita decreases by about USD 55,000. These findings align with the work of Romer and Romer (2010), who showed that a 1 percent increase in tax revenues in the United States corresponded to a 2–3 percent decrease in the real GDP.
5. Sensitivity Analysis
One concern arising from our base results is the possibility that the effects of taxes across different regions will be heterogeneous. To tackle this concern, we reanalyze our data considering Metropolitan Statistical Area (MSA) status. We employ the MSA definitions provided by the Bureau of Labor Statistics (2022) report to subdivide our observations into MSA/urban and non-MSA/rural counties. By doing so, we aim to examine the impact of taxes on local economies in both urban and rural areas separately. The outcomes presented in Table 3 consistently demonstrate that these taxes negatively affect local economies across urban and rural regions.
Table 3.
Estimated results by MSA status.
Another issue to address is that we utilize a one-period lag of independent variables in regression specification (2) to mitigate endogeneity concerns and capture the impacts of taxes. However, relying solely on a one-period lag may not be adequate for achieving these objectives. To alleviate this concern, we conduct a sensitivity analysis by incorporating a lag of two or three periods for the independent variables. This approach allows us to examine whether longer lags yield similar findings. The results are shown in Table 4, and they closely align with the base results, reinforcing the notion that these taxes exert significant adverse effects on regional economies.
Table 4.
Estimated results using different lags for the explanatory variables.
In our baseline analysis, we exclude an analysis of the effects of the top marginal tax rates on top earners in our study, given the extensive research conducted in previous studies that examine this aspect using detailed data. However, to ensure the robustness of our findings, we conduct a sensitivity analysis by incorporating the top marginal tax rates provided by Stansel et al. (2021) into our base regression. The results of this analysis, presented in Appendix A Table A1, reaffirm the strength and validity of our findings.
Finally, Table A2 in Appendix A presents the estimates derived from utilizing quantile regression to estimate the effects of taxation. These findings are consistent with our baseline results.
6. Conclusions
Taxation, a hot-button issue for policymakers and scholars, provides a crucial revenue source for governments and a means to fund public services and social-economic endeavors. Yet, at the same time, it poses significant challenges to regional prosperity. Its effects on economies are manifold and wide-ranging, impacting individuals, businesses, and overall economic growth in complex ways. The intricate interplay between taxation and these key stakeholders is vital to understand, as it illuminates the complexities that shape economic results.
We focus on the wide-ranging repercussions of varied state-level taxes for critical county-level economic indicators. Our analysis delves into the impacts of different tax categories, including income and payroll taxes, property and other taxes, and sales tax. We examine how these taxes influence county-level entrepreneurship, innovation, labor markets, and economic growth. We aim to offer a well-rounded understanding of how state-level taxation shapes local economic landscapes.
Our research consistently shows that taxes exert a negative influence on local economies, although the intensity of these impacts diverges based on the type of tax in question. For example, a 10 percent uptick in income and payroll taxes results in a 3 percent dip in the nonfarm proprietors employment rate, a decline of 0.3 patents per 1000 people in patent intensity, and a decline of USD 3000 in the GDP per capita. Similarly, a 10 percent augmentation in sales taxes leads to a 4.5 percent decrease in the nonfarm proprietors employment rate and a decrease of 0.2 patents per 1000 people. Property and other taxes also significantly undermine entrepreneurship, labor market dynamics, and economic growth. A 10 percent escalation in these taxes correlates with a significant 5.3 percent downturn in the nonfarm proprietors employment rate. Furthermore, a 10 percent increase in these taxes spurs about a 7.5 percent spike in the local unemployment rate and a USD 55,000 reduction in the regional GDP per capita.
We ensure the reliability of our findings through several sensitivity analyses. First, to mitigate endogeneity concerns and achieve more accurate estimations of tax impacts, we employ a variety of econometric models to bolster the robustness of our analysis. Second, to account for the diverse tax impacts across regions, we revisit the data based on Metropolitan Statistical Area (MSA) status, categorizing observations into MSA/urban and non-MSA/rural counties. The results consistently underline that taxes have detrimental effects on local economies, whether urban or rural. Finally, we demonstrate that our conclusions hold firm when factoring in the tax rates for top marginal income.
These findings are of significant importance to policymakers, as different types of taxation have disproportionate adverse economic outcomes. Tax policy should take into account how different types of taxation affect an economy, in order to reduce negative impacts. Several possible policies could alleviate the negative impacts of taxation on local economies. These include implementing tax hikes gradually to ease their immediate impact, introducing tax incentives for startups and innovators to mitigate the dampening effect on entrepreneurship and innovation, critically reassessing different types of taxes that could have significant negative effects on communities, adopting region-specific tax policies to account for diverse impacts on different economies, and following an inclusive engagement process involving stakeholders such as businesses, entrepreneurs, scholars, and local communities when contemplating tax policy changes. These recommendations aim to strike a balance between necessary revenue collection and the fostering of economic prosperity.
Author Contributions
Conceptualization: N.C., O.H. and P.J.; methodology: N.C., O.H. and P.J.; software: N.C., O.H. and P.J.; validation: N.C., O.H. and P.J.; formal analysis: N.C., O.H. and P.J.; investigation: N.C., O.H. and P.J.; resources: N.C., O.H. and P.J.; data curation: N.C., O.H. and P.J.; writing—original draft preparation: N.C., O.H. and P.J.; writing—review and editing: N.C., O.H. and P.J.; visualization: N.C., O.H. and P.J.; supervision: N.C., O.H. and P.J.; project administration: N.C. and O.H.; funding acquisition: O.H. All authors have read and agreed to the published version of the manuscript.
Funding
This research is funded by the Challey Institute for Global Innovation and Growth at North Dakota State University.
Data Availability Statement
The data used in this article and the program file necessary to replicate the results are available online at https://doi.org/10.17632/9pr3272xjb.1 (accessed on 15 August 2023).
Conflicts of Interest
The authors declare no conflict of interest.
Appendix A
Table A1.
Sensitivity analysis with top marginal tax rates.
Table A1.
Sensitivity analysis with top marginal tax rates.
| Nonfarm Employment Rate | Patents per 1000 People | Unemployment Rate | GDP per Capita | |||||
|---|---|---|---|---|---|---|---|---|
| (1) | (2) | (3) | (4) | (5) | (6) | (7) | (8) | |
| Income and payroll taxes | −0.288 *** | −0.247 ** | −0.042 *** | −0.042 *** | −0.164 | −0.131 | −2.607 *** | −3.120 *** |
| (0.101) | (0.100) | (0.012) | (0.012) | (0.271) | (0.277) | (0.956) | (0.940) | |
| Property and other taxes | −0.512 ** | −0.525 ** | −0.020 ** | −0.020 ** | 0.729 ** | 0.717 * | −5.684 ** | −5.506 ** |
| (0.224) | (0.234) | (0.009) | (0.010) | (0.344) | (0.361) | (2.504) | (2.652) | |
| Sales taxes | −0.462 ** | −0.470 ** | −0.015 | −0.015 | −0.0325 | −0.041 | −2.564 | −2.454 |
| (0.192) | (0.200) | (0.010) | (0.010) | (0.364) | (0.383) | (3.198) | (3.411) | |
| Top marginal tax | −0.064 | −0.075 | 0.025 *** | 0.025 ** | 0.232 | 0.224 | 0.128 | 0.261 |
| (0.110) | (0.114) | (0.009) | (0.010) | (0.233) | (0.245) | (1.047) | (1.128) | |
| Controls | ||||||||
| Labor regulation index | −5.171 | −5.616 * | −0.863 *** | −0.863 ** | 110.445 *** | 110.362 *** | −41.082 | −37.674 |
| (3.172) | (3.328) | (0.322) | (0.340) | (11.326) | (11.972) | (30.659) | (31.496) | |
| Government spending index | 1.291 | 2.567 | 0.302 ** | 0.304 * | 0.751 | 1.486 | 40.880 ** | 26.985 |
| (1.803) | (1.568) | (0.148) | (0.158) | (5.771) | (5.961) | (16.520) | (21.281) | |
| Constant | 16.55 *** | 16.45 *** | 0.350 *** | 0.350 *** | −12.565 *** | −12.639 *** | 78.468 *** | 79.742 *** |
| (1.110) | (1.168) | (0.0546) | (0.0575) | (2.307) | (2.424) | (12.487) | (13.134) | |
| Fixed effects | State | County | State | County | State | County | State | County |
| Observations | 28,930 | 28,930 | 28,930 | 28,930 | 28,921 | 28,921 | 28,930 | 28,930 |
Notes: Standard errors in parentheses are clustered at the state level. *, **, and *** denote statistical significance at the 10, 5, and 1 percent levels, respectively.
Table A2.
Quantile regression: median regression results.
Table A2.
Quantile regression: median regression results.
| Nonfarm Employment Rate | Patents per 1000 People | Unemployment Rate | GDP per Capita | |
|---|---|---|---|---|
| (1) | (2) | (3) | (4) | |
| Income and payroll taxes | −0.211 ** | −0.005 *** | 0.091 | −2.636 ** |
| (0.095) | (0.002) | (0.258) | (1.031) | |
| Property and other taxes | −0.305 * | −0.004 | 0.399 | −3.001 ** |
| (0.166) | (0.003) | (0.340) | (1.369) | |
| Sales taxes | −0.457 ** | −0.003 ** | −0.044 | −3.567 * |
| (0.219) | (0.001) | (0.341) | (1.954) | |
| Controls | ||||
| Labor regulation index | −6.363 ** | −0.038 | 108.105 *** | −54.762 *** |
| (2.799) | (0.056) | (14.469) | (19.423) | |
| Government spending index | 3.772 | 0.043 * | 10.681 | 33.893 |
| (3.023) | (0.025) | (9.434) | (21.406) | |
| Fixed effects | State | State | State | State |
| Observations | 28,930 | 28,930 | 28,921 | 28,930 |
Notes: Standard errors in parentheses are clustered at the state level. *, **, and *** denote statistical significance at the 10, 5, and 1 percent levels, respectively.
References
- Agrawal, Ajay, Iain Cockburn, Alberto Galasso, and Alexander Oettl. 2014. Why are some regions more innovative than others? The role of small firms in the presence of large labs. Journal of Urban Economics 81: 149–65. [Google Scholar] [CrossRef]
- Agrawal, David R., and Dirk Foremny. 2019. Relocation of the rich: Migration in response to top tax rate changes from Spanish reforms. Review of Economics and Statistics 101: 214–32. [Google Scholar] [CrossRef]
- Akcigit, Ufuk, John Grigsby, Tom Nicholas, and Stefanie Stantcheva. 2022. Taxation and innovation in the twentieth century. The Quarterly Journal of Economics 137: 329–85. [Google Scholar] [CrossRef]
- Audretsch, David B. 2002. The dynamic role of small firms: Evidence from the US. Small Business Economics 18: 13–40. [Google Scholar] [CrossRef]
- Bureau of Labor Statistics. 2022. QCEW County-MSA-CSA Crosswalk (For NAICS-Based Data). Available online: https://www.bls.gov/cew/classifications/areas/county-msa-csa-crosswalk.htm (accessed on 1 August 2023).
- Caliendo, Marco, Frank Fossen, and Alexander S. Kritikos. 2014. Personality characteristics and the decisions to become and stay self-employed. Small Business Economics 42: 787–814. [Google Scholar] [CrossRef]
- Card, David, and Alan B. Krueger. 2000. Minimum wages and employment: A case study of the fast-food industry in New Jersey and Pennsylvania: Reply. American Economic Review 90: 1397–420. [Google Scholar] [CrossRef]
- Carree, Martin A., and Adriaan Roy Thurik. 2008. The lag structure of the impact of business ownership on economic performance in OECD countries. Small Business Economics 30: 101–10. [Google Scholar] [CrossRef]
- Chairassamee, Nattanicha, and Oudom Hean. 2023. The ripple effects of offshoring in the United States: Boosting local productivity and capital investment. PLoS ONE 18: e0284490. [Google Scholar] [CrossRef]
- Dube, Arindrajit. 2019. Minimum wages and the distribution of family incomes. American Economic Journal: Applied Economics 11: 268–304. [Google Scholar] [CrossRef]
- Feenstra, Robert C., and Gordon H. Hanson. 1999. The impact of outsourcing and high-technology capital on wages: Estimates for the United States, 1979–1990. The Quarterly Journal of Economics 114: 907–40. [Google Scholar] [CrossRef]
- Fritsch, Michael. 2008. How does new business formation affect regional development? Introduction to the special issue. Small Business Economics 30: 1–14. [Google Scholar] [CrossRef]
- Goetz, Stephan J., and Anil Rupasingha. 2009. Determinants of growth in non-farm proprietor densities in the US, 1990–2000. Small Business Economics 32: 425–38. [Google Scholar] [CrossRef]
- Hean, Oudom. 2022. The effects of technological progress in innovative regions on the labor markets of lagging regions: A theoretical perspective. Economies 10: 197. [Google Scholar] [CrossRef]
- Hean, Oudom, and Mark D. Partridge. 2022. The impact of metropolitan technology on the non-metropolitan labour market: Evidence from US patents. Regional Studies 56: 476–88. [Google Scholar] [CrossRef]
- Hean, Oudom, and Nanxin Deng. 2023. The effects of minimum wages over the business cycle: The Great Recession. International of Manpower 44: 19–36. [Google Scholar] [CrossRef]
- Hean, Oudom, and Nattanicha Chairassamee. 2023. The effects of the COVID-19 pandemic on US entrepreneurship. Letters in Spatial and Resource Sciences 16: 1. [Google Scholar] [CrossRef]
- Hean, Oudom, Nattanicha Chairassamee, and Mark D. Partridge. forthcoming. Migration, education, technological change and growing urban inequality. Annals of Regional Science, 1–38. [CrossRef]
- Helmers, Christian, and Mark Rogers. 2010. Innovation and the survival of new firms in the UK. Review of Industrial Organization 36: 227–48. [Google Scholar] [CrossRef]
- Jones, Charles I. 2022. Taxing top incomes in a world of ideas. Journal of Political Economy 130: 2227–74. [Google Scholar] [CrossRef]
- Kleven, Henrik, Camille Landais, Mathilde Munoz, and Stefanie Stantcheva. 2020. Taxation and migration: Evidence and policy implications. Journal of Economic Perspectives 34: 119–42. [Google Scholar] [CrossRef]
- Kogan, Leonid, Dimitris Papanikolaou, Amit Seru, and Noah Stoffman. 2017. Technological innovation, resource allocation, and growth. The Quarterly Journal of Economics 132: 665–712. [Google Scholar] [CrossRef]
- Koster, Sierdjan, André van Stel, and Mickey Folkeringa. 2012. Start-ups as drivers of market mobility: An analysis at the region–sector level for The Netherlands. Small Business Economics 39: 575–85. [Google Scholar] [CrossRef]
- Moretti, Enrico, and Daniel J. Wilson. 2017. The effect of state taxes on the geographical location of top earners: Evidence from star scientists. American Economic Review 107: 1858–903. [Google Scholar] [CrossRef]
- Mukherjee, Abhiroop, Manpreet Singh, and Alminas Žaldokas. 2017. Do corporate taxes hinder innovation? Journal of Financial Economics 124: 195–221. [Google Scholar] [CrossRef]
- Romer, Christina D., and David H. Romer. 2010. The macroeconomic effects of tax changes: Estimates based on a new measure of fiscal shocks. American Economic Review 100: 763–801. [Google Scholar] [CrossRef]
- Romer, Paul M. 1990. Endogenous technological change. Journal of political Economy 98: S71–S102. [Google Scholar] [CrossRef]
- Stansel, Dean, José Torra, Fred McMahon, and Ángel Carrión-Tavárez. 2021. Economic Freedom of North America 2021. Available online: https://www.fraserinstitute.org/studies/economic-freedom-of-north-america-2021 (accessed on 1 August 2023).
- Stephens, Heather M., Mark D. Partridge, and Alessandra Faggian. 2013. Innovation, entrepreneurship and economic growth in lagging regions. Journal of Regional Science 53: 778–812. [Google Scholar] [CrossRef]
- Valliere, Dave, and Rein Peterson. 2009. Entrepreneurship and economic growth: Evidence from emerging and developed countries. Entrepreneurship & Regional Development 21: 459–80. [Google Scholar]
Disclaimer/Publisher’s Note: The statements, opinions and data contained in all publications are solely those of the individual author(s) and contributor(s) and not of MDPI and/or the editor(s). MDPI and/or the editor(s) disclaim responsibility for any injury to people or property resulting from any ideas, methods, instructions or products referred to in the content. |
© 2023 by the authors. Licensee MDPI, Basel, Switzerland. This article is an open access article distributed under the terms and conditions of the Creative Commons Attribution (CC BY) license (https://creativecommons.org/licenses/by/4.0/).