1. Introduction
The relations between the financial and derivatives market and the COVID-19 outbreak have been extensively developed and analyzed.
Ashraf Badar (
2020),
Shehzad et al. (
2020), and
Harjoto et al. (
2021) analyzed the pandemic’s impacts on financial markets from the perspective of investment and risk management. Future price volatility and trading behavior under market stress can have a negative impact on financial market participants, such as speculators, hedgers, and arbitrageurs.
Erdem (
2020) analyzed the stock market’s movements in response to the announcement of COVID-19 and showed how the market was significantly and negatively affected by the pandemic.
Akhtaruzzaman et al. (
2021) found that the increase in conditional correlation between China and G7 firms was high for financial firms during the pandemic.
Izzeldin et al. (
2021), analyzing the relationship between COVID-19 and the stock markets and business sectors, showed the transition to a crisis regime; however, the intensity and time of the crisis varied across different countries and sectors.
Emm et al. (
2022) analyzed the development in trading activity on the global derivative markets during the COVID-19 pandemic and demonstrated a significant increase in volume and open interest increases, leading to greater market interconnectivity.
Struwing et al. (
2022) analyzed the relationship between the pandemic in the U.S. and the behavior of options traders of pharmaceutical companies that developed vaccines and presented positive evidence for the first two and negative evidence for the last one. Their analysis concluded that options traders induced a bullish reaction in implied volatility curves when the pandemic was announced.
Baker et al. (
2020) analyzed the impact of the previous pandemic and COVID-19 on the U.S. stock market and suggested that government restrictions and social distancing were the main reasons for the reaction. In this field,
Scherf et al. (
2022) suggested that restrictions had a general negative effect on stock market indices, but during the announcement, they found an underreaction, followed by some overreactions, which were consequently corrected. Similarly,
Topcu and Gulal (
2020) found that the negative effects on the emerging stock market indices by the announcement of the pandemic by the WHO then dropped off.
Park (
2022) focused on the analyses of how the pandemic-induced market stress affected the dynamic relationship between volatility trading behavior variables and identified the information flows and the stress of the market which caused behavioral distortions of the operator. Additionally, considering the correlations between the volatility of cryptocurrency returns,
Ampountolas (
2023) showed significant long- and short-term spillover effects. Financial assets have low unconditional volatility and the lowest risk when there are no external disruptions. In the analysis of the commodity market,
Khan et al. (
2023) showed a high level of persistence of volatility in all financial markets.
Albulescu (
2021) showed that the pandemic was an important source of financial volatility.
Enilov et al. (
2023) investigated the behavioral patterns of the commodity asset tail, the risk exposure of these assets, and how they ranked according to their safe-haven properties and suggested that aluminum outperformed gold as a safe-haven asset both before and after the COVID-19 pandemic.
Over the past decade, biotech companies have made major R&D investments, especially through fundraising, without benefiting from many gains for years. In recent years, due to changes in the corporate structure of companies in the sector, many companies are start-ups and have changed their approach to product development. The pandemic, by changing health and socio-economic systems, has harmed many traditional companies, but not on the pharmaceutical industries. In fact, during the first quarter of 2020, the biotech sector recorded a marked rise in prices, also outperforming the pharmaceutical sector, and was the exception to the sudden decline in the financial market, which has affected many economic sectors since the beginning of the COVID-19 (
Senior 2020). Despite a brief downturn at the start of 2020, biotech companies’ average growth recovered quite well.
Figure 1 shows that after an initial price shock in March 2020, investments in biotech firms increased. After a decline of 8.8% at the announcement of the pandemic, the Nasdaq Biotechnology Index gained 42.39% since the onset of COVID-19, reaching its maximum value in August 2021 and showing values above the S&P 500 for almost the entire period.
Cancherini et al. (
2021) confirmed this growth and indicated that between January 2020 and January 2021, the European and US biotechs’ average share price increased at more than twice the rate of the S&P 500. This is relevant because this growth was due to the increase in acquisitions, partnerships, IPOs, and fundraising: biotech is supported by venture capital.
Figure 2 confirms this. In fact, biotech companies are financed mainly through M&A, partnerships, and venture capital, reaching uncharted territory between 2015 and 2018 (
Hodgson 2019). In 2020 and 2021, the value of the global biotech IPO reached more than 34 and 35 billion dollars, respectively, more than tripling the 2019 year value. As
Senior (
2021), showed, a prominent role is played by the US market, but Asia’s IPO increased its share from 2019 to 2020. Europe-based companies represent a small minority because many of them prefer to list in the US market. For example, BioNTech SE, a company based in Mainz, Germany, in 2018 was listed on Nasdaq.
Start-ups, young companies in the development phase with innovation at the center of their business model, present a greater risk, which amplifies both the possibilities of gain and loss compared to the companies already consolidated on the market. Most start-ups finance themselves with venture capital. This plays an important role in financing biotech start-ups, whose investments have increased during the pandemic, given the importance of these firms. BioNTech and Moderna, biotech start-ups, are financed via venture capital not only in terms of money but also in terms of managerial guidance. This is because of the fact that biotech, being a knowledge-intensive industry, requires large amounts of capital for research and development and for potential strategic partnerships, as explained by
Chen and Marchioni (
2008). Biotechnology venture capital activities are clustered in urban centers with a large concentration of talent and technology that create a favorable environment for new ideas and technological discoveries (
Florida and Kenney 1988), as well as greater geographical proximity between the various economic agents (
Storper and Venables 2004), helping to facilitate trust and knowledge-based communication in the biotechnology industry (
Dalpé 2003). Most of the venture capital investments in the biotechnology industry are concentrated in Massachusetts (
Gompers and Lerner 2001,
2006;
Gompers et al. 2006). Many studies suggest the role of geography in venture capital in the biotech industry; in fact, both BioNTech and Moderna have their headquarters in Massachusetts. The increase in venture capital financing was accompanied by a strong IPO market for emerging biotech companies, and this is what happened to BioNTech and Moderna, which became IPOs, respectively, in 2019 and 2018. The two firms’ vaccines were the first to be approved by regulators and then to be brought to market. At first glance, the companies may seem very similar but, in reality, Moderna and BioNTech have marked differences. They started out differently, they are managed differently, and the paths they are taking after the pandemic are also divergent. Biopharmaceutical New Technologies, also known as BioNTech, is a German company headquartered in Mainz, where it carries out its main activities; it also has many research offices around the world. It was founded by a group of scientists and doctors. BioNTech, as well as Moderna, has a broad range of relationships with many global pharmaceutical collaborators. In particular, in 2020, BioNTech, in collaboration with Pfizer, developed the mRNA vaccine for preventing COVID-19 infections, which represents the first mRNA vaccine ever authorized. Like BioNTech and other biotech companies, Moderna’s history is quite recent. It is a Massachusetts-based pharmaceutical and biotechnology company founded in 2010, primarily focused on the development of mRNA technology and therapeutics. It has formed strategic alliances with pharmaceutical and biotech companies, government organizations, foundations, and research institutes. The two firms also differ in their corporate structures; BioNTech is 61.91% owned by insiders, 16.28% by institutional shareholders, and the rest, 21.81%, is publicly owned. Moderna’s ownership structure is completely different from BioNTech’s. In fact, Moderna is 62.78% owned by institutional shareholders, 9.32% by insiders, and the remaining 27.9% is publicly owned. While BioNTech’s free float, as a percentage of traded shares is less than 50%, it is important to point out that Moderna’s CEO holds shares as well. BioNTech raised USD 150 million in a US IPO valuing the company at USD 3.4 billion and raised USD 325 million in venture capital in a large private funding round. When Moderna went public in 2018 it was reported at the time to be the largest biotech initial public offering in the history of the biotech sector. The gross proceeds of the offering generated USD 604,347,839 million from investors, exceeding the company’s revised goal. Moderna has been savvy in its fundraising efforts, with the company raising a total of USD 2.7 billion in funding over 12 rounds.
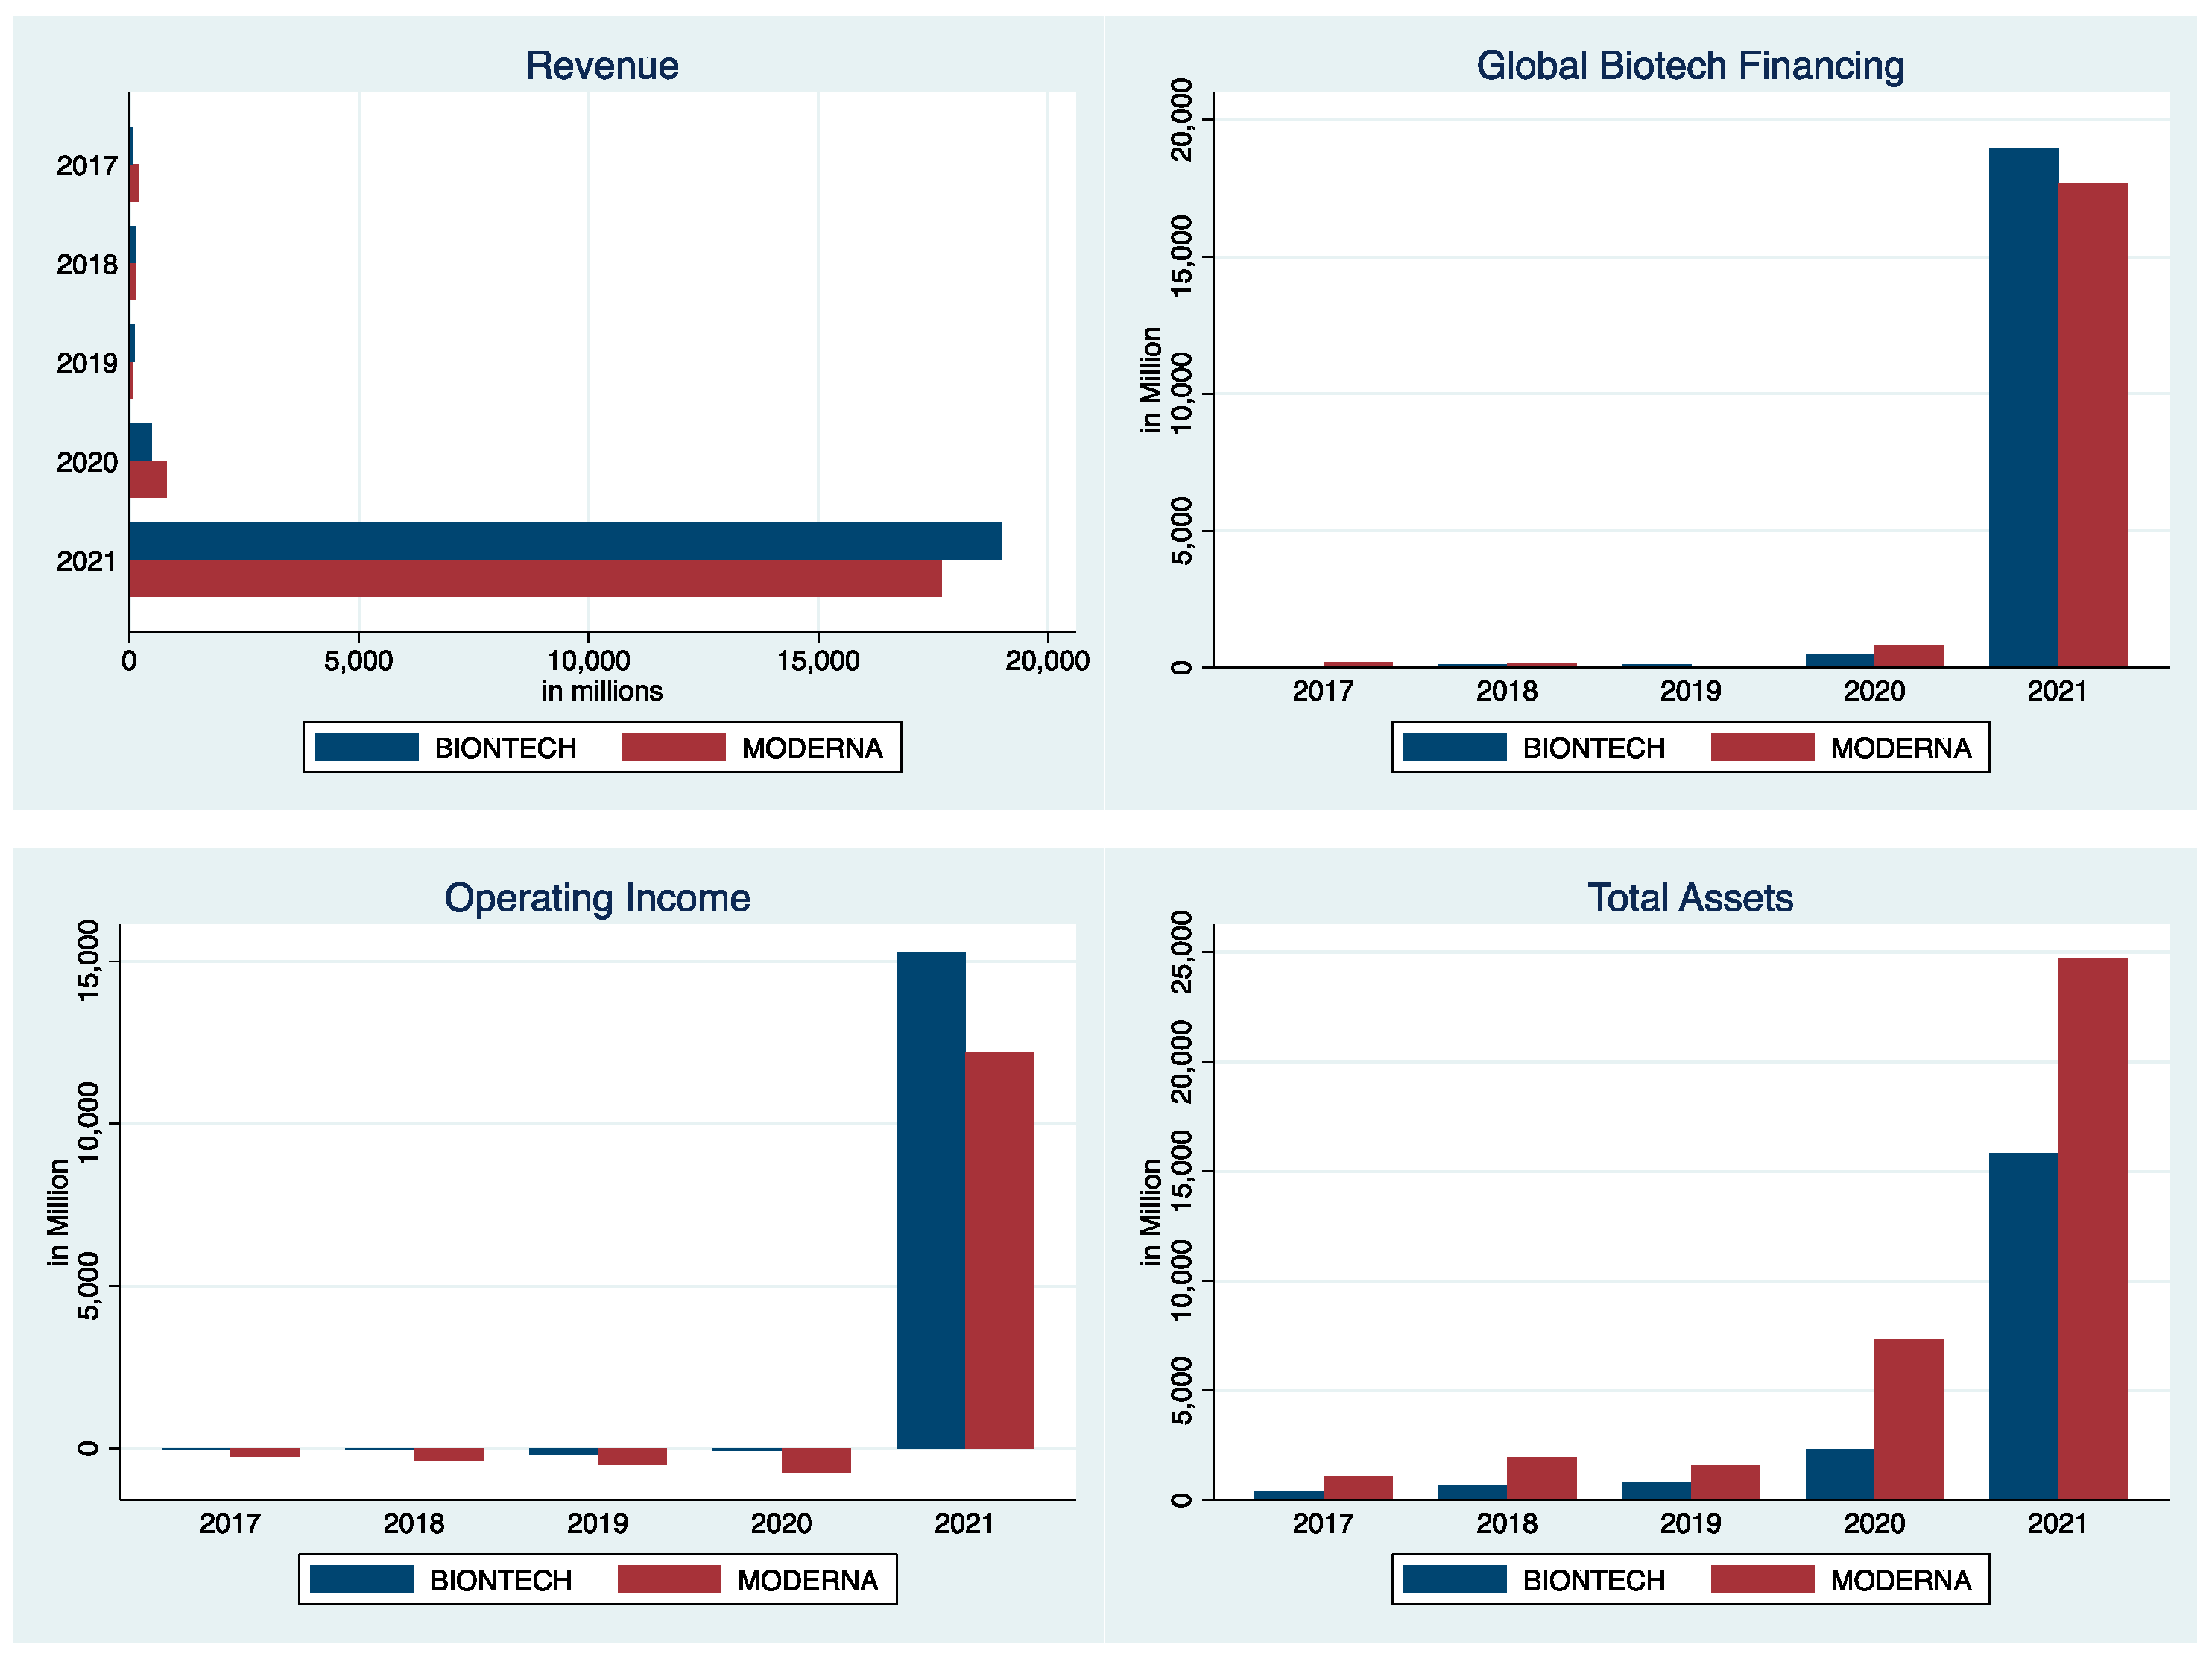
Figure 3 show statement of two companies. BioNTech and Moderna’s annual worldwide revenue increased from 2019 to 2021. For the full year of 2021, Moderna’s total revenue was approximately USD 18.4 billion, primarily generated by the sales of millions of doses of the vaccine. There was a massive increase from the previous year when the revenue amount was only USD 803 million. For the full year of 2021, the annual revenue of BioNTech was nearly UR 19 billion, which increased compared to around EUR 482 million in the previous year.
Our analysis aims to show how COVID-19 has affected the performance of the financial markets and in particular the biotechnology sector. In fact, the analysis of the selected variables has the purpose of showing whether the volatility of the financial markets can determine the returns of BioNTech and Moderna in both analyzed periods, whether the volatility of the two firms is different in the two periods, and if there is a contagion effect between the two companies and the Nasdaq Index in the COVID-19 period.
2. Materials and Methods
The database used in the analysis comprises the daily returns of Moderna, BioNTech, Nasdaq, Brent futures, and variations of Vix. We analyzed the Nasdaq variable, one of the reference indices of innovation, given that the reference companies have developed vaccines with a high technological content. We chose the CBOE Volatility Index because it is one of the most widely used methods of measuring volatility that indicates the frequency and magnitude of price movements over time. The Vix was used as an indicator of US market uncertainty: the faster and more substantial price changes, the greater the volatility. In fact, in mid-March 2020, market volatility reached significantly high values all over the world, given the close connection between the markets. Brent futures were used as a proxy of the economic trend. According to
Pineiro-Chousa et al. (
2022), the aim is to analyze the biopharmaceutical companies and stock market reaction. It comprises 1044 observations from 7 December 2018—the date on which Moderna was listed on the Nasdaq—to 31 January 2023. For the analysis, two samples were used: the pre-COVID-19 period (from 7 December 2018 to 10 March 2020) and the COVID-19 period (from 11 March 2020—the date on which the WHS declared COVID-19 a pandemic—to 31 January 2023). Furthermore, we conducted separate analysss for Moderna and BioNTech.
The daily returns were calculated following the
Campbell et al. (
1997) method:
where P
it is the close price of stock/index i (BioNTech, Moderna, Nasdaq, Vix, and Brent) at time t.
The GARCH model represents a useful tool for volatility analysis. The equation of a generic GARCH (
p,
q) model specifies conditional variance as follows:
where
for
and
for
. The conditional variance depends on parameters
, where
refers to the lag order to the autoregressive part represented by the conditional variance in the past, while
shows the number of lags of the component
. Given
=
and rewriting the expression, we have
The expression was used by
Engle and Bollerslev (
1986) to forecast volatility over time
, and they obtained
where
. The process GARCH (
p,
q) is stationary when
The GARCH (1, 1) model (
Bollerslev 1986) was used to test the returns and volatility behavior of BioNTech and Moderna:
where y
t is the conditional mean;
is the conditional variance;
is the squared residuals;
gi is the ARCH parameters; and
di is the GARCH parameters. Specifically, the method proposed was as follows:
Variance Model
where R
it is the daily returns of
i in (8) being
i BioNTech or Moderna;
is standard deviation;
Ci is the constant;
is the ARCH parameter;
is the GARCH parameter; and
bi is the coefficient of the variables (NASDAQ return, variation of Vix, and Brent return),
t is time, and
m and
k are GARCH (1, 1) parameters.
Dynamic conditional correlations (DCC-GARCH (1, 1)) were used to analyze the dynamic co-movements (
Engle 2002). To secure the covariance stationarity of the conditional variance, parameters
g0,
g1, and
d1 should be less than one. In the same way, the sum of g
1 and d
1 should be less or equal to one to maintain stability (
Corbet et al. 2020).
3. Results
At the beginning of the study period, at the time of the IPO, the share price of Moderna was USD 18.6 and of BioNTech was USD 13.82. The share prices of the two companies after their listings increased. On 11 March 2020, the WHO declared COVID-19 as a pandemic, and since then, prices of the two securities began to increase.
Figure 4 shows the quote of the two companies from the IPO to the end of the analyzed period.
From
Figure 5, we can see that up until 11 March 2020, the share price of the two companies showed stable patterns without excessive volatility. The maximum price recorded by Moderna was less than USD 30 on 6 March 2020, a few days before the WHO declared the pandemic. BioNTech, listed for a few months, recorded its maximum value of USD 45 on 8 January 2020. Between this period and the announcement of the vaccines’ effectiveness, the share prices began to increase. On 9 November 2020 Pfizer, which developed the vaccine together with BioNTech, announced the effectiveness of its product. Moderna did the same the following week, on 16 November. After this period, the two companies showed a very marked rise in prices. In fact, on 9 November 2020, the stock price of BioNTech was USD 104.8 while on 6 Nov, the last market day before the announcement, it was USD 92, with an increase of 13.91% in just one day. In the same way, on 16 November 2020, the stock price of Moderna was USD 97.95, with an increase of 9.57% compared with the previous trading session when it was USD 89.93. On 11 and 18 December 2020, the two vaccines received approval in the US from the Food and Drug Administration and successively received state approval and began to be administered in many states. The rise in the share prices of the two companies continued throughout the analyzed period. On 9 August 2021, BioNTech and Moderna reached their maximum values on Nasdaq. BioNTech’s stock price reached USD 447.23 with a market capitalization of over USD 100 billion, while Moderna’s reached USD 484.47 with a market capitalization of over USD 200 billion. At the end of the analyzed period, BioNTech’s stock price was USD 152.81 and Moderna’s was USD 153.6, with a market capitalization of USD 37 billion and USD 61 billion, respectively. Although after this maximum the shares started to decline with high volatility, after their IPO both companies showed an increase in share value. BioNTech and Moderna increased their initial values 14- and 11-fold, respectively.
The daily returns of Moderna and BioNTech showed that, after 11 March 2020, the volatility increased.
We chose to use these variables because they approximate the market condition well. In particular, the two companies are quoted on Nasdaq and they are part of the Nasdaq Biotechnology Index—they are biotech companies—so we used the Nasdaq to benchmark the index for the stock market. We used the Vix index to indicate the variability of the US stock market and the expectations of operators. In fact, after 11 March 2020, the index recorded growing values due to market uncertainty, reaching the maximum value of 82 on 16 March 2020 and showing a high degree of volatility in the subsequent period. The Brent value was used to approximate the market sentiment.
Table 1, in the pre-COVID-19 period, and
Table 2, in the COVID-19 period, show the descriptive statistics of the variable returns.
The main indicator was the skewness, which showed the asymmetry in its distribution. Both the pre-COVID-19 and the COVID-19 period were close to zero, except in the case of the pre-COVID-19 period for Vix, which was equal to 1, and for BRNT, which showed a negative asymmetry equal to 3. Regarding the kurtosis, the variables showed a leptokurtic distribution in both periods, with the maximum values reached by BRNT and BNTX in the COVID-19 period.
Regarding Kurtosis, the relative width of the distribution was always positive and indicated higher return distributions than normal ones. The correct value, in such a way that the distribution can approach a normal one, should be about 3. The skewness asymmetry of the distribution around the sample average with a value that should be 0 was negative for NBI, NDQ, and BNT.
Table 3 and
Table 4 show the correlation between the variables: H0:
and H1:
at a 5% level. The test statistic was T =
and the critical value was t = 1.9631; the value of the statistic test was 2.1329 and we rejected the null hypothesis H0.
The correlation matrix both in the pre-COVID-19 period and the COVID-19 period showed positive and significant correlations between the daily returns of Moderna and all variables except the Vix index, which showed a negative correlation, and BRNT, which showed a non-significant correlation. In the COVID-19 period the correlation was positive and significant for NDQ but was negative and significant for VIX and BRNT. This is due to the nature of the Vix index, which measures the volatility of the stock market and therefore the risks associated with it. The correlation between MRNA and BNTX was positive and significant for both periods. Comparing Moderna’s returns with BioNTech’s returns, the same behavior appeared, both in the pre-COVID-19 and COVID-19 periods, but for the pre-COVID-19 period the values were not significant. This may be due to the recent listing. In a period such as March 2020, when the world economy had to stop suddenly due to the pandemic, this explains how traditional economic indicators such as traditional sectors of the stock market and oil prices decreased while market volatility showed high fluctuations. The biotechnology sector and its constituent companies showed an uptrend given the assumed importance.
In the pre-COVID-19 period, the correlation between Moderna and Nasdaq was positive, which means that these also increased Moderna’s returns. The Vix index was negative. This means that when volatility increased, returns decreased and vice versa. Brent was positive but not significant. In the COVID-19 period, the correlation between Moderna and Nasdaq continued to be positive and double its former value, strengthening the link between the two and the greater importance assumed by the index in question in determining the returns of these companies. At the same time, the correlation with Brent became negative due to the economic lockdown and the decrease in the demand for Brent.
Regarding BioNTech’s results in the pre-COVID-19 period, the correlation between Nasdaq and Brent was positive and negative for Vix, but insignificant in both cases. This is probably due to the recent listing and the underpricing after IPO, resulting in the prices not yet being stabilized. In the COVID-19 period the correlation became positive and significant with Nasdaq, suggesting that when Nasdaq increased, BioNTech’s returns also increased. In this period, Vix and Brent were significantly negative, which means that when market volatility increased, BioNTech the returns decreased. In sum, investors decided to buy BioNTech stock due to the crisis situation, volatility, or market sentiment.
Table 5 and
Table 6 show ARCH and GARCH estimates.
Table 5 and
Table 6 show how NDQ and VIX parameters were significant in estimating Moderna’s volatility in the pre-COVID-19 period and NDQ and BRNT in the COVID-19 period. Conversely, for BioNTech both in the pre-COVID-19 and the COVID-19 periods, NDQ and BRNT showed significant values. The ARCH coefficients were significant in all models, meaning that the volatility of Moderna and BioNTech on the previous day influenced the volatility of Moderna or BioNTech, which was higher for BioNTech, in the pre-COVID-19 period. The Moderna and BioNTech GARCH coefficients were also significant, indicating that the market volatility of the previous day influenced the volatility of Moderna and BioNTech. The GARCH values both for Moderna and BioNTech were higher in the COVID-19 period. The significance of ARCH’s effects was analyzed by the ARCH-LM test. The null hypothesis of no ARCH effects is
, otherwise, it is possible to conclude that there were ARCH effects in the time series. The alternative hypothesis is autocorrelation in the squared residuals, given by the regression
. The Lagrange multiplier test was used to assess the significance of ARCH’s effects, providing a
p-value equal to 0.000. Thus, the models GARCH (1, 1) are supported. Therefore, the model is correctly specified. It can be concluded that the GARCH (1,1) model is suitable for modeling Moderna and BioNTech’s volatility. Comparing both companies, the market volatility and GARCH coefficients had a greater and more significant influence on Moderna’s volatility than on BioNTech’s volatility, suggesting their different reaction to market volatility during these periods. Furthermore, both companies showed ARCH coefficients that in the COVID-19 period were almost half compared with the pre-COVID-19 period. For the GARCH coefficient the opposite occurred. In fact, from the pre-COVID-19 to the COVID-19 period this coefficient more than doubled.
Figure 6 shows the dynamic correlations of Moderna and BioNTech with the Nasdaq Index. During the COVID-19 period, the dynamic correlation increased considerably compared with the pre-COVID-19 period, showing a clear effect between these variables. Indeed, before 11 March 2020, the correlation between the two stocks and the Nasdaq Index recorded values around zero or slightly higher, while in the immediately following period there was a marked increase in the correlation value for BioNTech and a drastic decrease for Moderna. After the initial shock, the correlation showed coordinated and cyclical swings throughout 2021 and stabilized in 2022 between 0.2 and 0.4. These results suggest that the biopharmaceutical companies that developed the vaccine could have a positive effect on the market, avoiding the downturn derived from the lockdown and the activity stoppage in most economic sectors.
To estimate the multivariate model of the Engle procedure, residues were used. An evaluation of the GARCH model was performed by comparing the residues to the square of the diagonal matrix of variance and covariance resulting from the GARCH. After carrying out the Dynamic Conditional Correlation analysis, we estimated the matrix of variance–covariance and the matrix of conditional dynamic correlation. The analysis compares the variance estimated by the model, the diagonal elements H
t, green line, with the squares of the residues that represent the real variance, blue line. The results in
Figure 7 for Moderna and BioNTech showed that the model predicted the value of the variance well for both analyzed periods.
4. Conclusions
The pandemic has significantly changed the economy several countries and the financial and derivatives market. The analysis focused on two start-up companies that have played a leading role in vaccine development. The two biotech firms, BioNTech and Moderna, showed substantial increases in their shares prices during the COVID-19 period. The analysis took the form of observing the behavior assumed by companies before and after the outbreak of the pandemic. If it is undeniable that during the pandemic, the biotech sector—in general—and vaccine development companies—in particular—increased their profits and share values sharply; however it cannot be said that this was only the effect of speculation on the sale price. In fact, before the COVID-19 period, the revenue values were modest, while in 2020 and especially in 2021, they showed high growth. For the operative income, until 2020, the values were negative, though in 2021, they exceeded USD 10,000 million. The considerable funding that companies in the sector have benefited from has been the basis for a rapid restart in economic activity: the biopharmaceutical companies that developed the vaccine have had a positive effect on the market, avoiding the downturn derived from the lockdown and the activity stoppage in most economic sectors, as the GARCH model confirmed.
The results of the GARCH (1, 1) volatility model highlight the importance of reducing risk in the financial market. For both companies, the GARCH coefficients, which allow volatility to be expressed through the observation of past shocks, in both periods more than doubled compared to the previous period. The contagion effect fund during the COVID-19 period between the firms and the Nasdaq index underlines the importance of technology sectors and companies, start-ups, recently listed on the financial markets that, with research and development and innovation, have created not just economic value but are also directly responsible for the development of life-saving vaccines, thereby creating value for the whole community, which was beneficial at a social level. Therefore, the performance and the high returns of the two companies can be viewed in the light of the rationality of investors who rewarded the biopharmaceutical sector which, with its initiative, could translate events and translate them into countermoves to be made. The dynamic correlation between BioNTech and Moderna and the Nasdaq index during the pandemic underlines the importance of the technological sectors that R&D and innovation offer in the financial markets, creating solutions beyond the traditional safe-haven assets.
This research has certain limitations. The analysis out considered the two companies that first developed the vaccines and obtained approval from authorities. The research could be expanded by analyzing more biopharmaceutical companies and how news about vaccines can change the stock prices and returns of companies to better understand the behavior of financial markets.


