1. Introduction
The COVID-19 pandemic was the most severe shock to hit the U.S. economy since at least the Great Depression. Concerns over the direct impact of the virus, the associated public policy response, and the ongoing evolution of economic conditions ushered in an era of enormous uncertainty. Most readily available indicators of economic uncertainty rose to their highest levels on record. As the economy recovered over the latter half of 2020 and continuing throughout 2021 and into early 2022, many uncertainty measures remain elevated relative to their pre-pandemic levels.
We examine the evolution of several uncertainty measures that are both forward-looking and available in near real-time. Given the rapid onset of the pandemic and swift changes in both the virus and policy responses to it over successive COVID-19 waves, it was quite valuable to have real-time measures to supplement traditional macro indicators, which become available with lags of month or quarters (
Altig et al. 2020c). Forward-looking uncertainty measures gleaned from business decision makers are especially useful for assessing prospective responses to a pandemic shock or other fast-moving developments. Each measure we consider offers a distinct lens on uncertainty—whether from financial market participants, newswires, professional forecasters, or business executives. Each carries its own inherent strengths and weaknesses. We seek not to assess which measure is most accurate or otherwise “best”, but to quantify perceived economic uncertainties in the wake of the COVID-19 shock. The measures we examine are forward-looking in nature and helpful for understanding capital investment and hiring decisions (
Baker et al. 2016).
We make five key points. First, equity market traders and executives at nonfinancial firms have shared similar assessments about uncertainty at one-year look-ahead horizons. That is, the one-year VIX has moved similarly to our survey-based measure of (average) firm-level subjective uncertainty at one-year forecast horizons. Here, and contrary to the message in the popular press, we see little disconnect between “Main Street” and “Wall Street” views.
Second, the 1-month VIX, the Twitter-based Economic Uncertainty Index, and macro forecaster disagreement all rose sharply at the onset of the pandemic but retrenched almost completely by mid-2021. Thus, these measures exhibit a somewhat different time pattern than the one-year VIX and our survey-based measure of business-level uncertainty.
Third, inspecting the categorical elements of the newspaper-based Economic Policy Uncertainty Index shows that much of the initial pandemic-related surge in uncertainty reflected concerns around healthcare policy, with material roles for concerns around fiscal policy and regulation as well. Uncertainty over healthcare policy fell as COVID treatments improved and vaccines became available, while regulatory and fiscal policy uncertainty edged down to near their pre-pandemic levels by the end of 2021. As inflation surged in late 2021 and early 2022, monetary policy uncertainty rose sharply. Russia’s invasion of Ukraine triggered a sharp upward spike in uncertainty around national security matters in March 2022.
Fourth, looking within the distribution of beliefs in the Survey of Business Uncertainty (SBU) reveals that firm-level risk perceptions shifted sharply to the upside beginning in the summer and fall of 2020 and continuing through the end of our sample in May 2022. In this sense, decision makers in nonfinancial businesses share some of the optimism that seems manifest in equity markets over this time period. We delve deeper into firm-level uncertainty by decomposing the overall variance of firm-level forecast distributions into between-firm and within-firm components.
Fifth, we designed and fielded special SBU questions to help assess the impact of pandemic-era uncertainty on the capital investment plans of businesses. The resulting evidence suggests that recently high uncertainty levels are exerting only a mild restraint on capital investment plans for 2022 and 2023, perhaps because the uncertainty is so skewed to the upside. This finding differs from the situation earlier in the pandemic, when first-moment revenue expectations were softer and downside risks still loomed large.
2. Measures of Uncertainty
This section describes the forward-looking measures of economic uncertainty that we examine, all of which are available in real time or near real time.
2.1. Stock Market Returns Volatility
The CBOE Volatility Index (VIX) is perhaps the best-known and most closely followed measure of financial uncertainty. The VIX quantifies the option-implied volatility of returns on the S&P 500 equity index at various look-ahead horizons. The 1-month-ahead version of the VIX attracts the most attention. We consider both the 1-month-ahead and the 1-year-ahead versions. Given our particular interest in subjective firm-level uncertainty at a 1-year forecast horizon, the 1-year VIX lets us compare “main street” (firms) and “wall street” (equity market participants) perceptions of uncertainty.
1 2.2. Text-Based Uncertainty Measures
We consider the monthly newspaper-based Economic Policy Uncertainty Index (EPU) of
Baker et al. (
2016) and the Twitter-based Economic Uncertainty Index (TEU) of
Baker et al. (
2021). The EPU index reflects the frequency of newspaper articles that mention economics, policy matters, and uncertainty. The monthly EPU draws on a balanced panel of major U.S. newspapers, which ensures that fluctuations in the index are not distorted by changes in the mix of newspapers that feed into the index.
2 The Twitter-based uncertainty index (TEU) captures counts of tweets about the “economy” and “uncertainty”. It reflects the expressed perceptions and opinions of a broad cross-section of the public rather than journalists and their editors. Tweets have a clear real-time component, as they come with a precise timestamp and geolocation tag. These text-based indexes reflect real-time uncertainty perceived and expressed by journalists and a broad swath of the public that participates in social media. In this sense, they are forward looking.
2.3. Disagreement among Professional Forecasters
Many researchers treat the extent of disagreement among forecasters about future macro outcomes as a proxy for economic uncertainty. See
Rietz (
1988) for an early example. Other researchers (e.g.,
Rich and Tracy 2021) criticize this approach. Nevertheless, we consider forecaster disagreement measures in view of their long history as uncertainty indicators. Our particular measure of forecaster disagreement is the interquartile range of 1-year ahead nominal GDP growth rate forecasts in the Philadelphia Fed’s Survey of Professional Forecasters (SPF). There are typically about 35-to-45 observations per survey wave for this forecast outcome.
3 2.4. Firm-Level Uncertainty about Future Sales Growth Rates
The Survey of Business Uncertainty (SBU) elicits subjective beliefs about own-firm future outcomes from about 470 business executives per month. The SBU panel draws from all 50 states, every major nonfarm industry, and a wide range of firm sizes. Core questions elicit five-point probability distributions (mass points and associated probabilities) over each firm’s own growth rates of sales revenue and employment at a one-year look-ahead horizon. Using these forecast distributions, we compute each firm’s standard deviation of future growth rate possibilities and then aggregate over firms (weighting by activity) to obtain our SBU-based subjective uncertainty measures. We focus on year-ahead sales growth uncertainty. See
Altig et al. (
2020a) for an analysis of firm-level beliefs in SBU data. Among other things, they show that firm-level growth expectations are highly predictive of realized growth rates, and that firm-level uncertainty predicts the magnitudes of future forecast errors and future forecast revisions.
While the SBU is a young survey, its approach to eliciting subjective forecast distributions from business decision makers has been adopted in several other surveys with large-scale institutional backing. The Bank of England, in partnership with the University of Nottingham, has fielded a monthly survey of U.K. firms since 2016 that adopts the SBU question design (
Bloom et al. 2017). The U.S. Census Bureau fielded questions with the SBU design in the Management and Organizational Practices Survey (
Buffington et al. 2017;
Bloom et al. 2020). The World Bank adopted the SBU approach to subjective forecast distributions in a coordinated global survey effort to better understand the impact of the COVID-19 pandemic (
Apedo-Amah et al. 2020).
3. Uncertainty at the Onset of the COVID-19 Pandemic
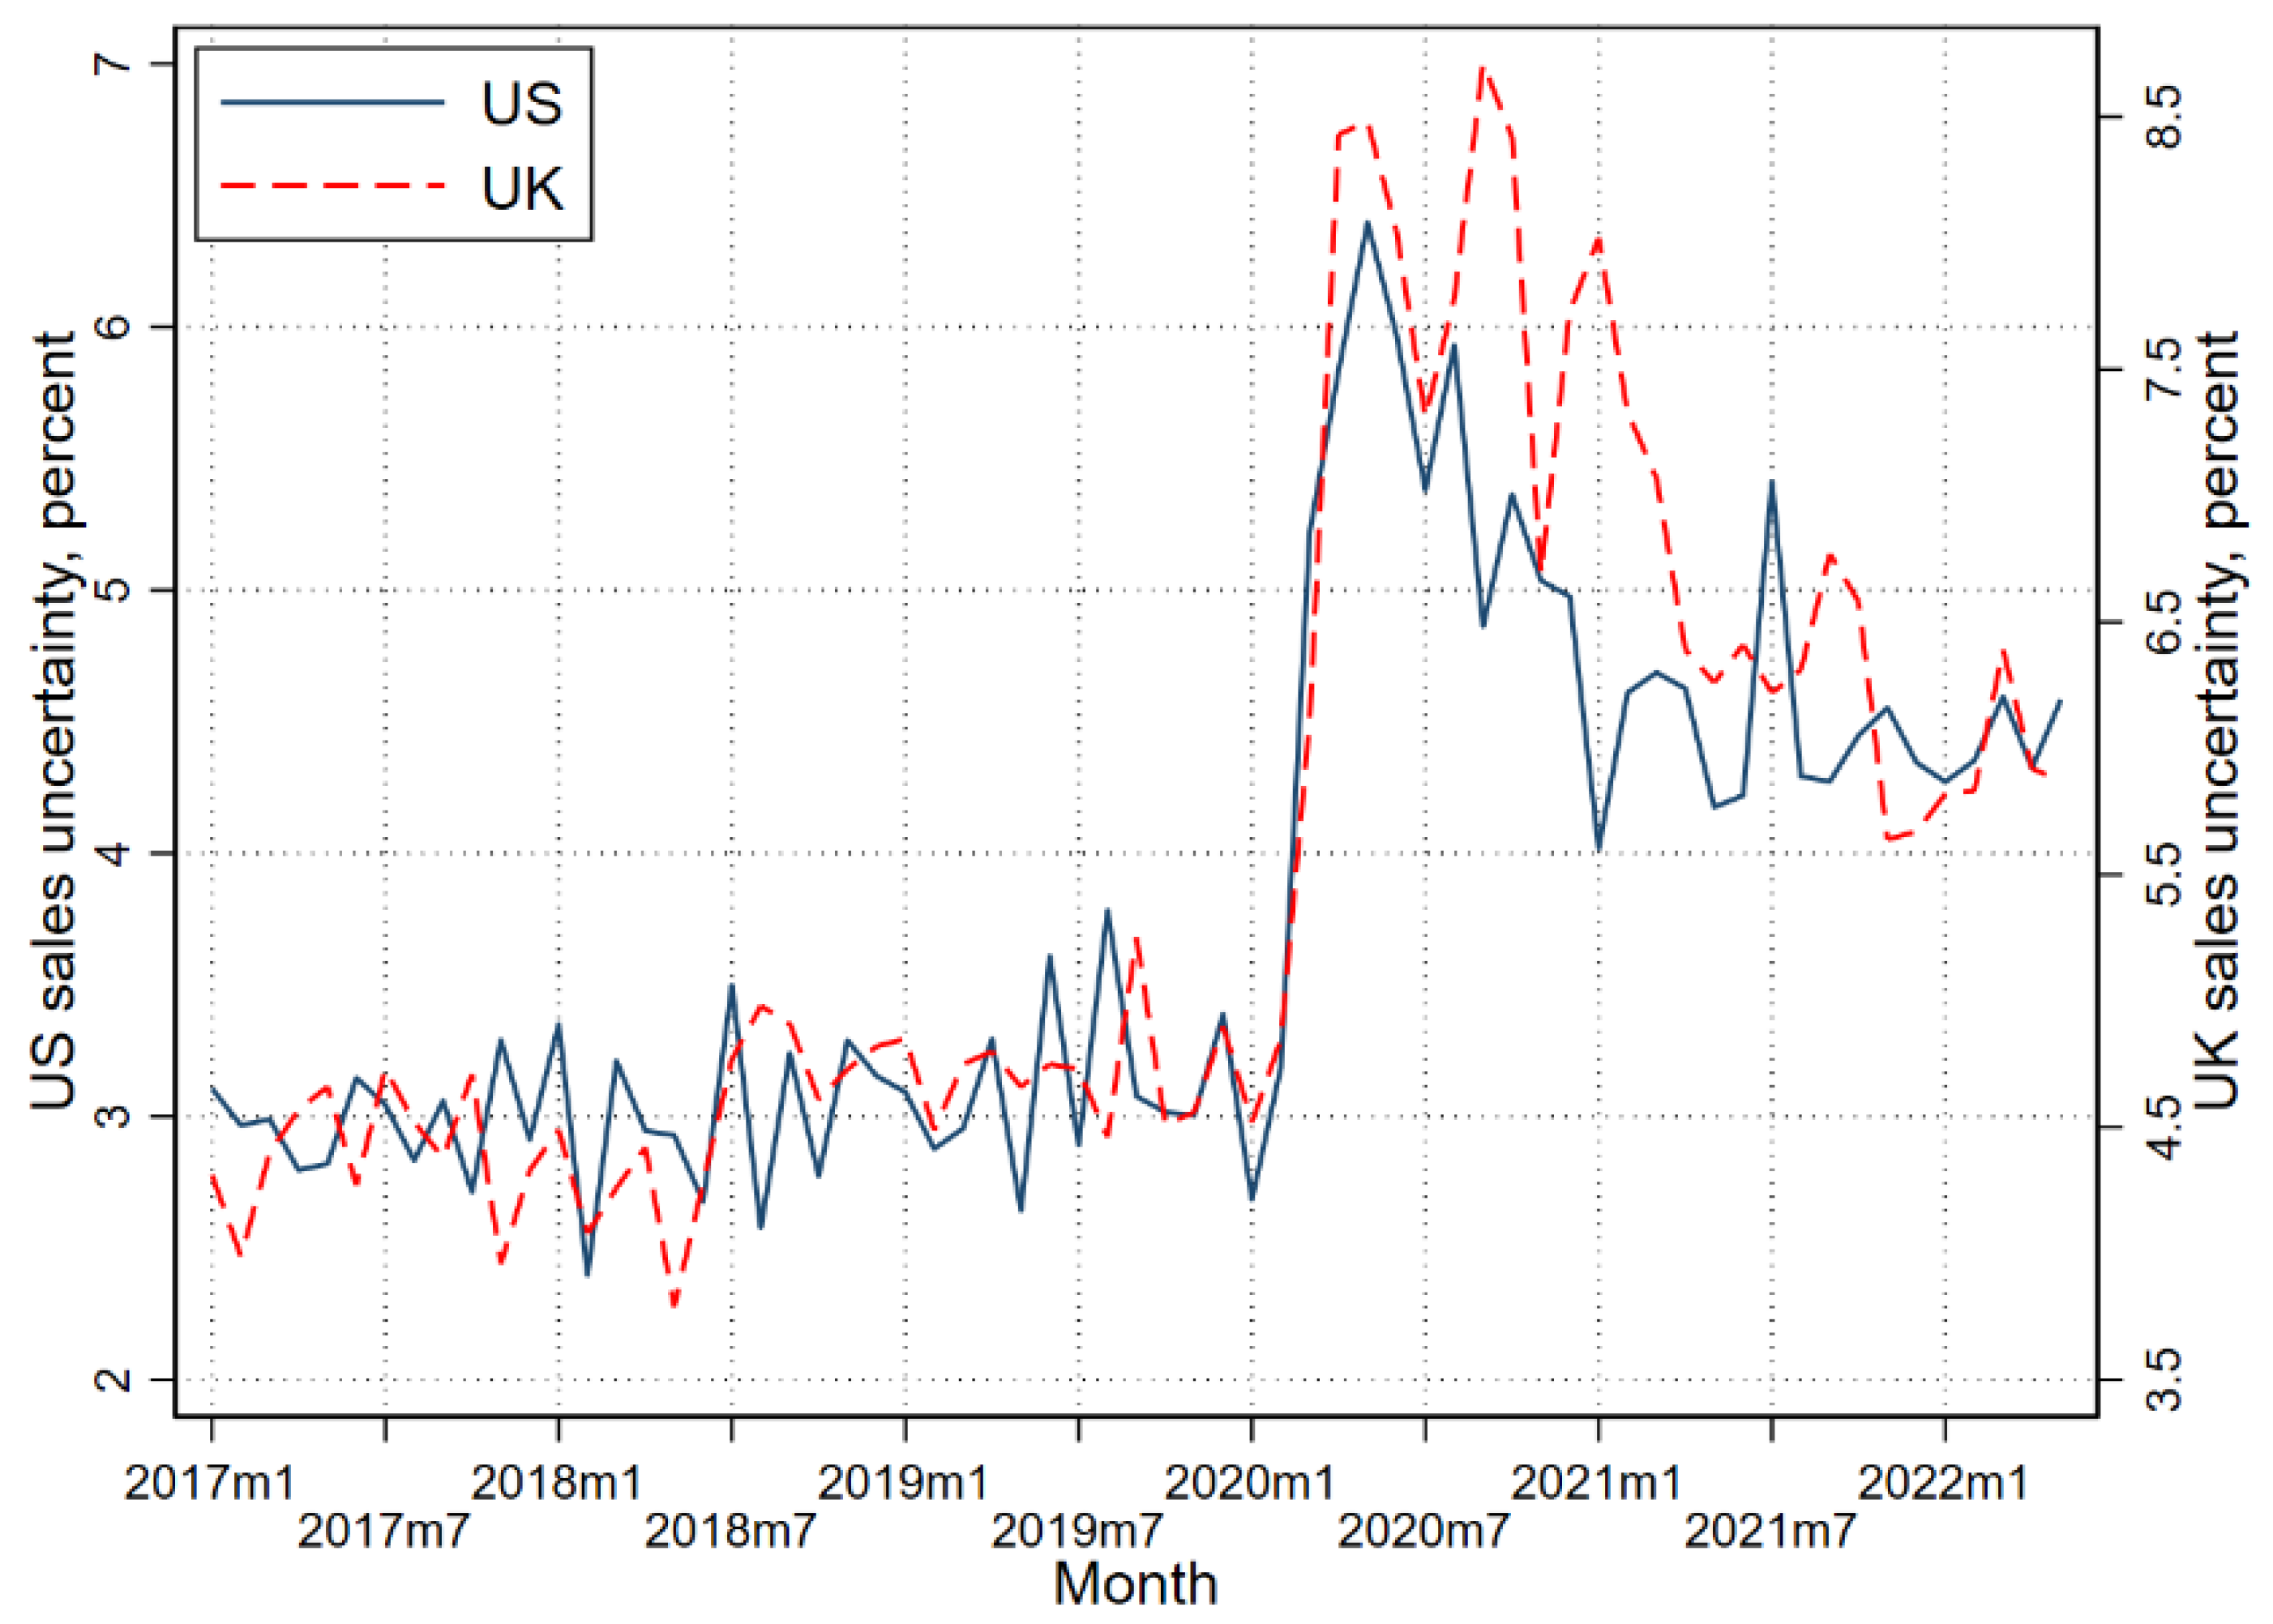
Figure 1 presents our SBU-based measure of subjective uncertainty over sales growth rates and an analogous measure for the United Kingdom derived from the U.K. Decision Maker Panel. Sales growth rate uncertainty more than doubled in the United States and nearly doubled in the U.K. in the immediate wake of the pandemic. While these series have short histories, the pandemic-onset episode dwarfs any pickup in uncertainty around the Tax Cuts and Jobs Act in late 2017 or during the 2018–2019 period marked by increasing tariffs and global trade tensions.
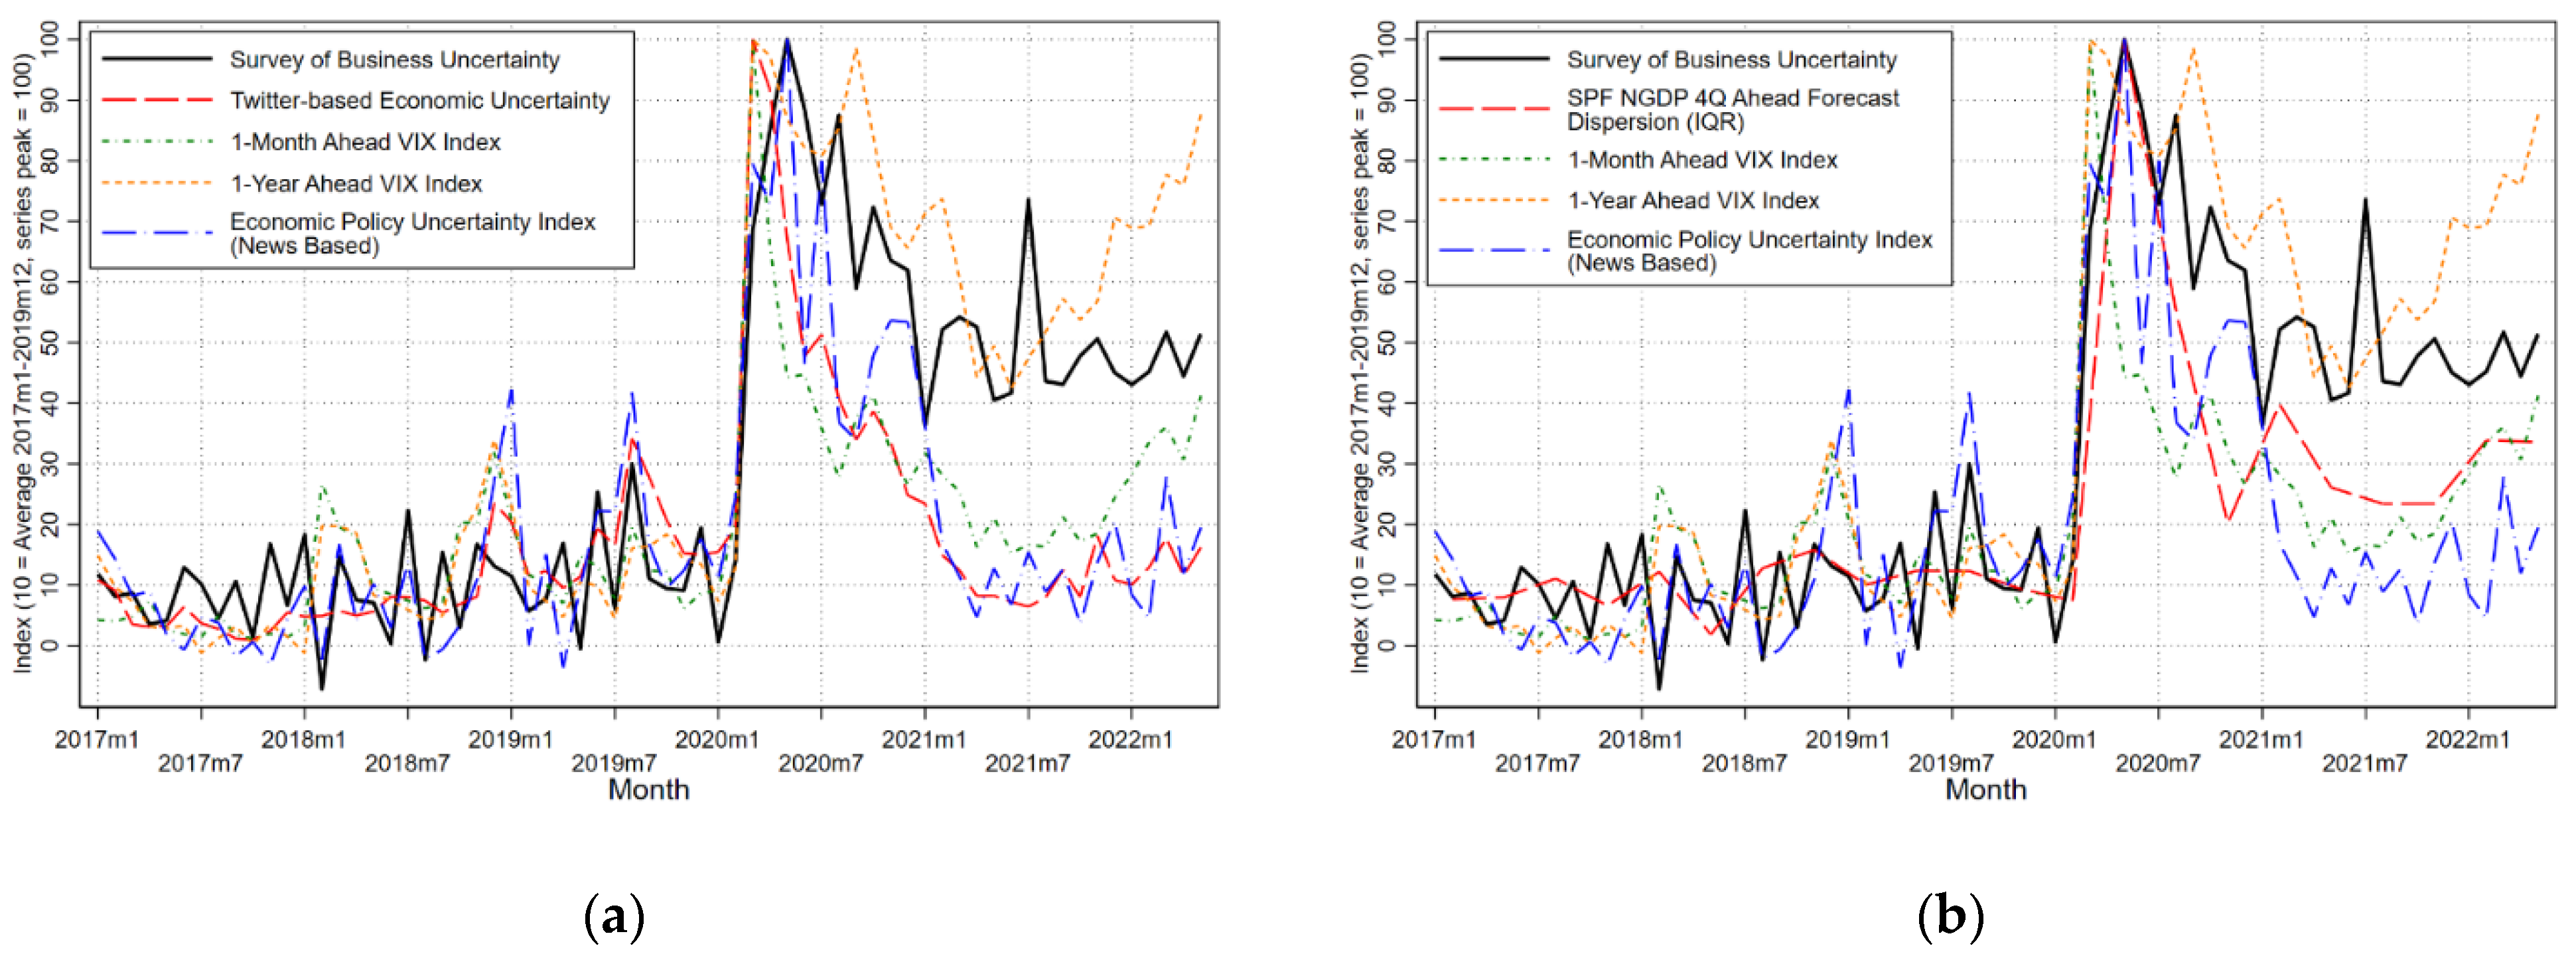
4 Figure 2a compares the SBU subjective uncertainty measure to five other measures. The first two, the 1-month and 1-year VIX, are familiar metrics of stock market uncertainty. The second set are the text-based measures of uncertainty—the EPU and TEU. In
Figure 2b we replace the TEU with a measure of disagreement among professional forecasters about year-ahead nominal GDP growth.
5 While there are many measures of uncertainty (see
Barrero and Bloom 2020), we selected these measures because they are well-known forward-looking uncertainty measures and are available in (near) real time. For ease of comparison, we normalize each series by its own pre-pandemic average from January 2019 to January 2020. This allows us to clearly see the increase in relative magnitudes at the onset of COVID-19.
Three results stand out in
Figure 2a,b. First, all measures spiked in March 2020, but the rises in the 1-month VIX, forecaster disagreement, and the TEU are extreme relative to the rises in (average) firm-level subjective uncertainty, the EPU, and the 1-year VIX. The SPF-based measure shows the greatest level of disagreement among professional forecaster since the early 1980, and the newspaper-based EPU index registered record highs in a series that dates back to January 1985.
Second, all except the text-based measures have settled into levels roughly 1 ½ to 2 times their pre-pandemic averages. Third, while still elevated, the 1-month VIX and the text-based uncertainty measures fell substantially after the early stages of the pandemic. The SBU-based measures and the year-ahead VIX, in contrast, fell only modestly through the end of 2020.
The strongly similar patterns for the 1-year VIX and the SBU measure at least partly reflect the alignment of the horizon over which uncertainty is measured: Sales growth rate forecasts in the SBU are defined at 4-quarter look-ahead horizons. The message from this is not that one set of measures is superior to the others, but instead the rather obvious point that the horizon over which uncertainty is defined matters. With respect to questions that involve expectations of business decision makers over something like a one-year horizon, the 1-year VIX is clearly a better proxy for uncertainty than the 1-month VIX. These two measures suggest that “main street” (SBU) and “wall street” (1-year VIX) viewed the uncertainty associated with the onset of the pandemic similarly.
That said, there is a clear disconnect between how firms and professional forecasters—proxied by forecaster disagreement—saw the uncertainty ushered in by COVID-19. Amongst the SPF panel members, the cross-sectional IQR of year-ahead nominal GDP growth forecasts as of the 2020:Q1 survey was just 0.6 percentage points. One quarter later, that IQR surged to 4.6 percentage points. While this surge aligns with the macro uncertainty index generated by
Jurado et al. (
2015), it far exceeds the doubling in uncertainty implied by the SBU measure and the 1-year VIX. These comparisons show that different measures tell different stories about the magnitude of the surge in economic uncertainty triggered by the pandemic.
4. Uncertainty as the Pandemic Wore On
Just as these real-time measures of uncertainty spiked in differing degrees at the outset of the pandemic (by roughly 75 percent for the 1-year VIX and 650 percent for professional forecaster disagreement), they traced out different paths as the economy rebounded.
Figure 3a,b plot the same series as in
Figure 2a,b, but instead of normalizing the behavior of these series to their pre-pandemic levels, we normalize each series to its pandemic-era peak.
As
Figure 3a,b show, all uncertainty measures fell from their respective peaks, but to differing degrees. Text-based uncertainty measures (EPU and TEU), forecaster disagreement and the 1-month VIX all fell swiftly to half their peak levels by August 2020 and continued to decline into 2021, flattening out around midyear at levels near their pre-pandemic averages. In contrast, the SBU-based measure of firm-level uncertainty and the 1-year VIX fell to only about 1.5 times their pre-pandemic levels over the same period.
The behavior of near-term (1-month) and longer-term (1-year) market-based uncertainty is somewhat disconnected from equity market performance early in the pandemic. While the early stages of the COVID-19 pandemic drove a spectacular rout in stock markets, equity prices recovered sharply after March. By the end of 2020, the S&P 500 index stood about 11 percent above its pre-pandemic peak in February 2020. Equities climbed further in 2021, rising 27 percent during the year and finishing nearly 40 percent above the pre-pandemic peak. Measures of real economic activity have been slower to recover. U.S. real GDP overtook its pre-pandemic level in mid-2021, but stood just 3 percent above its 2019:Q4 level at the beginning of 2022.
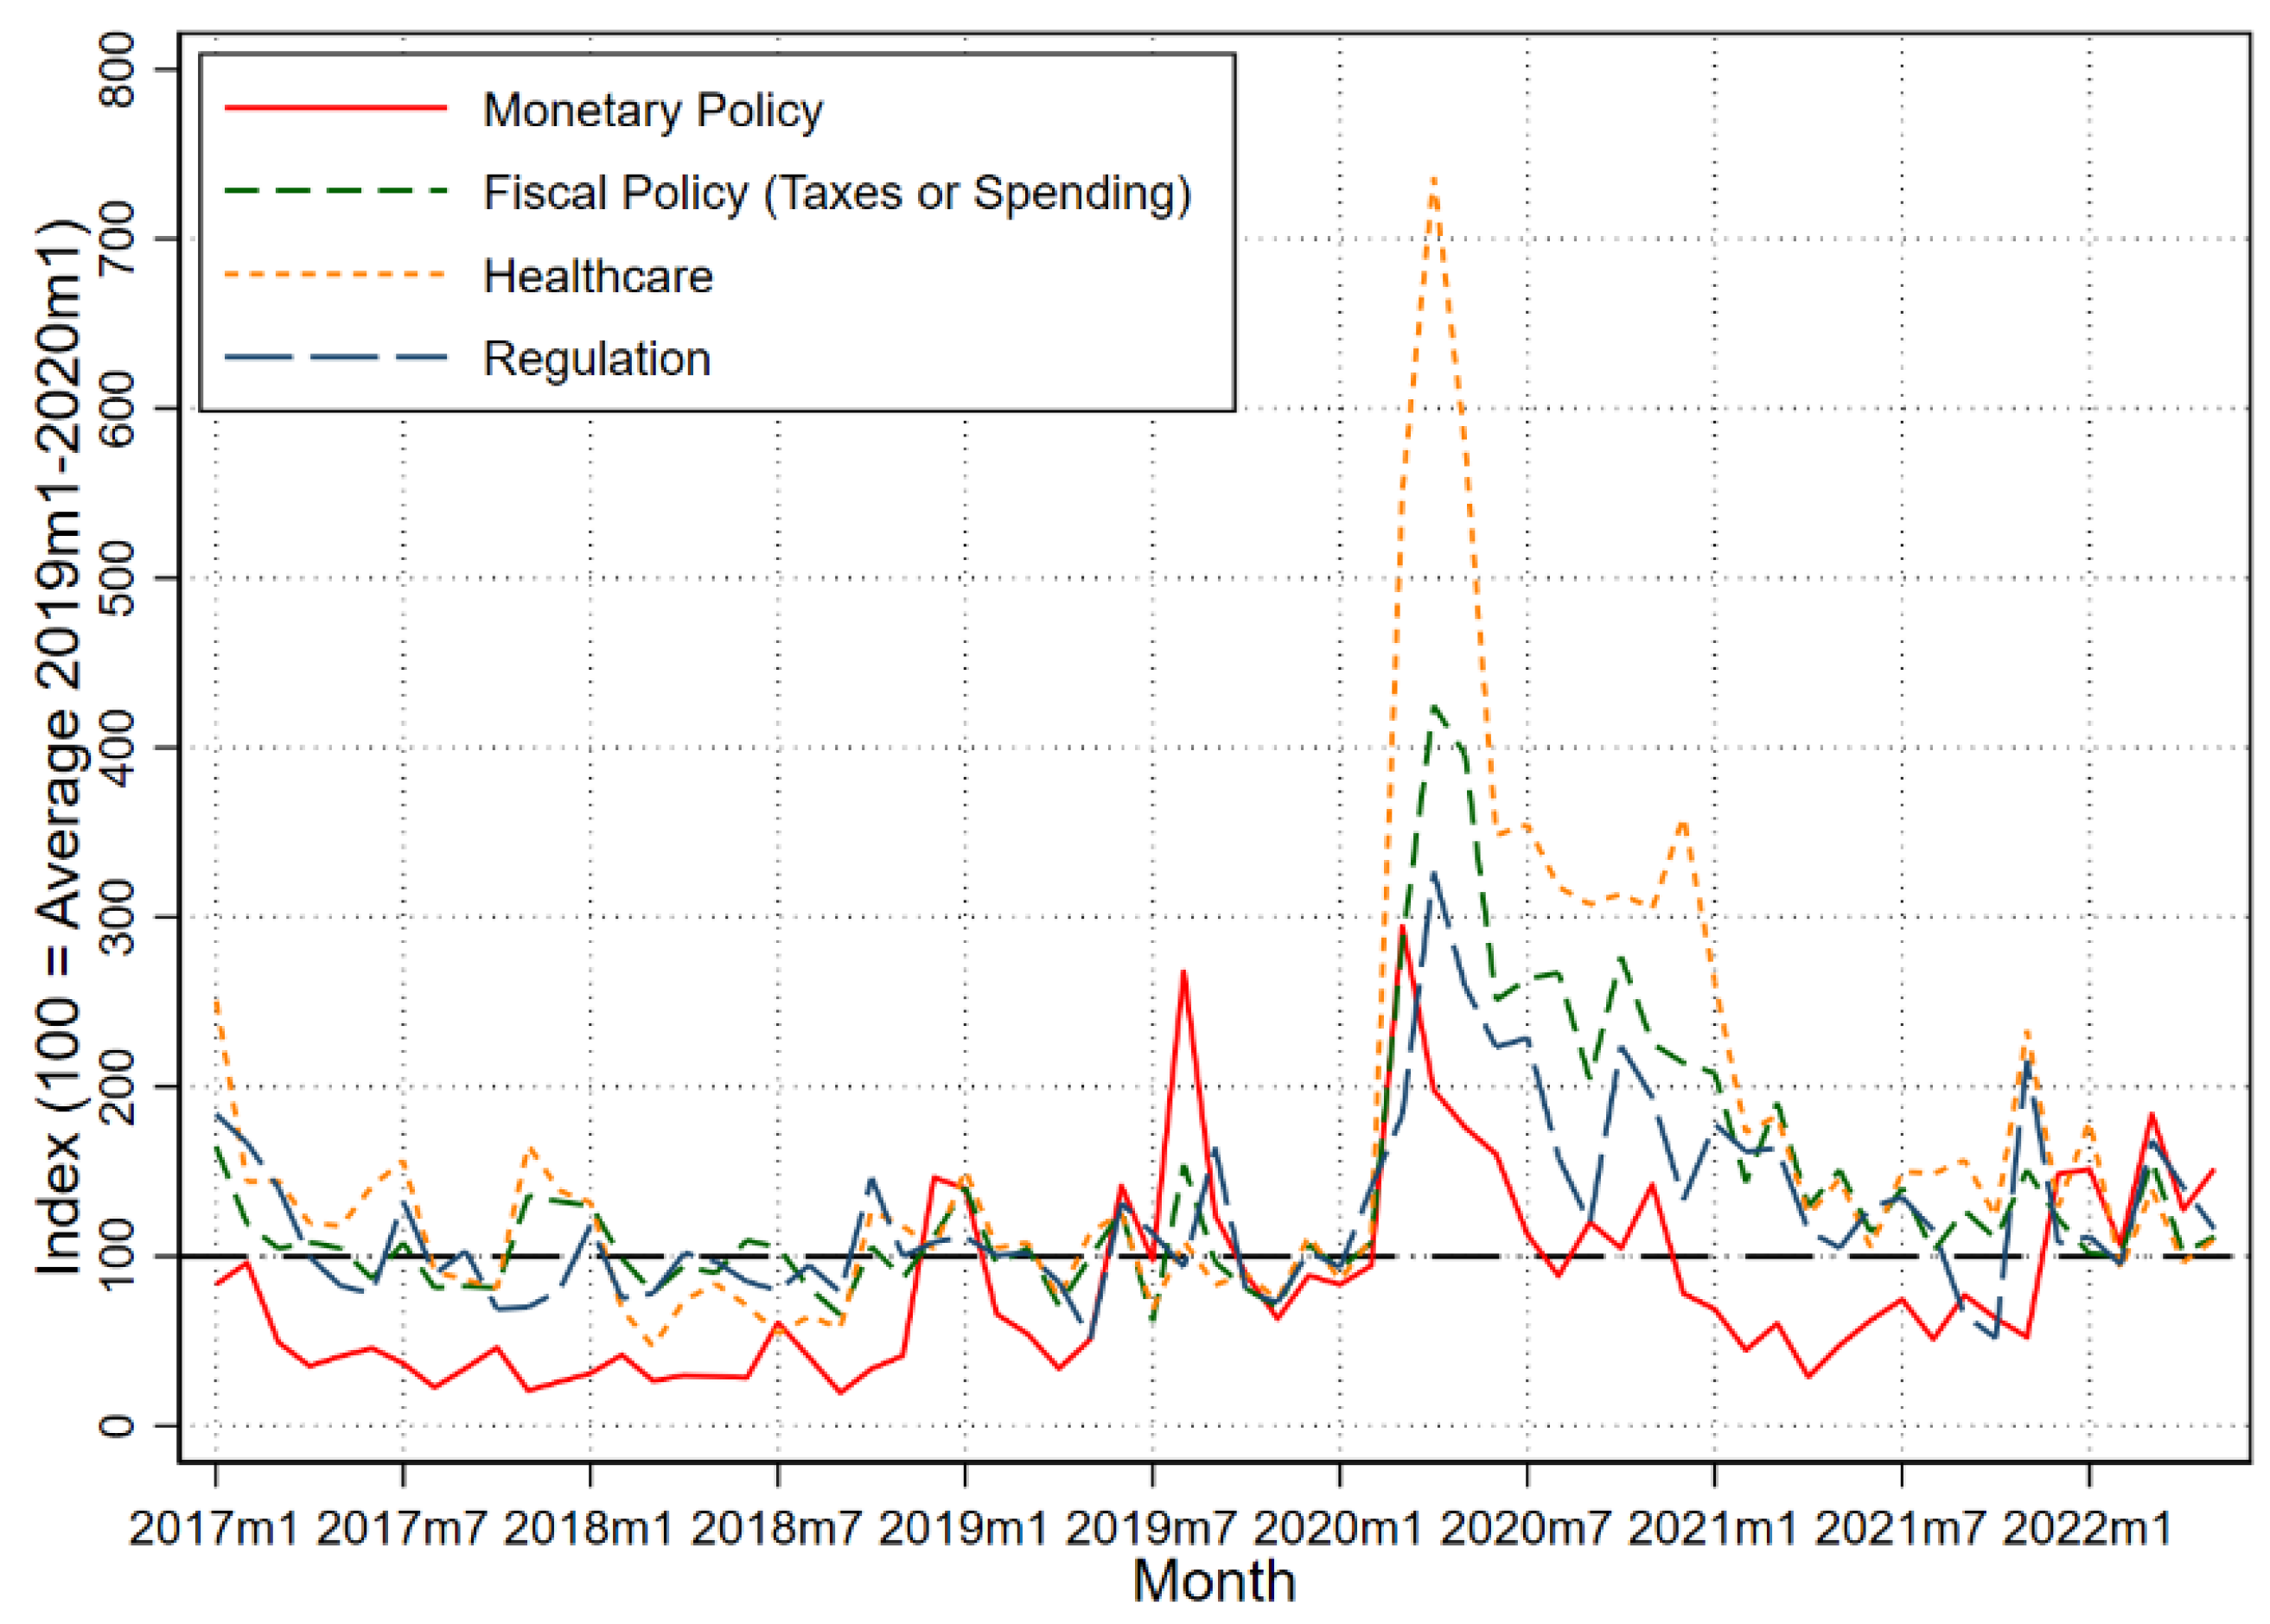
Figure 4 provides information about movements in particular sources of policy uncertainty. To construct the monetary policy uncertainty index, for example,
Baker et al. (
2016) start with articles that meet their EPU criteria and then identify the subset that also mentions monetary policy matters, as indicated by the presence of “fed funds rate”, “open market operations” and the like. Similarly, to develop an index of healthcare policy uncertainty, they identify newspaper articles that include mentions of “health care”, “FDA”, “Medicare” and the like in addition to their core EPU terms.
6 As
Figure 4 indicates, much of the initial EPU surge in reaction to the pandemic reflected concerns around healthcare and fiscal policy. This is no surprise, as actual and prospective healthcare and fiscal policy responses dominated much of the early media reporting on pandemic-related matters. The CARES Act, a major fiscal policy response to the pandemic and its economic fallout, was enacted near the end of March 2020. It attracted considerable media attention before and after its enactment. As the pandemic wore on, the newspaper-based measure of fiscal policy uncertainty gradually receded. The healthcare policy uncertainty index fell sharply after spring 2020 and again after U.S. government approval of vaccines against the virus in December 2020. There was also a large jump in monetary policy uncertainty at the outset of the pandemic, as the Federal Reserve acted to lower interest rates and support financial markets. After receding to pre-pandemic levels later in 2020 and the first half of 2021, monetary policy uncertainty rose again as inflationary pressures emerged and calls for a shift to tighter monetary policy grew in volume and intensity.
7 Although not shown here, the national security policy uncertainty index of
Baker et al. (
2016) rose very sharply from January to March 2022 in reaction to Russia’s invasion of Ukraine.
5. A Deeper Dive into the Firm-Level Forecast Distributions
One message from
Figure 2 and
Figure 3 is that uncertainty remains highly elevated as of early 2022 relative to pre-pandemic levels. What’s not revealed by these figures is that the firm-level forecast distributions that underlie the SBU-based measure of overall uncertainty shifted greatly after the early months of the pandemic. To develop this point,
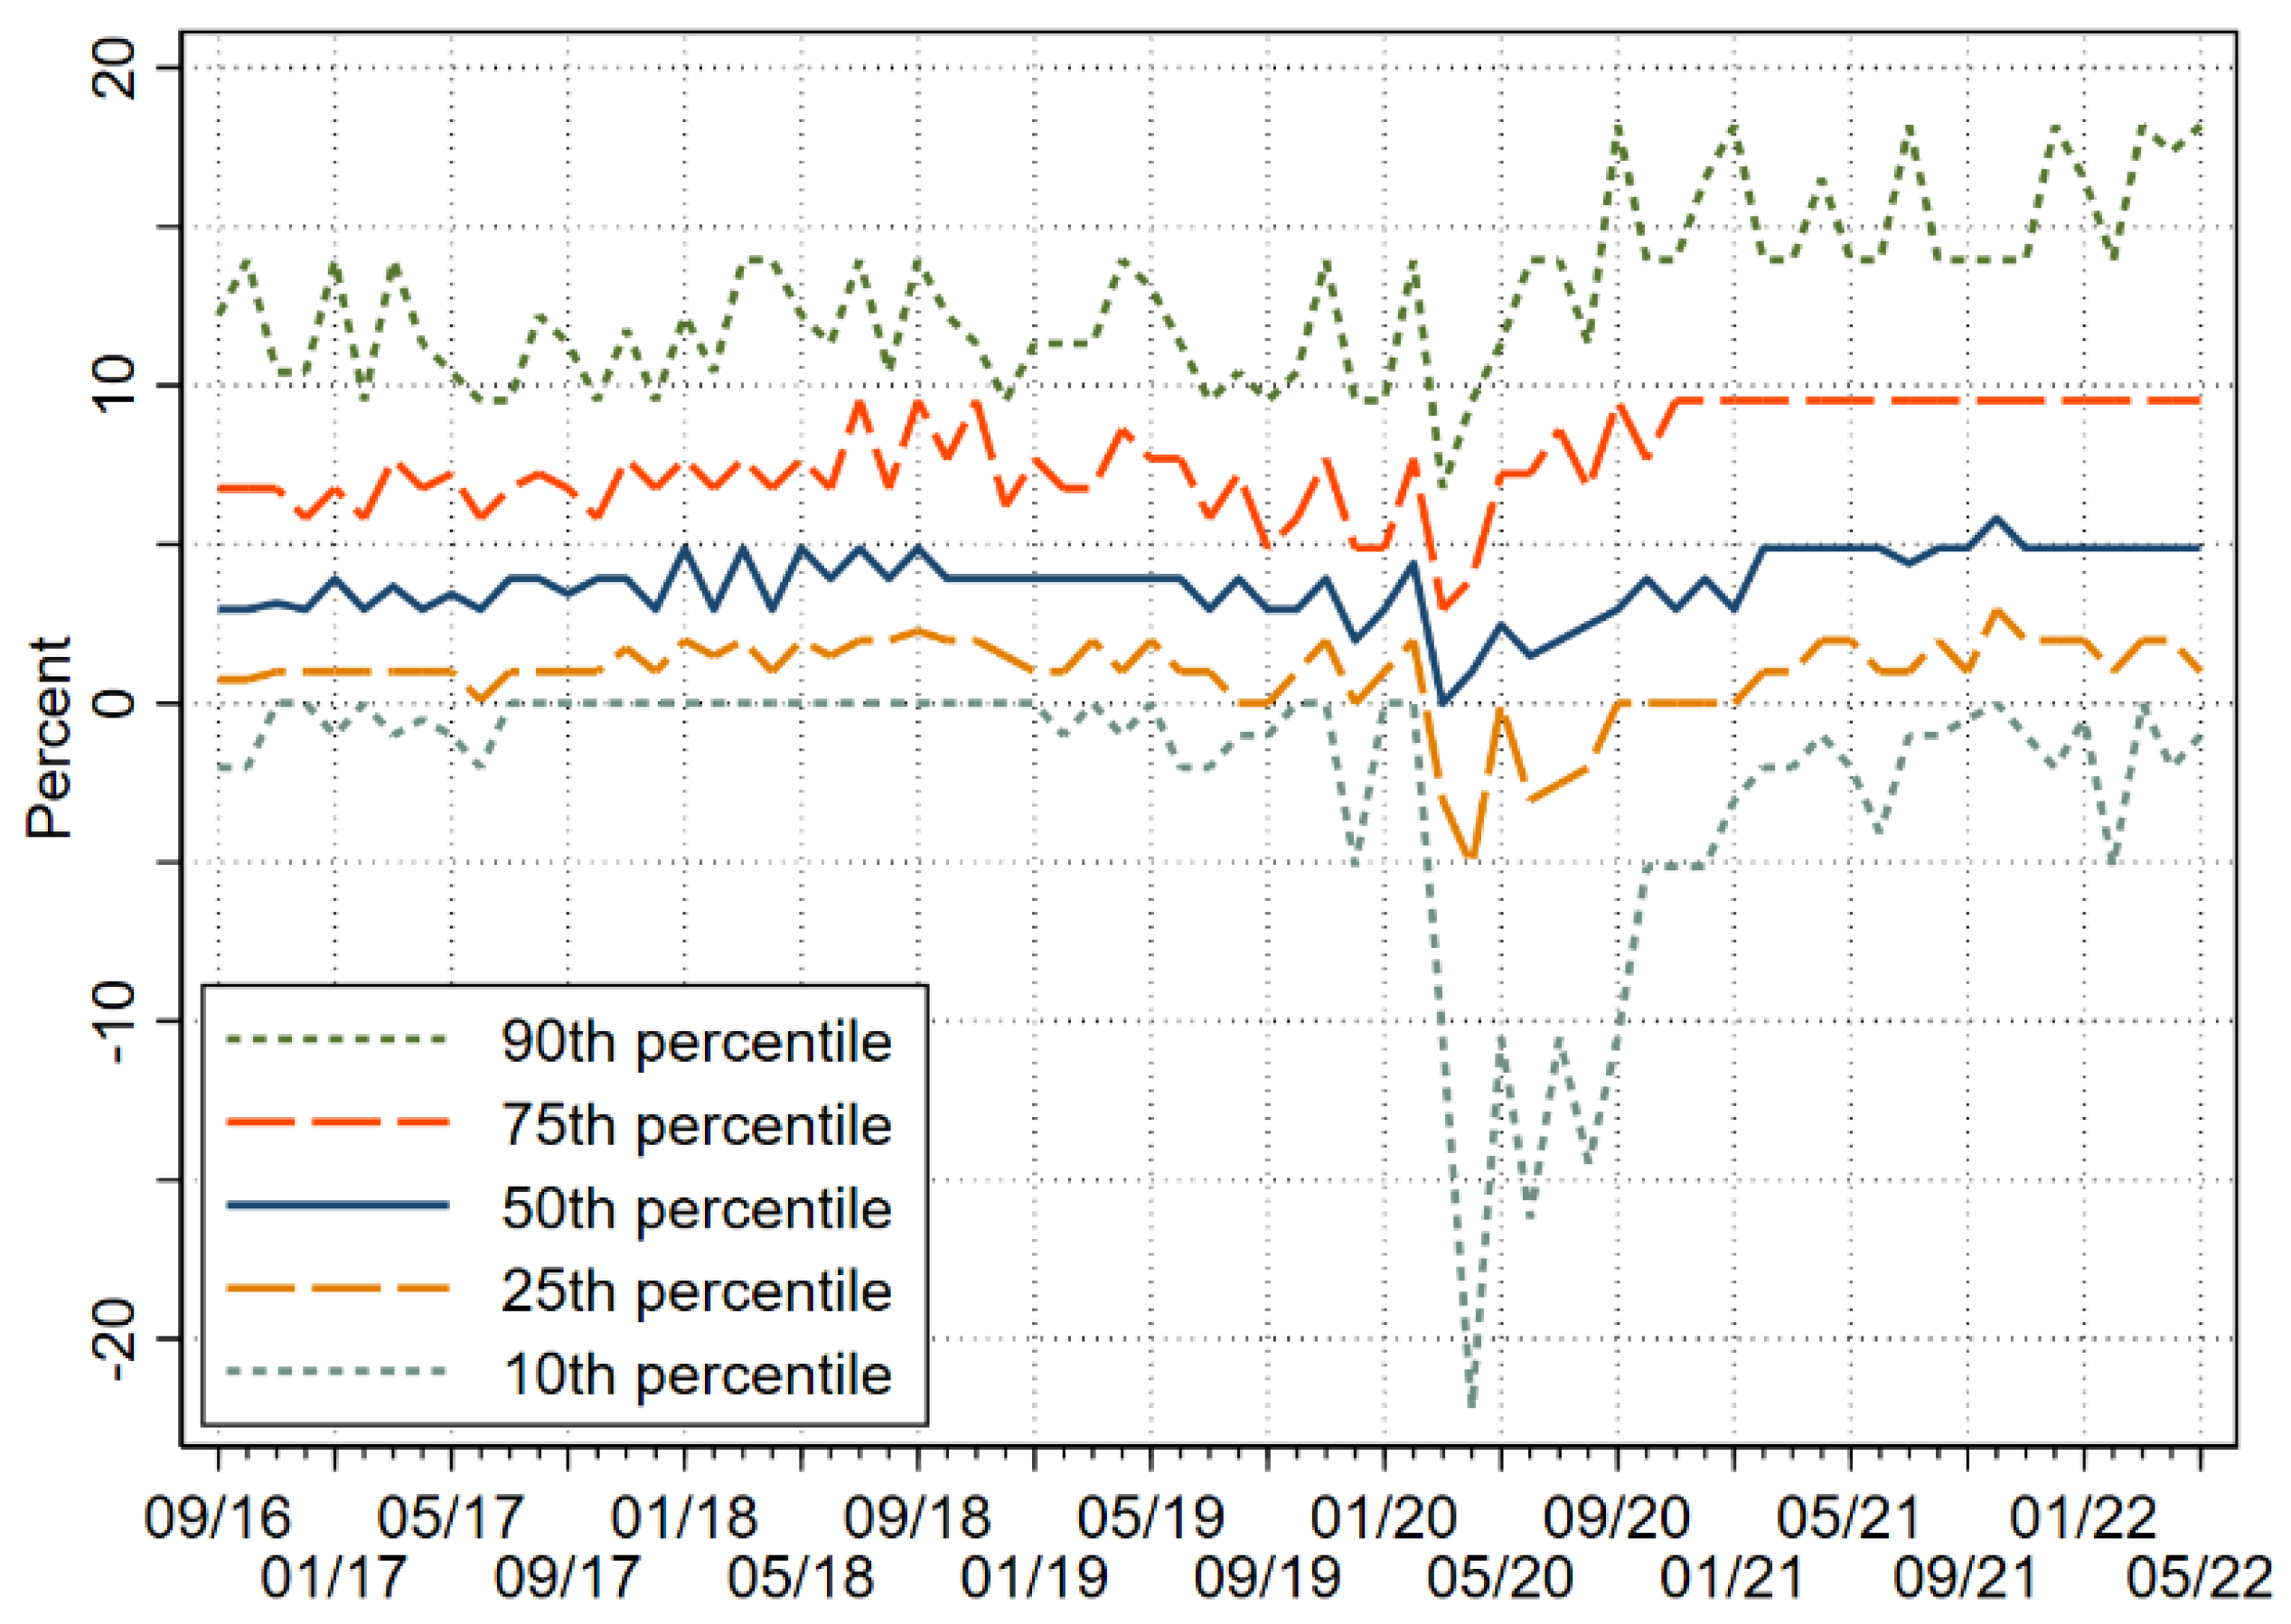
Figure 5 shows the evolution of the average firm-level subjective forecast distribution derived from the SBU, extending a chart first shown in
Barrero and Bloom (
2020). This figure plots selected percentiles of the distribution obtained by averaging the firm-level sales growth rate forecast distributions at each point in time. Recall that the underlying five-point firm-level forecast distributions are at a four-quarter look-ahead horizon. In computing the cross-firm average forecast distribution, we weight each firm in proportion to its activity level.
We highlight three aspects of
Figure 5. First, the median expected sales growth rate fell markedly at the outset of the pandemic but recovered in the second half of 2020 and now stands at the upper end of its typical pre-pandemic range. At first blush, that might seem like a return to normality, but it’s important to recognize that these growth rate projections are conditioned on contemporaneous activity levels at the time of the forecast. Because sales fell dramatically in the immediate wake of the pandemic, a return to pre-pandemic growth rate expectations implies a persistent downward shift in the expected future level of sales.
Second, the figure documents the not-so-shocking result that the lower tail of the subjective growth rate distribution became much more negative in the immediate wake of the pandemic. The 10th percentile of the average forecast distribution stood at or modestly below zero before the pandemic. It fell spectacularly to the range of −11 to −22 percent in the early months after the pandemic struck. In plain terms, the average firm foresaw a ten percent chance that its sales would fall by 11 percent or more over the next four quarters–a truly dire outcome, if realized. This measure of perceived downside risk abated greatly after August 2020, but the 10th percentile of the average forecast distribution remains negative as of May 2022.
Third,
Figure 5 also reveals that the average forecast distribution became more concentrated at high firm-level growth rates in the latter part of 2020. This observation can be seen in the sharply rising values of the 75th and 90th percentiles, which remain well above pre-pandemic levels through May 2022. Thus, perceived upside risk intensified after the spring and summer of 2020, even as perceived downside risk greatly ameliorated.
The percentile spread in
Figure 5 reflects both the dispersion across firms in their mean forecasts and the average firm-level subjective uncertainty summarized by the SBU-based measures in
Figure 1,
Figure 2 and
Figure 3. We can disentangle these two components of the overall spread in forecast outcomes by applying a between-within variance decomposition. Specifically, write the overall activity-weighted variance of the sales growth rate forecast distributions in the data pooled over firms for a given month as
where
is the activity share of firm
i,
is the subjective probability that firm
i places on the forecast outcome
is the mean of the forecast outcomes for firm
i, and
is the activity-weighted mean over firms of the
values. In words, Equation (1) says that the weighted variance of the overall forecast distribution outcomes equals the sum of the activity-weighted average within-firm variance of forecast outcomes plus the activity-weighted between-firm variance of firm-level mean forecasts.
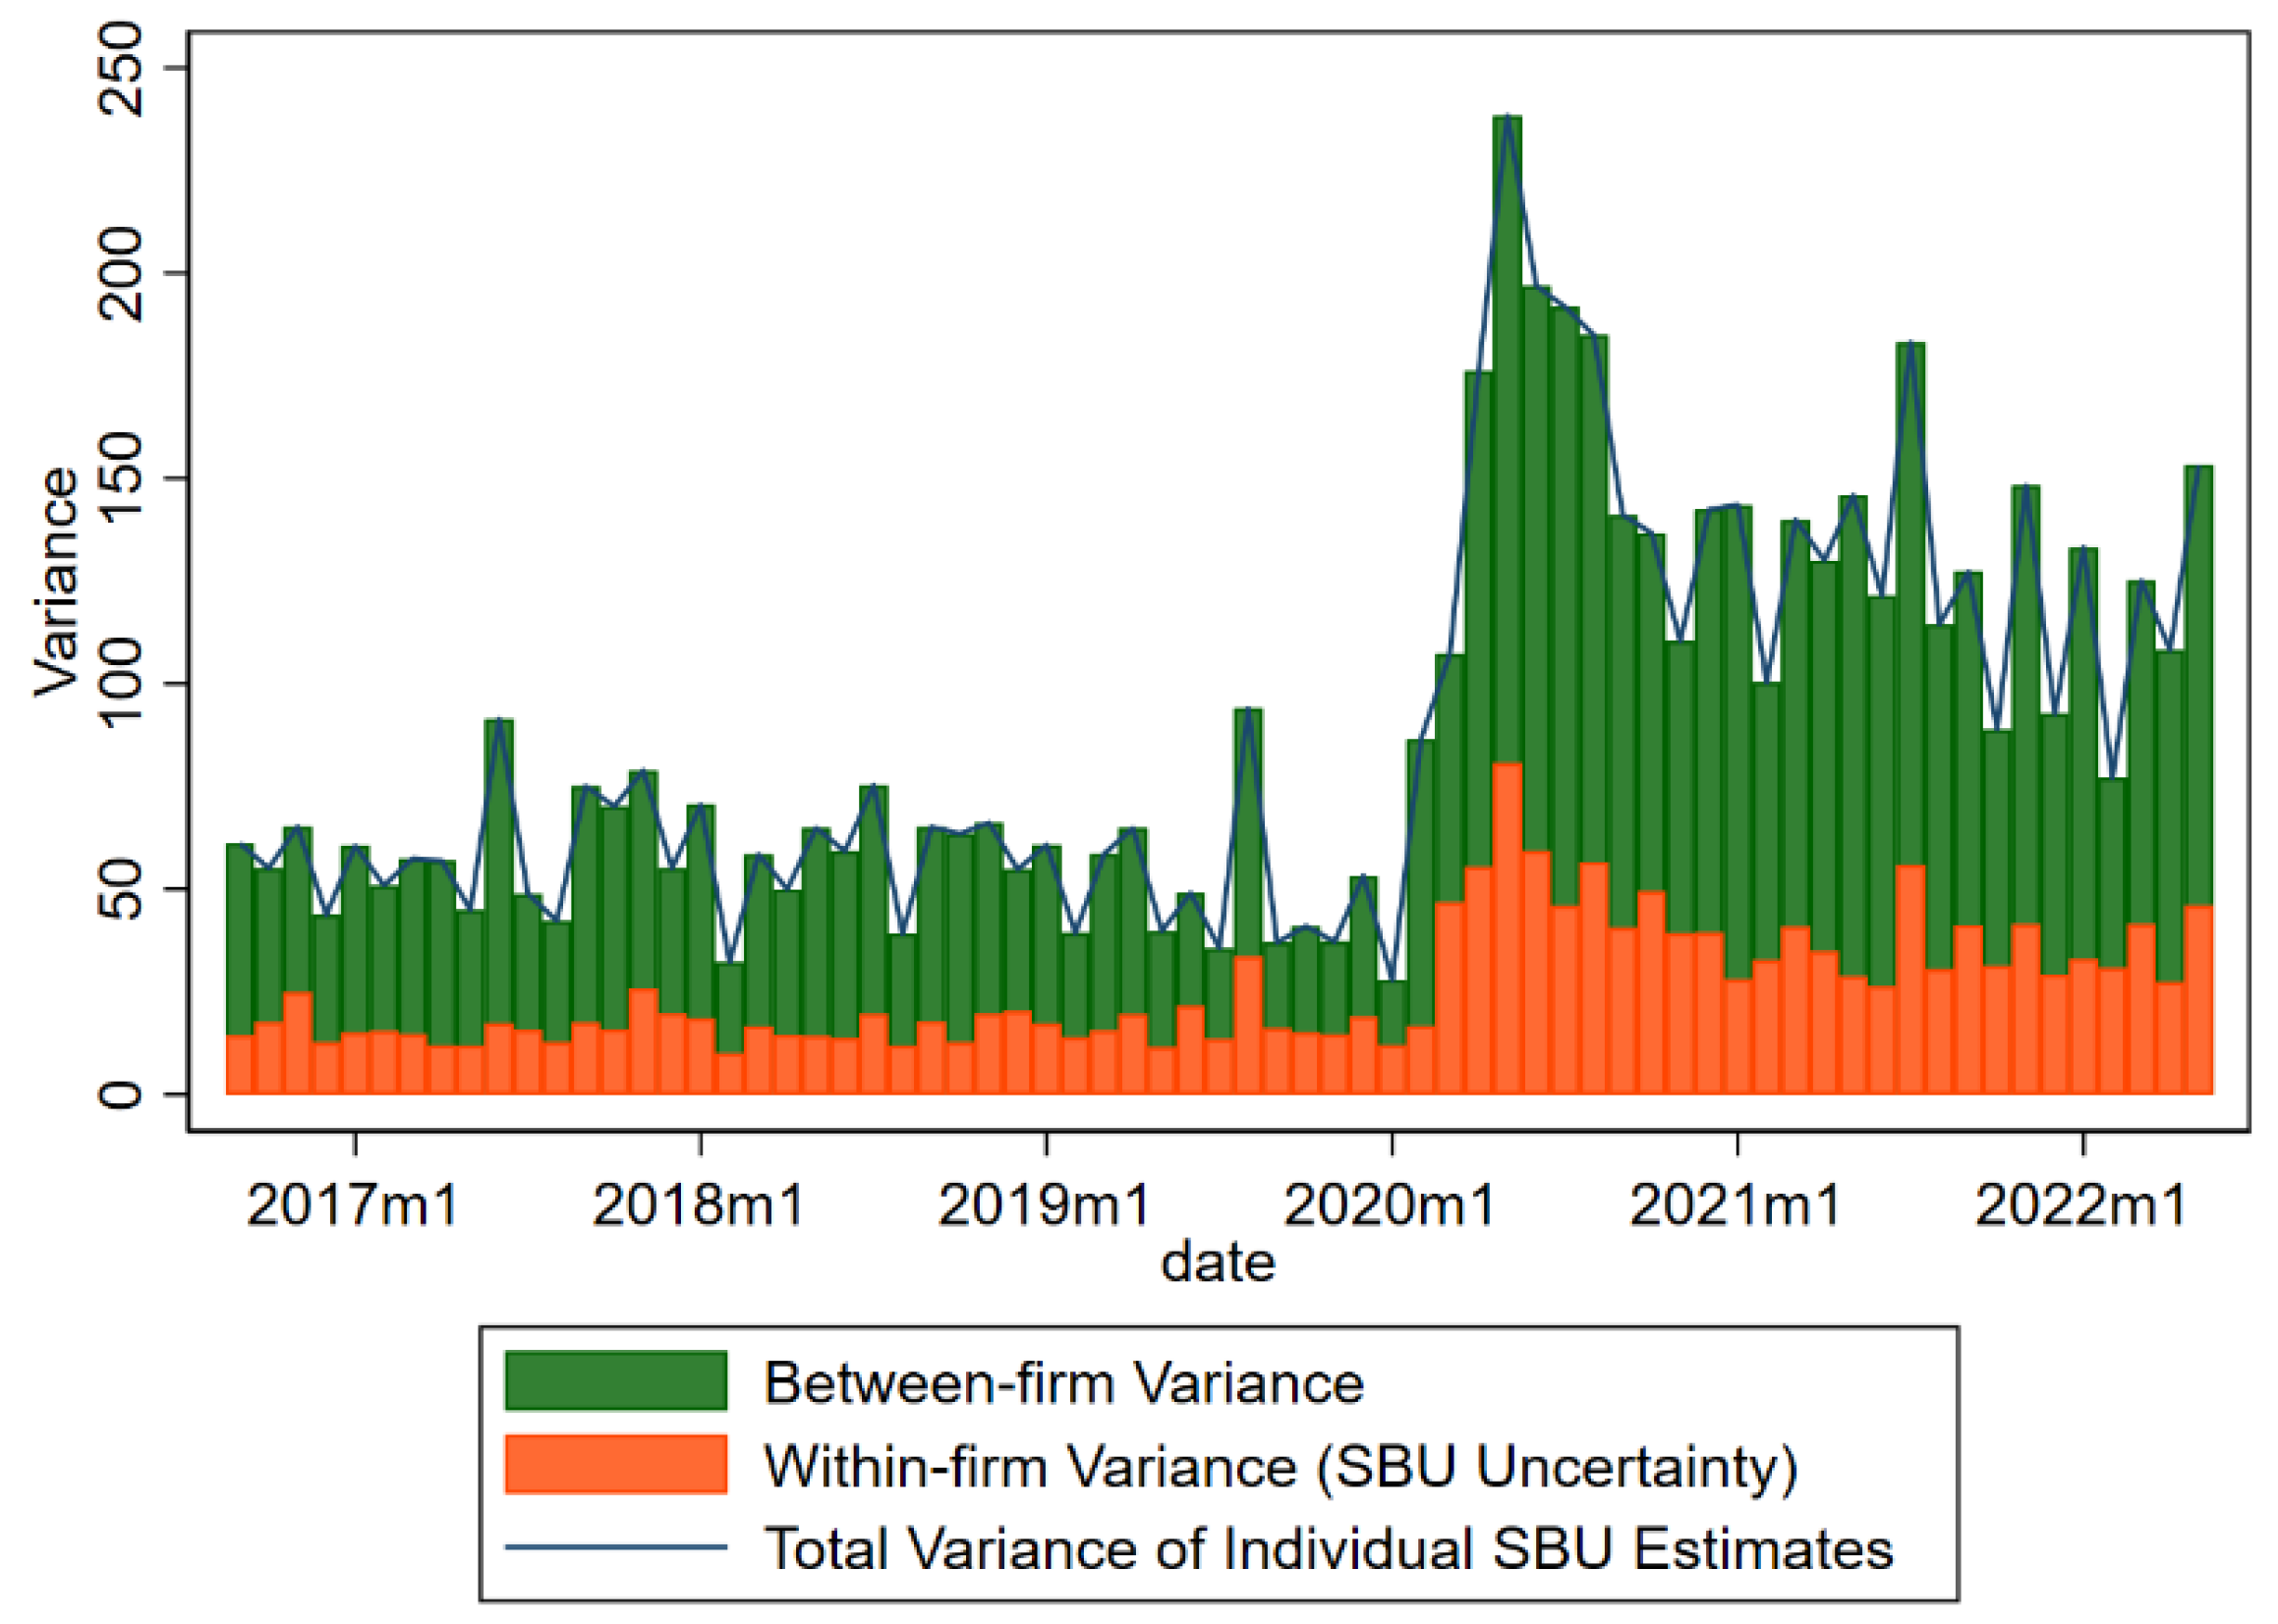
Figure 6 plots the left side of (1) and the two terms in its decomposition. As the figure shows, the between-firm dispersion of mean growth rate forecasts (green rectangles) and the average within-firm forecast variance spiked up in reaction to the pandemic. The between-firm component is typically larger in any given period, and it accounts for most of the sharp rise in the overall variance of forecast outcomes in spring 2020. This large role for the between-firm component is consistent with the view that the pandemic drove a strong wave of reallocation pressures in the economy, as discussed by
Barrero et al. (
2020). As also seen in
Figure 6, average firm-level uncertainty has stabilized since early 2021. In contrast, the between-firm variance in mean forecasts has continued an uneven decline, suggesting that the reallocation forces triggered by the pandemic are slowly working themselves out.
6. Whither Capital Expenditures?
Of particular interest for the economic outlook is the forward trajectory of capital investment, which influences future productivity, potential GDP, and living standards. A large literature analyzes how uncertainty affects the real option value of investments that are costly to reverse–prominent contributions include
Bernanke (
1983),
Brennan and Schwartz (
1985),
McDonald and Siegel (
1986),
Abel and Eberly (
1996), and
Dixit and Pindyck (
1994). According to these theories, a temporary increase in uncertainty raises the option value of investment delays. Thus, these theories lead us to anticipate that the pandemic-fueled surge in uncertainty will lead firms to hold off on investments in factories, office space, and other structures and to reduce investments in specialized equipment and software.
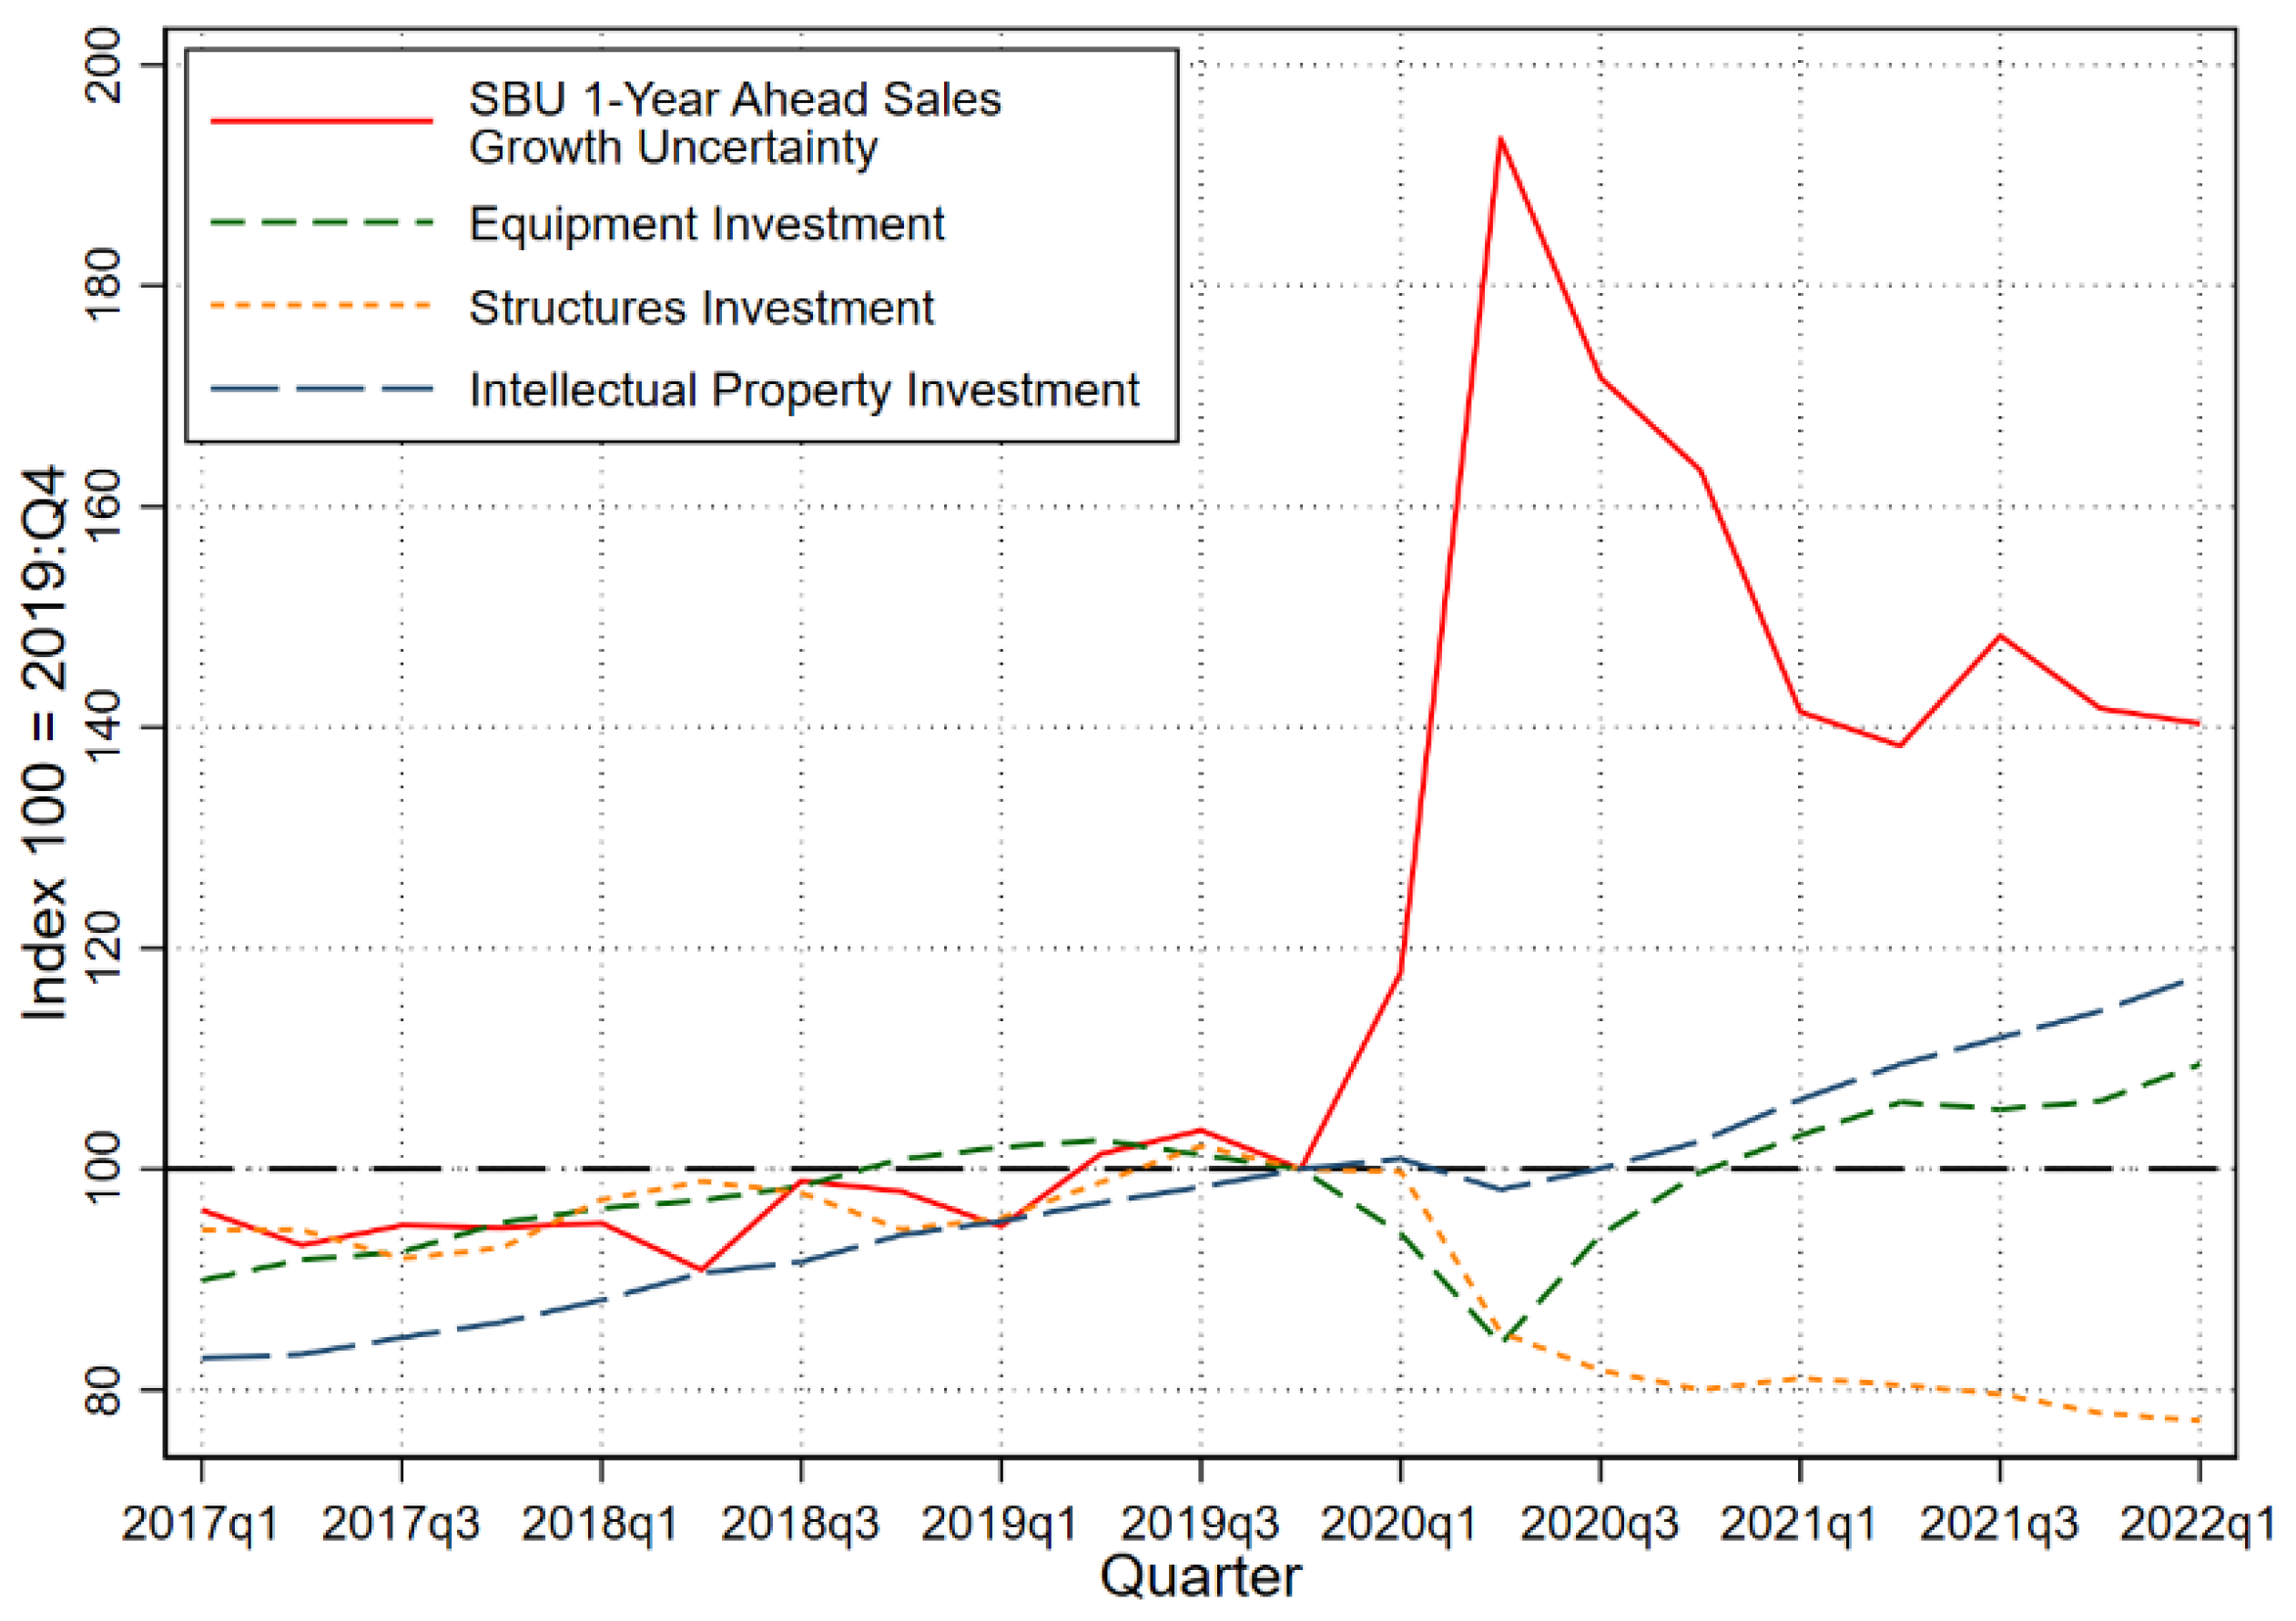
Indeed, real business investment fell at an annualized clip of 8.1 percent in 2020:Q1 and at a whopping 30.3 percent pace in 2020:Q2.
Figure 7 plots our SBU-based sales growth uncertainty measure alongside aggregate expenditures on various types of business investment, indexed to 100 in the fourth quarter of 2019. Each type of business fixed investment initially declined in reaction to the pandemic. Investment in structures continued to fall throughout 2020–2021, while equipment investment rebounded moderately, and intellectual property investments (which includes software and research & development) rose sharply, finishing 2021 roughly 15 percent above its pre-pandemic level.
To be clear, we are not suggesting that uncertainty alone drove these investment shortfalls. First-moment effects were clearly in play, as were other pandemic-related developments. For example, the big shift to working from home has depressed the demand for office space and contributed to falling investment in structures (
Altig et al. 2020b;
Ramani and Bloom 2021). The pandemic also led to higher utilization rates for business purposes of equipment and structures in the home sector (
Crouzet and Eberly 2021).
To help assess the causal impact of uncertainty on business investment, we fielded some special questions to business executives in various waves of the Survey of Business Uncertainty. One question reads, “From the list below, please rank up to three sources of uncertainty currently influencing your business decision making”. The options were “U.S./China trade, Supply chain, COVID-19, Social tensions, Impact of 2020 elections, Regulation, Fiscal Policy, Labor availability, Other”. COVID-19 emerged as the top concern by far, accounting for roughly half of the top concerns flagged by respondents. The November 2020 elections were another important concern: 18 percent of respondents identified the election as their top source of uncertainty in the October 2020 survey, 12 percent in the November 2020 survey (fielded from November 9–20), and 16 percent in December 2020.
8In the October 2020 SBU, we also queried participants about the impact of uncertainty on their planned capital expenditures. Specifically, we asked “Are the uncertainties you just identified causing your firm to alter its budget for capital expenditures for calendar years 2021 and 2022?” The response options were yes (increasing), yes (decreasing), and no. For those that said “yes”, we then asked: “By what percentage has the net budgeted dollar amount of your capital expenditures for calendar years 2021 and 2022 [increased/decreased] due to the uncertainties you identified above?”
Table 1 reports (sales-weighted) mean responses.
The survey-based estimate of uncertainty’s impact on capital expenditures in 2021 and 2022 is large and negative across sectors. After weighting by firm-level sales and then reweighting to match the one-digit industry distribution of private-sector gross output, firms anticipated a sizeable 14.1 percent decrease in capital investment plans in 2021 and 2022 due to their identified uncertainties.
We repeated this exercise in the March 2022 wave of the SBU (fielded from March 14–25), eliciting firms’ most pressing sources of uncertainty and following up with a question designed to gauge the causal impact of those uncertainties on capital expenditures (see
Table 2).
9 The results for the March 2022 survey wave differed markedly from those for October 2020. Firms’ top sources of uncertainty were much more diffuse in March 2022, with the highest share (27 percent) assigned to “inflation/cost pressures”. The next two highest sources of uncertainty—”labor availability” (23 percent) and “supply chain” concerns (18 percent)—were also facets of the economic situation tied to difficulties in meeting strong demand. The “Russia/Ukraine” conflict was the next highest ranked source of uncertainty, garnering 8 percent of top-ranked responses. While COVID-19 was the top-ranked concern in late 2020 by a very large margin, just 6 percent of firms still ranked it as their top concern in March 2022.
In response to the uncertainties firms identified in March 2022, their mean activity- and industry-weighted response was just −3.6 percent, much smaller than the impact of identified uncertainties back in October 2020. These sources of uncertainty also led to an uneven response by industry. Firms in Construction, Real Estate, Mining, and Utilities anticipated that identified uncertainties would subtract roughly 7 percent from their capital spending budgets for 2022 and 2023, while Business Services firms saw a slight, but insignificant, decrease in capital spending (minus 0.9 percent).
The self-assessed causal impact of identified uncertainties weighed much more heavily on capital spending plans in late 2020 than in March 2022–or at any other time when we’ve asked about the impact of identified uncertainties on capital spending plans. In November 2019, for example, we found that uncertainty around “tariff hikes and trade policy tensions” led to a mere 1.2 percentage point negative impact on capital investment plans (
Altig et al. 2019).
According to the SBU data reported in
Figure 1, year-ahead sales growth uncertainty in March 2022 is only modestly lower than in October 2020 and is still well above pre-pandemic levels. So, why are the self-assessed effects of uncertainties on investment plans in March 2022 so much lower than in October 2020?
We see two reasons: First, mean sales growth rate expectations of 3.1 percent in October 2020 were depressed relative to a mean expectation of 5.9 percent in March 2022. Second, as highlighted by
Figure 5, firms perceived high downside risks in late 2020, a sharp contrast to their perceptions in early 2022. As of March 2022, the 10th percentile of the subjective distribution of future sales growth rates was zero percent. Tail risk had shifted sharply to the upside by early 2021, a pattern that continued to hold in early 2022.
As these observations illustrate, a high level of uncertainty does not always go hand in hand with low mean expectations about economic performance. Our March 2022 question about capital expenditure plans went to field against a backdrop of strong first-moment expectations and significant upside uncertainty about sales growth. While firms perceived high uncertainty in March 2022 relative to the pre-pandemic period, that uncertainty was dominated by elevated upside risk. Here, we see the value of eliciting information about the full distribution of forecasted outcomes in a flexible manner, one that allows for the distinction between upside and downside uncertainty. Our survey results on capital expenditure plans suggest that the underlying shape of firm-level forecast distributions matters for investment decisions.
7. Discussion and Concluding Remarks
Uncertainty is a central feature of the environment facing business decision makers. Of the five key points we make in the article, the first stands out as particularly important given the oft-used refrain of “Main Street” vs. “Wall Street”. When we align look-ahead horizons, we find that Main Street uncertainty indicators from the Survey of Business Uncertainty moved similarly to Wall Street uncertainty indicators (one-year VIX) in reaction to the onset of the COVID-19 pandemic and over the ensuing two years. Both types of measures say that uncertainty remains quite elevated as of May 2022, even though it has fallen greatly since the spring of 2020.
We also find that the 1-month VIX, the TEPU, and macro forecaster disagreement all rose sharply at the onset of the pandemic, yet retrenched much more rapidly than either the business-level uncertainty measure or the 1-year VIX. The categorical EPU indexes offer insight into the changing mix of developments and concerns that drove uncertainty to high levels—from healthcare matters in the early stages of the pandemic to regulatory and fiscal policy matters to monetary policy and national security matters by early 2022.
By exploiting the flexible characterization of firm-level forecast distributions in the SBU, we further show that the nature of the uncertainty perceived by businesses has shifted profoundly since the early weeks of the pandemic: Downside risk has diminished greatly, and upside risk has expanded sharply. As uncertainties shifted from the downside to the upside, the negative effects of uncertainty on business investment also fell greatly according to our survey evidence. These and other results illustrate the value of business surveys such as the SBU that directly elicit own-firm forecast distributions and self-assessed effects of uncertainties on investment and other outcomes of interest.
There are large potential payoffs to the further development of surveys that elicit business-level expectations and to the analysis of the resulting data to deepen our understanding of business behavior. The SBU yields near real-time data on the expectations and uncertainties that business executives actually perceive as they make decisions about investment, hiring, and other matters. SBU data are available to policymakers and researchers within 5 to 20 days from the date each monthly survey goes to field. The SBU project also allows for fast modification of the survey instrument to insert timely, policy-relevant questions. While the advantages of the SBU and similar efforts are clear, there are sizable costs of building and maintaining the panel and constructing, testing, and fielding the survey each month. There is also a need to accumulate survey data over time to evaluate their reliability and properly interpret the most recent results.
We hope this paper and the SBU project inspire similar research efforts in the United States and other countries around the world.
Author Contributions
Conceptualization, B.M., E.M., D.A., S.J.D., J.M.B. and N.B.; methodology, B.M., E.M., D.A., S.J.D., J.M.B. and N.B.; writing—original draft preparation, B.M., D.A., E.M. and S.J.D.; writing—review and editing, B.M., E.M., D.A., S.J.D., J.M.B. and N.B.; visualizations, E.M. All authors have read and agreed to the published version of the manuscript.
Funding
This research received no external funding.
Institutional Review Board Statement
Not applicable.
Informed Consent Statement
Informed consent was obtained from all survey respondents involved in the study.
Data Availability Statement
Acknowledgments
We are very grateful to Nicholas Parker and Kevin Foster for excellent survey direction and question design. We also thank the Federal Reserve Bank of Atlanta, the Alfred P. Sloan Foundation and the University of Chicago Booth School of Business for financial support.
Conflicts of Interest
The authors declare no conflict of interest.
Disclaimer
Any opinions and conclusions expressed herein are those of the authors and do not necessarily represent the views of the Federal Reserve Bank of Atlanta. All results have been reviewed to ensure that no confidential information was disclosed.
Notes
| 1 | Baker et al. ( 2020) calculate realized volatility of daily stock market returns, taking the series back to before the Great Depression. Using these calculations, the volatility we saw early in the COVID-19 pandemic ranks third among the top 5 most volatile episodes of market volatility since 1929. |
| 2 | In contrast, the daily EPU index draws on an unbalanced panel and is subject to changes in newspaper coverage. |
| 3 | We use disagreement in nominal GDP growth rates, because it is the closest aggregate counterpart to the firm-level sales growth rate forecasts that we elicit in the Survey of Business Uncertainty. |
| 4 | The DMP was launched subsequent to the June 2016 Brexit referendum. Though the SBU has been conducted in some form since 2014, a methodologically consistent series also post-dates Brexit. |
| 5 | Nominal GDP forecasts aligns more closely with our SBU sales forecasts than real GDP forecasts. |
| 6 | |
| 7 | |
| 8 | Which party would control the U.S. Senate remained unclear in December 2020, pending the January 2021 senatorial runoff election in Georgia. |
| 9 | The sources of uncertainty question was posed as follows: “From the list below, please select up to three sources of uncertainty that have the potential to affect your firm’s decision making. Rank the sources of uncertainty from 1 to 3, with “1” being the most important”. In March 2022, the response options were “inflation/cost pressures”, “labor availability”, “supply chains”, “Russia/Ukraine conflict”, “regulation”, “COVID-19”, “monetary policy”, and “fiscal policy”. |
References
- Abel, Andrew, and Janice Eberly. 1996. Optimal Investment with Costly Reversibility. Review of Economic Studies 63: 581–93. [Google Scholar] [CrossRef] [Green Version]
- Altig, David, Jose Marie Barrero, Nicholas Bloom, Steven J. Davis, Brent Meyer, and Nicholas Parker. 2020a. Surveying Business Uncertainty. Journal of Econometrics, in press. [Google Scholar]
- Altig, David, Jose Marie Barrero, Nicholas Bloom, Steven J. Davis, Brent Meyer, and Nicholas Parker. 2020b. COVID Won’t Kill Demand for Office Space. Macroblog, July 10. [Google Scholar]
- Altig, David, Jose Maria Barrero, Nicholas Bloom, Steven J. Davis, Brent Meyer, Emil Mihaylov, and Nicholas Parker. 2019. New Evidence Points to Mounting Trade Policy Effects on U.S. Business Activity. Macroblog, November 1. [Google Scholar]
- Altig, David, Scott Baker, Jose Maria Barrero, Nicholas Bloom, Philip Bunn, Scarlet Chen, Steven J. Davis, Julia Leather, Brent Meyer, Emil Mihaylov, and et al. 2020c. Economic uncertainty before and during the COVID-19 pandemic. Journal of Public Economics 191: 104274. [Google Scholar] [CrossRef] [PubMed]
- Apedo-Amah, Marie Christine, Besart Avdiu, Xavier Cirera, Marcio Cruz, Elwyn Davies, Arti Grover, Leonardo Iacovone, Umut Kilinic, Denis Medvedev, Franklin Okechukwu Maduko, and et al. 2020. Unmasking the Impact of Covid-19 on Businesses. Firm Evidence from Across the World. Working Paper. Washington, DC: World Bank. [Google Scholar]
- Baker, Scott, Nicholas Bloom, and Steven J. Davis. 2016. Measuring Economic Policy Uncertainty. The Quarterly Journal of Economics 131: 1593–636. [Google Scholar] [CrossRef]
- Baker, Scott, Nicholas Bloom, Steven J. Davis, and Thomas Renault. 2021. Twitter-Derived Measures of Economic Uncertainty. Available online: PolicyUncertainty.com (accessed on 15 June 2022).
- Baker, Scott, Nicholas Bloom, Steven J. Davis, Kyle Kost, Macro Sammon, and Tasaneeya Viratyosin. 2020. The Unprecedented Stock Market Reaction to COVID-19. Covid Economics: Vetted and Real-Time Papers. London: Center for Economic Policy Research, vol. 1, April 3. [Google Scholar]
- Barrero, Jose Maria, and Nicholas Bloom. 2020. Economic Uncertainty and the Recovery. In 2020 Economic Symposium. Kansas City: Federal Reserve Bank of Kansas City. [Google Scholar]
- Barrero, Jose Maria, Nicholas Bloom, and Steven J. Davis. 2020. COVID-19 Is Also a Reallocation Shock. Brookings Papers on Economic Activity. Washington, DC: Brookings Institution Press. [Google Scholar]
- Bernanke, Ben. 1983. Irreversibility, Uncertainty, and Cyclical Investment. Quarterly Journal of Economics 98: 85–106. [Google Scholar] [CrossRef]
- Bloom, Nicholas, Philip Bunn, Paul Mizen, Pawel Smietanka, Greg Thwaites, and Gary Young. 2017. Tracking the views of British Businesses: Evidence from the Decision Maker Panel. London: Quarterly Bulletin, Bank of England. [Google Scholar]
- Bloom, Nicholas, Steven J. Davis, Lucia Foster, Brian Lucking, Scott Ohlmacher, and Itay Saporta-Eckstein. 2020. Business-Level Expectations and Uncertainty. NBER Working Paper No. w28259. Cambridge, MA: National Bureau of Economic Research. [Google Scholar]
- Brennan, Michael J., and Eduardo S. Schwartz. 1985. Evaluating Natural Resource Investments. Journal of Business 58: 135–57. [Google Scholar] [CrossRef] [Green Version]
- Buffington, Catherine, Lucia Foster, Ron Jarmin, and Scott Ohlmacher. 2017. The Management and Organizational Practices Survey (MOPS): An Overview; Washington, DC: U.S. Census Bureau.
- Crouzet, Nicolas, and Janice C. Eberly. 2021. Rents and Intangible Capital: A q+ Framework. NBER Working Paper No. w28988. Cambridge, MA: National Bureau of Economic Research. [Google Scholar]
- Dixit, Avinash, and Robert Pindyck. 1994. Investment Under Uncertainty. Princeton: Princeton University Press. [Google Scholar]
- Jurado, Kyle, Sydney Ludvigson, and Serena Ng. 2015. Measuring Uncertainty. American Economic Review 105: 1177–216. [Google Scholar] [CrossRef]
- McDonald, Robert, and Daniel Siegel. 1986. The Value of Waiting to Invest. Quarterly Journal of Economics 101: 707–27. [Google Scholar] [CrossRef]
- Ramani, Arjun, and Nicholas Bloom. 2021. The Donut Effect of COVID-19 on Cities. NBER Working Paper, No. w28876. Cambridge, MA: National Bureau of Economic Research. [Google Scholar]
- Rich, Robert, and Joseph Tracy. 2021. A Closer Look at the Behavior of Uncertainty and Disagreement: Micro Evidence from the Euro Area. Journal of Money, Credit, and Banking 53: 233–53. [Google Scholar] [CrossRef]
- Rietz, Thomas A. 1988. The Equity Risk Premium: A Solution. Journal of Monetary Economics 22: 117–31. [Google Scholar] [CrossRef]
Figure 1.
SBU (United States) and DMP (United Kingdom) uncertainty indexes. Note: SBU and DMP data through May 2022. Sources: US firm-level sales growth rate uncertainty from the Federal Reserve Bank of Atlanta’s Survey of Business Uncertainty (in partnership with Chicago Booth and Stanford University). UK firm-level sales growth rate uncertainty from the Bank of England’s Decision Makers Panel (in partnership with Nottingham University).
Figure 2.
Measures of uncertainty.Note: Data indexed to 100 from January 2019 through January 2020. Sources: (a) Federal Reserve Bank of Atlanta (SBU, data through May 2022); CBOE (1 mo VIX, 1 yr VIX data through May 2022); PolicyUncertainty.com (EPU and TEU; data through May 2022, accessed on 21 June 2022); (b) Federal Reserve Bank of Atlanta (SBU, data through May 2022); CBOE (1mo VIX, 1yr VIX data through May 2022); Federal Reserve Bank of Philadelphia (SPF, data through 2022Q2); PolicyUncertainty.com (EPU and TEU; data through May 2022, accessed on 21 June 2022).
Figure 3.
Uncertainty as the pandemic wore on.Note: These data have been rescaled to have the same pre-pandemic mean (January 2017–December 2019) and a peak index value of 100 at the onset of the pandemic. Sources: (a) Federal Reserve Bank of Atlanta (SBU, data through May 2022); CBOE (1 mo VIX, 1 yr VIX data through May 2022); PolicyUncertainty.com (EPU and TEU; data through May 2022, accessed on 21 June 2022); (b) Federal Reserve Bank of Atlanta (SBU, data through May 2022); CBOE (1 mo VIX, 1 yr VIX data through May 2022); Federal Reserve Bank of Philadelphia (SPF, data through 2022:Q2); PolicyUncertainty.com (EPU and TEU; data through May 2022, accessed on 21 June 2022).
Figure 4.
Categorical economic policy uncertainty. Note: Data indexed to 100 from January 2019 through January 2020. Source: PolicyUncertainty.com (EPU and TEU; data through May 2022, accessed on 15 June 2022).
Figure 4.
Categorical economic policy uncertainty. Note: Data indexed to 100 from January 2019 through January 2020. Source: PolicyUncertainty.com (EPU and TEU; data through May 2022, accessed on 15 June 2022).
Figure 5.
The average subjective forecast distribution for firm−level sales growth at a 1−year horizon. Notes: Calculated using monthly data through May 2022. This is a plot of the subjective distribution for the representative firm’s future sales growth rates over a 4-quarter look-ahead horizon. To calculate this distribution, we pool over all firm-level subjective forecast distributions in the indicated month and weight each firm by its activity level. Then, we use the probabilities assigned to each possible future sales growth rate to obtain activity-weighted quantiles of the future sales growth rate distribution. Source: Survey of Business Uncertainty conducted by the Federal Reserve Bank of Atlanta, Stanford University, and the University of Chicago Booth School of Business.
Figure 6.
A variance decomposition of the firm-level sales growth rate forecasts. Notes: Calculated using monthly samples of firm-level five-point forecast distributions for sales growth rates. The green rectangles report the activity-weighted between-firm variance of the four-quarter-ahead mean forecasts. The red rectangles report the activity-weighted average within-firm variance of the forecast distributions. The sum of these two components equals the overall variance of the forecasts in data pooled over all firms in a given month. See Equation (1) in the main text for an explicit statement of the variance decomposition. Data through May 2022. Source: Survey of Business Uncertainty conducted by the Federal Reserve Bank of Atlanta, Stanford University, and the University of Chicago Booth School of Business.
Figure 7.
Evolution of business uncertainty and business fixed investment during the pandemic.Notes: Business investment data are quarterly through 2021:Q4. SBU data are through 2022:Q1 (Mar 2022). Series indexed to 100 in 2019:Q4. Sources: Census Bureau, Bureau of Economic Analysis (BEA); Survey of Business Uncertainty conducted by the Federal Reserve Bank of Atlanta, Stanford University, and the University of Chicago Booth School of Business.
Table 1.
Changes in capital budgeting due to uncertainty: October 2020.
Table 1.
Changes in capital budgeting due to uncertainty: October 2020.
| Industry | N | Sales-Weighted Mean (Percent) | S.E. |
|---|
| Overall | 458 | −14.1 | 1.180 |
| Construction, Real Estate, Mining and Utilities | 56 | −17.2 | 2.870 |
| Manufacturing | 91 | −10.9 | 2.470 |
| Retail and Wholesale Trade | 84 | −14.7 | 2.520 |
| Business Services | 176 | −11.3 | 1.660 |
| Other Services | 51 | −18.3 | 5.100 |
Table 2.
Changes in capital budgeting due to uncertainty: March 2022.
Table 2.
Changes in capital budgeting due to uncertainty: March 2022.
| Industry | N | Sales-Weighted Mean (Percent) | S.E. |
|---|
| Overall | 475 | −3.6 | 0.840 |
| Construction, Real Estate, Mining and Utilities | 72 | −7.4 | 2.320 |
| Manufacturing | 89 | −1.1 | 2.440 |
| Retail and Wholesale Trade | 81 | −1.4 | 2.610 |
| Business Services | 188 | −0.9 | 0.630 |
| Other Services | 45 | −8.2 | 2.290 |
| Publisher’s Note: MDPI stays neutral with regard to jurisdictional claims in published maps and institutional affiliations. |
© 2022 by the authors. Licensee MDPI, Basel, Switzerland. This article is an open access article distributed under the terms and conditions of the Creative Commons Attribution (CC BY) license (https://creativecommons.org/licenses/by/4.0/).


 ,
, 

