1. Introduction
Banking literature is rich with studies on prompt corrective action (PCA) undertaken by a regulator on banks to ensure financial stability. A bank coming under PCA faces operational restrictions, ranging from a mere distribution of dividends even to branch expansion. The regulator may take specific discretionary actions, such as limiting access or even renewal of wholesale or high-cost deposits, reduction of risky assets, reduction in loan concentration, and even, based on severity, seeking concrete plans for raising additional capital.
Research interests around PCA have their origin in 1991 with the implementation of the Federal Deposit Insurance Corporation (FDIC) Improvement Act (FDICIA). Studies revolved around bank recovery efforts (
Dahl and Spivey 1995;
Garcia 1995), revised solvency measures (
Jones and King 1995), depositor protection, insurance (
Brownbridge 2002;
Sumathy and Venkatachalam 2019;
Schich 2008;
Gulati 2020), and regulator forbearance, effectiveness (
Garcia 2010;
Kagade 2015). Extant research also suggests modifications in the PCA framework through continuous improvement in the regulatory capital ratios (
Jones and King 1995), inclusion of new tailored triggers, alternative, and additional triggers (
Svoronos 2018;
Cole and White 2017;
Council, Financial Stability Oversight 2011), and revamping prudential regulation (
Loveland 2016).
The Reserve Bank of India (RBI), India’s central bank, introduced PCA in December 2002 (
RBI 2002), making it applicable to all the scheduled commercial banks in India. The PCA framework answered the ad hoc process followed by the RBI for enforcing supervisory power. This framework enforced an organized approach with a definite timeline for resolution, either by the bank’s management or the RBI. Under the powers conferred under the Banking Regulation (BR) Act, 1934, the RBI proposed PCA regulation in March 2001 and invited comments from the banks. This structured early intervention, along with a resolution plan, served two purposes: (1) reducing the agency problem of the regulator, and (2) reducing the moral hazard behaviour of banks (
RBI 2001).
Under this framework of the RBI, weak banks are identified using three financial parameters linked to capital adequacy, asset quality, and profitability. PCA was over and above the other powers conferred to the RBI to protect the interests of the concerned bank or its depositors. The RBI reviewed this in June 2004, agreeing to continue the framework without any change. In April 2017, the RBI revised the framework by adopting stricter thresholds and adding two new financial parameters (
RBI 2017). During the period 2014–2019, 13 commercial banks faced PCA, most of which (eight banks) came under the RBI’s radar in 2017.
The study of PCA regulation seems contextual for many reasons, one being the effectiveness of the financial parameters in providing the early warning signals and possible simplification of the framework. While there are studies that deliberate on the effectiveness of the PCA framework across different markets, we believe studies on simplifying the framework are still scanty. Specifically, the PCA framework has seen extensive use since 2017 in India, with a revision in the framework in 2017 (
RBI 2017) and 2021 (
RBI 2021). This shows a continuous process of review behind the framework with the possibility for future improvements. The study may also be relevant to improving the different PCA framework under another regulator, which has existed since 2018 for Regional Rural Banks in India.
1In this paper, we delve deep into India’s PCA regulations on commercial banks, we examine firm-level data using the different financial measures, and we attempt to simplify the same. We did not find any research studies on simplifying financial parameters under India’s PCA regulations to the best of our knowledge. However,
Chernykh and Cole (
2015) attempted to find it in the past wherein they examined US bank failures using predictive powers of different capital adequacy measures.
The RBI implemented the PCA framework, with effect from December 2002,
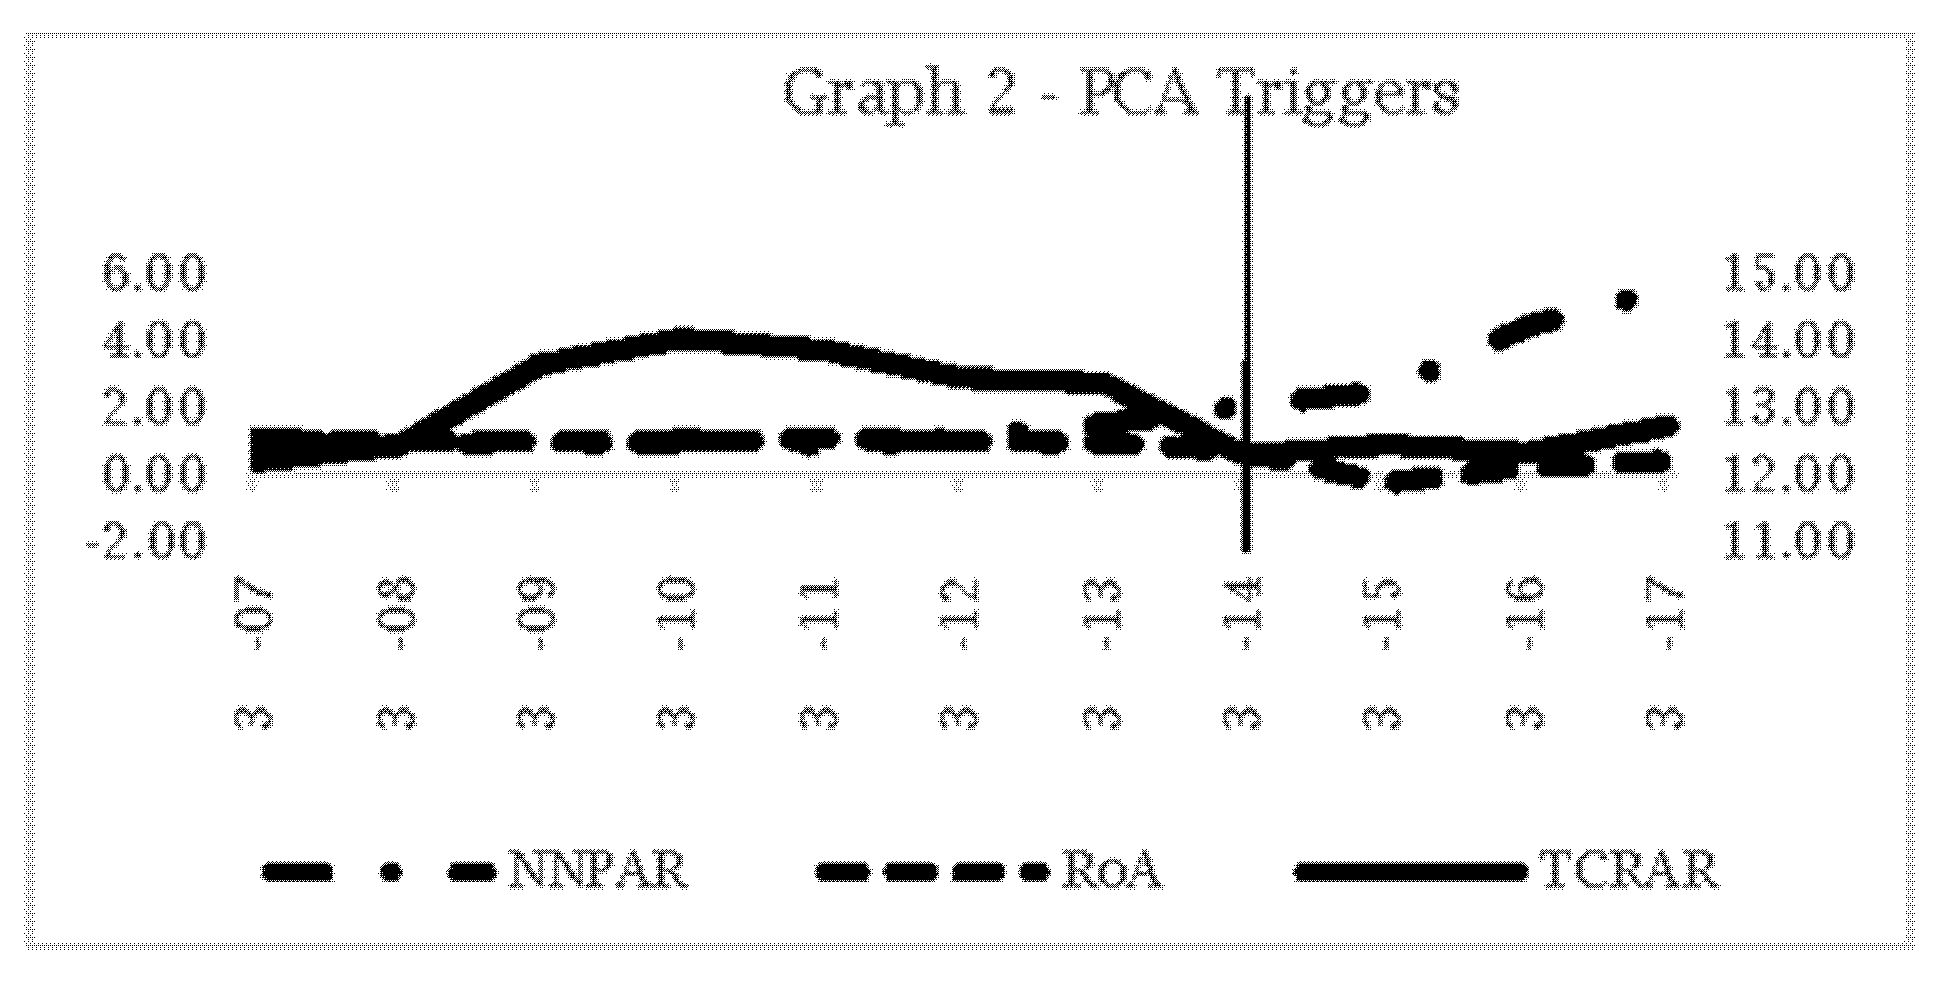
2 empowering the regulator to take mandatory and discretionary actions on weak banks. The discretionary actions were made common for all the thresholds. The financial parameters were: (1) total capital to risk-weighted asset ratio (TCRAR), (2) net non-performing asset ratio (NNPAR), and (3) return on assets (RoA). Any breach in the thresholds mentioned under each parameter could trigger PCA. The PCA can be activated when a bank’s CRAR and RoA fall below the minimum threshold or when NNPAR exceeds the minimum threshold.
Prior to PCA, the RBI exercised the remedial powers conferred under BR Act, 1934, during many failures of commercial banks in the 1990s and 2000s. These remedial actions were ad hoc, reactive, and devoid of any defined time limits for resolution. Specific provisions under the BR Act, 1934, already empowers the RBI to take corrective actions against the weaker banks through the “moratorium route”. Moratorium prevents further deterioration of the bank and helps in retaining the stability of the banking system. Once enforced, the moratorium restricts the bank from making any payment to the depositors or discharging any liabilities to other creditors. Thus, depositors face a severe crisis being barred from withdrawing their own money. To prevent such depositor runs, the RBI had three choices: (a) to secure the bank’s management, or (b) prepare a scheme for merger or reconstruction, or (c) to liquidate the bank. In most cases, a merger was the preferred route. Thus, there was a need for a proactive supervision structure with early warning signals. This was the premise leading to the launch of the PCA framework.
The RBI’s PCA framework did not change much for more than a decade post its introduction in December 2002, nor did any bank came under PCA in the first decade since its implementation. The maiden implementation of the PCA was seen in the case of the United Bank of India in 2014. Later in April 2017
3 the RBI revised the framework with two changes. These included two new financial parameters: (1) common equity tier-1 ratio (CET1R), (2) tier-1 leverage ratio (LR), and a change in the thresholds for the existing parameters (CRAR, NNPAR, and RoA). It was only post 2015, that the RBI took steps for strong enforcement of the PCA framework and by the end of December 2017, 11 banks had already come under the PCA fold.
Alongside the inclusion of new financial parameters in 2017, the RBI revised the thresholds of the existing parameters and fine-tuned the mandatory actions (progressively stricter) for the breach in each threshold (level 1, level 2, and level 3) across the parameters. The RBI took a conservative stance by increasing the minimum threshold for TCRAR to 10.25 per cent to accommodate for 1.25 per cent of the capital conservation buffer mandated under Annex 4 Basel-III Guidelines (as of 1 January 2017). However, the RoA trigger was relaxed from being less than 0.25 per cent every year to negative RoA for two/three/four consecutive years for the three threshold levels, respectively. Earlier, based on the 2002 notification, the minimum CRAR, and RoA were set at 9.0 per cent and 0.25 per cent, respectively. In 2017, the RBI was cautious on the rising NPA levels, and reset the NNPAR to 6.0 per cent from 10.0 per cent.
4 The RBI also detailed the mandatory and discretionary actions (see
Table A3) when a bank breaches the three thresholds of the financial indicators. While the discretionary actions are common for each threshold, the mandatory measures get stricter as the financial indicators transition from level one threshold to level two, and then to three.
A PCA trigger implies weakness in the health of a bank. The 13 banks, which came under PCA in India, either were merged with stronger banks or could continue operations only after equity infusion. As reflected by the shrinking deposit base, these banks faced a severe crisis. Deposit share of these 13 banks out of the total deposit base of private and public sector banks put together depleted from 29.0 per cent (2010) to 18.9 per cent (2020). This situation looks alarming, considering that during the same period, 2010–2020, the deposit base of private and public sector banks overall expanded by close to three times in actual, from INR 45,148,200 million to INR 132,074,630 million (see
Table A1). We can see here that depositors have shifted from weaker banks to other competing banks in the ecosystem.
The advent of PCA marked the adoption of the core principles for effective supervision. It defined the threshold breach and the mandatory and discretionary actions to be initiated to prevent further deterioration in the bank’s financial health. Inadequate capital exposes the depositors insured under the deposit guarantee scheme only to a specific limit. Resolution through a structured early intervention becomes necessary to protect partly insured depositors. Otherwise, the cost of paying the depositors would fall on the sovereign (
Acharya 2018), particularly in a country such as India, where Public Sector Banks (PSBs) have a significant market share. Therefore, the timely implementation of PCA on a weak bank was critical to the banking system’s stability.
2. The Setting of the Study
The motivation for this study came from the above findings and initial examination of the financial parameters (from 2002) for banks that came under PCA. We found evidence of a breach in the financial parameters such as RoA, much earlier than the date when the RBI took actual action for certain banks. This implies regulatory forbearance, in other words, delay in taking action by the RBI. For example, in the Central Bank of India (a scheduled commercial bank and PSB, not to be confused with the RBI, which is India’s central bank), the RoA was reported as negative 0.47 per cent for the year ended March 2014, breaching the minimum RoA of 0.25 per cent. The RBI brought the Central Bank of India under PCA only in June 2017. This examination reveals that the RBI may have focussed more on the capital adequacy (TCAR) and asset quality (NNPAR) parameters for initiating PCA. It is evident that many banks have already breached the profitability (RoA) parameter much earlier than the date when PCA was initiated. We also checked any influence of Government holding that influenced the delay in the RBI’s action. However, we did not find any significant proof that can indicate the delay resulting from Government holding. This points toward the fact that the RBI used the PCA framework not to govern banks’ profitability but instead waited until there were concerns about non-performing assets (asset quality) and capital adequacy (solvency).
The changes made in PCA during 2017 create a setting for a critical examination of the effectiveness of these parameters. Thus, it provides an opportunity to study the PCA regulations in detail, the promptness and extent of their use, and the effectiveness of the financial parameters used. We aim to provide a comprehensive study of the PCA framework and debate the opportunities to fine-tune the parameters for simplicity of execution. Our study makes two significant contributions to the literature on “prompt corrective action” on banks. First, we contribute to the literature on regulatory forbearance in the Indian banking context by studying the ex-post PCA banks. We aim to check if early breach detection was possible by the RBI. Our evidence points to a delay in the RBI’s action on multiple occasions as at least one of the financial triggers breached the threshold earlier than the actual date. Thus, evidence of regulatory forbearance surfaces about the banks under PCA review (
Table A4).
Second, this paper explores new financial variables that can act as leading indicators that signal banks’ weakening health. This study follows
Chernykh and Cole (
2015) towards offering “a simple, timely, yet robust measure” of solvency in the RBI’s PCA framework. We start with leading indicators that could help the RBI to slow the deterioration of such banks and enforce resolutions to protect depositors. We analyse the dataset of 38 banks using a discriminant analysis model. We use PCA initiated or not as a response variable. The model incorporates new banking parameters: (1) provision coverage ratio (PCR), (2) credit to deposit ratio (CDR), (3) contingent liabilities to net worth ratio (CLNW), (4) lending to sensitive sector ratio (LSSR), (5) current account and savings account ratio (CASA), (6) coverage ratio (CR), (7) percentage of total advances to 20 largest borrowers (T20B), and (8) percentage total deposits to 20 largest depositors (T20D). Out of these variables, our results show significance in two new variables, (1) CR, and (2) CDR, which can identify weaker banks.
We argue that including these new ratios can strengthen the PCA framework for weaker bank identification. On a stand-alone basis, the current ratios (TCRAR, NNPAR, RoA, CET1, and LR) and the new ratios (CDR, CR) show an overall classification accuracy of 86.8 per cent and 78.9 per cent, respectively. However, classification accuracy is the same for PCA banks at 84.6 per cent under both models. Further, our regression model using CR and CDR as explanatory variables could predict a 70.3 per cent variation in annualised stock returns. The regression model shows the positive association of CR and CDR with stock returns. PCA triggers fear among investors, sparking declining financial health and possible depositor runs; thus, better CR assures higher loss-absorption power of a bank and, hence, more stability. While higher CDR reflects ambitious credit expansion, stock returns behave in sync. This paper finds the prospect of new financial parameters that can bring simplicity without diluting effectiveness in the PCA framework. We strengthen our claim with a model built on bank-level data and a robustness check using stock returns.
Given this background, the remainder of the paper proceeds as follows:
Section 3 covers the literature review,
Section 4 describes the data sources used for analysis,
Section 5 contains the research methodology, and
Section 6 presents the results with the evaluation. We conclude the paper in
Section 7 with a summary of the findings, the limitations of the study, and future scope.
3. Literature Review
PCA framework derives its foundation from the principles of effective banking supervision introduced by the Basel Committee on Banking Supervision (the ‘Committee’) in September 1997. The Committee came up with 25 core principles intending to improve the financial system’s strength and serve as an essential reference for all the banking regulators across countries. These core principles cover seven themes: (1) preconditions for effective banking supervision, (2) licensing and structure, (3) prudential regulations and requirements, (4) methods of ongoing banking supervision, (5) information requirements, (6) formal powers of supervisors, and (7) cross-border banking.
Principle 22 of the core principles in the 1997 draft of the Committee addresses the banking regulator’s formal powers and stresses bringing timely corrective actions when banks fail to meet prudential requirements. Principle 22 details the conditions of having adequate supervisory measures when regulatory violations or depositors’ money are being threatened. These measures could be: (1) corrective, or (2) protective in nature to pre-empt any deterioration in the soundness of the bank and eventually restore the financial health of the bank. According to the Committee, these remedial measures could restrict the bank’s current activities and withhold the banks from new activities or acquisitions. These measures would also allow the supervisor to control or replace the owners, directors, and managers and impose conservatorship on the bank. Protective measures will enable the supervisor to resolve a merger or take-over by a healthier institution. If everything else fails, the principles also empower the supervisor to close an unhealthy bank.
The RBI, in its report of the working group on the resolution regime for financial institutions, provides a sample of the corrective actions in a few countries (
RBI 2014). The US was already a step ahead in this with the FDIC Improvement Act 1991. This US Act places weaker banks in one of the five zones: Well Capitalised, Adequately Capitalised, Undercapitalised, Significantly Undercapitalised, and Critically Undercapitalised. The zonal classifications are based on three capital ratios: capital to risk-weighted assets ratio, tier-1 to risk-weighted assets, and tier-1 to total assets (
Jones and King 1995).
While the US followed capital ratio triggers, other countries have also added triggers covering profitability and asset quality. For example, in Denmark (
RBI 2014), the banking supervisor prescribed five quantitative parameters for early intervention triggers: (1) the aggregate sum of all significant exposures, (2) the bank’s lending growth, (3) the amount of lending for real estate, (4) the bank’s funding ratio, and (5) the liquidity coverage.
Banks in the UK are expected to maintain capital at a level higher than the trigger ratio (
Chan-Lau and Sy 2007). The higher level is also known as the target ratio and is usually 50 basis points to 100 basis points above the trigger ratio. On the other hand, the banking regulator in Canada (
Nieto and Wall 2007) has not defined any quantitative parameters for regulatory intervention. Their framework consists of four stages: (1) early warning, (2) risk to financial viability or solvency, (3) future financial stability in serious doubt, and (4) non-viability or insolvency imminent. Each such stage is characterized by a set of conditions and the available supervisory powers. India has adopted a hybrid model and uses ratios covering capital, asset quality, and profitability.
This study reviews the extant literature on “prompt corrective action”. We derive a preliminary list of papers using a keyword-based search on “prompt corrective action” in the Scopus database. Out initial search results in 9000+ papers, which we distill, restricting the search of this keyword in title, abstract, or keywords of the research papers. This filtered search returns 70 papers, of which 41 papers were after 2010. We found only three papers covering this body of work when filtering for India.
The first set of academic work on PCA dates back to 1994, a couple of years after implementing the FDIC Improvement Act (FDICIA), 1991.
Mingo (
1994) studied Open-bank assisted transactions and PCA on US banks. Open-bank assistance (OBA) is an aided resolution method to an insured US bank in danger of failing. Such aid could take the form of a direct loan, an assisted merger, or a purchase of assets. These transactions usually entail a change in bank management and require substantial shareholder interest dilution in the troubled institution.
Mingo (
1994) argued that OBA could be cost-effective if structured well and incentivize capital infusion during PCA.
Dahl and Spivey (
1995),
Jones and King (
1995), and
Garcia (
1995) studied the aspects of bank’s recovery efforts from undercapitalisation, implementation of PCA, risk-based capital, and implementation of mandatory closure rules for US banks.
FDICIA requires the undercapitalized banks to take prompt corrective actions to re-capitalize quickly under the threat of early closure.
Dahl and Spivey (
1995) examined the likelihood and timing of bank recoveries from positions of undercapitalization. Their findings show the limited ability of banks to come out of undercapitalization unless equity infusion is done quickly.
Jones and King (
1995) argued on the requirement of better loan loss reserve adequacy standards and modification to the risk weights for accounting, accommodating greater credit risk. This study showed that US banks displaying risk of insolvency escaped PCA as they are not considered undercapitalized based on the existing risk-based capital.
Brownbridge (
2002) studied policy lessons for prudential regulation in developing countries. The study recommended, including prompt corrective action rules, providing regulators with an unambiguous mandate to protect deposits and the financial system’s stability.
Scialom (
2006) discussed the complexity of the European financial system due to risk arising out of cross-sector and cross-border integration. The paper argued that favouring a holistic approach to financial safety brings in complementarity between prudential policy, market discipline, and bank resolution. Accordingly, the complementarity between prudential policy and market discipline could be aligned with the US prompt corrective action policy.
Under PCA, the banking regulators now have a legal discourse, first, to identify weak banks, second, enforce the resolution, and, third, to define a time-bound response to executing the resolution plan. In principle, PCA would deter the further worsening of financial health and protect depositor interest.
Eisenbeis and Kaufman (
2008) suggested a four-step program to efficiently resolve bank failures with minimum credit and liquidity loss. These steps were prompt legal closure of institutions before they become economically insolvent, prompt identification of claims and assignment of losses, prompt reopening of failed institutions, and prompt re-capitalizing and re-privatization of failed institutions.
In 2010, Garcia delved into the failure of PCA under the Federal Deposit Insurance Corporation Improvement Act to deter future financial crises and minimize FDIC’s losses. In the paper, “Failing prompt corrective action”,
Garcia (
2010) reviewed the reason for the bank’s failure and found it was due to the oversight by the supervisors. Failed banks avoided PCA by artificially showing well-capitalized status.
Cetin (
2011) detailed the penalties or sanctions for non-compliance with the prudential regulatory norms under the Turkish Banking Act. Under this law, there are two types of penalties: (1) institutional, and (2) personal. Institutional penalties constitute prompt corrective actions, revocation of licenses, closure, and financial penalties. Personal penalties could be in the form of job loss, or temporary prohibition from employment in the banking sector.
Valverde (
2010) re-emphasized the importance of coordination at the national/international level and prompt corrective action. These would prevent banks from falling out of the perimeter of regulation, thereby avoiding systemic banking risk. There was evidence that the country’s banking regulator could partially attenuate the effects of asset impairment through supervision and dynamic provisions.
Chernykh and Cole (
2015) debated a new measure for bank capital adequacy for triggering PCA in the subsequent studies. They proposed a non-performing asset coverage ratio (NPACR) to better measure bank insolvency risk. Apart from the computational simplicity, this ratio accounts for capital adequacy and asset quality under a single composite measure. NPACR ratio is calculated using book values as total equity capital plus loan–loss reserves less non-performing assets, all divided by total assets. Their paper found that the NPACR is more sensitive as an early warning indicator of bank solvency problems. We examine a proxy of NPACR in the Indian context, the coverage ratio.
In the Indian context,
Gupta and Mahakud (
2020) made an analysis of bank performance without venturing into the PCA framework.
Kagade (
2015),
Sumathy and Venkatachalam (
2019), and
Gulati (
2020) studied the RBI’s PCA regulations through the lens of deposit insurance, level of non-performing assets (NPA), and convergence of critical regulations among BRICS.
Kagade (
2015) questioned the effectiveness of PCA, as it failed to account for the executive compensation. The author believed deposit insurance induces moral hazard among managers, thereby creating incentives for higher risk.
Sumathy and Venkatachalam (
2019) studied the impact of NPAs on profitability and examined the NPA for five years for the banks under the PCA framework.
Gulati (
2020) found strong convergence in banking regulations between India vis-à-vis its peers in BRICS.
5 Such regulations are related to the licensing requirements for entry into the banking business, foreign bank entry mode, restrictions on conglomerate formation, and the adoption of prompt corrective action. In a recent study,
Kashyap et al. (
2021) examined PCA in the context of reversal of borrower runs, a situation where borrower default can accelerate bank collapse. The study finds PCA as an effective mechanism to reverse borrower run and help to restore financial stability.
4. Data
We use two sets of data, (1) to examine for any statistically significant differences in the financial parameters of PCA across banks, and (2) to build a model for the classification of banks under PCA and not under PCA. For the first objective, we use 380 firm-year observations from 2008 to 2017. We take the year ended March 2017 as the cut-off for two reasons, (1) 8 out of 13 banks went into PCA during 2017, and (2) the RBI brought in changes in the PCA regulation from April 2017. For the second objective, we use two rules for selecting financial year data: (1) for PCA banks—the year-end financial data closest to the PCA date taken by the RBI, and (2) for non-PCA banks—year-end financial data as of March 2017. For example, the RBI initiated PCA on Corporation Bank in December 2017; we considered financial data at the end of March 2017. All PCA interventions by the RBI were initiated using the breaches in TCAR, NNPAR, and RoA. We examine the banks in line with these three ratios and exclude CET1 and LR. As TCAR proxies for the solvency measure, the exclusion of additional solvency measures (CET1 and LR) should not have an impact on the comparability of the RBI model with our proposed model. It must be noted here that, as mentioned before, there may be regulatory forbearance and a certain amount of discretion is provided to the RBI in invoking the PCA framework, as can be recognised explicitly in the latest notification, which states that, “Breach of any risk threshold (as detailed under) may result in invocation of PCA (sic)” (
RBI 2021). Hence, not all banks that may breach a risk threshold under the PCA framework may immediately be included under the RBI.
We use the CMIE-Prowess database for the stand-alone financials of the banks under this study. We generate annual data for the parameters from 2008 to 2017 for the 38 banks, including 13 banks that came under PCA enforcement. The 38 banks cover scheduled, listed public and private sector banks, barring the small finance banks. We exclude five State Bank of India (SBI) associate banks for this study. Five associate banks
6 of SBI were merged with the parent State Bank of India, with effect from 1 April 2017.
We identify eight new parameters and test for better PCA predictions: (1) provision coverage ratio (PCR), (2) credit-to-deposit ratio (CDR), (3) contingent-liabilities-to-net-worth ratio (CLNW), (4) lending-to-sensitive-sector ratio (LSSR), (5) current account and savings account ratio (CASA), (6) coverage ratio (CR), (7) percentage total advances to 20 largest borrowers (T20B), and (8) percentage total deposits to 20 largest depositors (T20D). We referred to the RBI’s glossary
7 for the definition of a few of these key banking terminologies. While there are no references to these parameters in the literature on “prompt corrective action” in India, we find references of similar quantitative measures in Denmark (
RBI 2014). Hence, examining similar ratios as available in the Indian banking context would shed some light on their relevance.
5. Research Methodology
We use Fisher Linear Discriminant Analysis (LDA) for this study to find a linear combination of ratios that characterizes or separates two classes of banks. LDA uses transformation based on maximizing a ratio of “between-class variance” to “within-class variance.” In other words, LDA reduces data variation in the same class and increases the separation between classes. LDA has been used by
Cox and Wang (
2014) to predict the US banks’ failure.
Haslem and Longbrake (
2015) have also used a similar model and
Pam (
2013) to review banking profitability and predict bankruptcy in the banking sector.
We estimate the discriminant model as a dependence technique using the additional banking parameters, (1) provision–coverage ratio (PCR), (2) credit-to-deposit ratio (CDR), (3) contingent-liabilities-to-net-worth ratio (CLNWR), (4) lending-to-sensitive-sector ratio (LSSR), (5) Current account and Savings account ratio (CASAR), (6) Coverage ratio (CR), (7) percentage total advances to 20 largest borrowers (T20B), and (8) percentage total advances to 20 largest borrowers (T20D) as metric predictors (independent variables). We test the alternative hypothesis that the new parameters will differentiate between banks that came under PCA vis-à-vis those under PCA.
= non-metric, categorical dependent variable, banks on which PCA not initiated (denominated with 1), banks on which PCA initiated (denominated with 2);
= metric independent variables.
We also arrive at the discriminant function (z score), a variate of the independent variables selected for their discriminatory power used in the prediction.
= intercept;
= discriminant Z score of discriminant function j for object k;
= discriminant weight for independent variable i.
The cut-off score is the mean of the centroid values is given by ; where and are values of ‘functions at group centroids’; and and are number of cases under two groups.
The following are the definitions of the variables used in the LDA model (also see
Table 1).
The provision–coverage ratio (PCR) reflects the amount of provision made for the identified NPAs. The higher the ratio, the better is the bank protected from asset impairment. In other words, with a high PCR, the bank is insulated as it has already provided for the total loss. PCR, in general, will be less than 100%, as the provision norms depend on the age of the NPA and its categorization (doubtful, sub-standard, and loss).
The credit-to-deposit ratio (CDR), also known as the loan-to-deposit ratio, is the percentage of the loan funded through deposits. A bank needs to set aside a specific portion of deposits as a part of the liquidity requirements.
8 Hence, net deposits available for funding credit in an ideal scenario are one minus CRR plus SLR. Theoretically, an extremely high credit-to-deposit ratio, i.e., beyond the theoretical maximum, shows aggressive lending. CD ratio beyond one implies the bank had lent out more than the deposits mobilized, where deposits are the core source of funding in a bank.
Contingent Liabilities to net worth ratio (CLNW) are the non-fund exposures a bank takes, also known as off-balance sheet items. The liability crystalizes in the event of a specific outcome. It is disclosed in the bank’s financials as a separate line item; in other words, it appears in both the asset and liabilities side of a balance sheet. Contingent liabilities as a proportion to net worth express the potential erosion in net worth if an actual loss occurs, leading to funding outgoings in the future.
The Current Account and Savings Account ratio (CASAR) indicates the proportion of low-cost deposits in the total core funding, i.e., deposits. The higher the ratio, the lower will be the cost of funds, and better margin spread for banks, with better profitability.
Lending to sensitive sectors ratio (LSSR) includes loans to real estate, capital markets, and commodities. These loans to these sectors are prone to price fluctuations and may pose a risk to financial stability. The higher this ratio might reflect a higher margin spread and a probability of large losses in an unfavourable event.
The percentage of total advances to the 20 largest borrowers (T20B) shows the concentration risk and the potential loss that a bank might incur in an unforeseen credit risk event. A higher value shows whether a bank is over-exposed to any borrower or a particular sector.
The percentage of total deposits to the 20 largest depositors (T20D) shows the dependence on large depositors for core funding. Growing dependence on large depositors is one of the foremost reasons for the early identification of weaker banks to continue the reassurance of safety. A high value reflects a bank’s dependence on wholesale deposits and a possible vulnerability in the event of sudden withdrawal of these deposits.
Coverage ratio (CR) is an under-used but simple ratio that combines capital and the NPA measures. According to RBI guidelines, coverage ratio is defined as equity minus net NPA divided by total assets minus intangible assets. We use the value of the assets as per the balance and do not factor in the risk-weight, which simplifies its computation. If the gap between equity and net NPA is high, it means there is an adequate cushion for banks to absorb losses. Hence, the higher the coverage ratio the more resilient the bank is.
We follow
Chernykh and Cole (
2015) and use coverage ratio, the equivalent of NPACR, as the author considers. One of the new parameters that we evaluate for incorporation in the PCA framework, the coverage ratio is statistically significant between Public Sector Undertaking (PSU) and non-PSU banks. There are some of the non-PSU banks keeping higher coverage and, hence, better protected for any losses. Smaller banks also show better coverage, which ties back to the fact that the NPA levels in smaller banks are lower. Also, banks that tend to be aggressive in lending have a higher coverage.
6. Results and Discussion
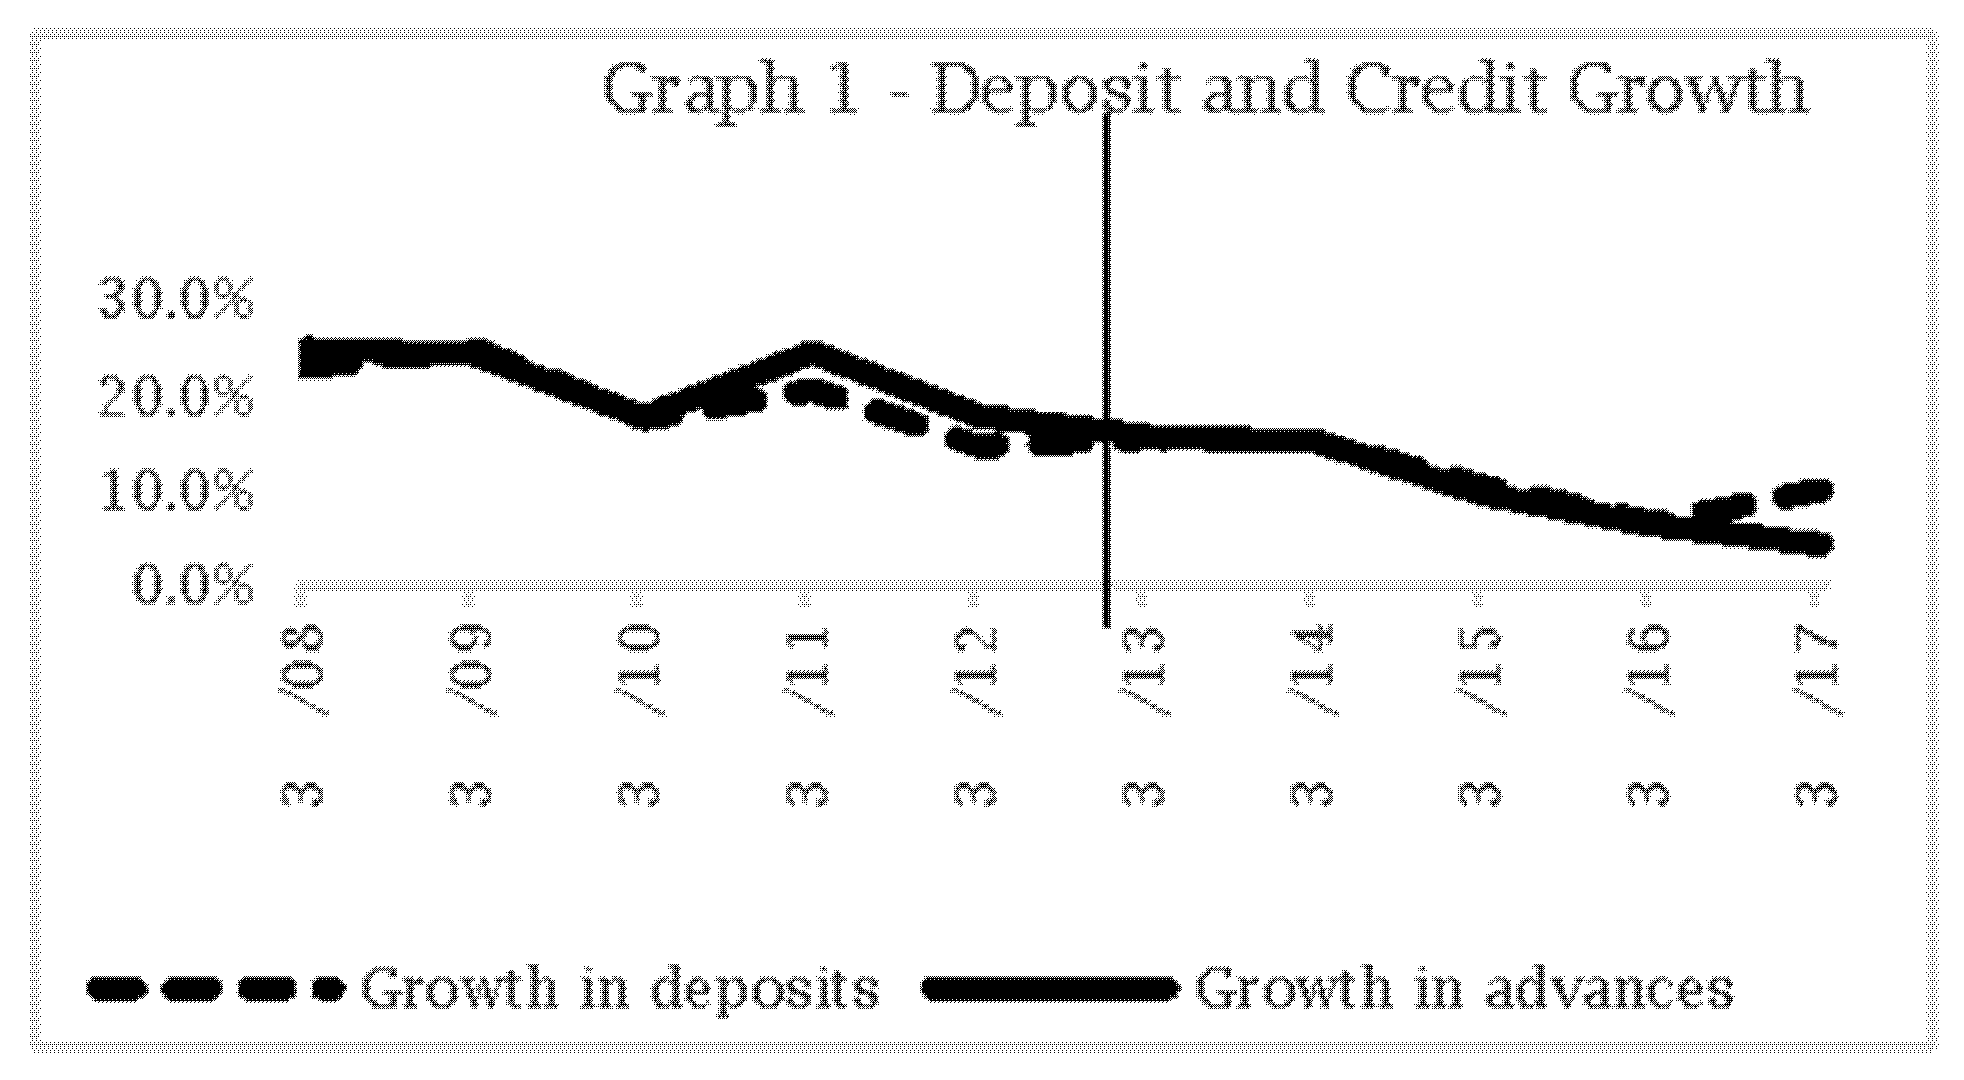
In our preliminary investigation, we examine 38 banking firms using financial parameters in two-time phases, the first phase covering the years 2008–2012 and the second phase 2013–2017. Given a bank’s prominent role in financial intermediation, we first study deposits and credit growth from 2008 to 2017. The two phases are discernible in terms of the growth of deposits and advances (see
Figure A1). The year 2011 saw advances outpacing deposit growth and subsequent decline until 2014. Since then, credit growth has contracted with deposits taking over.
Results (see
Table A5) also show that the credit-to-deposit ratio (CDR) over these two phases does not significantly differ. We also check for any differences in these variables by grouping the banks into three categories: (1) shareholding based on public sector undertaking (PSU) and non-PSU, (2) size of the bank based on total assets, and (3) lending aggressiveness based on a credit-to-deposit ratio. When seen between PSU and non-PSU banks, we find a statistically significant difference in CDR. Non-PSU banks seem to be more aggressive than PSU banks. We also see evidence of larger banks (based on total assets) expanding faster. We use the average of the individual measures TCRAR, NNPAR, and RoA and find trend reversal in 2013–2014. Average NNPAR and RoA shows a significant difference between 2008–2012 and 2013–2017. NNPAR in PSU banks is higher than the non-PSU counterparts, which leads to a lower RoA in the former rather than in the latter. Rising NPA levels eroded the banks’ capital as well as their RoA. The average RoA (see
Figure A2) even became negative in 2015, with NPAs not showing any signs of improvement. Higher NPA could result from increased exposure in sensitive sectors such as real estate and capital markets.
We find larger banks have a higher NNPAR, which corroborates the exposure in riskier portfolios, which could have turned out non-performing. Despite higher NNPAR, the return on assets of larger banks is more than smaller banks, which principle could arise due to higher interest yields from riskier portfolios and diversified income (fee-based, treasury). Banks with higher NPA point towards higher CDR. This asserts that banks that tend to become more aggressive could have higher NPAs. At the same time, more aggressive lending will mean higher risk and higher return. Banks with high CDR reflect a better RoA, resulting from better yields on the loans disbursed. In summary, empirical study reveals differences in the financial parameters based on the bank type (PUS versus non-PSU), lending strategy (aggressive versus conservative), size (large versus small in terms of asset base), and time horizons (2008–2012 versus 2013–2017).
Before getting into the model, we examine descriptive statistics summary covering both public and private sector banks (see
Table A6). The highest degree of variation is observed in the contingent liability to net worth ratio, indicating that different banks take exposure to non-fund-based credit depending on their appetite. A higher contingent liability could expose banks to a solvency risk and could take the bank out of business. The second most variation is observed in credit-to-deposit ratio which also signifies a difference in the bank’s aggressiveness to deploy higher credit to meet its yield target and cover interest costs on deposits.
We perform a diagnostics check for normality in the predictor variables. We retain the variables which pass this test, and found conformity to the normality assumption for PCR, CDR, T20BR, and CR variables (see
Table A6). Accordingly, we drop contingent CLNW, CASAR, LSSR, and T20DR for modelling PCA outcome through the LDA. We perform three other diagnostic checks: (1) equality of group means, (2) multi-collinearity, and (3) equality of variance.
The first diagnostic check helps us understand any significant difference between means across the two groups of banks (with and without PCA) using these predictor variables (PCR, CDR, T20BR, CR, and CASAR). Using Wilk’s Lambda, we find CDR and CR impact statistically significant differences between the two bank groups (see
Table A7). Wilk’s Lambda shows that canonical correlations associated with the functions are not equal to zero. In other words, the LDA model with CDR and CR as predictors has a discriminating power or capability. It also implies that CDR and CR can create separation between the banks which came under PCA vis-à-vis those which did not come under PCA. Our second diagnostic check on multi-collinearity shows low values (~less than 0.6) between these predictor variables. Thus, the chosen variables do not have significant multi-collinearity issues (see
Table A8). The third check on equality of the covariance matrices of the independent variables across the groups of the dependent variables is also verified using Box’s M test at 1.0 per cent significance. We get statistically insignificant results supporting the validity of equality of covariance (see
Table A9). Following the satisfaction with the above diagnostic checks, we prune the model using only the credit to deposit ratio (CDR) and coverage ratio (CR). The eigenvalue is defined as variance explained divided by variance unexplained. It describes how much a function’s discriminating ability (ratio of between groups to within group sum of squares).
We arrive at the final LDA model using the unstandardized coefficients (see
Table A10). CR has relative importance over CDR, as seen through the structured matrix. The magnitudes of these coefficients indicate how strongly the discriminating variables affect the score. The positive eigenvalue (0.613) is indicative of the function’s discriminating abilities and could segregate the banks with good prediction power.
Our dependent variable has two levels, banks on which PCA is not taken (coded as 1) and banks on which PCA is taken (coded as 2). We get two centroid values for these two groups (see
Table A11). These two bank groups with the opposite centroid values indicate discrimination by CDR and CR variates. In this case, the mean value of these two centroids is the cut-off score (−) 0.51. Suppose the discriminant function value is more significant than (−) 0.51; the corresponding sample is classified as prompt corrective action not taken. If it is less than the cut-off score, then the corresponding sample is classified as prompt corrective action. As seen from the classification results table, the model’s classification power is good; 78.9 per cent of the records are correctly classified through the model and 84.6 per cent of banks which went under PCA are predicted correctly by the discriminant function model (see
Table A12).
To justify the appropriateness of the above LDA model, we test for robustness in three ways: (1) by running a discriminant model using the existing financial parameters mandated by the RBI and checking for any improvement by comparing it with our model, (2) by incorporating these two predictors on the RBI mandated parameters to check for any better prediction, (3) by examining the possibility to rationalize the number of predictors without compromising on the accuracy, and (4) by checking the impact of the CR along with PCA category on the future stock returns.
According to the RBI, the first examination shows 86.8 per cent correct classification using the financial parameters. The RBI fares better than our model, which could correctly classified as 78.9 per cent. However, with the new parameters, the classification accuracy for identifying PCA stands the same at 84.6 per cent on the stability of model effectiveness (see
Table A12). With the inclusion of the new predictors (CDR and CR) on top of the financial parameters identified by the RBI, our second examination does not yield any overall significant improvement. While all the five parameters (NNPAR, RoA, CRAR, CDR, and CR) pass the equality of mean test, signifying the difference in groups through these predictors, the overall classification and PCA accuracy reduce (see
Table A13). Overall classification reduces to 84.2 per cent from 86.8 per cent (the RBI model) and improves from 78.9 per cent (our model). Within PCA, the combined model could demonstrate an accuracy level of 76.9 per cent, which is lower when compared with both stand-alone models (84.6 per cent) (see
Table 2).
The results emphasize the importance of these two new ratios, credit-to-deposit ratio and coverage ratio, which we then propose for inclusion in the PCA framework. We attempt to rationalize the PCA framework from its current state, having five ratios to two ratios. The solvency ratio CR captures both solvency and asset quality parameters in one, while CDR explains the aggressiveness of banks in credit deployment. The CR can be computed directly using the financial variables directly available in the financial statements and avoids any complex or tedious calculations.
As a fourth step to the robustness check, we extend our analysis to understand if the variables identified through discriminant analysis (CDR, CR) have an impact on the stock returns in reality. We regress future stock returns (250-day average) on the CDR and CR as independent variables. Stock returns are calculated using the natural logarithm of the daily adjusted closing price for April 2017 to March 2018 and aggregated for 250 days. On regressing the annualised stock returns on the CDR, CR as predictor variables, we get an R-squared value of 70.3 per cent with an adjusted R-squared of 68.7 per cent (see
Table A14). This implies that CDR and CR can predict 70.3 per cent of the variance in annualised stock returns. We do not claim any causal relationship between the stock returns and the explanatory variables (CDR, CR); however, there is empirical evidence of a strong association and the importance of these new parameters.
Interestingly, the regression model shows the positive association of CR with stock returns: better CR assures higher loss-absorption power of a bank and, hence, more stability. Thus, banks with higher CR are expected to deliver higher stock returns. On the contrary, stock returns move in tandem despite the higher CDR, indicative of aggression on the bank’s credit deployment. This implies the risk–return trade-off; the higher the risk, the higher the returns.
7. Conclusions
Depositors’ protection is critical as they provide a significant part of core funds (~80%) for banking. Corrective measures are essential to avoid financial instability and widespread contagion. The paper focuses on examining the efficacy of the existing prompt corrective action framework and recommending new variables which could indicate symptoms of weakening financial health of a bank. In total, 13 Indian banks have already come under the RBI’s scanner through PCA. While all but one of the banks (Central Bank of India) is out of the PCA, the same has come at the cost of either a merger with the stronger banks or through an additional capital infusion, often at taxpayers’ cost. The RBI’s PCA enforcement provides reassurance to depositors but could not stop depositor runs. In many cases, after PCA, the banks had to out with press releases to re-instil confidence about their stable liquidity position to salvage the situation. A strengthened PCA framework that elicits greater confidence among the depositors would help the banking system.
We could see regulatory forbearance in the Indian banking system. RoA shows the early weakening signals compared to the capital and the asset quality counterparts. Even though the RBI added two new ratios for a better monitoring mechanism in 2017, the promptness in their action is debatable as we see a delay in taking corrective actions. Therefore, a revamped PCA framework with an additional variable-like coverage ratio will help to simplify the framework without diluting the effectiveness. The coverage ratio combines the capital adequacy (leverage) and net non-performing asset ratios. This streamlining means monitoring the lower number of variables and in practice can help the RBI to be more proactive in initiating PCA. With the co-operative banks also coming under the supervisory purview of the RBI, it could be worth revisiting the PCA framework to suit such banks.
The Indian banking sector has seen consolidation in the last two years, with the number of public sector banks reduced to 10 in 2021 from 27 in 2017. This includes the public sector banks under PCA. While some banks could come out of PCA on their own (some eventually merged later), others were merged with stronger banks as they could not come out of the PCA. The rest remained stand-alone, with the Government’s capital infusion playing a key role, the Government being the primary shareholder for public sector banks. The Government infused INR 200,000 million in the financial year 2020–2021 to capitalize on the public sector banks, keeping the bank solvent, or, in other words, operational.
We used discriminant analysis to study the financial variables which can differentiate weak and strong banks. Credit to deposit ratio and coverage ratio are clear differentiators for banks which came under PCA and those which did not. On a stand-alone basis, both the existing ratios (as per RBI) and the new ratios could classify 84.6 per cent accuracy. However, after incorporating these new ratios into the existing PCA framework, the classification accuracy improves to 92.3 per cent. This would be helpful for the depositor, who would now have greater confidence over the evaluation being done by the RBI before stepping in to protect their interests. Our regression model predicts 70.3 per cent variation in annualised stock returns, using only coverage ratio as a predictor. CR shows a positive association with stock returns; this association augurs well, as higher CR indicates a better loss absorption ability. Better loss absorption will always protect depositors, and the bank will be more resilient to tide over the losses arising out of loans.
We aim to contribute towards identifying potential for improvement in the policy framework in banking supervision. With the recent changes in the Banking Regulation Act, 1934, in September 2020, co-operative banks are now under the direct supervision of the RBI. This policy change stems from the failure of Punjab and Maharashtra Cooperative Bank (PMC). The study could be an additional input in defining the supervision framework for co-operative banks. Despite the increase in insurance cover, many deposits are not shielded. There is already evidence of high depositor concentration amongst banks; hence a timely intervention using PCA is the need of the hour. The RBI lifted PCA restrictions on UCO Bank and Indian Overseas Bank after capital infusion by the Government, as recently as September 2021, after four years and six years under PCA, respectively. These two banks continued to stay as stand-alone banks and were kept out of the mega-merger announced by the Government in 2019. Removal of PCA gives confidence among the depositors and investors as it indicates better health and stability. As of now, out of the 13 banks, only the Central Bank of India, a public sector bank, remains under the PCA regime.
The PCA framework for banks underwent a revision in November 2021, effective from January 2022. The change corroborates our model of simplification of the financial parameters. The RBI removed RoA from the financial parameters with this change, focusing more on solvency and asset quality. In December 2021, the RBI included non-banking finance companies (NBFC) under the PCA purview. Being effective from October 2022, the new norms are expected to enforce better discipline and enforce stricter supervisory norms on NBFCs.
A natural extension of this study could be to find the determinants that which the Government uses to merge banks under PCA with other stronger banks. While certain commercial banks under PCA were merged, others were left to come out of PCA in their old corporate form. In some of the mergers, we have seen the RBI prioritize depositors’ interests over shareholders. We believe future studies on how banks create value for their shareholders and protect their interests and how the additional parameters suggested in this article could increase the stability of commercial banks would be contributions to academic literature. These ideas encompass the study’s limitations and could be a path for future studies.


