
The Interplay between Digitalization, Education and Financial Development: A European Case Study

 ,
, 

Abstract
:1. Introduction
2. Theoretical and Empirical Background
2.1. Digitalization and Financial Development
2.2. Education and Digitalization
2.3. Financial Development and Education
3. Materials and Methods
3.1. Methodology
3.2. Data and Data Sources
4. Results
5. Discussion
6. Conclusions
Author Contributions
Funding
Institutional Review Board Statement
Informed Consent Statement
Data Availability Statement
Conflicts of Interest
Appendix A
References
- Abubakar, Yazid Abdullahi, Jay Mitra, and Adeyeye Mercy Modupe. 2018. Mobile Telephony and New Business Formation Rates in BRICS and Beyond: Does Human Capital Matter? Journal of Entrepreneurship and Innovation in Emerging Economies 4: 137–58. [Google Scholar] [CrossRef]
- Amisano, Gianni, and Carlo Giannini. 2012. Topics in Structural VAR Econometrics. Berlin and Heidelberger: Springer Science & Business Media. [Google Scholar]
- Asongu, Simplice. 2014. Financial development dynamic thresholds of financial globalization: Evidence from Africa. Journal of Economic Studies 41: 166–95. [Google Scholar] [CrossRef]
- Asongu, Simplice A., Joseph Nnanna, and Vanessa S. Tchamyou. 2020. The comparative African regional economics of globalization in financial allocation efficiency: The pre-crisis era revisited. Financial Innovation 6: 1–41. [Google Scholar] [CrossRef]
- Athanasopoulos, George, and Farshid Vahid. 2008. VARMA versus VAR for Macroeconomic Forecasting. Journal of Business & Economic Statistics 26: 237–52. [Google Scholar]
- Balassa, Bela. 1990. Financial liberalization in developing countries. Studies in Comparative International Development 25: 56–70. [Google Scholar] [CrossRef] [Green Version]
- Baloch, Muhammad Awais, Ilhan Ozturk, Festus Victor Bekun, and Danish Khan. 2021. Modeling the dynamic linkage between financial development, energy innovation, and environmental quality: Does globalization matter? Business Strategy and the Environment 30: 176–84. [Google Scholar] [CrossRef]
- Bartram, Söhnke M., Stephen J. Taylor, and Yaw-Huei Wang. 2007. The Euro and European financial market dependence. Journal of Banking & Finance 31: 1461–81. [Google Scholar]
- Bats, Joost V., and Aerdt C. F. J. Houben. 2020. Bank-based versus market-based financing: Implications for systemic risk. Journal of Banking & Finance 114: 105776. [Google Scholar]
- Bayar, Yilmaz, and Marius Dan Gavriletea. 2018. Foreign direct investment inflows and financial development in Central and Eastern European Union countries: A panel cointegration and causality. International Journal of Financial Studies 6: 55. [Google Scholar] [CrossRef] [Green Version]
- Bayar, Yilmaz, Marius Dan Gavriletea, and Dragoş Păun. 2021. Impact of mobile phones and internet use on financial inclusion: Empirical evidence from the EU post-communist countries. Technological and Economic Development of Economy 27: 722–41. [Google Scholar] [CrossRef]
- Beck, Thorsten, Asli Demirgüç-Kunt, and Ross Levine. 2007. Finance, inequality, and the poor. Journal of Economic Growth 12: 27–49. [Google Scholar] [CrossRef]
- Beck, Thorsten, Asli Demirgüç-Kunt, and Ross Levine. 2010. Financial Institutions and Markets across Countries and over Time. World Bank Economic Review 24: 77–92. [Google Scholar] [CrossRef] [Green Version]
- Bekaert, Geert, Campbell R. Harvey, and Christian Lundblad. 2007. Liquidity and expected returns: Lessons from emerging markets. The Review of Financial Studies 20: 1783–831. [Google Scholar] [CrossRef] [Green Version]
- Benos, Nikos, and Stefania Zotou. 2014. Education and Economic Growth: A Meta-Regression Analysis. World Development 64: 669–89. [Google Scholar] [CrossRef] [Green Version]
- Berkmen, Pelin, Kimberly Beaton, Dmitry Gershenson, Javier Arze Del Granado, Kotaro Ishi, Marie Kim, Emanuel Kopp, and Marina Rousset. 2019. Fintech in Latin America and the Caribbean: Stocktaking. IMF Working Paper 19: 71. [Google Scholar] [CrossRef] [Green Version]
- Berthélemy, Jean-Claude, and Aristomène Varoudakis. 1995. Thresholds in financial development and economic growth. The Manchester School of Economic & Social Studies 63: 70–84. [Google Scholar]
- Bist, Jagadish Prasad. 2018. Financial development and economic growth: Evidence from a panel of 16 African and non-African low-income countries. Cogent Economics & Finance 6: 1449780. [Google Scholar]
- Bose, Niloy, and Richard Cothren. 1996. Equilibrium loan contracts and endogenous growth in the presence of asymmetric information. Journal of Monetary Economics 38: 363–76. [Google Scholar] [CrossRef]
- Brandt, Patrick T., and John T. Williams. 2006. Multiple Time Series Models. Thousand Oaks: Sage Publications. [Google Scholar]
- Bryant, Charles E., and Rajshekhar G. Javalgi. 2016. Global economic integration in developing countries: The role of corruption and human capital investment. Journal of Business Ethics 136: 437–50. [Google Scholar] [CrossRef]
- Canova, Fabio. 1995. The Economics of Var Models. In Macroeconometrics. Recent Economic Thought Series; Edited by D. Hoover Kevin. Dordrecht: Springer, vol. 46. [Google Scholar]
- Canova, Fabio, and Matteo Ciccarelli. 2013. Panel Vector Autoregressive Models: A Survey. Working Paper Series 1507, European Central Bank. Available online: https://www.ecb.europa.eu/pub/pdf/scpwps/ecbwp1507.pdf (accessed on 20 October 2021).
- Cheng, Chih-Yang, Mei-Se Chien, and Chien-Chiang Lee. 2021. ICT diffusion, financial development, and economic growth: An international cross-country analysis. Economic Modelling 94: 662–71. [Google Scholar] [CrossRef]
- Chinn, Menzie D., and Hiro Ito. 2006. What matters for financial development? Capital controls, institutions, and interactions. Journal of Development Economics 81: 163–92. [Google Scholar] [CrossRef] [Green Version]
- Çiftçioğlu, Serhan, and Murad A. Bein. 2017. The relationship between financial development and unemployment in selected countries of the European Union. European Review 25: 307–19. [Google Scholar] [CrossRef]
- Čihák, Martin, Aslı Demirgüç-Kunt, Erik Feyen, and Ross Levine. 2012. Benchmarking Financial Development Around the World. Policy Research Working Paper 6175. Washington, DC: World Bank. [Google Scholar]
- Demirguc-Kunt, Asli, Leora Klapper, Dorothe Singer, Saniya Ansar, and Jake Hess. 2018. Global Findex Database 2017. World Bank Publications—Books. Washington, DC: The World Bank Group, p. 29510. [Google Scholar]
- Diamond, Douglas W. 1984. Financial intermediation and delegated monitoring. The Review of Economic Studies 51: 393–414. [Google Scholar] [CrossRef]
- Doan, Thomas, Robert Litterman, and Christopher Sims. 1984. Forecasting and conditional projection using realistic prior distributions. Econometric Reviews 3: 1–100. [Google Scholar] [CrossRef] [Green Version]
- Donou-Adonsou, Ficawoyi. 2019. Technology, education, and economic growth in Sub-Saharan Africa. Telecommunications Policy 43: 353–60. [Google Scholar] [CrossRef]
- Ejemeyovwi, Jeremiah O., Evans S. Osabuohien, and Ebenezer I. K. Bowale. 2021. ICT adoption, innovation, and financial development in a digital world: Empirical analysis from Africa. Transnational Corporations Review 13: 16–31. [Google Scholar] [CrossRef]
- European Commission. 2021. Digital Economy and Society Index. DESI Thematic Chapters. European Commission. Available online: https://digital-strategy.ec.europa.eu/en/policies/desi (accessed on 29 November 2021).
- European Investment Bank. 2021. Digitalisation in Europe 2020–2021—Evidence from the EIB Investment Survey. EIB Economics Department. Available online: https://www.eib.org/en/essays/european-digitalisation-study (accessed on 30 November 2021).
- Feyen, Erik, Jon Frost, Leonardo Gambacorta, Harish Natarajan, and Matthew Saal. 2021. Fintech and the Digital Transformation of Financial Services: Implications for Market Structure and Public Policy. BIS Papers No 117. Basel: Monetary and Economic Department. [Google Scholar]
- Fratzscher, Marcel. 2012. Capital flows, push versus pull factors and the global financial crisis. Journal of International Economics 88: 341–56. [Google Scholar] [CrossRef] [Green Version]
- Galbis, Vicente. 1977. Financial intermediation and economic growth in less-developed countries: A theoretical approach. The Journal of Development Studies 13: 58–72. [Google Scholar] [CrossRef]
- Giacomini, Raffaella. 2013. The Relationship Between DSGE and VAR Models, VAR Models in Macroeconomics—New Developments and Applications: Essays in Honor of Christopher A. Sims (Advances in Econometrics, Volume 32). Bingley: Emerald Group Publishing Limited, pp. 1–25. [Google Scholar]
- Giacomini, Raffaella, and Barbara Rossi. 2016. Model comparisons in unstable environments. International Economic Review 57: 369–92. [Google Scholar] [CrossRef] [Green Version]
- Greenwood, Jeremy, and Bruce D. Smith. 1997. Financial markets in development, and the development of financial markets. Journal of Economic Dynamics and Control 21: 145–81. [Google Scholar] [CrossRef] [Green Version]
- Grossman, Emiliano, and Patrick Leblond. 2011. European financial integration: Finally the great leap forward? JCMS: Journal of Common Market Studies 49: 413–35. [Google Scholar] [CrossRef]
- Gujarati, Damodar N., and Dawn C. Porter. 2009. Basic Econometrics, 5th ed. New York: McGraw-Hills Inc. [Google Scholar]
- Habibi, Fateh, and Mohamad Amjad Zabardast. 2020. Digitalization, education and economic growth: A comparative analysis of Middle East and OECD countries. Technology in Society 63: 101370. [Google Scholar] [CrossRef]
- Hanushek, Eric A., and Ludger Wößmann. 2010. Education and Economic Growth. In International Encyclopedia of Education. Oxford: Elsevier, vol. 2, pp. 245–52. [Google Scholar]
- Hassan, M. Kabir, Benito Sanchez, and Jung-Suk Yu. 2011. Financial development and economic growth: New evidence from panel data. The Quarterly Review of Economics and Finance 51: 88–104. [Google Scholar] [CrossRef] [Green Version]
- Henri, Njangang, Nembot Ndeffo Luc, and Nawo Larissa. 2019. The long-run and short-run effects of foreign direct investment on financial development in African countries. African Development Review 31: 216–29. [Google Scholar] [CrossRef] [Green Version]
- Henry, Peter Blair. 2000. Stock market liberalization, economic reform, and emerging market equity prices. The Journal of Finance 55: 529–64. [Google Scholar] [CrossRef]
- Hogarth, Jeanne M. 2006. Financial Education and Economic Development, Improving Financial Literacy. International Conference hosted by the Russian G8 Presidency in Cooperation with the OECD. Available online: https://www.oecd.org/finance/financial-education/37742200.pdf (accessed on 29 November 2021).
- Horobet, Alexandra, and Radu Lupu. 2009. Are capital markets integrated? A test of information transmission within the European Union. Romanian Journal of Economic Forecasting 10: 64–80. [Google Scholar]
- Hu, Qing, Ross Levine, Chen Lin, and Mingzhu Tai. 2020. Financial Development Can Harm Children’s Academic Development. Centre for Economic Policy Research. Available online: https://voxeu.org/article/financial-development-can-harm-children-s-academic-development (accessed on 29 November 2021).
- Islam, Mollah Aminul, Muhammad Asif Khan, József Popp, Wlodzimierz Sroka, and Judit Oláh. 2020. Financial development and foreign direct investment—The moderating role of quality institutions. Sustainability 12: 3556. [Google Scholar] [CrossRef]
- Ivanisevic Hernaus, Ana, and Alen Stojanovic. 2015. Determinants of bank social responsibility: Case of Croatia. Ekonomie and Management 18: 117–34. [Google Scholar] [CrossRef]
- Jaffee, Dwight, and Mark Levonian. 2001. The Structure of Banking Systems in Developed and Transition Economies. European Financial Management 7: 161–81. [Google Scholar] [CrossRef] [Green Version]
- Jepsen, Maria, and Jan Drahokoupil. 2017. The digital economy and its implications for labour. 2. The consequences of digitalisation for the labour market. Transfer: European Review of Labour and Research 23: 249–52. [Google Scholar] [CrossRef]
- Joutz, Frederick L., Gangadharrao Soundalyarao Maddala, and Robert P. Trost. 1995. An integrated bayesian vector auto regression and error correction model for forecasting electricity consumption and prices. Journal of Forecasting 14: 287–310. [Google Scholar] [CrossRef]
- Kadiyala, K. Rao, and Sune Karlsson. 1997. Numerical methods for estimation and inference in Bayesian VAR-models. Journal of Applied Econometrics 12: 99–132. [Google Scholar] [CrossRef]
- Kattel, Rainer. 2010. Financial and economic crisis in Eastern Europe. Journal of Post Keynesian Economics 33: 41–60. [Google Scholar] [CrossRef] [Green Version]
- Khadka, Jiban. 2021. Effect of governance on educational performance in Nepal. Journal of Education and Research 11: 97–114. [Google Scholar] [CrossRef]
- Khera, Purva, Stephanie Ng, Sumiko Ogawa, and Ratna Sahay. 2021. Is Digital Financial Inclusion Unlocking Growth? IMF Working Papers 2021/167 A001. Available online: https://www.imf.org/en/Publications/WP/Issues/2021/06/11/Is-Digital-Financial-Inclusion-Unlocking-Growth-460738 (accessed on 20 November 2021).
- Kim, Dong-Hyeon, and Shu-Chin Lin. 2011. Nonlinearity in the financial development–income inequality nexus. Journal of Comparative Economics 39: 310–25. [Google Scholar] [CrossRef]
- King, Robert G., and Ross Levine. 1993. Finance and growth: Schumpeter might be right. The Quarterly Journal of Economics 108: 717–37. [Google Scholar] [CrossRef]
- Klugman, Jeni. 2011. Human Development Report 2011. Sustainability and Equity: A Better Future for All. Sustainability and Equity: A Better Future for All (2 November 2011). UNDP-HDRO Human Development Reports, Retrieved 23 October 2021. Available online: http://hdr.undp.org/en/content/human-development-report-2011 (accessed on 23 October 2021).
- Kurul, Zühal, and A. Yasemin Yalta. 2017. Relationship between institutional factors and FDI flows in developing countries: New evidence from dynamic panel estimation. Economies 5: 17. [Google Scholar] [CrossRef] [Green Version]
- Kuznets, Simon. 1955. Economic growth and income inequality. American Economic Review 45: 1–28. [Google Scholar]
- Laktionova, Oleksandra, Viktor Koval, Nataliia Savina, and Badri Gechbaia. 2021. The Models of Matching Financial Development and Human Capital in National Economy. Bulletin of the Georgian National Academy of Sciences 15: 177–84. [Google Scholar]
- Levine, Ross. 1997. Financial development and economic growth: Views and agenda. Journal of Economic Literature 35: 688–726. [Google Scholar]
- Levine, Ross. 2005. Finance and growth: Theory and evidence. Handbook of Economic Growth 1: 865–934. [Google Scholar]
- Lewis, William Arthur. 1954. Economic development with unlimited supplies of labour. The Manchester School of Economic and Social Studies 22: 139–91. [Google Scholar] [CrossRef]
- Litterman, Robert B. 1986. Forecasting with Bayesian vector autoregressions—Five years of experience. Journal of Business & Economic Statistics 4: 25–38. [Google Scholar]
- Loukoianova, Elena, Sonja Davidovic, Cormac Sullivan, and Hervé Tourpe. 2019. Strategy for Fintech Applications in the Pacific Island Countries. IMF APD Departmental Paper 19: 14. [Google Scholar]
- Lucas, Robert E., Jr. 1988. On the mechanics of economic development. Journal of Monetary Economics 22: 3–42. [Google Scholar] [CrossRef]
- Luintel, Kul B., and Mosahid Khan. 1999. A quantitative reassessment of the finance–growth nexus: Evidence from a multivariate VAR. Journal of Development Economics 60: 381–405. [Google Scholar] [CrossRef]
- Lütkepohl, Helmut, and Donald Stephen Poskitt. 1996. Specification of echelon-form VARMA models. Journal of Business & Economic Statistics 14: 69–79. [Google Scholar]
- Majeed, Abdul, Ping Jiang, Mahmood Ahmad, Muhammad Asif Khan, and Judit Olah. 2021. The Impact of Foreign Direct Investment on Financial Development: New Evidence from Panel Cointegration and Causality Analysis. Journal of Competitiveness 13: 95–112. [Google Scholar] [CrossRef]
- Mathieson, Donald J. 1980. Financial reform and stabilization policy in a developing economy. Journal of Development Economics 7: 359–95. [Google Scholar] [CrossRef]
- McKinnon, Ronald I. 1973. Money and Capital in Economic Development. Washington, DC: Brookings Institution. [Google Scholar]
- Meskoub, Mahmoud. 2018. Financial services in the EU: Is there a problem of financial exclusion? In International Institute of Social Studies of Erasmus University Rotterdam. Institute of Social Studies Working Papers—General Series 638; The Hague: Institute of Social Studies. [Google Scholar]
- Mignamissi, Dieudonné. 2021. Digital divide and financial development in Africa. Telecommunications Policy 45: 102199. [Google Scholar] [CrossRef]
- Mnohoghitnei, Irina, Corina Anca Neguț, and Alexandra Lavinia Horobeț. 2021. The Future is Near: On the Prospects of Central Bank Digital Currency Adoption in Central and Eastern European Countries. KnE Social Sciences 2021: 1–15. [Google Scholar] [CrossRef]
- Moagăr-Poladian, Simona, Dorina Clichici, and Cristian-Valeriu Stanciu. 2019. The comovement of exchange rates and stock markets in Central and Eastern Europe. Sustainability 11: 3985. [Google Scholar] [CrossRef] [Green Version]
- Morales, María F. 2003. Financial intermediation in a model of growth through creative destruction. Macroeconomic Dynamics 7: 363–93. [Google Scholar] [CrossRef] [Green Version]
- Mylonidis, Nikolaos, and Christos Kollias. 2010. Dynamic European stock market convergence: Evidence from rolling cointegration analysis in the first euro-decade. Journal of Banking & Finance 34: 2056–64. [Google Scholar]
- Nguyen, Canh Phuc, and Thanh Dinh Su. 2021. Financing the economy: The multidimensional influences of financial development on economic complexity. Journal of International Development 33: 644–84. [Google Scholar] [CrossRef]
- Novak, Jurica, Marcin Purta, Tomasz Marciniak, Karol Ignatowicz, Kacper Rozenbaum, and Kasper Yearwood. 2018. The rise of Digital Challengers How Digitization Can Become the Next Growth Engine for Central and Eastern Europe. Digital McKinsey. Available online: https://digitalchallengers.mckinsey.com/files/McKinsey%20CEE%20report_The%20Rise%20of%20Digital%20Challengers.pdf (accessed on 3 December 2021).
- Olowu, Gbolahan, Godwin Oluseye Olaseinde-Williams, and Murad Bein. 2019. Does financial and agriculture sector development reduce unemployment rates? Evidence from Southern African countries. Agricultural Economics 65: 223–31. [Google Scholar] [CrossRef]
- Otchere, Isaac, Issouf Soumaré, and Pierre Yourougou. 2016. FDI and financial market development in Africa. The World Economy 39: 651–78. [Google Scholar] [CrossRef]
- Owusu-Agyei, Samuel, Godwin Okafor, Aruoriwo Marian Chijoke-Mgbame, Paschal Ohalehi, and Fakhrul Hasan. 2020. Internet adoption and financial development in sub-Saharan Africa. Technological Forecasting and Social Change 161: 120293. [Google Scholar] [CrossRef]
- Patrick, Hugh T. 1966. Financial development and economic growth in underdeveloped countries. Economic Development and Cultural Change 14: 174–89. [Google Scholar] [CrossRef]
- Popov, Alexander, and Jörg Rocholl. 2018. Do credit shocks affect labor demand? Evidence for employment and wages during the financial crisis. Journal of Financial Intermediation 36: 16–27. [Google Scholar] [CrossRef]
- Pungulescu, Crina. 2013. Measuring financial market integration in the European Union: EU15 vs. New Member States. Emerging Markets Review 17: 106–24. [Google Scholar] [CrossRef]
- Rajan, Raghuram G., and Luigi Zingales. 2003. The great reversals: The politics of financial development in the twentieth century. Journal of Financial Economics 69: 5–50. [Google Scholar] [CrossRef]
- Różański, Jerzy, and Paweł Sekuła. 2016. Determinants of Foreign direct investment in developed and emerging markets. Dynamic Econometric Models 16: 49–64. [Google Scholar] [CrossRef]
- Sahay, Ratna, Martin Čihák, Papa N’Diaye, Adolfo Barajas, Ran Bi, Diana Ayala, Yuan Gao, Annette Kyobe, Lam Nguyen, Christian Saborowski, and et al. Rethinking Financial Deepening: Stability and Growth in Emerging Markets. IMF Staff Discussion Note 15/08. Washington: International Monetary Fund (May). Available online: https://www.imf.org/external/pubs/ft/sdn/2015/sdn1508.pdf (accessed on 1 November 2021).
- Savva, Christos S., and Nektarios Aslanidis. 2010. Stock market integration between new EU member states and the Euro-zone. Empirical Economics 39: 337–51. [Google Scholar] [CrossRef] [Green Version]
- Schmitz Weiss, Amy. 2013. Exploring news apps and location-based services on the smartphone. Journalism & Mass Communication Quarterly 90: 435–56. [Google Scholar]
- Sehrawat, Madhu, and A. K. Giri. 2015. Financial development and economic growth: Empirical evidence from India. Studies in Economics and Finance 32: 340–56. [Google Scholar] [CrossRef]
- Sims, Christopher A. 1972. Money, Income, and Causality. The American Economic Review 62: 540–52. [Google Scholar]
- Sims, Christopher A. 1980. Macroeconomics and Reality. Econometrica 48: 1–48. [Google Scholar] [CrossRef] [Green Version]
- Sims, Christopher A., and Harald Uhlig. 1991. Understanding Unit Rooters: A Helicopter Tour. Econometrica 59: 1591–99. [Google Scholar] [CrossRef] [Green Version]
- Sims, Christopher A., and Tao Zha. 1998. Bayesian Methods for Dynamic Multivariate Models. International Economic Review 39: 949–68. [Google Scholar] [CrossRef] [Green Version]
- Solow, Robert M. 1956. A Contribution to the Theory of Economic Growth. The Quarterly Journal of Economics 70: 65–94. [Google Scholar] [CrossRef]
- Stiglitz, Joseph E. 2003. Information and the Change in the Paradigm in Economics, Part 1. The American Economist 47: 6–26. [Google Scholar] [CrossRef]
- Stiglitz, Joseph E., and Bruce Greenwald. 2015. Creating a Learning Society: A New Approach to Growth, Development, and Social Progress. New York Chichester. West Sussex: Columbia University Press. [Google Scholar]
- Svirydzenka, Katsiaryna. 2016. Introducing a New Broad-Based Index of Financial Development. IMF Working papers WP/16/5. Washington, DC. Retrieved 15 October 2021. Available online: https://www.imf.org/en/Publications/WP/Issues/2016/12/31/Introducing-a-New-Broad-based-Index-of-Financial-Development-43621 (accessed on 15 November 2021).
- Sy, Amadou N., Rodolfo Maino, Alexander Massara, Hector Perez-Saiz, and Preya Sharma. 2019. Fintech in Sub-Saharan African Countries: A Game Changer? African Departmental Paper No. 19/04. Washington, DC: International Monetary Fund. [Google Scholar]
- Tsaurai, Kunofiwa. 2018. Is the complementary between education and financial development a panacea for poverty reduction? The Journal of Developing Areas 52: 227–48. [Google Scholar] [CrossRef]
- Uhlig, Harald. 1994. What Macroeconomists Should Know About Unit Roots. A Bayesian Perspective. Econometric Theory 10: 645–71. [Google Scholar] [CrossRef]
- Uhlig, Harald. 2005. What are the effects of monetary policy on output? Results from an agnostic identification procedure. Journal of Monetary Economics 52: 381–419. [Google Scholar] [CrossRef] [Green Version]
- Vukovic, Darko B., Edin Hanic, and Hasan Hanic. 2017. Financial integration in the European Union-the impact of the crisis on the bond market. Equilibrium. Quarterly Journal of Economics and Economic Policy 12: 195–210. [Google Scholar]
- World Bank. 2021. World Bank Open Data. Available online: https://data.worldbank.org (accessed on 29 November 2021).
- Woźniak, Tomasz. 2016. Bayesian vector autoregressions. Australian Economic Review 49: 365–80. [Google Scholar] [CrossRef]


| Variable | Notation | Definition | Measurement Unit | Data Source |
|---|---|---|---|---|
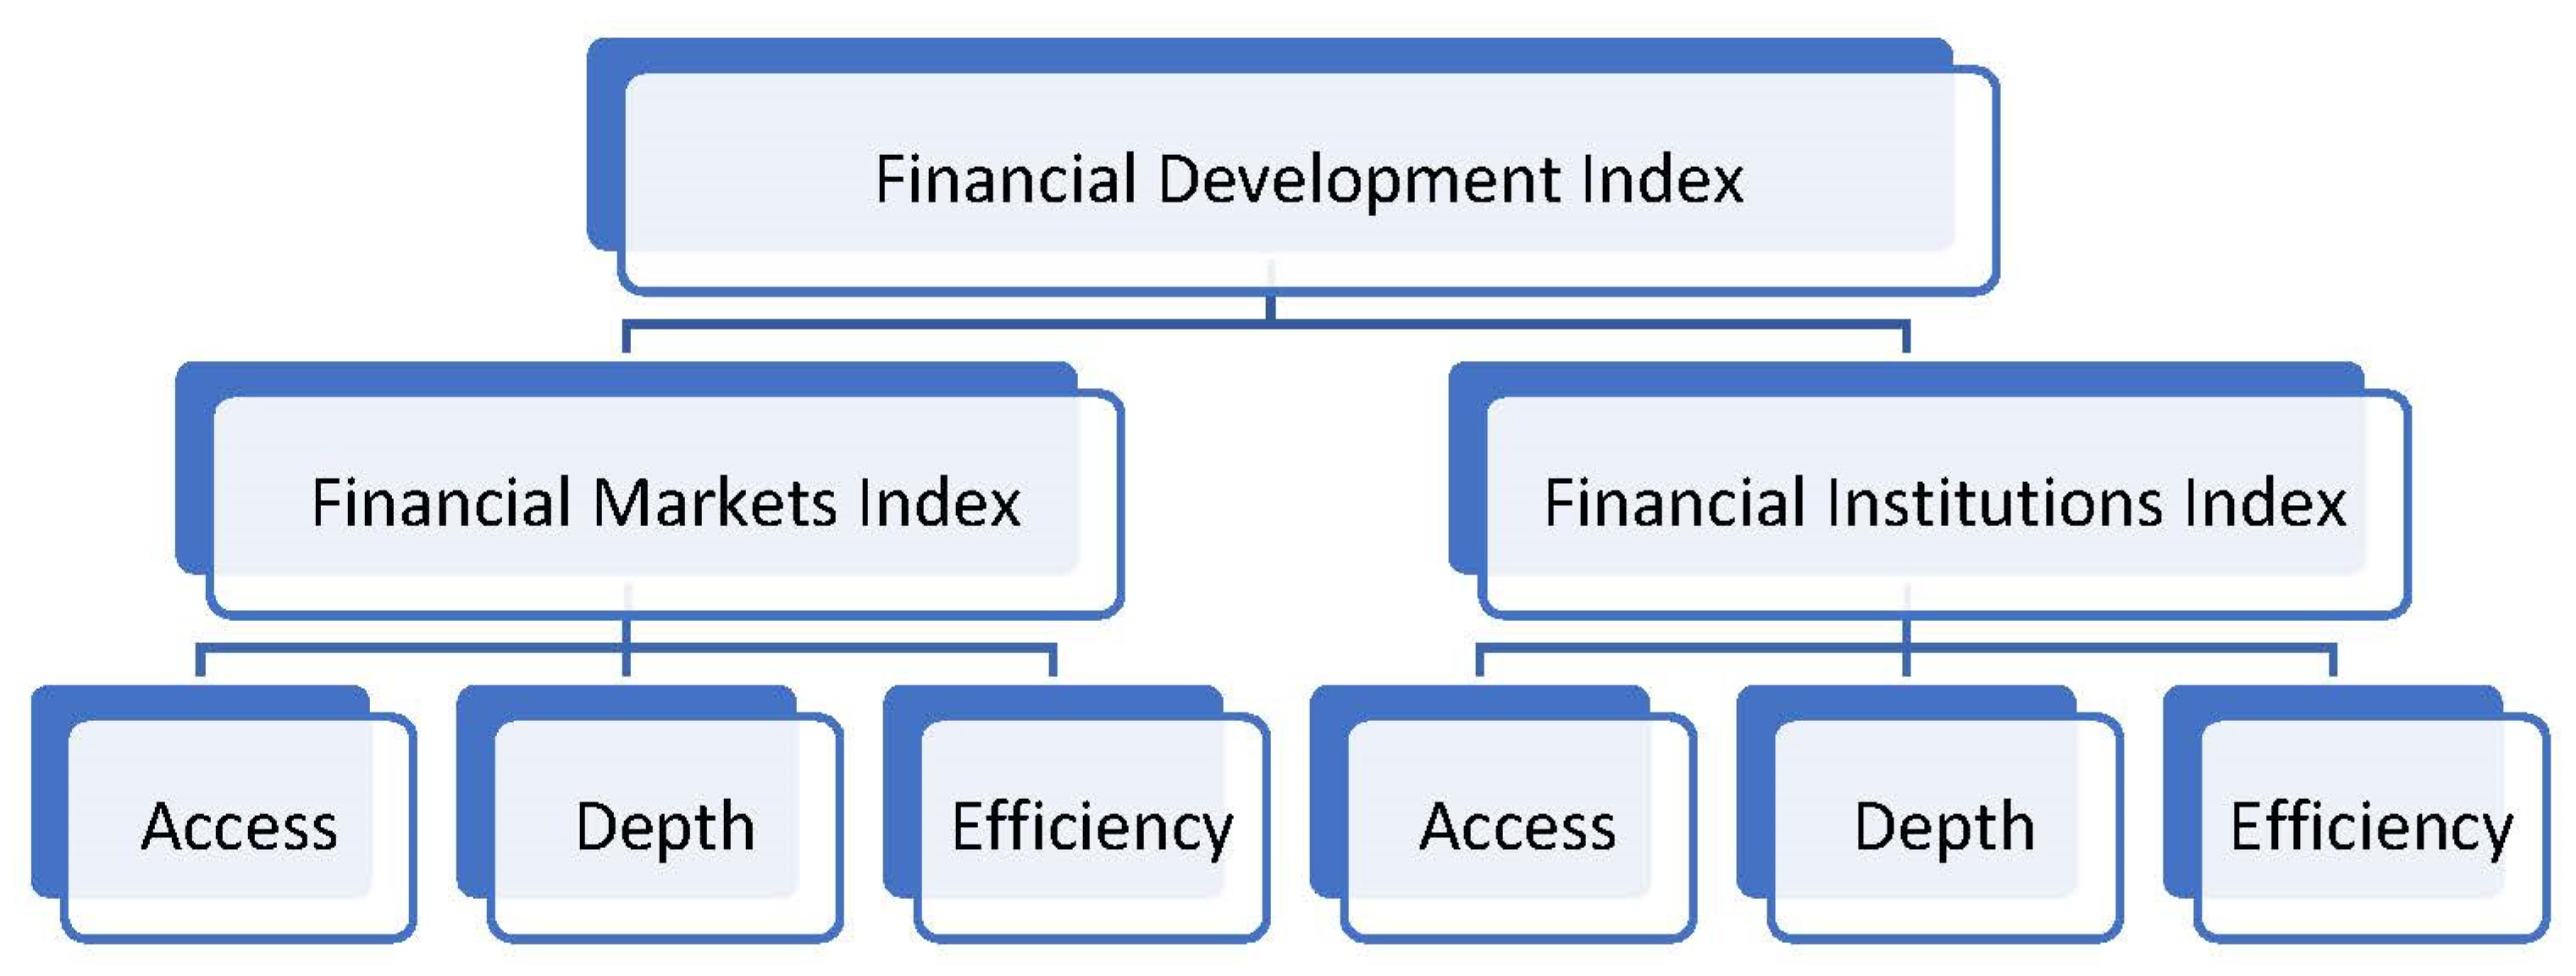
| Financial Development Index | FDI | Broad measure of a country’s financial development, built on financial institutions and markets development (Svirydzenka 2016) | Points | International Monetary Fund (IMF) |
| Financial Institutions Index | FII | Measure of a country’s level of development of its financial institutions, built on three pillars: access, efficiency, and depth (Svirydzenka 2016) | Points | |
| Financial Markets Index | FMI | Measure of a country’s level of development of its financial markets, built on three pillars: access, efficiency, and depth (Svirydzenka 2016) | Points | |
| Education Index | EDI | Calculated as the simple geometric average of two indicators: mean years of schooling and the expected years of schooling (Klugman 2011). One of the three components of the Human Development Index (HDI). | Points | United Nations Development Programme (UNDP) |
| Mobile cellular subscriptions | MOB | Mobile cellular subscriptions per 100 people | Number | World Bank (WB) |
| Unemployment rate | UNEMP | Percentage of total labor force, including all genders | % | |
| Trade openness | TRD | Ratio between trade (exports and imports) to nominal GDP | % | |
| GDP growth rate | GDP | The annual growth rate of the nominal gross domestic product. | % |
| FDI | FII | FMI | EDI | MOB | GDP | TRD | UNEMP | |
|---|---|---|---|---|---|---|---|---|
| Mean | 0.559 | 0.638 | 0.464 | 0.806 | 92.542 | 2.696 | 108.502 | 8.264 |
| Median | 0.572 | 0.658 | 0.471 | 0.812 | 106.693 | 2.738 | 89.529 | 7.185 |
| Maximum | 1.000 | 1.000 | 1.000 | 0.943 | 172.122 | 25.176 | 408.362 | 27.470 |
| Minimum | 0.109 | 0.150 | 0.017 | 0.575 | 0.075 | −14.839 | 37.496 | 1.810 |
| Standard deviation | 0.205 | 0.181 | 0.265 | 0.076 | 43.615 | 3.437 | 60.659 | 4.328 |
| Skewness | −0.170 | −0.260 | −0.144 | −0.349 | −0.740 | −0.423 | 2.061 | 1.353 |
| Kurtosis | 2.156 | 2.326 | 1.978 | 2.385 | 2.496 | 9.452 | 8.319 | 5.146 |
| Variables and Testing Levels | Levin, Lin, and Chu t * | Breitung t-Stat | Im, Pesaran, and Shin W-Stat | ADF—Fisher Chi-Square | PP—Fisher Chi-Square | |
|---|---|---|---|---|---|---|
| FDI | Level | −0.950 | 2.257 | −1.101 | 88.847 ** | 192.908 |
| First difference | −5.586 * | −6.430 * | −9.780 * | 214.534 * | 919.438 * | |
| FII | Level | 0.230 | 2.836 | 1.356 | 68.004 | 91.372 ** |
| First difference | −5.809 * | −8.439 * | −8.369 * | 187.723 * | 860.064 * | |
| FMI | Level | −2.341 * | −0.329 | −3.476 | 111.853 | 265.717 |
| First difference | −7.531 * | −5.513 * | −11.261 * | 241.574 * | 788.285 * | |
| EDI | Level | −3.479 * | 4.353 | −0.662 | 87.546 ** | 98.1608 * |
| First difference | −7.214 * | −7.152 * | −6.848 * | 161.738 * | 328.763 * | |
| MOB | Level | −6.198 * | 4.262 | 0.718 | 60.128 | 15.935 |
| First difference | −7.326 * | −9.622 * | −8.070 * | 177.381 * | 188.142 * | |
| GDP | Level | −8.109 * | −9.910 * | −6.035 * | 143.820 * | 194.639 * |
| First difference | −15.809 * | −18.535 * | −16.696 * | 346.831 * | 1979.91 * | |
| TRD | Level | −3.124 * | −3.108 | −4.027 | 118.732 | 86.397 ** |
| First difference | −12.980 * | −11.163 * | −10.274 * | 217.018 * | 769.114 * | |
| UNEMP | Level | −3.239 * | −4.224 | −4.265 | 122.789 | 36.958 |
| First difference | −4.947 * | −8.518 * | −5.373 * | 132.23 * | 153.858 * | |
| Null Hypothesis: Variable on the Line Does Not Homogeneously Cause Variable on the Column | ||||||||
|---|---|---|---|---|---|---|---|---|
| FDI | FII | FMI | EDI | MOB | GDP | TRD | UNEMP | |
| FDI | -- | -- | -- | −0.097 | 2.355 ** | 9.444 * | 0.720 | 1.893 |
| FII | -- | -- | -- | −0.729 | 2.227 ** | 7.013 * | 2.179 ** | 1.503 |
| FMI | -- | -- | -- | −0.263 | 7.260 * | 4.943 * | 0.576 | 1.263 |
| EDI | 2.915 * | 2.051 ** | 1.473 | -- | 2.616 * | 8.302 | −0.020 | −0.895 |
| MOB | 4.080 * | 6.536 * | 2.596 * | 2.674 * | -- | 2.214 ** | 0.768 | 0.036 |
| GDP | 0.808 | 0.513 | −0.16 | 1.667 | 0.089 | -- | 1.214 | −0.293 |
| TRD | 0.136 | −0.877 | 0.557 | 2.069 ** | 0.959 | 21.009 * | -- | 1.379 |
| UNEMP | 0.369 | −0.441 | −0.837 | 0.555 | 0.809 | 26.973 * | 4.800 * | -- |
| FDI | FII | FMI | EDI | MOB | GDP | TRD | UNEMP | |
|---|---|---|---|---|---|---|---|---|
| FDI | 1.000 | |||||||
| FII | 0.546 * | 1.000 | ||||||
| FMI | 0.747 * | 0.028 | 1.000 | |||||
| EDI | 0.186 * | 0.161 * | 0.085 * | 1.000 | ||||
| MOB | 0.196 * | 0.176 * | 0.111 | 0.270 * | 1.000 | |||
| GDP | 0.143 * | 0.145 * | 0.057 | 0.120 * | 0.189 * | 1.000 | ||
| TRD | 0.091 * | −0.024 | 0.069 | 0.019 | 0.103 * | −0.145 * | 1.000 | |
| UNEMP | −0.087 * | −0.052 | −0.030 | −0.030 | −0.060 | −0.350 * | −0.152 * | 1.000 |
| Root | Modulus | Root | Modulus | Root | Modulus |
|---|---|---|---|---|---|
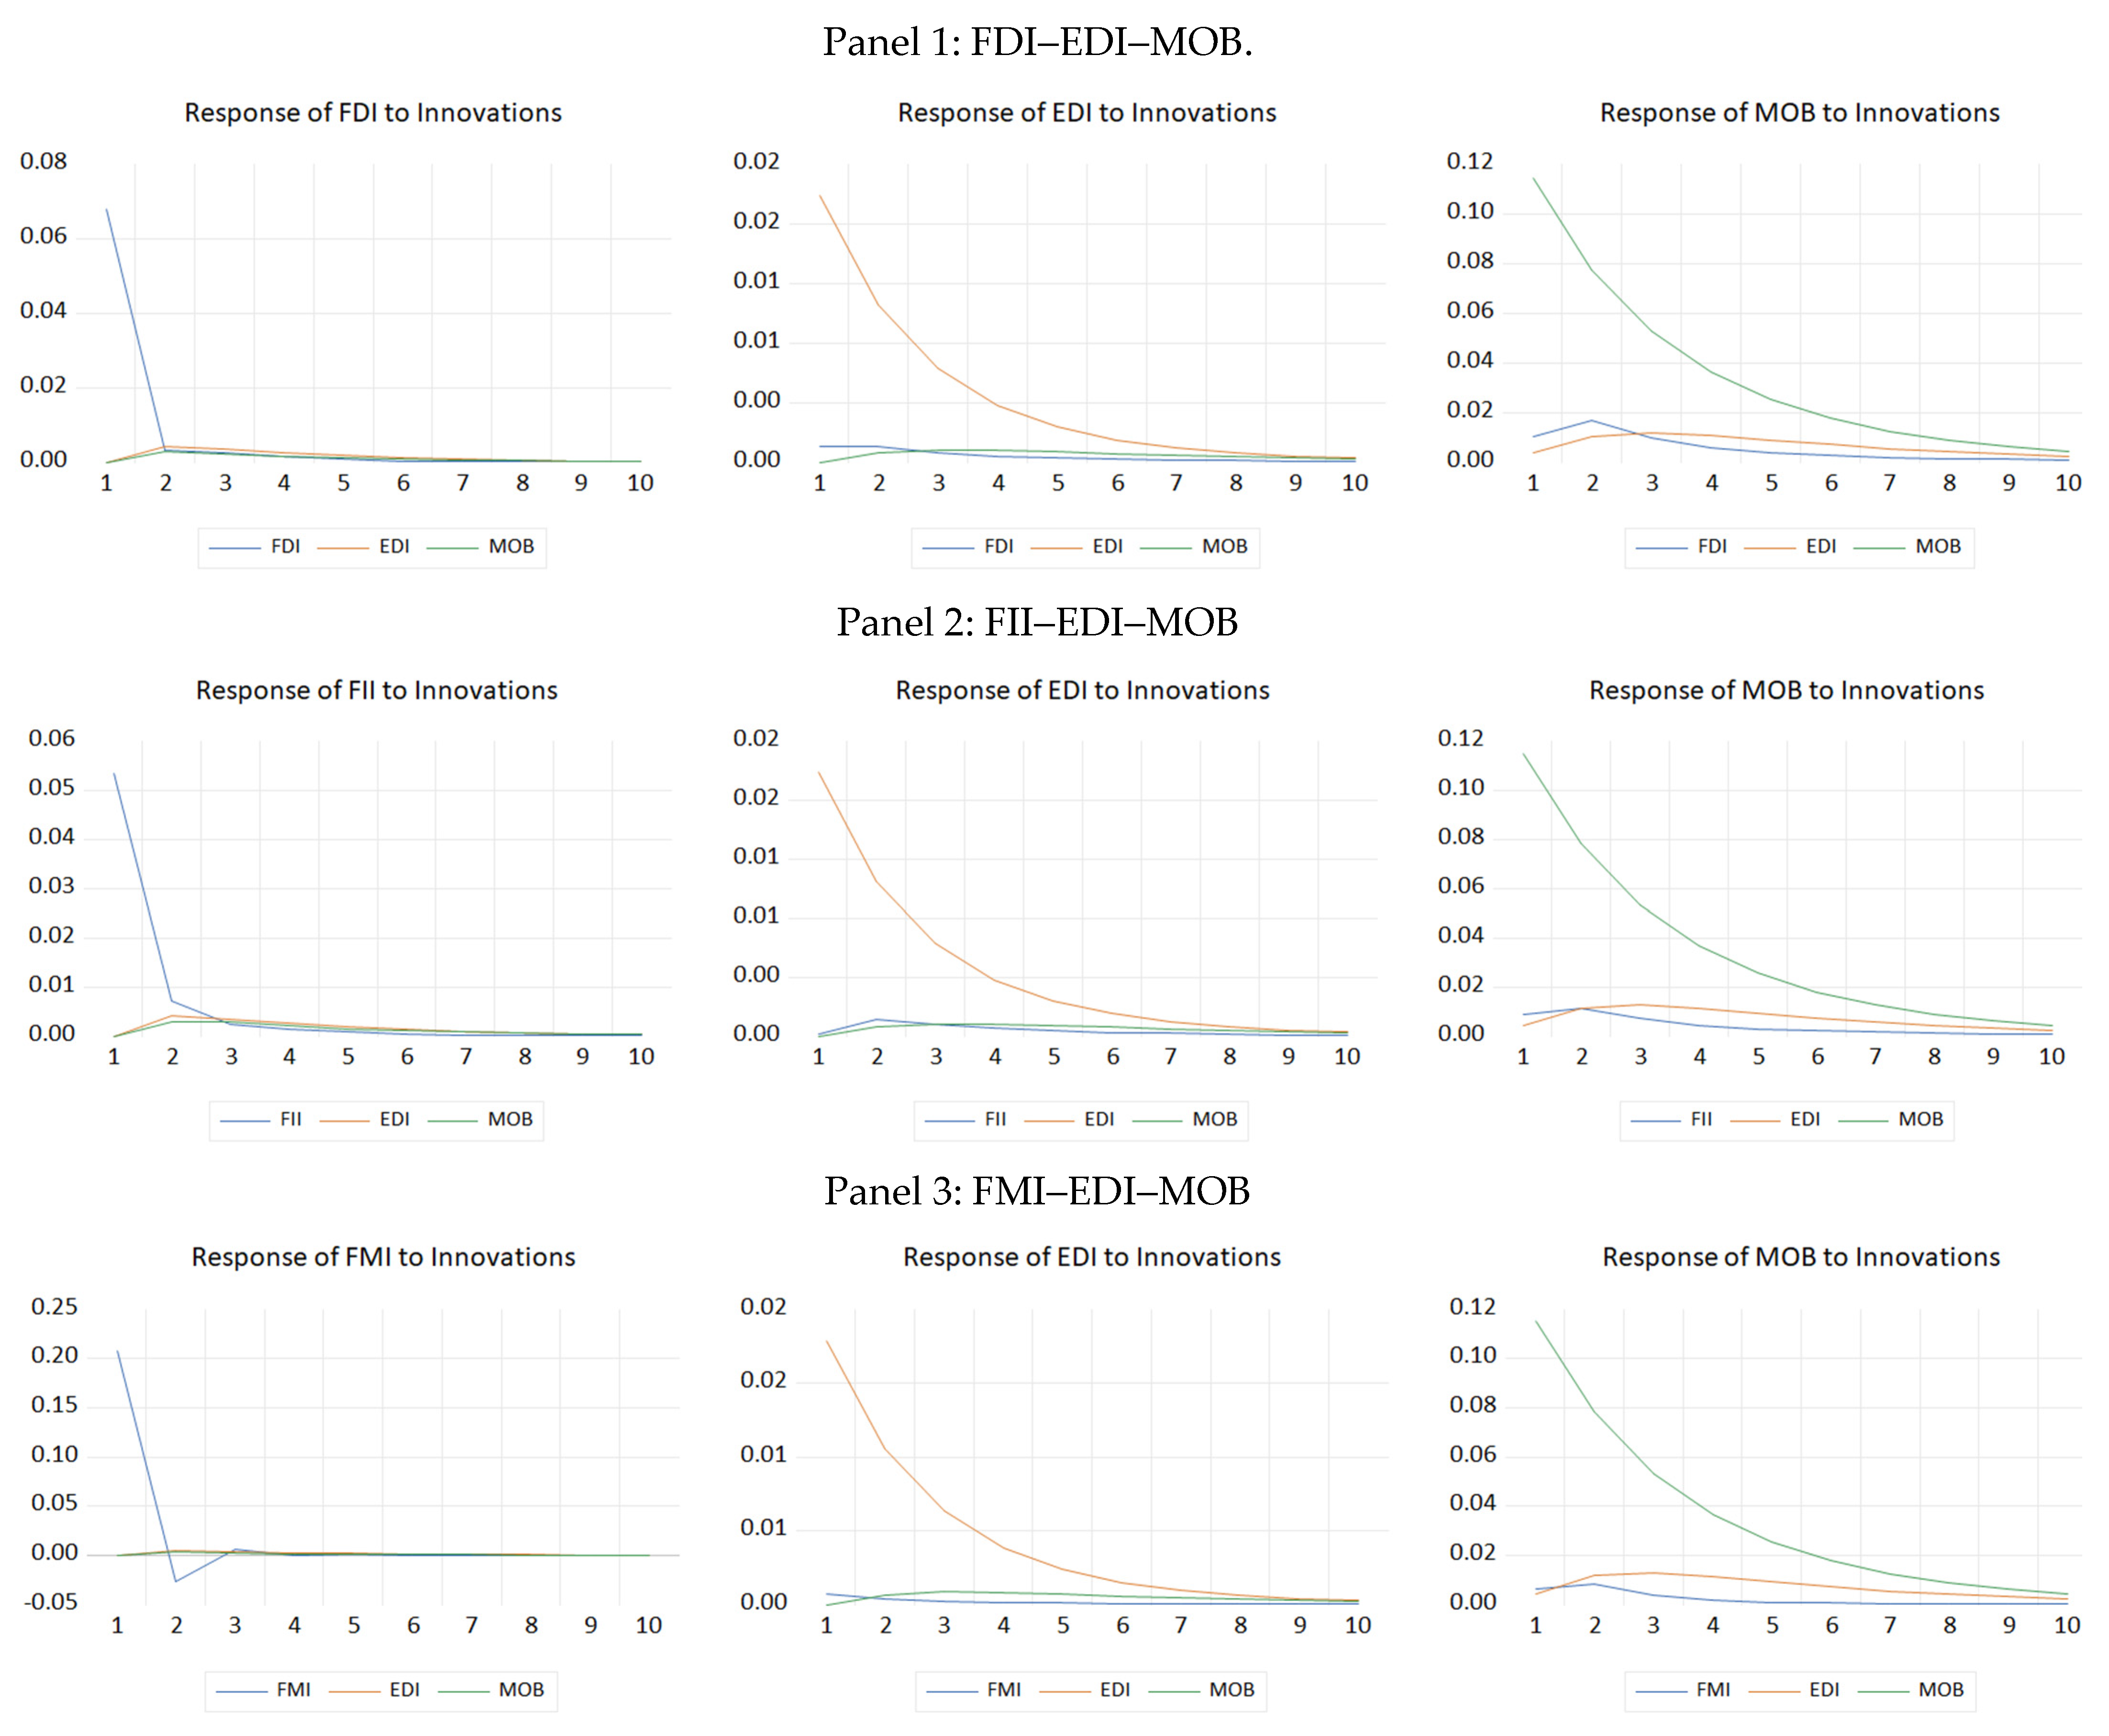
| Panel 1: FDI-EDI-MOB | Panel 2: FII-EDI-MOB | Panel 3: FMI-EDI-MOB | |||
| 0.690289 | 0.690289 | 0.692009 | 0.692009 | 0.691215 | 0.691215 |
| 0.278061 − 0.231077i | 0.361545 | 0.261162 − 0.232734i | 0.349815 | 0.299314 − 0.255403i | 0.393471 |
| 0.278061 + 0.231077i | 0.361545 | 0.261162 + 0.232734i | 0.349815 | 0.299314 + 0.255403i | 0.393471 |
| 0.160820 | 0.160820 | 0.171515 − 0.050995i | 0.178936 | −0.144354 | 0.144354 |
| 0.090574 | 0.090574 | 0.171515 + 0.050995i | 0.178936 | 0.132559 | 0.132559 |
| −0.034033 | 0.034033 | −0.000609 | 0.000609 | 0.071673 | 0.071673 |
| No root lies outside the unit circle. | No root lies outside the unit circle. | No root lies outside the unit circle. | |||
| VAR satisfies the stability condition. | VAR satisfies the stability condition. | VAR satisfies the stability condition. | |||
Publisher’s Note: MDPI stays neutral with regard to jurisdictional claims in published maps and institutional affiliations. |
© 2022 by the authors. Licensee MDPI, Basel, Switzerland. This article is an open access article distributed under the terms and conditions of the Creative Commons Attribution (CC BY) license (https://creativecommons.org/licenses/by/4.0/).
Share and Cite
Horobet, A.; Mnohoghitnei, I.; Zlatea, E.M.L.; Belascu, L. The Interplay between Digitalization, Education and Financial Development: A European Case Study. J. Risk Financial Manag. 2022, 15, 135. https://doi.org/10.3390/jrfm15030135
Horobet A, Mnohoghitnei I, Zlatea EML, Belascu L. The Interplay between Digitalization, Education and Financial Development: A European Case Study. Journal of Risk and Financial Management. 2022; 15(3):135. https://doi.org/10.3390/jrfm15030135
Chicago/Turabian StyleHorobet, Alexandra, Irina Mnohoghitnei, Emanuela Marinela Luminita Zlatea, and Lucian Belascu. 2022. "The Interplay between Digitalization, Education and Financial Development: A European Case Study" Journal of Risk and Financial Management 15, no. 3: 135. https://doi.org/10.3390/jrfm15030135
APA StyleHorobet, A., Mnohoghitnei, I., Zlatea, E. M. L., & Belascu, L. (2022). The Interplay between Digitalization, Education and Financial Development: A European Case Study. Journal of Risk and Financial Management, 15(3), 135. https://doi.org/10.3390/jrfm15030135