Article

Grocery Apps and Consumer Purchase Behavior: Application of Gaussian Mixture Model and Multi-Layer Perceptron Algorithm

by
Aidin Salamzadeh
1,
Pejman Ebrahimi
2,*,
Maryam Soleimani
3 and
Maria Fekete-Farkas
4,*
1
Department of Business Management, Faculty of Management, University of Tehran, Tehran 141556311, Iran
2
Doctoral School of Economic and Regional Sciences, Hungarian University of Agriculture and Life Sciences (MATE), 2100 Gödöllő, Hungary
3
Department of Management, Economics and Accounting, Payame Noor University, Tehran 1599959515, Iran
4
Institute of Agricultural and Food Economics, Hungarian University of Agriculture and Life Sciences (MATE), 2100 Gödöllő, Hungary
*
Authors to whom correspondence should be addressed.
J. Risk Financial Manag. 2022, 15(10), 424; https://doi.org/10.3390/jrfm15100424
Submission received: 29 August 2022 / Revised: 20 September 2022 / Accepted: 21 September 2022 / Published: 23 September 2022
(This article belongs to the Special Issue Entrepreneurship and Business Models in the Digital Era)

Abstract

:
The purpose of this study is to investigate and compare the popularity of common grocery apps in Hungary as well as Iran. The data were gathered from Iranian and Hungarian users who had at least one online purchase experience using a grocery app. A Gaussian mixture model (GMM) and multi-layer perceptron (MLP) are used as supervised and unsupervised machine learning algorithms with Python programming to cluster customers and predict consumer behavior. The results revealed that Wolt in Hungary and Snappfood in Iran are the most popular grocery apps. Users in Iran are divided into three groups of users of app services and the type of full covariance has higher accuracy compared to the other three types (96%). Meanwhile, we found that the five apps used in Hungary have provided 95% accuracy from the users’ point of view based on the diagonal covariance. The MSE value (overfitting and cross-validation) is less than 0.1 in the MLP algorithm, which shows an acceptable amount of error. The results of overfitting indicate the proper fit of the MLP model. The findings of this study could be important for managers of online businesses. In the clustering section, the accuracy and value of consumer demographic information have been emphasized. Additionally, in the classification and prediction section, a kind of “customization” has been performed with an emphasis on market segmentation. This research used GMM and MLP machine learning algorithms as a creative way to cluster and classify consumers.

1. Introduction

The usage of the internet and cell phones for commercial reasons between firms and individuals (B2C) has been quickly increasing around the world, as customers gain confidence in receiving the intended goods and in the payment transaction (de Magalhães 2021). The grocery and food retailing industry is no exception, as it has seen an unexpected increase in consumer base and expenditure on grocery products via online platforms (Sreeram et al. 2017). According to market surveys, an increasing number of smartphone users and a growing number of young professionals are driving this change (Sreeram et al. 2017). The rise of mobile food shopping is a worldwide phenomenon (Kim 2021).
With a turnover of USD 2 billion in 2021, Hungary is the 53rd largest e-commerce market, ahead of Kenya and behind Qatar. The Hungarian e-commerce market grew by 23 percent in 2021, contributing to a global growth rate of 29 percent. E-commerce sales are continuing to rise. Between 2010 and 2021, Hungary’s share of online shoppers increased considerably (Fekete-Farkas et al. 2021). By 2021, over 71% of consumers would have done their shopping online. By 2025, the number of e-commerce users in Hungary is predicted to increase by 9% to 6 million (Statista 2022). Emag.hu is the largest player in the Hungarian e-commerce market. In 2021, the store brought in USD 253 million in revenue. Alza.hu has a revenue of USD 114 million, whereas tesco.hu has a revenue of USD 106 million. The top three stores in Hungary collectively account for 25% of all online income. As people purchase things using their mobile phones, smartphone apps have become a significant platform for them (Bruwer et al. 2021). According to similarweb.com, the top food and drink apps in Hungary in 2021 were Foodpanda, Wolt, Cookpad, McDonald’s, and BURGER KING. There were some forecasts for the internet retail market in Iran for the years 2022–2025. By the end of 2022, e-commerce revenue is predicted to exceed USD 16,058 million. According to a Shoponlina.com analysis, revenue is expected to grow at a CAGR of 28.86 percent from 2022 to 2025, resulting in a market volume of USD 34,361 million by 2025.
In recent years, Iran has seen an increasing trend in the sphere of e-commerce. Iran has the second-largest online purchasing sector among the top ten emerging economies, according to a UNCTAD assessment from 2019. According to the survey, Iran is ranked 42nd out of 152 nations in terms of e-commerce, up seven places from the previous year. Furthermore, according to recent reports from the Iranian Electronic Payments Corporation (Shaparak), electronic financial transactions in the country totaled nearly USD 23 billion in 2022, up roughly 25% from 2021 figures. More than 87 percent of these transactions included Iranian consumers purchasing products and services directly. Furthermore, according to a survey by the International Telecommunication Union, the number of smartphone users in Iran has increased dramatically in recent years. The most recent figure for 2020 is 127.62 million members, an increase of 8% over 2019. Iran is currently rated 12th out of 144 nations in this category. Fidilo, Snappfood, Jimomarket, Digikala, Delino are the top e-commerce businesses in Iran.
The most popular online food or grocery applications in Iran are Mrtaster, Rayhoon, and Chilivery. Because people are becoming more reliant on mobile technology, retailers and manufacturers must grasp the function of mobile devices in purchasing as well as consumer attitudes toward app adoption in the retail setting (Llorens and Hernández 2021). Several grocery stores have attempted to obtain a competitive advantage through online grocery retailing by attracting customers eager to buy food online (Kureshi and Thomas 2019). Customers can use retailer apps to acquire product information, compare products, buy, share information on social networks, redeem coupons, and locate stores, among other things (Flacandji and Vlad 2022). Customers enjoy some of these apps more than others. Retailers are investing a tremendous amount of money into mobile shopping to capitalize on its growing popularity (Bruwer et al. 2021). Several grocery stores have attempted to obtain a competitive advantage through online grocery retailing by attracting clients who were willing to purchase groceries online. From a business standpoint, online media offers various advantages as a distribution channel, including better accessibility, greater ease, and time savings (Kureshi and Thomas 2019).
A review of past studies shows that several researchers have investigated the factors influencing the acceptance of online apps by consumers in online grocery retailing (de Magalhães 2021; Fagerstrøm et al. 2020; Driediger and Bhatiasevi 2019; Hallikainen et al. 2022). Additionally, other industries (Andati et al. 2022) have been paying attention. In online retail, various apps have been provided by retail business owners in different countries, and there is fierce competition between them to gain more market share.
In today’s highly competitive environment, business managers are forced to move towards entrepreneurship and use strategies to differentiate their business models. Entrepreneurship is the process of launching a new venture or recombining the existing production model (Yi et al. 2022). In this direction, making special and user-friendly changes in grocery apps is considered one of the entrepreneurial and necessary actions. Therefore, businesses should focus on the most popular grocery apps in different countries and examine their unique features. Based on past studies, many variables can affect consumers’ acceptance and willingness to use grocery apps. However, it is obvious that the most important factors affecting the choice of consumers have a higher priority, and these factors can be identified in the most popular grocery apps.
In this research, identifying the most popular grocery apps in the two countries of Iran and Hungary can guide marketers and managers active in online grocery retailing in identifying the most important preferences of consumers in choosing grocery apps.
In Hungary and Iran, there are a variety of grocery apps, but their popularity is not comparable. Examining consumers’ preferences for utilizing grocery apps can aid in the development of relevant marketing tactics to assist these applications in gaining market share. To establish successful tactics, marketers must consider consumer preferences. The goal of this research is to look into and compare the popularity of popular grocery applications in Hungary and Iran.

2. Literature Review

2.1. Consumer Purchase Behavior

Recent breakthroughs in the field of IS, as well as the emergence of Web 2.0 technologies, have opened up new possibilities for electronic commerce (Maia et al. 2018). Online shopping is getting more popular, with sales increasing year after year (Dharmesti et al. 2019; Horst et al. 2021). People have begun to shop more online, a tendency that began before the pandemic and has subsequently accelerated (Baarsma and Groenewegen 2021; Ebrahimi et al. 2021a). More consumers are turning to e-commerce to meet their grocery needs as a result of the pandemic, and this trend is projected to continue beyond the pandemic (Altay et al. 2022). From exposure to attitude to purchase intention, mobile grocery shopping behavior is a consumer’s decision-making process (Kim 2021). In past research, the behavior of online consumers in accepting and using mobile applications has been investigated. For example, Pandey et al. (2021) emphasized the importance of convenience, aggressive discounts, app service quality, fulfillment, and multiple payment options. They have been confirmed as key factors in the adoption of food delivery apps. Additionally, the results of the research of Tandon et al. (2021) have shown that the attitude of consumers directly affects the desire to buy through food delivery apps. Andati et al. (2022) has also introduced farmers’ entrepreneurial orientation as a factor with different effects on climate-smart agriculture (CSA) adoption. Additionally, they showed that other important factors in the adoption of CSA are gender, land size, trust in extension officers, household income, and farm characteristics. Hsu and Tang (2020) have also examined the key factors affecting mobile app stickiness.
Consumer behavior in online grocery buying has been studied in the past. The research in (Bruwer et al. 2021) analyzed the important aspects that influence grocery shopping adoption. Similarly, (Sreeram et al. 2017) employed an integrated model to investigate online grocery purchase intent and (Segovia et al. 2021) explored if the severity of the COVID-19 pandemic affected customer preferences for grocery shopping. According to the findings of (Kim 2021), South Korean consumers have positive sentiments toward mobile grocery shopping and other people’s opinions may affect their decision to utilize the services. The research in (Chakraborty 2019) investigated Indian shoppers’ attitudes toward grocery shopping apps, finding that attitude, perceived behavioral control, perceived usefulness, and perceived simplicity of use all have a positive and significant impact on intention. Subjective norms, on the other hand, do not affect intention. Additionally, (Chakraborty et al. 2022) looked at the underlying elements that influence a consumer’s behavioral intention (BI) to use and accept grocery apps and (Singh et al. 2021) analyzed the antecedents of customer happiness and patronage intentions in the setting of e-grocery retailing via mobile applications.
The results of research that is handled by Fagerstrøm et al. (2020), showed that Internet of Things (IoT) services such as updated expiry date, aggregated national customer experience index, and personalized offers based on the product in the basket are among the important factors that increase the likelihood of purchasing in retail and increases grocery shopping. Meanwgile, Hallikainen et al. (2022) also emphasized the importance of personalized price promotions as an effective online marketing tool to facilitate consumer decision-making in online retail. Driediger and Bhatiasevi (2019) in Thailand have also shown that the factors of perceived ease of use, perceived usefulness, intention to use, subjective norm, and perceived enjoyment have a significant effect on the acceptance of online grocery shopping. Furthermore, de Magalhães (2021) has also examined the importance of factors that influence the final consumer’s decision in online grocery shopping.
Likewise, Rinaldi et al. (2022) also showed that online delivery services can increase the availability and promotion of many unhealthy products. The review of the literature shows that past research has investigated the factors affecting the behavior of online consumers in the field of online apps in the retail industry as well as other industries, but there has been few past studies on the identification and comparison of the most popular online apps, especially grocery apps, which are of interest.
In this research, the existing research gap has been considered by examining the most popular grocery apps in the two countries of Iran and Hungary.

2.2. Grocery Shopping Mobile Apps

Modifications in technology, and hence consumer habits, have increased online purchasing (Garcia et al. 2020). In growing regions, social media marketing, startups, and various web tools are increasingly important (Bouzari et al. 2021). In the midst of the new normal brought on by the coronavirus disease 2019 (COVID-19), mobile grocery shopping apps have become a lifeline for many consumers who have chosen to shop safer (Bruwer et al. 2021). Due to imposed social distancing norms and limits on physical movement, online food, and grocery applications, as well as local grocery businesses, were sought (Menon et al. 2022). Grocery delivery services provide clients with immediate delivery of groceries and other commodities via an app that allows users to order and pay for things using secure payment methods from the comfort of their own homes (Altay et al. 2022).
The rise of e-commerce (based on new media and online platforms) and, in particular, the introduction of online stores by traditional brick-and-mortar merchants (i.e., omnichannel retailing) has been one of the most disruptive advances in the area of marketing in recent decades (Ilyuk 2018; Khajeheian and Ebrahimi 2021). Because of their capacity to create a unique and satisfying user experience and help marketers win the war on the small-screen share, mobile applications are quickly becoming the most powerful digital marketing tools (Mondal and Chakrabarti 2021). Online grocery shopping, often known as online grocery shopping, is a type of e-commerce that allows private individuals and corporations to purchase groceries and other household necessities from a variety of firms (Driediger and Bhatiasevi 2019). The term “mobile grocery shopping applications” refers to a system of mobile applications (Al Amin et al. 2022).
Grocery apps, with their simple registration process, product listings, rapid shopping lists, real-time order tracking, and a variety of filters, meet the needs of customers, ensuring a pleasant shopping experience (Chakraborty et al. 2022). Customers can order a variety of grocery items and have them delivered to their homes (Al Amin et al. 2022). Consumer views in the context of e-grocery retailing using mobile applications have been studied previously (Chakraborty 2019; Kim 2021).

2.3. Application of Machine Learning in e-Commerce

Two of the most widely utilized AI approaches are machine learning and deep learning. These models are used by individuals, organizations, and government agencies to anticipate and learn from data (Ebrahimi et al. 2022b, 2022d; Pallathadka et al. 2021) Virtual assistance solutions are powered by machine learning, which combines numerous deep learning models to give appropriate context and analyze spoken speech. We can now live happier, healthier, and more productive lives thanks to machine learning (Jagtap et al. 2022).
Data are often consumed and processed by machine learning algorithms to learn relevant patterns about individuals, corporate processes, transactions, events, etc. (Sarker 2021). E-commerce companies began to plan to develop intelligent customer care teams and to achieve the effect of customer service and user communication by using machine learning algorithms to replicate people’s thinking. The popularity of deep learning technology has accelerated the development of intelligent customer support teams in e-commerce (Zhou 2020). In e-commerce enterprises, machine learning (ML) is critical for fraud detection, prevention, and mitigation. Microsoft, LinkedIn, and eBay are well-known examples (Tax et al. 2021).

3. Methodology

Machine learning is divided into two different approaches: a. supervised learning algorithms (such as k-nearest neighbors, decision tree, stochastic gradient descent, naïve bayes, support vector machines (SVRs), neural network models, etc.) and b. unsupervised learning algorithms (k-means, mean shift, hierarchical, DBSCAN, BIRCH, Gaussian mixture model, support vector machines (SVCs), etc.). The following are the various stages of the present investigation included in the machine learning approach (Ebrahimi et al. 2022c):
(1).
Import the data;
(2).
Data preprocessing;
(3).
Split the data into training and testing data;
(4).
Create a model;
(5).
Train the model;
(6).
Model clustering/Model prediction;
(7).
Accuracy of the model.

3.1. Gaussian Mixture Model Algorithm

A Gaussian mixture model (GMM) is a probabilistic model for data clustering that considers all data points to be derived from a mixture of a finite Gaussian distribution with unknown parameters. The commonly used clustering approaches, such as k-means and fuzzy c-means, are distance based. While GMM is based on a probability model rather than an objective function of distance measures. GMM assumes that the dataset follows a mixture model of probability distributions so that each cluster is represented by a parametric probability density and the entire cluster structure can be modeled by a finite mixture (Ni et al. 2020). Mathematically, GMM is defined as a parametric probability density function that can be represented as a weighted sum of k Gaussian components. Each component is characterized by a simple parametric form. The GMM can be written as (Equation (1)),
p M   ( x ) = i = 1 k i   p ( x | μ i ,   Σ i )
where p ( x | μ i ,   Σ i ) is known as the j-th components of the mixture with μi and Σi, and i is called the mixture coefficient and must satisfy 0 i 1   together with i = 1 k i = 1 .
In GMM, the probability density function is Gaussian distribution defined as follows (Equation (2)),
p ( x ) = 1 ( 2 π ) d / 2 [ Σ ] 1 / 2 e 1 2 ( x μ ) T 1 ( x μ )

3.2. Multi-Layer Perceptron Algorithm

An artificial neural network (ANN) is a sophisticated system that functions in a manner close to the human brain and its nervous system (Desai and Shah 2021). ANNs are warning devices containing layers of computing nodes with extraordinary information processing characteristics. They are capable to sense nonlinearities that are not unequivocally originated as inputs and assembling them capable of learning and malleability. They acquire high parallelism, stoutness, simplification, and noise lenience, which make them capable of clustering, function approximation, forecasting, association, and performing particularly parallel multifactorial analysis for modeling complex patterns, where there is little a priori knowledge (Rana et al. 2018). Multi-layer perceptrons (MLPs) are regarded as the most practical and widely used ANNs, compared to the other types. The backpropagation algorithm is utilized for training MLPs, and they are known as feedforward neural tools and general approximators. Through the use of computational units termed “neurons,” MLPs are approximately able to anticipate each input–output PlanX (Xu et al. 2022).

3.3. Sample and Data Collection

In this research, the statistical population comprised Iranian and Hungarian users on online social platforms who made a minimum of one purchase online from grocery apps. The questionnaire was used to obtain information on the demographic data (sex, education, age, experience with online purchases, and experience with using grocery apps).
First, the demographic questionnaire of the present study was prepared with the help of Google Forum as an online link. The questionnaire was prepared as two separate links in both Hungarian and Persian languages. The questionnaire link in Iran was shared through online social media platforms such as Instagram and WhatsApp, and 349 completed questionnaires were received through the Google Forum panel in total. In Hungary, the questionnaire was shared through the Facebook platform and by posting links in the available Facebook groups, and 366 completed questionnaires were received in total. The reason for sharing the questionnaire on the mentioned platforms was their popularity and applicability. In Hungary, according to the authors’ experience, the use of Facebook is much higher than other online social platforms and has a better response rate. In Iran, however, the Instagram platform is very popular and data collection is done through this media with higher speed and quality. The WhatsApp platform is also very popular in Iran. It is also interesting to note that in Iran, the Facebook platform is filtered by the government and there is no possibility of direct access to this media, so the researchers avoided sharing the questionnaire link in this media in Iran. Telegram media is also filtered in Iran, and despite the high popularity of this media in Iran, the sharing of questionnaires in this media was stopped. Finally, all the received data are translated into English in the form of two separate files and used in the analysis.
In the current investigation, data are gathered by the convenience sampling approach, whereas this is a widespread method in quantitative research to eliminate bias (Alshurideh et al. 2020; Ebrahimi et al. 2021b). Besides, the common method bias (CMB) test (Podsakoff et al. 2003) is applied here.
In the sample from Iran, 50.4% of the respondents were men and 49.6% of the respondents were females. These statistics were 44.5% for men and 55.5% for women in Hungary. Additionally, in terms of education in the sample related to Iran, a plurality of the respondents (37.5%, 131 users) had a bachelor’s degree, and 34.1% of the respondents (119 users) had a diploma or lower. In the Hungarian sample, the number of respondents with a diploma (38%) or lower was higher, followed by a bachelor’s degree (34.2%) in second place.
In terms of age, the highest frequency of age in Iran was 30 years old (9.5% of respondents) and in Hungary, 22 years old (11%) had the highest frequency. In general, in Iran, 37.8% of respondents were aged 30 years old or younger, and in Hungary, this figure was 39.9%. In terms of online shopping experience from grocery apps in Iran, 45.6% of respondents have used these services for at least 2 years. In Hungary, 23.5% of respondents have been using the online shopping services from grocery apps for at least 4 years. In Iran, Snappfood is 78.5% popular with respondents and has been the most popular app. In Hungary, Wolt was 63.1% more popular than its competitors, followed by Foodpanda with 22.1%. Figure 1 and Figure 2 also share interesting information in the form of pair plots and comparisons of demographic information.

4. Results

In this research, the GMM algorithm was used to cluster grocery apps in Iran and Hungary. Respondents were examined in terms of demographic characteristics such as age, education, gender, experience with online purchases, and experience with using grocery apps.
The accuracy of the model was evaluated in both algorithms. We used the GMM model to cluster different grocery apps in Iran and Hungary. In the case of the GMM algorithm, data preprocessing was initially performed on the input data, and the data did not have a problem with missing data values. In the next step, the first model was created and fitted with the data. The GMM model in terms of covariance (full, tied, diagonal, spherical) has four different types, and according to Figure 1 and Figure 2, the accuracy of the model has been examined with all four types.
Code 1. Model accuracy based on covariance type in GMM algorithm:
test_accuracy = []
train_accuracy = []
covariance_type = []
for i in [“full”, “tied”, “diag”, “spherical”]:
 model = GaussianMixture(covariance_type = i, n_components = 3 #5, random_state = 0)
 model.fit(x_train, y_train)
 y_predict = model.predict(x_test)
 score = accuracy_score(y_test, y_predict)
 test_accuracy.append(model.score(x_test, y_test))
 train_accuracy.append(model.score(x_train, y_train))
 covariance_type.append(i)
Figure 1 shows that users in Iran are divided into three groups of users of app services and the full covariance has higher accuracy than the other three types (96%). However, both diagonal and tied covariances have provided more than 90% accuracy, which is acceptable. Looking at Figure 2, we find that the five apps used in Hungary have provided 95% accuracy from the users’ point of view based on the diagonal covariance, and the other types of covariance provided lower accuracy for the Hungarian data. In general, the classification of apps in both Hungary and Iran was performed with acceptable accuracy. The results confirmed that the high popularity of Wolt app in Hungary and the Snappfood app in Iran can be accepted with high accuracy.
In the next step, we used the MLP model to predict consumer behavior based on different grocery apps in Iran and Hungary. The data were fitted to the model in the form of testing and training data. The model was trained to be able to make predictions based on consumer demographic information.
Code 2. Prediction based on MLP model
model = MLPRegressor(hidden_layer_sizes = (30, 40), activation = ‘relu’, solver = ‘adam’)
model.fit(x, y)
prediction = model.predict([[1, 3, 39, 5, 3], [2, 3, 20, 2, 2]])
For example, two random data were tested to perform the prediction model. Two identical test data were tested for both Iran and Hungary. Data with codes [1, 3, 39, 5, 3], [2, 3, 20, 2, 2] were presented to the model in [“Gender”, “Education”, “Age”, “Experience to purchase online”, “Experience to use grocery apps”] format. The first data were related to a 39-year-old man with a bachelor’s degree, who assumed that he had used online shopping for 5 years and had 3 years of experience using grocery apps. In this case, the algorithm was fitted with the data of Iran and Hungary, and the results show that this consumer is more likely to use Snappfood in Iran and Wolt in Hungary than other options. Similarly, the second model for a female consumer with twenty years of age and two years of experience in online shopping and buying from the grocery app shows that this consumer is more likely to buy from Snappfood in Iran and Foodpanda in Hungary.
To test overfitting, we used cross-validation and mean square error (MSE) criteria. MSE value is less than 0.1 in the MLP algorithm which can show an acceptable amount of error. The results of the overfitting tests indicate the proper fit of the MLP model (all accuracy values are around 0.88 to 0.95).
Code 3. Cross validation and overfitting
# cross validation and overfitting
reg = MLPRegressor()
cv_score = cross_val_score(reg, x, y, cv = 5)
mse = np.mean(cv_score)
print(“cross validation mse is: “, abs(mse))
clf = MLPRegressor(hidden_layer_sizes = (
 30, 40), activation = ‘relu’, solver = ‘adam’)
scores = cross_val_score(clf, x, y, cv=5)
print(f”Score is: {scores}”)
Figure 3 and Figure 4 show the accuracy of the models in terms of testing and training data for the GMM algorithm. The accuracy of the model is more than 80%, which is an acceptable amount.
As the results in the descriptive section showed, in Iran, Snappfood is far ahead of other competitors. However, in Hungary, competition between Wolt and Foodpanda has increased. Although the current research sample in Hungary shows more Wolt customers, it should be noted that Foodpanda has less history in Hungary and has reached acceptable popularity in a short time, while it has started a wide advertisement campaign. For this reason, we have made a comparison between these two apps in Hungary and we expect to know how correct our classification is and how the classification machine has detected it. Hence, we used confusion matrix, accuracy, precision, recall (sensitivity), and F1 score criteria. A confusion matrix is based on number of correct and incorrect predictions made by a classifier (in our case: Wolt and Foodpanda). It is used to measure the performance of a classification model. It can be used to assess the performance of a classification model through the calculation of performance metrics such as accuracy (Equation (3)), precision (Equation (4)), recall (Equation (5)), and F1 score (Equation (6)). In the below formula, Tp is the true positive rate, Tn is the true negative rate, Fp is the false positive rate, and Fn is the false negative rate.
A c c u r a c y = T p + T n T p + T n + F p + F n
P r e c i s i o n = T p T p + F p
R e c a l l   ( S e n s i t i v i t y ) = T p T p + F n
F 1   s c o r e = 2 P r e c i s i o n R e c a l l P r e c i s i o n + R e c a l l
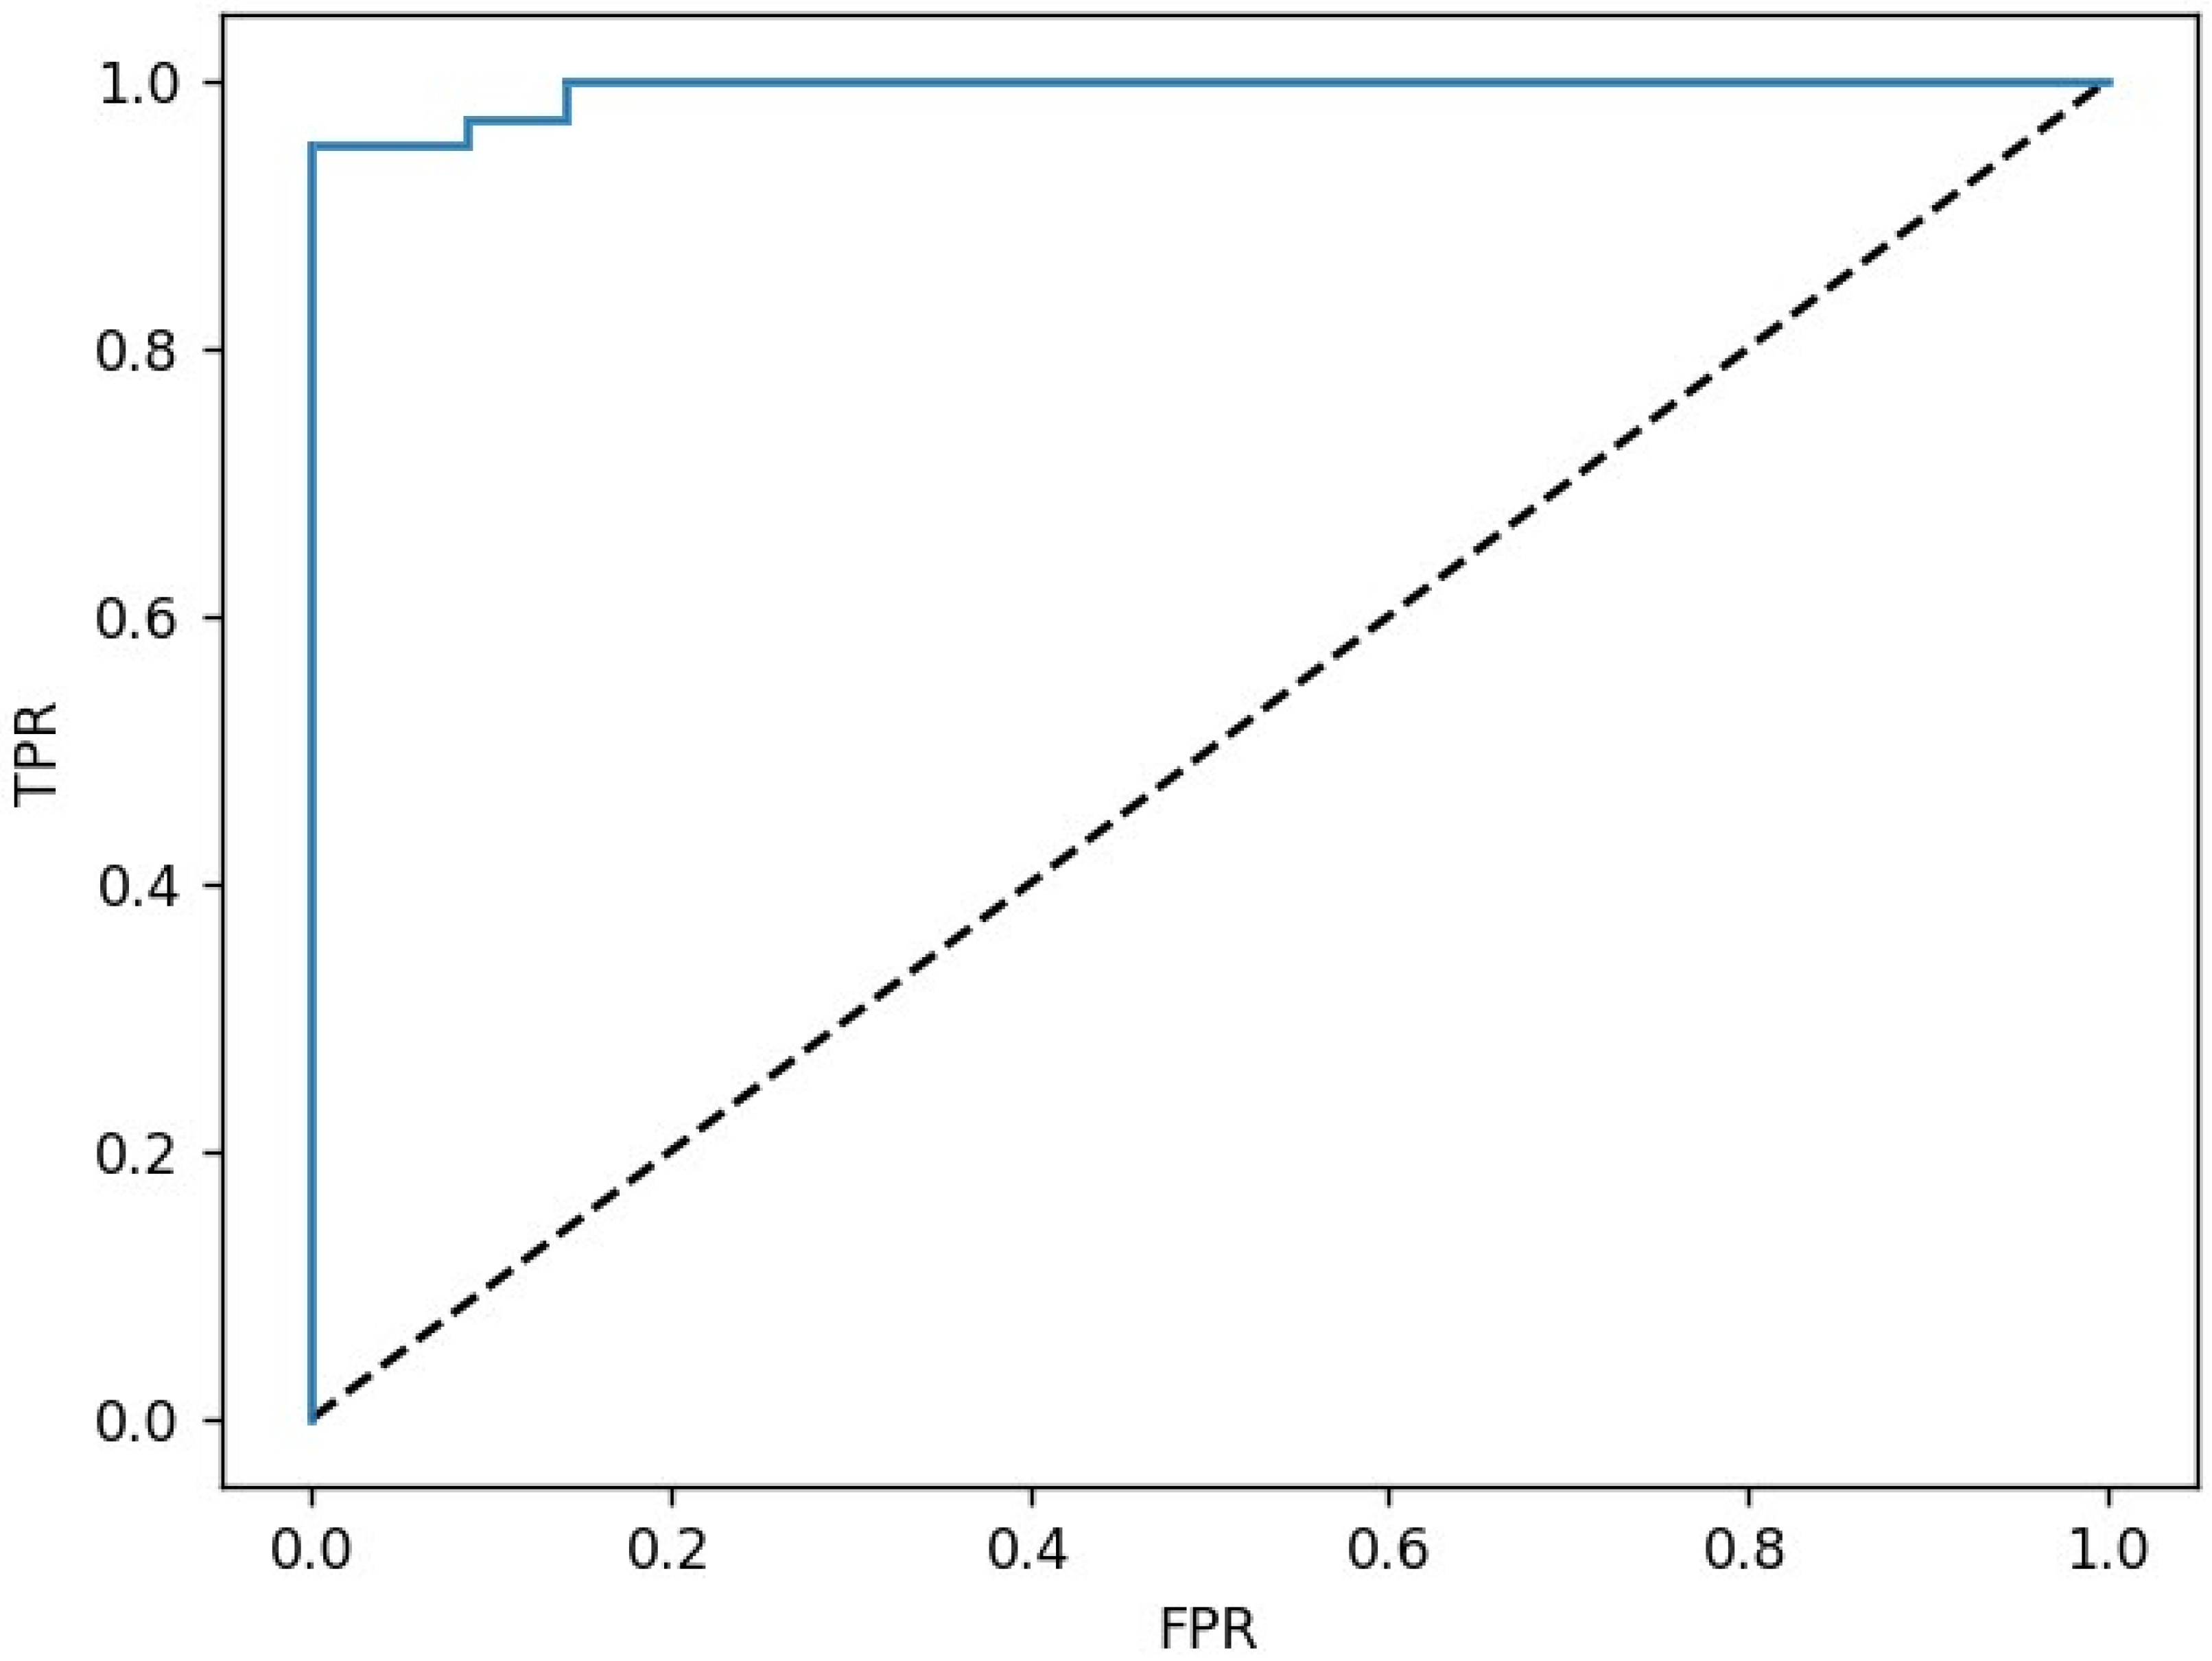
Code 4. Confusion matrix, ROC curve and AUC
from sklearn.metrics import confusion_matrix, classification_report
from sklearn.metrics import roc_curve
print(confusion_matrix(y_test, labels))
print(classification_report(y_test, labels))
labels_prob = model.predict_proba(x_test)[:, 1]
fpr, tpr, thresholds = roc_curve(labels, labels_prob)
print(f” AUC is: {roc_auc_score(labels, labels_prob)}”)
Note: ROC, receiver operating characteristic; AUC, area under the ROC curve.
Calculations were performed in Python based on 0.3 test data. Finally, the confusion matrix = ([70, 1], [2, 21]) result is calculated. A high total precision indicates not many true classifications (Wolt and Foodpanda) predicted incorrectly. Meanwhile, a high sensitivity indicates that most different grocery apps were predicted correctly. The AUC coefficient is 0.98, which is a suitable amount and shows probability. The plot of the ROC curve is shown in Table 1 and Figure 5.

5. Discussion

This research was conducted with the aim of identifying the most popular grocery apps among consumers in Iran and Hungary. Identifying the most popular grocery apps is an important topic that can be used in benchmarking by marketers that has not been considered in past research. The results of this research identify the successful patterns of grocery apps in Iran and Hungary and emphasize the necessity of conducting more studies on the unique features of these apps.
In previous research, identifying the popularity of grocery apps in different countries has not been considered, but the positive attitude of South Korean consumers towards grocery apps in the research by Kim (2021) has been confirmed. Additionally, the effect of attitude, perceived behavioral control, perceived usefulness, perceived ease of use (Ebrahimi et al. 2022a; Driediger and Bhatiasevi 2019), perceived enjoyment, facilitating conditions, relative advantage, real-time search and evaluation, and subjective norms (Chakraborty 2019; Chakraborty et al. 2022) on the tendency to use grocery apps has been confirmed in previous research. In Fagerstrøm et al. (2020), the positive impact of IoT Services on the likelihood of buying based on information from the app in a retail grocery shopping situation was confirmed. Furthermore, Hallikainen et al. (2022) confirmed the positive effect of personalized price promotions on consumer purchasing decisions in online grocery. In addition, intention to use has been emphasized as an important factor in the acceptance of online grocery shopping in Thailand (Driediger and Bhatiasevi 2019).

6. Conclusions

The purpose of this study was to investigate the popularity of grocery apps among users in Iran and Hungary. The results showed that Wolt in Hungary and Snappfood in Iran are the most popular grocery apps. Based on this, it can be said that Wolt and Snappfood’s business models are successful models for grocery apps in Hungary and Iran. Therefore, other grocery apps can improve their business models by emulating these applications.
Other results showed that the choice of grocery app by consumers in Hungary and Iran is influenced by demographic variables (gender, age, education, etc.) as well as the online shopping experience through grocery apps. Thus, segmenting consumers based on demographic variables and target market selection can facilitate marketers’ effective access to the right consumers. In this manner, grocery app marketers can customize their products and services to fit the characteristics of their target audience.
Considering that this research has identified Wolt and Snappfood as the most popular grocery apps in Hungary and Iran, it is obvious that future research should examine the unique features of these grocery apps. The features that have made these grocery apps popular among consumers express the preferences of consumers in these two countries. In addition, the comparison of the features of the most popular grocery apps in different countries leads future studies toward research aimed at identifying the cultural, demographic, social, and other factors that influence the choice of grocery apps in those countries. These studies can lead to the identification of macro variables that determine the differences in the behavior of consumers of different societies.

6.1. Managerial Implication

From a managerial perspective, this research has provided valuable results. In fact, in the clustering section, the accuracy and value of consumer demographic information have been emphasized. Additionally, in the classification and prediction section, a kind of “customization” has been done with an emphasis on market segmentation. Marketing managers can present different plans and strategies based on age, gender, education groups, etc., based on machine learning algorithms. One of the most important findings of this research is the emphasis on customization as an important keyword in consumer behavior. Today, the value of information received from consumers is very high and determines the future strategies and plans of grocery apps, startups, and online sellers.

6.2. Limitations and Suggestions

It should be mentioned that the respondents in this research answered the demographic questions according to their experiences of using different grocery apps in Iran and Hungary, and different results and/or experiences can be observed in other countries and/or cultures. Algorithms of the present research have a high potential for development and promotion. Thus, future researchers are recommended to develop the model by other demographic attributes of consumers. Other variables or attributes of the consumer can be added to the research model to better predict the grocery apps. In future research, it is also recommended to use other machine learning supervised or unsupervised algorithms.
Future researchers are also encouraged to use the current research model (MLP model) in different countries for comparison. In particular, the consumer behavior prediction model can provide interesting comparative results in different countries.

Author Contributions

Conceptualization, A.S. and M.S.; methodology, P.E. and M.S.; software, P.E.; validation, A.S., M.F.-F. and P.E.; formal analysis, P.E.; investigation, M.S.; data curation, M.S.; writing—original draft preparation, P.E. and M.S.; writing—review and editing, A.S. and M.F.-F.; visualization, P.E.; supervision, M.F.-F. and A.S.; project administration, M.F.-F.; funding acquisition, M.F.-F. All authors have read and agreed to the published version of the manuscript.

Funding

This research received no external funding.

Data Availability Statement

Not applicable.

Conflicts of Interest

The authors declare no conflict of interest.

References

  1. Al Amin, Md, Md Shamsul Arefin, Imran Hossain, Md Rakibul Islam, Nayeema Sultana, and Md Nazmul Hossain. 2022. Evaluating the determinants of customers’ mobile grocery shopping application (MGSA) adoption during COVID-19 pandemic. Journal of Global Marketing 35: 228–47. [Google Scholar] [CrossRef]
  2. Alshurideh, Muhammad, Barween Al Kurdi, Said A Salloum, Ibrahim Arpaci, and Mostafa Al-Emran. 2020. Predicting the actual use of m-learning systems: A comparative approach using PLS-SEM and machine learning algorithms. Interactive Learning Environments, 1–15. [Google Scholar] [CrossRef]
  3. Altay, Burak Can, Abdullah Okumuş, and Burcu Adıgüzel Mercangöz. 2022. An intelligent approach for analyzing the impacts of the COVID-19 pandemic on marketing mix elements (7Ps) of the on-demand grocery delivery service. Complex & Intelligent Systems 8: 129–40. [Google Scholar]
  4. Andati, Patrick, Eucabeth Majiwa, Marther Ngigi, Robert Mbeche, and Josiah Ateka. 2022. Determinants of Adoption of Climate Smart Agricultural Technologies among Potato Farmers in Kenya: Does entrepreneurial orientation play a role? Sustainable Technology and Entrepreneurship 1: 100017. [Google Scholar] [CrossRef]
  5. Baarsma, Barbara, and Jesse Groenewegen. 2021. COVID-19 and the Demand for Online Grocery Shopping: Empirical Evidence from the Netherlands. De Economist 169: 407–21. [Google Scholar] [CrossRef]
  6. Bouzari, Parisa, Aidin Salamzadeh, Maryam Soleimani, and Pejman Ebrahimi. 2021. Online Social Networks and Women’s Entrepreneurship: A Comparative Study between Iran and Hungary. Journal of Women’s Entrepreneurship and Education, 61–75. [Google Scholar] [CrossRef]
  7. Bruwer, Lee-Andra, Nkosivile Welcome Madinga, and Nqobile Bundwini. 2021. Smart shopping: The adoption of grocery shopping apps. British Food Journal 124: 1383–99. [Google Scholar] [CrossRef]
  8. Chakraborty, Debarun. 2019. Indian shoppers’ attitude towards grocery shopping apps: A survey conducted on smartphone users. Metamorphosis 18: 83–91. [Google Scholar] [CrossRef]
  9. Chakraborty, Debarun, Shakti Bodh Bhatnagar, Wendrila Biswas, and Ajay Kumar Khatua. 2022. What Drives People to Adopt Grocery Apps? The Moderating Role of Household Size. Business Perspectives and Research. Online First. Available online: https://journals.sagepub.com/doi/abs/10.1177/22785337221091640 (accessed on 9 March 2022).
  10. de Magalhães, David José Ahouagi Vaz. 2021. Analysis of critical factors affecting the final decision-making for online grocery shopping. Research in Transportation Economics 87: 101088. [Google Scholar] [CrossRef]
  11. Desai, Meha, and Manan Shah. 2021. An anatomization on breast cancer detection and diagnosis employing multi-layer perceptron neural network (MLP) and Convolutional neural network (CNN). Clinical eHealth 4: 1–11. [Google Scholar] [CrossRef]
  12. Dharmesti, Maria, Theresia Rasika Seta Dharmesti, Sarah Kuhne, and Park Thaichon. 2019. Understanding online shopping behaviours and purchase intentions amongst millennials. Young Consumers 22: 152–67. [Google Scholar] [CrossRef] [Green Version]
  13. Driediger, Fabian, and Veera Bhatiasevi. 2019. Online grocery shopping in Thailand: Consumer acceptance and usage behavior. Journal of Retailing and Consumer Services 48: 224–37. [Google Scholar] [CrossRef]
  14. Ebrahimi, Pejman, Aidin Salamzadeh, Maryam Soleimani, Seyed Mohammad Khansari, Hadi Zarea, and Maria Fekete-Farkas. 2022a. Startups and Consumer Purchase Behavior: Application of Support Vector Machine Algorithm. Big Data and Cognitive Computing 6: 34. [Google Scholar] [CrossRef]
  15. Ebrahimi, Pejman, Datis Khajeheian, and Maria Fekete-Farkas. 2021a. A SEM-NCA Approach towards Social Networks Marketing: Evaluating Consumers’ Sustainable Purchase Behavior with the Moderating Role of Eco-Friendly Attitude. International Journal of Environmental Research and Public Health 18: 13276. [Google Scholar] [CrossRef]
  16. Ebrahimi, Pejman, Datis Khajeheian, Maryam Soleimani, Abbas Gholampour, and Maria Fekete-Farkas. 2022b. User engagement in social network platforms: What key strategic factors determine online consumer purchase behaviour? Economic Research-Ekonomska Istraživanja, 1–32. Available online: https://www.tandfonline.com/doi/full/10.1080/1331677X.2022.2106264 (accessed on 6 August 2022).
  17. Ebrahimi, Pejman, Khadija Aya Hamza, Eva Gorgenyi-Hegyes, Hadi Zarea, and Maria Fekete-Farkas. 2021b. Consumer knowledge sharing behavior and consumer purchase behavior: Evidence from E-commerce and online retail in Hungary. Sustainability 13: 10375. [Google Scholar] [CrossRef]
  18. Ebrahimi, Pejman, Marjan Basirat, Ali Yousefi, Md Nekmahmud, Abbas Gholampour, and Maria Fekete-Farkas. 2022c. Social Networks Marketing and Consumer Purchase Behavior: The Combination of SEM and Unsupervised Machine Learning Approaches. Big Data and Cognitive Computing 6: 35. [Google Scholar] [CrossRef]
  19. Ebrahimi, Pejman, Mohammad Naim Hasani, Aidin Salamzadeh, Seyed Mohammad Khansari, and Maria Fekete-Farkas. 2022d. A machine learning decision tree model to predict consumer purchase behaviour: A microeconomics view from online social platforms in Iran. International Journal of Business and globalization. in press. [Google Scholar]
  20. Fagerstrøm, Asle, Niklas Eriksson, and Valdimar Sigurdsson. 2020. Investigating the impact of Internet of Things services from a smartphone app on grocery shopping. Journal of Retailing and Consumer Services 52: 101927. [Google Scholar] [CrossRef]
  21. Fekete-Farkas, Maria, Abbas Gholampour, Parisa Bouzari, Hadi Jarghooiyan, and Pejman Ebrahimi. 2021. How gender and age can affect consumer purchase behavior? Evidence from A microeconomic perspective from Hungary. AD-Minister, 25–46. Available online: http://www.scielo.org.co/scielo.php?script=sci_arttext&pid=S1692-02792021000200025 (accessed on 28 August 2020). [CrossRef]
  22. Flacandji, Michaël, and Mariana Vlad. 2022. The relationship between retailer app use, perceived shopping value and loyalty: The moderating role of deal proneness. International Journal of Retail & Distribution Management 50: 981–95. [Google Scholar]
  23. Garcia, Jorge Mazza, Otávio Bandeira De Lamônica Freire, Eduardo Biagi Almeida Santos, and Josmar Andrade. 2020. Factors affecting satisfaction and loyalty to online group buying. Revista de Gestão 27: 211–28. [Google Scholar] [CrossRef]
  24. Hallikainen, Heli, Milena Luongo, Amandeep Dhir, and Tommi Laukkanen. 2022. Consequences of personalized product recommendations and price promotions in online grocery shopping. Journal of Retailing and Consumer Services 69: 103088. [Google Scholar] [CrossRef]
  25. Horst, Sven-Ove, Aidin Salamzadeh, Pejman Ebrahimi, and Shaghayegh Kolli. 2021. Co-Creation in Provider Side for Developing Innovative Services: How New Technology-Based Firms Benefit from Social Media Platforms. Nordic Journal of Media Management 2: 109–26. [Google Scholar]
  26. Hsu, Tsuen-Ho, and Jia-Wei Tang. 2020. Development of hierarchical structure and analytical model of key factors for mobile app stickiness. Journal of Innovation & Knowledge 5: 68–79. [Google Scholar]
  27. Ilyuk, Veronika. 2018. Like throwing a piece of me away: How online and in-store grocery purchase channels affect consumers’ food waste. Journal of Retailing and Consumer Services 41: 20–30. [Google Scholar] [CrossRef]
  28. Jagtap, Santosh T., Khongdet Phasinam, Thanwamas Kassanuk, Subhesh Saurabh Jha, Tanmay Ghosh, and Chetan M. Thakar. 2022. Towards application of various machine learning techniques in agriculture. Materials Today: Proceedings 51: 793–97. [Google Scholar] [CrossRef]
  29. Khajeheian, Datis, and Pejman Ebrahimi. 2021. Media branding and value co-creation: Effect of user participation in social media of newsmedia on attitudinal and behavioural loyalty. European Journal of International Management 16: 499–528. [Google Scholar] [CrossRef]
  30. Kim, Hyungjoon. 2021. Use of Mobile Grocery Shopping Application: Motivation and Decision-Making Process among South Korean Consumers. Journal of Theoretical and Applied Electronic Commerce Research 16: 2672–93. [Google Scholar] [CrossRef]
  31. Kureshi, Sonal, and Sujo Thomas. 2019. Online grocery retailing–exploring local grocers beliefs. International Journal of Retail & Distribution Management 47: 157–85. [Google Scholar]
  32. Llorens, Miguel, and Adolfo Hernández. 2021. A study on the downloading intention of fashion retailers’ apps. Journal of Marketing Analytics 9: 349–62. [Google Scholar] [CrossRef]
  33. Maia, Claudia, Guilherme Lunardi, Andre Longaray, and Paulo Munhoz. 2018. Factors and characteristics that influence consumers’ participation in social commerce. Revista de Gestão 25: 194–211. [Google Scholar] [CrossRef]
  34. Menon, Lakshmi, Dripta Roy Choudhury, Rimante Ronto, Rupali Sengupta, Sangeeta Kansal, and Neha Rathi. 2022. Transformation in culinary behaviour during the COVID-19 pandemic: In-depth interviews with food gatekeepers in urban India. Appetite 172: 105948. [Google Scholar] [CrossRef] [PubMed]
  35. Mondal, Jalaluddin, and Somnath Chakrabarti. 2021. The abandonment behaviour of the branded app consumer: A study using interpretive structural modelling approach. Journal of Retailing and Consumer Services 63: 102695. [Google Scholar] [CrossRef]
  36. Ni, Lingling, Dong Wang, Jianfeng Wu, Yuankun Wang, Yuwei Tao, Jianyun Zhang, and Jiufu Liu. 2020. Streamflow forecasting using extreme gradient boosting model coupled with Gaussian mixture model. Journal of Hydrology 586: 124901. [Google Scholar] [CrossRef]
  37. Pallathadka, Harikumar, Malik Mustafa, Domenic T. Sanchez, Guna Sekhar Sajja, Sanjeev Gour, and Mohd Naved. 2021. Impact of machine learning on management, healthcare and agriculture. Materials Today: Proceedings. in press. [Google Scholar] [CrossRef]
  38. Pandey, Shweta, Deepak Chawla, and Sandeep Puri. 2021. Food delivery apps (FDAs) in Asia: An exploratory study across India and the Philippines. British Food Journal 124: 657–78. [Google Scholar] [CrossRef]
  39. Podsakoff, Philip M., Scott B. MacKenzie, Jeong-Yeon Lee, and Nathan P. Podsakoff. 2003. Common method biases in behavioral research: A critical review of the literature and recommended remedies. Journal of Applied Psychology 88: 879. [Google Scholar] [CrossRef]
  40. Rana, Arti, Arvind Singh Rawat, Anchit Bijalwan, and Himanshu Bahuguna. 2018. Application of multi layer (perceptron) artificial neural network in the diagnosis system: A systematic review. Paper presented at 2018 International Conference on Research in Intelligent and Computing in Engineering (RICE), San Salvador, El Salvador, August 22–24; pp. 1–6. [Google Scholar]
  41. Rinaldi, Chiara, Marlene D’Aguilar, and Matt Egan. 2022. Understanding the Online Environment for the Delivery of Food, Alcohol and Tobacco: An Exploratory Analysis of ‘Dark Kitchens’ and Rapid Grocery Delivery Services. International Journal of Environmental Research and Public Health 19: 5523. [Google Scholar] [CrossRef]
  42. Sarker, Iqbal H. 2021. Machine learning: Algorithms, real-world applications and research directions. SN Computer Science 2: 1–21. [Google Scholar] [CrossRef]
  43. Segovia, Michelle, Jasper Grashuis, and Theodoros Skevas. 2021. Consumer preferences for grocery purchasing during the COVID-19 pandemic: A quantile regression approach. British Food Journal. ahead-of-print. [Google Scholar] [CrossRef]
  44. Singh, Pratibha, Manali Gupta, Amresh Kumar, Pallab Sikdar, and Neena Sinha. 2021. E-Grocery retailing mobile application: Discerning determinants of repatronage intentions in an emerging economy. International Journal of Human–Computer Interaction 37: 1783–98. [Google Scholar] [CrossRef]
  45. Sreeram, Anusha, Ankit Kesharwani, and Sneha Desai. 2017. Factors affecting satisfaction and loyalty in online grocery shopping: An integrated model. Journal of Indian Business Research 9: 107–32. [Google Scholar] [CrossRef]
  46. Statista. 2022. Number of Facebook Users in Hungary from September 2018 to January 2022. Available online: https://www.statista.com/statistics/1029770/facebook-users-hungary/ (accessed on 1 March 2021).
  47. Tandon, Anushree, Puneet Kaur, Yogesh Bhatt, Matti Mäntymäki, and Amandeep Dhir. 2021. Why do people purchase from food delivery apps? A consumer value perspective. Journal of Retailing and Consumer Services 63: 102667. [Google Scholar] [CrossRef]
  48. Tax, Niek, Kees Jan de Vries, Mathijs de Jong, Nikoleta Dosoula, Bram van den Akker, Jon Smith, Olivier Thuong, and Lucas Bernardi. 2021. Machine learning for fraud detection in e-Commerce: A research agenda. In International Workshop on Deployable Machine Learning for Security Defense. Cham: Springer, pp. 30–54. [Google Scholar]
  49. Xu, Yuanjin, Fei Li, and Armin Asgari. 2022. Prediction and optimization of heating and cooling loads in a residential building based on multi-layer perceptron neural network and different optimization algorithms. Energy 240: 122692. [Google Scholar] [CrossRef]
  50. Yi, Hong, Xue Meng, Yuting Linghu, and Ziyu Zhang. 2022. Can financial capability improve entrepreneurial performance? Evidence from rural China. Economic Research-Ekonomska Istraživanja, 1–20. Available online: https://www.tandfonline.com/doi/full/10.1080/1331677X.2022.2091631 (accessed on 12 July 2022). [CrossRef]
  51. Zhou, Lichun. 2020. Product advertising recommendation in e-commerce based on deep learning and distributed expression. Electronic Commerce Research 20: 321–42. [Google Scholar] [CrossRef]
Figure 1. The pair plot of the respondents’ demographic data in Iran (source: authors’ calculations based on Python programming; Seaborn package; VS Code editor).
Jrfm 15 00424 g001
Figure 2. The pair plot of the respondents’ demographic data in Hungary (source: authors’ calculations based on Python programming; Seaborn package; VS Code editor).
Jrfm 15 00424 g002
Figure 3. GMM algorithm output based on Iran data (source: authors’ calculations based on Python programming).
Jrfm 15 00424 g003
Figure 4. GMM algorithm output based on Hungary data (source: authors’ calculations based on Python programming).
Jrfm 15 00424 g004
Figure 5. Plot of ROC Curve (Source: authors’ calculations based on Python programming/VS code).
Jrfm 15 00424 g005
Table 1. Confusion matrix result.
PrecisionRecall (Sensitivity)F1 ScoreSupport
Wolt (0)0.970.980.9771
Foodpanda (1)0.950.910.9223
Average/Total0.960.940.9494
Publisher’s Note: MDPI stays neutral with regard to jurisdictional claims in published maps and institutional affiliations.

