Abstract
Rural locations provide limited economic opportunities, mainly relying on agricultural activities, with scarce industrial or commercial investment and employment. This has led to higher risks related to poverty, with a lack of opportunities for education, healthcare, and general services leading to rural migration. On the other hand, wind energy is growing exponentially in the United States (US). Rural locations offer very good siting options for wind farms considering the ever-growing size of their equipment and significant required area. Therefore, wind farms may provide financial opportunities to local rural communities, reducing poverty risks and improving living standards. These financial benefits include rental income for landowners, additional tax collection for public service funding, increased income for school districts, and overall larger local investments. However, the available data are too coarse, broad, and unconnected, not allowing local communities, wind developers, and stakeholders a clear panoramic of the benefits that each individual location, school district, or landowner may receive. This research compiled dispersed big data for its integration into a large Geographic Information System (GIS). This system is capable of performing analysis to provide a much better understanding of the actual benefits that the wind industry provides to each individual rural stakeholder. Data were converted to geospatial layers, when required, to allow for a fuller comprehension of all factors impacting financial benefits and risks from the wind industry. Analyses were expanded to evaluate the lease financial benefits for landowners in Texas, applying the data provided by local and state agencies. The approach developed in this research will allow for its application in diverse geographical locations to explore additional financial benefits that each individual rural stakeholder may receive from the wind industry. This will allow local authorities, landowners, wind developers, and communities to better negotiate for the future expansion of wind energy, providing all parties involved with significant benefits and allowing the continuous growth of renewable energy to overcome the damaging effects from climate change.
1. Introduction
Economic opportunities in rural communities are very limited (Tickamyer and Duncan 1990). Most activities relate to agriculture, with minimal industrial or large-scale commercial operations (Duncan 1992; Anríquez and Stamoulis 2007). This has accelerated rural depopulation, with migration to larger cities that offer more attractive economic opportunities (Deavers 1992; Weber et al. 2005). These factors exacerbate poverty levels for rural populations, with local governments and school districts having limited revenue potential to provide services to their communities (Janvry and Sadoulet 2000; Lavalley 2018; Geverdt 2019). Therefore, developing new economic activities for rural communities that can provide financial benefits for their populations is very important (Tickamyer 2006). The previous literature has indicated that the wind industry has grown exponentially over the last two decades, with a significant portion of their activities situated in rural locations (Groth and Vogt 2014; Wiser et al. 2021b; Shoeib et al. 2022). Diverse reports have claimed that this industry provides significant economic benefits to local rural communities derived from wind industry lease payments, employment, taxes, and capital investment (Greene and Geisken 2013; Mulvaney et al. 2013a; Song et al. 2016; Jacquet and Fergen 2018).
Wind farms installed in rural locations provide much needed local financial benefits (Brunner et al. 2022; Shoeib et al. 2022). Taxes from wind turbines provide rural communities with critical infrastructure projects (Pavlowsky and Gliedt 2021). US school districts with wind farms in their area receive additional funding to support their educational activities (Castleberry and Greene 2017; Brunner et al. 2022). The US Department of Energy indicates that wind farms pay average yearly taxes of more than USD7000 per installed MW (US DE 2020). Wind farms are normally placed in agricultural settings, leasing from local farmers. Wind turbines only require a fraction of the land and leases allow owners to continue performing their normal farming activities. Therefore, the payment received from the leases is additional income to the owners (Reategui and Hendrickson 2011; Schwabe et al. 2017; US DE 2020).
Wind farms also generate local employment opportunities (Blanco and Rodrigues. 2009; Shoeib et al. 2021). During the construction phase, a significant number of workers are needed to develop the facilities (US DE 2020). However, during the operational phase wind operators continue to employ a number of local workers to perform maintenance and management activities, providing long term highly paid employment for rural population. The US Department of Energy has indicated that an important contribution of renewable energy is the development of well-paying jobs in economically depressed areas (US DE 2020; Loomis et al. 2016; Brunner et al. 2022). Wind energy projects create new jobs in maintenance, operations, transportation, construction, and manufacturing, employing in 2019 more than 111,000 workers in the US (Marcacci 2019). The US Occupational Outlook Handbook indicates that Wind Turbine Technicians will grow 68% from 2020 to 2030, which is much faster than average, with a high median pay of USD56,230 per year for 2020 (BLS 2020). Figure 1 shows state level results for (a) employment and (b) lease payments for the year 2016 (AWEA 2017; WRI 2017). The temporal and spatial resolution of this financial data needs to be improved to provide rural and wind stakeholders with relevant decision-making information.
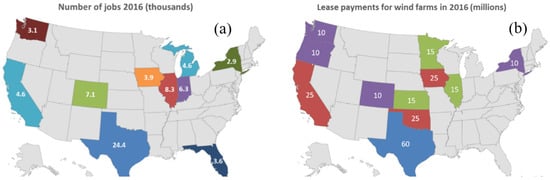
Figure 1.
Wind energy benefits per states for 2016. (a) Number of jobs. (b) Lease payments.
Evaluating the distribution of benefits among diverse rural populations is important to avoid perceptions of the concentration of these advantages on limited number of stakeholders. As granular and higher resolution results are able to show the dispersion of financial benefits among large number of individual citizens and to the whole community, a better understanding of current and future positive outcomes can be achieved. Identification and classification of potential individual and community benefits is relevant to provide objective assessments for each particular group. The most relevant individual benefit includes rental income for landowners from turbines installed in their properties. General community benefits, that encompass all citizens living on those jurisdictions, include increased tax revenue as a critical component that will provide the potential for improved and expanded public services. Public improvement projects, undertaken by wind project developers, are also an important component of these general benefits. Furthermore, the additional investment and improvement for local public education is one of the most relevant components of the general financial benefit package in the United States. To better understand the potential for those benefits and the relevance of performing public outreach on them, a literature review is presented.
2. Literature Review
The literature exploring the potential financial benefits of wind energy investment in global rural locations is scarce (Copena and Simón 2018; Delicado et al. 2016; Slattery et al. 2011; Clausen and Rudolph 2020; Brunner et al. 2022). These financial benefits, as reported by previous studies, may be classified considering the recipient of these benefits (Copena and Simón 2018). Community benefits comprise increased tax revenue, additional employment opportunities, local improvement projects, and support for educational institutions and projects (Mulvaney et al. 2013b). Individual benefits for local communities involve payments for leases from local property owners to install wind farms. The American Wind Energy Association (AWEA) reported that in 2018 wind farms paid USD289 million in leases for landowners, many of them local farmers, for installed wind turbines (Bergen 2020). In regard to community benefits, Kahn reported that counties that have installed wind turbines experience beneficial financial improvements, with increased quality for local schools, a decline in property taxes, and even better air quality when compared with counties with fossil fuels installed plants. These findings indicate that these counties are investing more in their public schools when compared with non-wind farm counties and increasing the education quality. Furthermore, local property taxes declined for these counties, benefiting all their citizens, providing additional financial benefits (Kahn 2013). The AWEA reported that in 2018 wind farms paid USD761 million in local and state taxes and they are expected to generate 4.5 million additional jobs by 2030 (Bergen 2020; Brunner et al. 2022).
Financial benefits have been indicated as one very important factor for wind energy acceptance by local communities (Rand and Hoen 2017). For Portugal, Delicado et al. found that direct benefits for municipal authorities created an increased proportion of approved projects (Delicado et al. 2016). Baxter et al., in a study performed for Ontario, Canada, reported that fairness in the distribution of financial benefits among community stakeholders was one of the factors related to higher acceptance levels for wind energy projects (Baxter et al. 2013). On the other hand, Dimitropoulos et al., reported that for Greece the lack of proper information and outreach to local communities on the development of wind projects was one of the most relevant determinants of social opposition (Dimitropoulos and Kontoleon 2009). Therefore, it has been indicated that the dissemination of information related to wind farm projects, including benefits, through outreach and the involvement of local communities significantly increases the social acceptance of these projects (Bristow et al. 2012).
Benefits provided by wind energy to rural communities in the United States have not received wide public outreach. A lack of complete information on these benefits has been shown to foster local social opposition, hindering wind farms’ continuous growth (Groth and Vogt 2014; Song et al. 2016). Previous studies have indicated that an important factor increasing social opposition to infrastructure projects is the perception of local communities not benefiting from the project and not having been consulted in advance concerning these projects (Hall et al. 2013; Lundheim et al. 2022). In many situations, energy from the wind is consumed in cities, far away from the installation site. Overhead power lines are installed to convey wind energy to these remote locations. Rural communities, where wind is installed, may perceive to receive only hardships without benefits (Song et al. 2016). For these reasons it is critical to clearly understand and effectively communicate the financial benefits provided by the wind industry to local rural communities (Gross 2007; Copena and Simón 2018; Lundheim et al. 2022).
Moreover, from the global sustainability standpoint, the relevance of incentivizing the continuous growth of wind energy cannot be overstated. Renewable energy is a critical component of global projections to significantly reduce humanity’s carbon footprint (Barthelmie and Pryor 2021; Haces-Fernandez et al. 2022). Wind energy has the advantage of being commercially viable and financially successful, efficiently competing with traditional hydrocarbon fuels. In fact, in many locations wind is the most inexpensive electricity generation form (Haces-Fernandez et al. 2019; Wiser et al. 2021a). Therefore, it is paramount to continue incentivizing the continuous growth of wind energy. Considering that most of this growth will occur in rural locations, the relevance of the results from this study are significant to reduce potential local social opposition that would prevent the expansion of this renewable energy resource (Haces-Fernandez et al. 2017; Lienhoop 2018).
3. Current State of Knowledge, Novelty, and Scientific Contribution
As indicated in the introduction and the literature review of this study, granular current data on the financial benefits to rural communities from wind energy characterized by county, school district, or zip code are not publicly available. This information is in many cases confidential, outdated, or dispersed across multiple databases. Furthermore, the literature on the topic is scarce and no models have been developed to assess, characterize, and optimize current and future potential financial benefits for rural areas. Generating high resolution results on the potential financial benefits from wind industry to rural locations in the US is challenging, considering that the data are scattered among a large number of diverse databases hosted by diverse organizations. Furthermore, information on rental income from the wind industry to rural property owners is in many cases kept private, making it difficult to evaluate the financial benefits provided by this industry. Applying a Geographic Information System to integrate dispersed database information will develop a powerful tool evaluate the diverse strategies available to incentivize continuous wind energy growth while benefiting local communities.
Lack of dissemination of these financial growth opportunities hinders the ability of rural communities to adequately plan and benefit from the continuous expansion of the wind industry. It prevents local stakeholders from effectively negotiating the most beneficial leases, tax incentives, and minimum required wind industry local employment offerings. Not fully understanding the potential financial benefits has caused some rural communities to have increased social opposition to wind projects. The ultimate outcome of this research aims to provide local stakeholders with adequate information and data to promote wind energy growth, maximize potential benefits for local stakeholders, and advise rural community decision makers on the best strategies to plan future wind projects development.
Considering the challenges presented by the state of knowledge and the limitations of existing studies, this research proposes the development of a novel holistic and integrative method to assess the financial benefits of wind energy to rural locations. The novelty of this study comprises the integration of disperse and divergent databases into a coherent assessment tool to provide valuable information to rural communities. Granular data on rural poverty levels, school districts distribution, county boundaries, individual wind turbine localization and characteristics, property ownership and distribution, and future wind farm development and its potential layouts are all integrated in the model. The scientific contribution is the development of a framework capable of integrating, handling, processing, and providing analytics results for the assessment of each individual rural location in terms of its current vulnerability and potential financial benefits from wind projects. Adequate information on the topic will help rural communities to better negotiate the development of new wind farms or their repowering projects. This will incentivize wind energy growth while simultaneously providing rural stakeholders with critical information to negotiate with developers on the creation of future renewable energy projects on their jurisdiction. The proposed method will allow for a better assessment, understanding and dissemination of information on financial benefits from wind energy to rural communities.
To present this study, the manuscript follows the traditional structure of a research paper, striving to provide a clear narrative for the readers. The previous three sections contained the (1) introduction; (2) literature review; and (3) current state of knowledge, novelty, and scientific contribution. In the following sections the manuscript is structured in four sections: (4) methods and materials; (5) results; (6) discussion; and (7) conclusion.
4. Methods and Materials
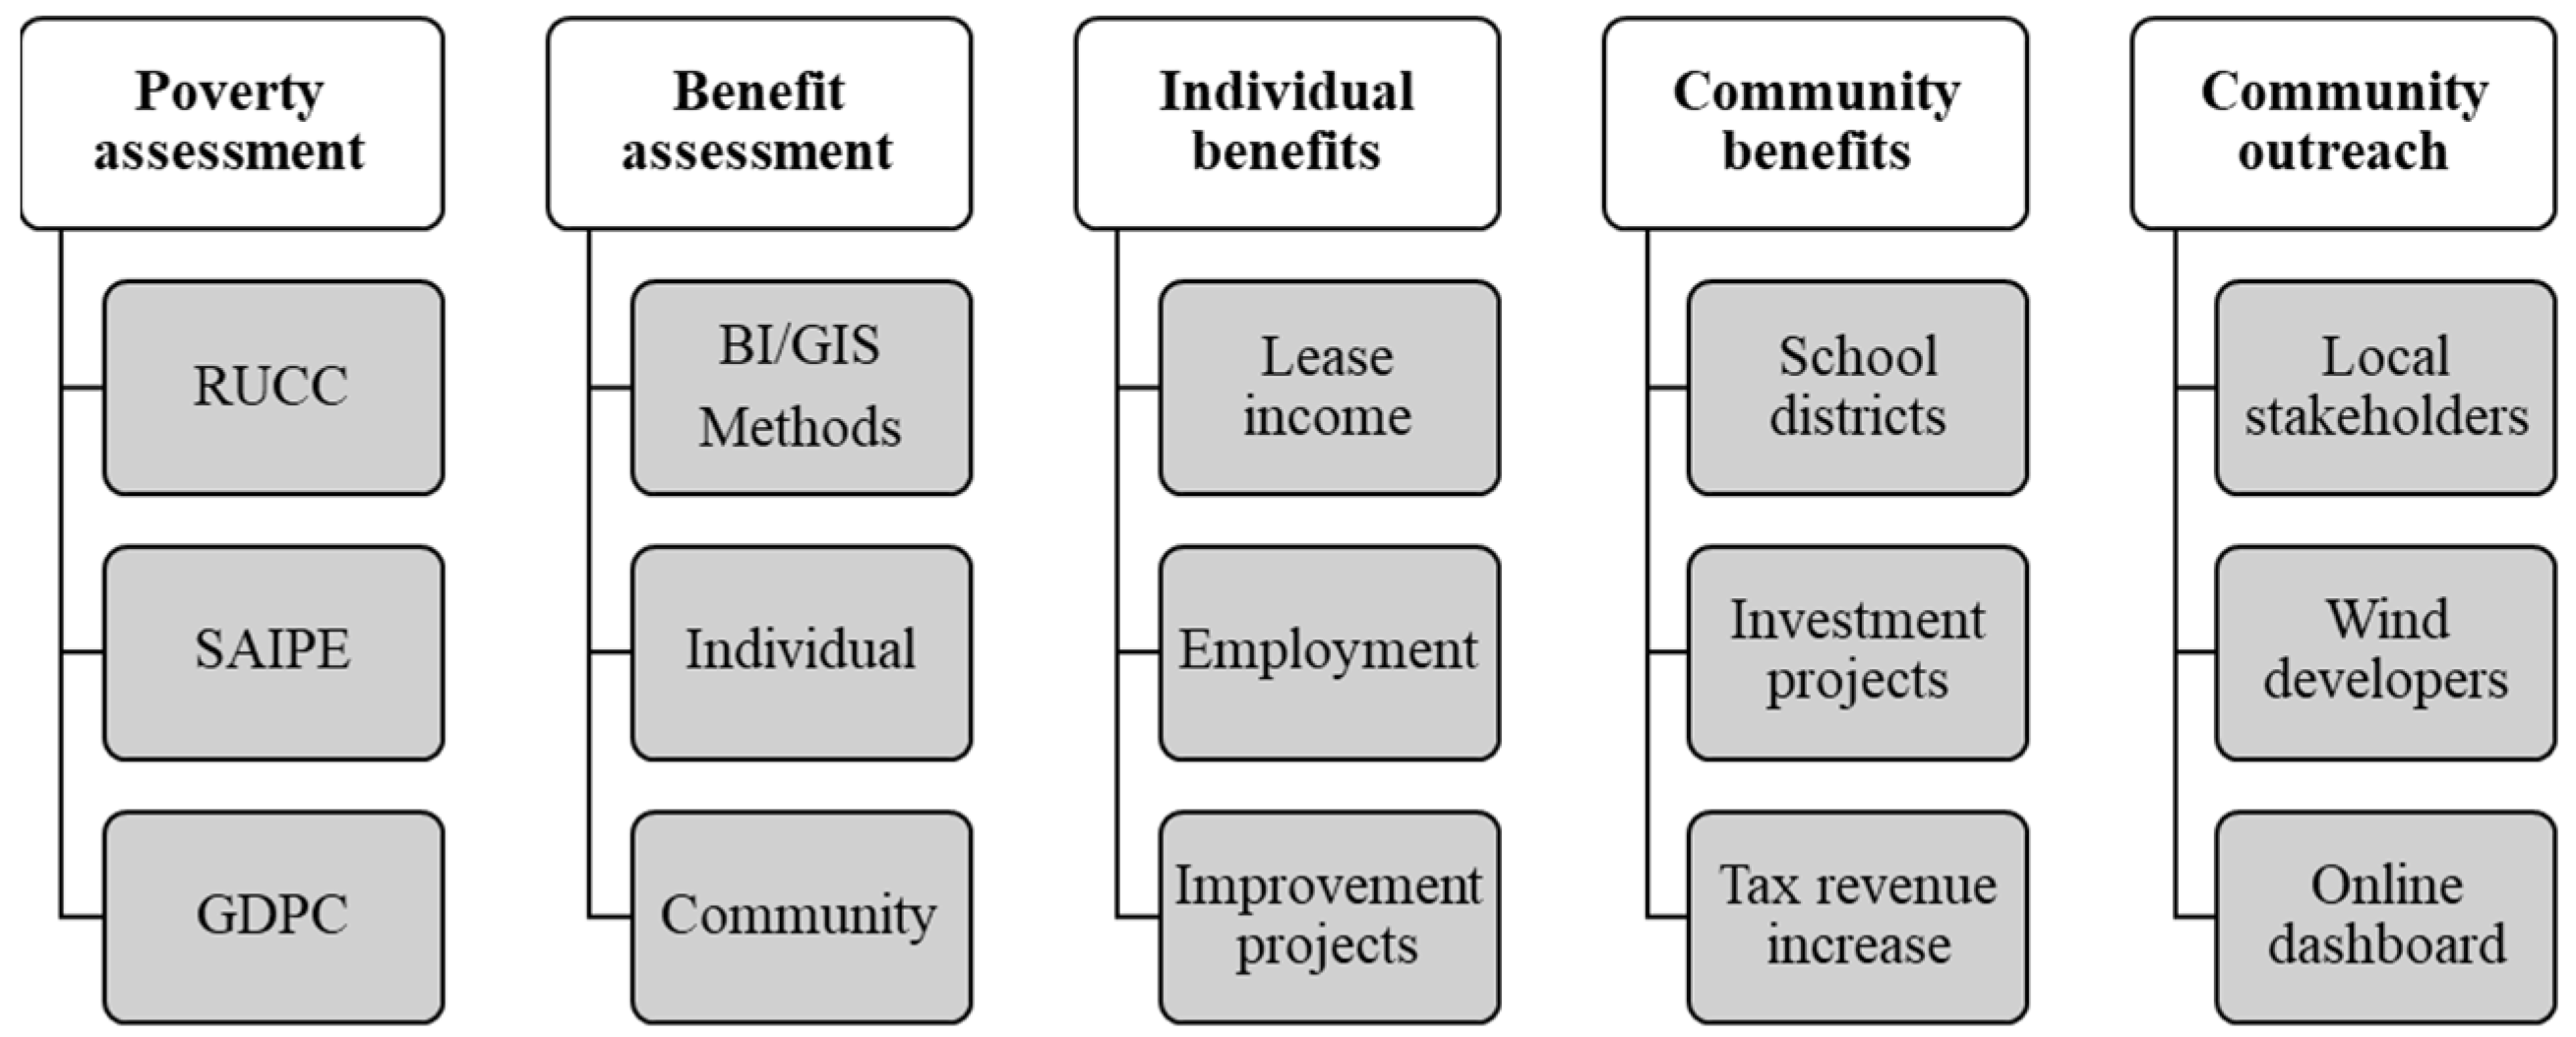
The proposed method to conduct his study involved several operational objectives, as indicated in Figure 2. The assessment and identification of poverty applying Geographic Information Systems (GIS) and data analytics was considered as the first objective. This objective was evaluated by applying macroeconomic metrics with significant granular data fields and records to provide relevant regional and local results. Identification of rural areas was performed considering the Rural–Urban Continuum Codes (RUCC) developed by the US Department of Agriculture (USDA 2020, 2021). Data provided by the US Census Bureau for the Small Area Income and Poverty Estimates (SAIPE) Program (USCB 2021) were applied to assess poverty levels at rural locations with an increased resolution. Macroeconomic county economic activity was assessed through Gross Domestic Product by county data developed by the Bureau of Economic Analysis from the US Department of Commerce (BEA 2021). All these macroeconomic and geospatial data were overlaid and combined to perform a granular identification of poverty levels in rural locations. The second operational objective on the research was to identify the potential financial benefits for rural communities from wind energy investment. As indicated by previous studies, benefits were classified in public and private (Copena and Simón 2018; Slattery et al. 2011; Mulvaney et al. 2013b; Bergen 2020; Kahn 2013), which are shown in the second and third columns of Figure 2. The flow chart further enumerates the potential financial benefits from wind investment for local communities. A novel research methodology was developed, as part of the third operational objective, to assess and evaluate wind energy financial benefits for rural locations. The last operational objective of the proposed method involved the integration and design of community outreach to local stakeholders (individual citizens, government, school districts and local organization, among others) and wind developers. Leveraging existing technologies, this information would be integrated into a public and private online dashboard which will provide useful granular information on the results from this study. The scope of this manuscript covers poverty assessment for rural locations, and benefit assessment and calculation considering the lease income for the individual category and school districts for the community. This provides a good benchmark to correlate wind energy potential benefits significantly impacting rural locations with high poverty levels, justifying the relevance of the study. Results from the research will be developed into additional research papers that will continue to demonstrate the relevance of the study and the beneficial financial impact from wind energy investment.
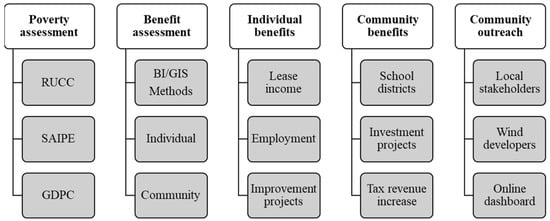
Figure 2.
Flow chart for the high level description of the operational objectives of the method considered for this research.
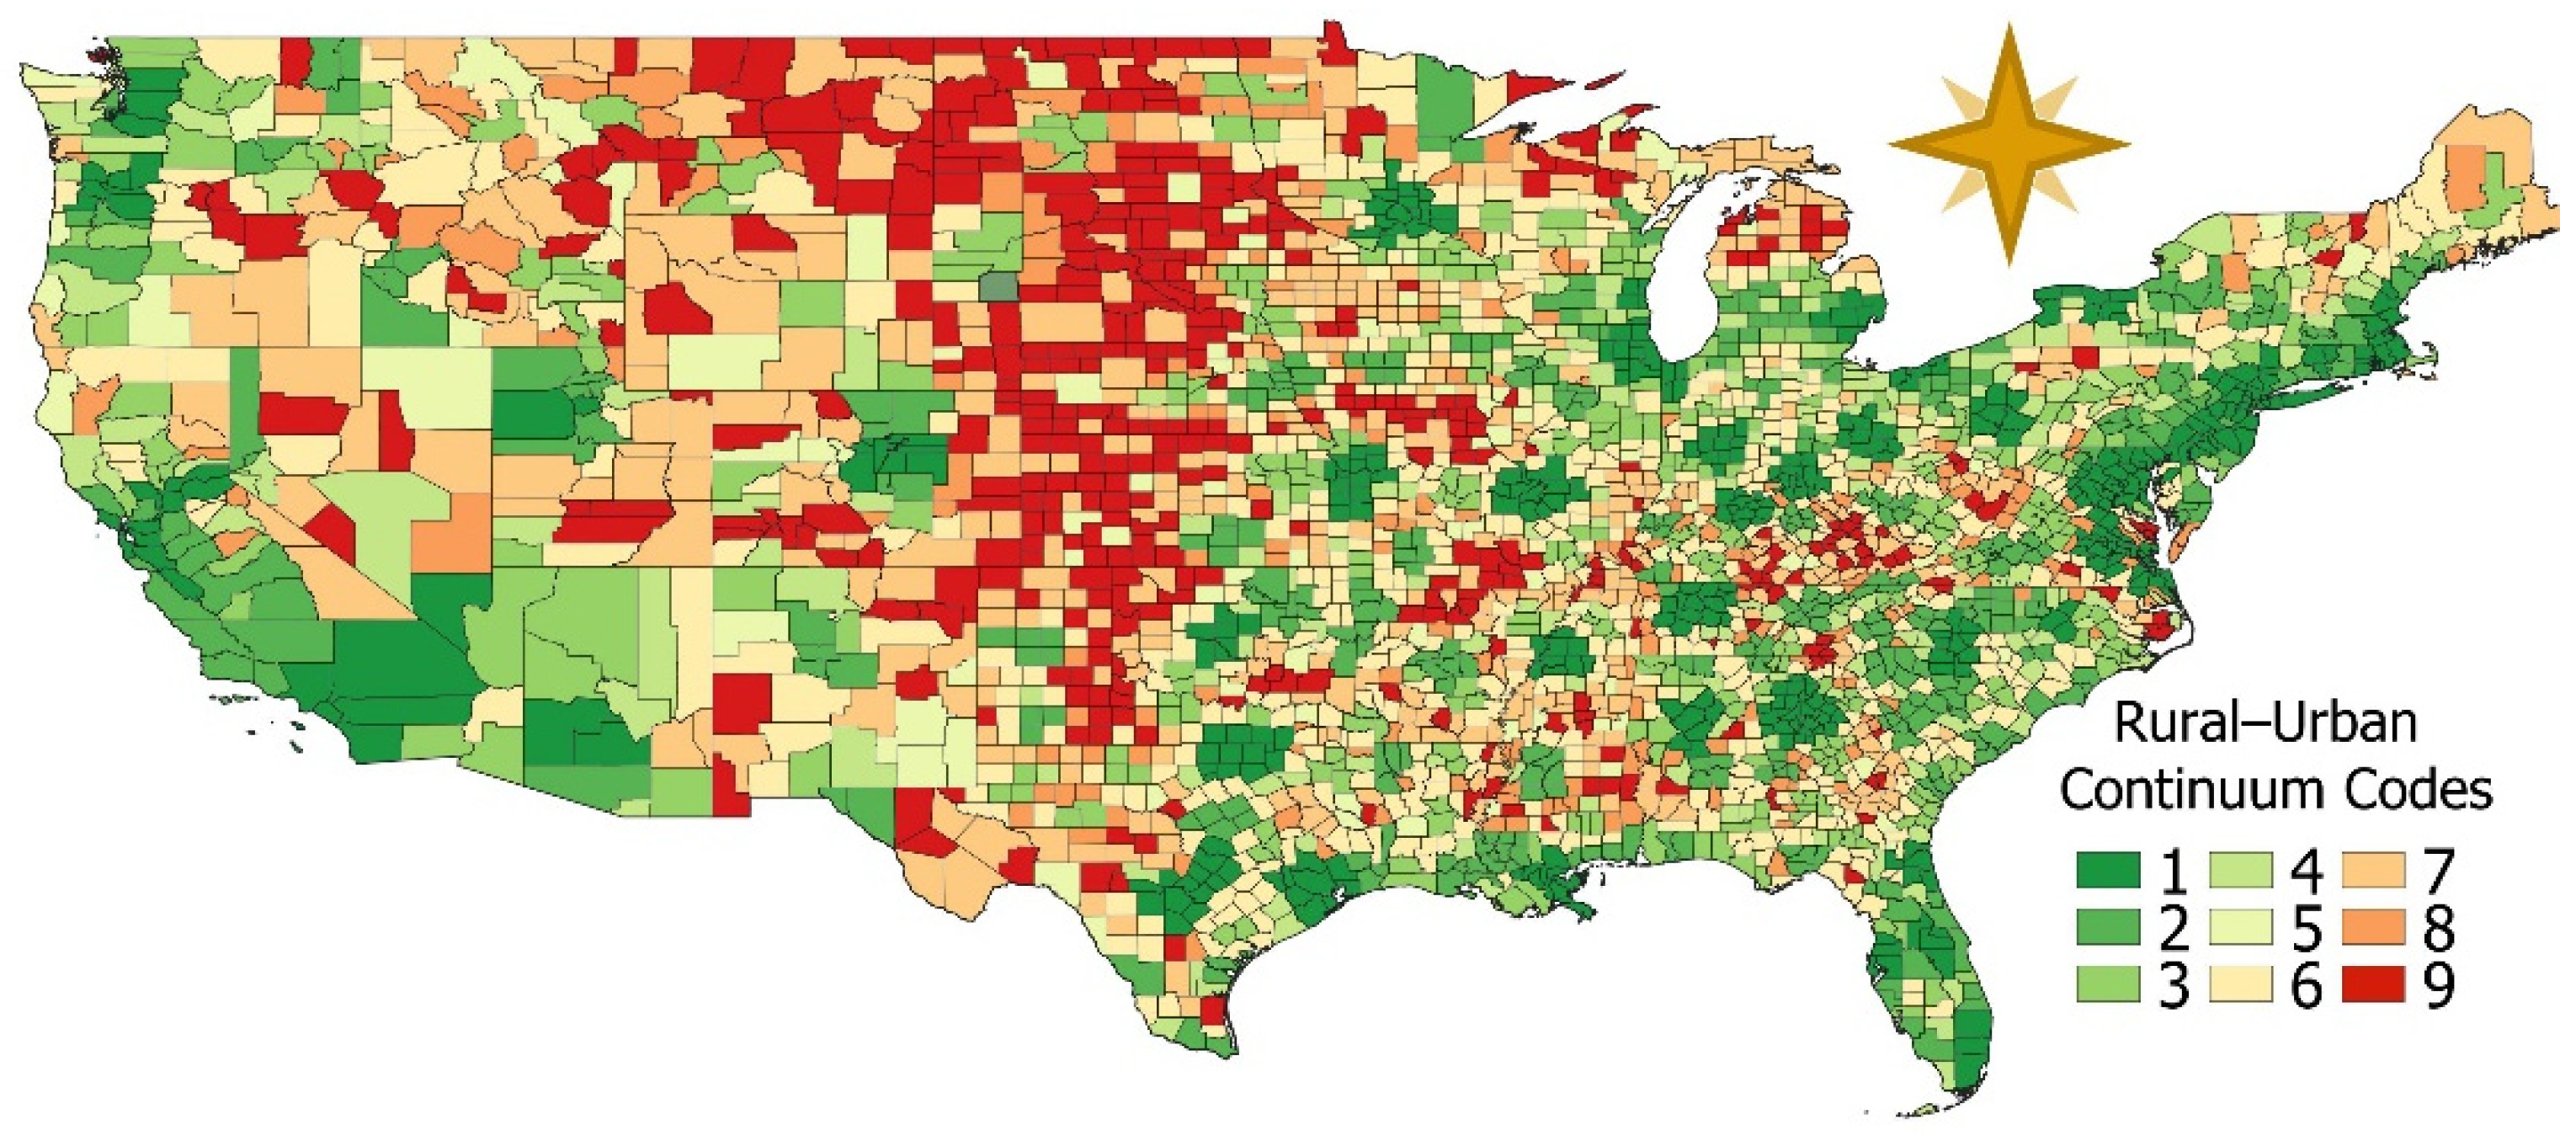
Big data analytics and Geographic Information Systems (GIS) were implemented to evaluate the more than 60,000 wind turbines in the US obtained from the U.S Wind Turbine Database developed by the U.S. Geological Survey (Rand et al. 2022). These data were combined with the datasets of school districts, obtained from federal and state sources. Department of Education databases and data for cities, Zip Codes, counties, population, and economic activity were obtained from the US Census Bureau (USCB 2010, 2019; IES-NCES 2022). To characterize rural locations, the GIS system was overlaid with the Rural–Urban Continuum Codes (URCC) developed by the US Department of Agriculture, as presented in Table 1 and Figure 3. The classification indicates the degree of county urbanization and proximity to metropolitan areas, distinguishing each county by size of population divided into metro and non-metropolitan locations (USDA 2020). Diverse graphical tools were utilized in the research to better highlight the financial benefits provided by wind energy to diverse local stakeholders. Among these charts, the plot box is very useful, allowing the trend for each particular rural classification to be observed and to include upper bound outliers. These upper bound outliers represent future investment trends for counties, school districts, and other local stakeholders. It showcases the magnitude on which some entities have become leaders in benefiting from renewable energy. Other stakeholders in lower investment parameters or no investment from wind will be able to identify these leaders and better appreciate potential benefits. The benefits will be an important factor to overcome social opposition to this industry, as indicated by previous research.

Table 1.
Description of the nine US county classes from the Rural–Urban Continuum Codes.
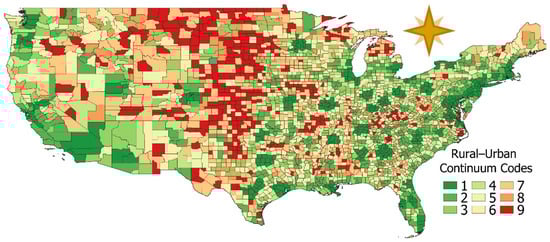
Figure 3.
Counties in the US classified according to the Rural–Urban Continuum Codes as indicated by USDA.
The lease rates paid to private owners by wind farm operators are not publicly available and contracts stipulate that this information should remain confidential. However, previous reports and the literature have discussed the structure and amount of potential lease rates and considering these ranges it is possible to model rental payments applying diverse structures. An option widely used implies a flat payment per wind turbine name plate capacity, on the ranges of USD2000–USD5000 per MW per year. However, USD2000/MW/year was standard before 2000 but as equipment has increased in power output and size, values are normally in higher ranges (Windustry 2009a; Wiser et al. 2019). In this research, rates based on the installed capacity of the wind turbines were applied to the wind farms in the US to assess the financial benefits that may be obtained by rural property owners. Granular analysis on the potential rental income per property owners for Texas was performed by integrating into the system the Land Parcels dataset provided by the Texas Natural Resources Information System (TNRIS 2022).
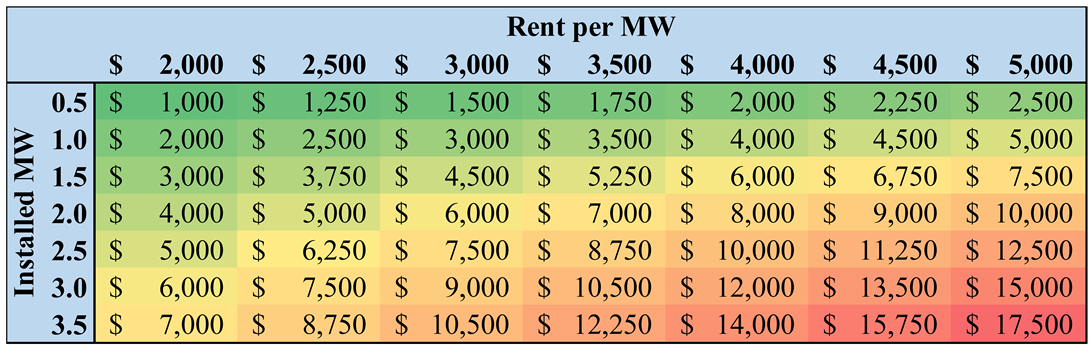
Annual lease payments for each wing turbine depend on the rent negotiated in the contract, per MW of NPC, and the size of the wind turbine, as shown in Table 2. Considering a uniform NPC and lease rate changing the increase for the lowest and highest among generates a growth of two and a half times between the highest and lowest values. On the other hand, maintaining the rental rate stable and changing the installed MW for the wind turbine may cause the annual income to increase sevenfold between the lowest and the highest values. This indicates the potential significant increase in rental financial benefits as wind turbine sizes continue to increase in the future.
Table 2.
Annual rental income from one wind turbine considering different NPC and negotiated rental rates (USD/MW).
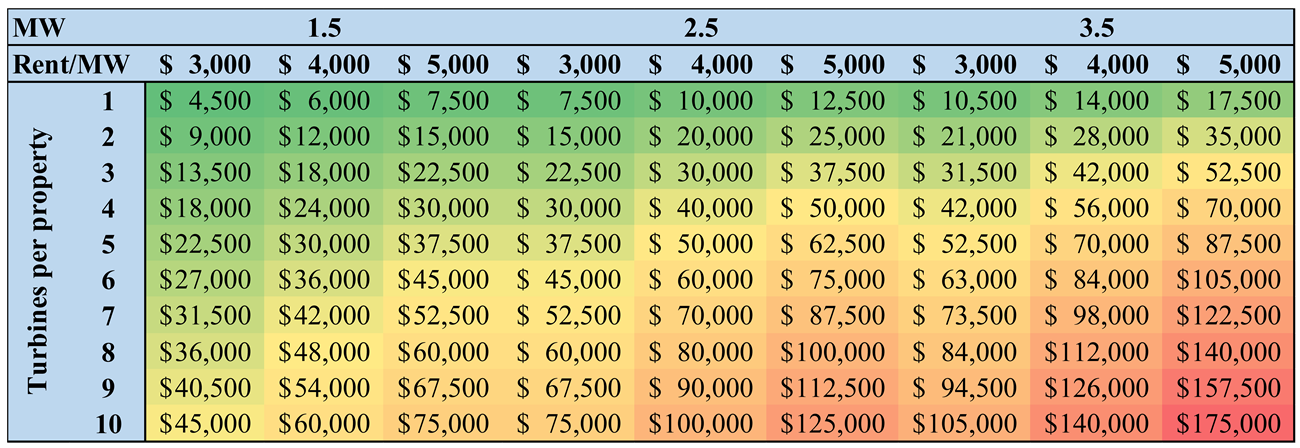
The potential for annual rental income for each property depends on the name plate capacity (NPC) of wind turbines (MW), the negotiated rent per MW, and the number of turbines in each property, as shown in Table 3. The lowest income corresponds a property with only one wind turbine, with a range between USD4500 and USD17,500 depending on the size of the equipment and the negotiated annual rent. The wide range of potential financial benefits from rent highlights the relevance of proper negotiation on the lease payment and equipment NPC to maximize income based on the size of the land plot, which could potentially accommodate a larger number of turbines.
Table 3.
Rental income per property considering the negotiated rental agreement (USD/MW), the NPC of the equipment and the number of installed wind turbines in the land plot.
5. Results
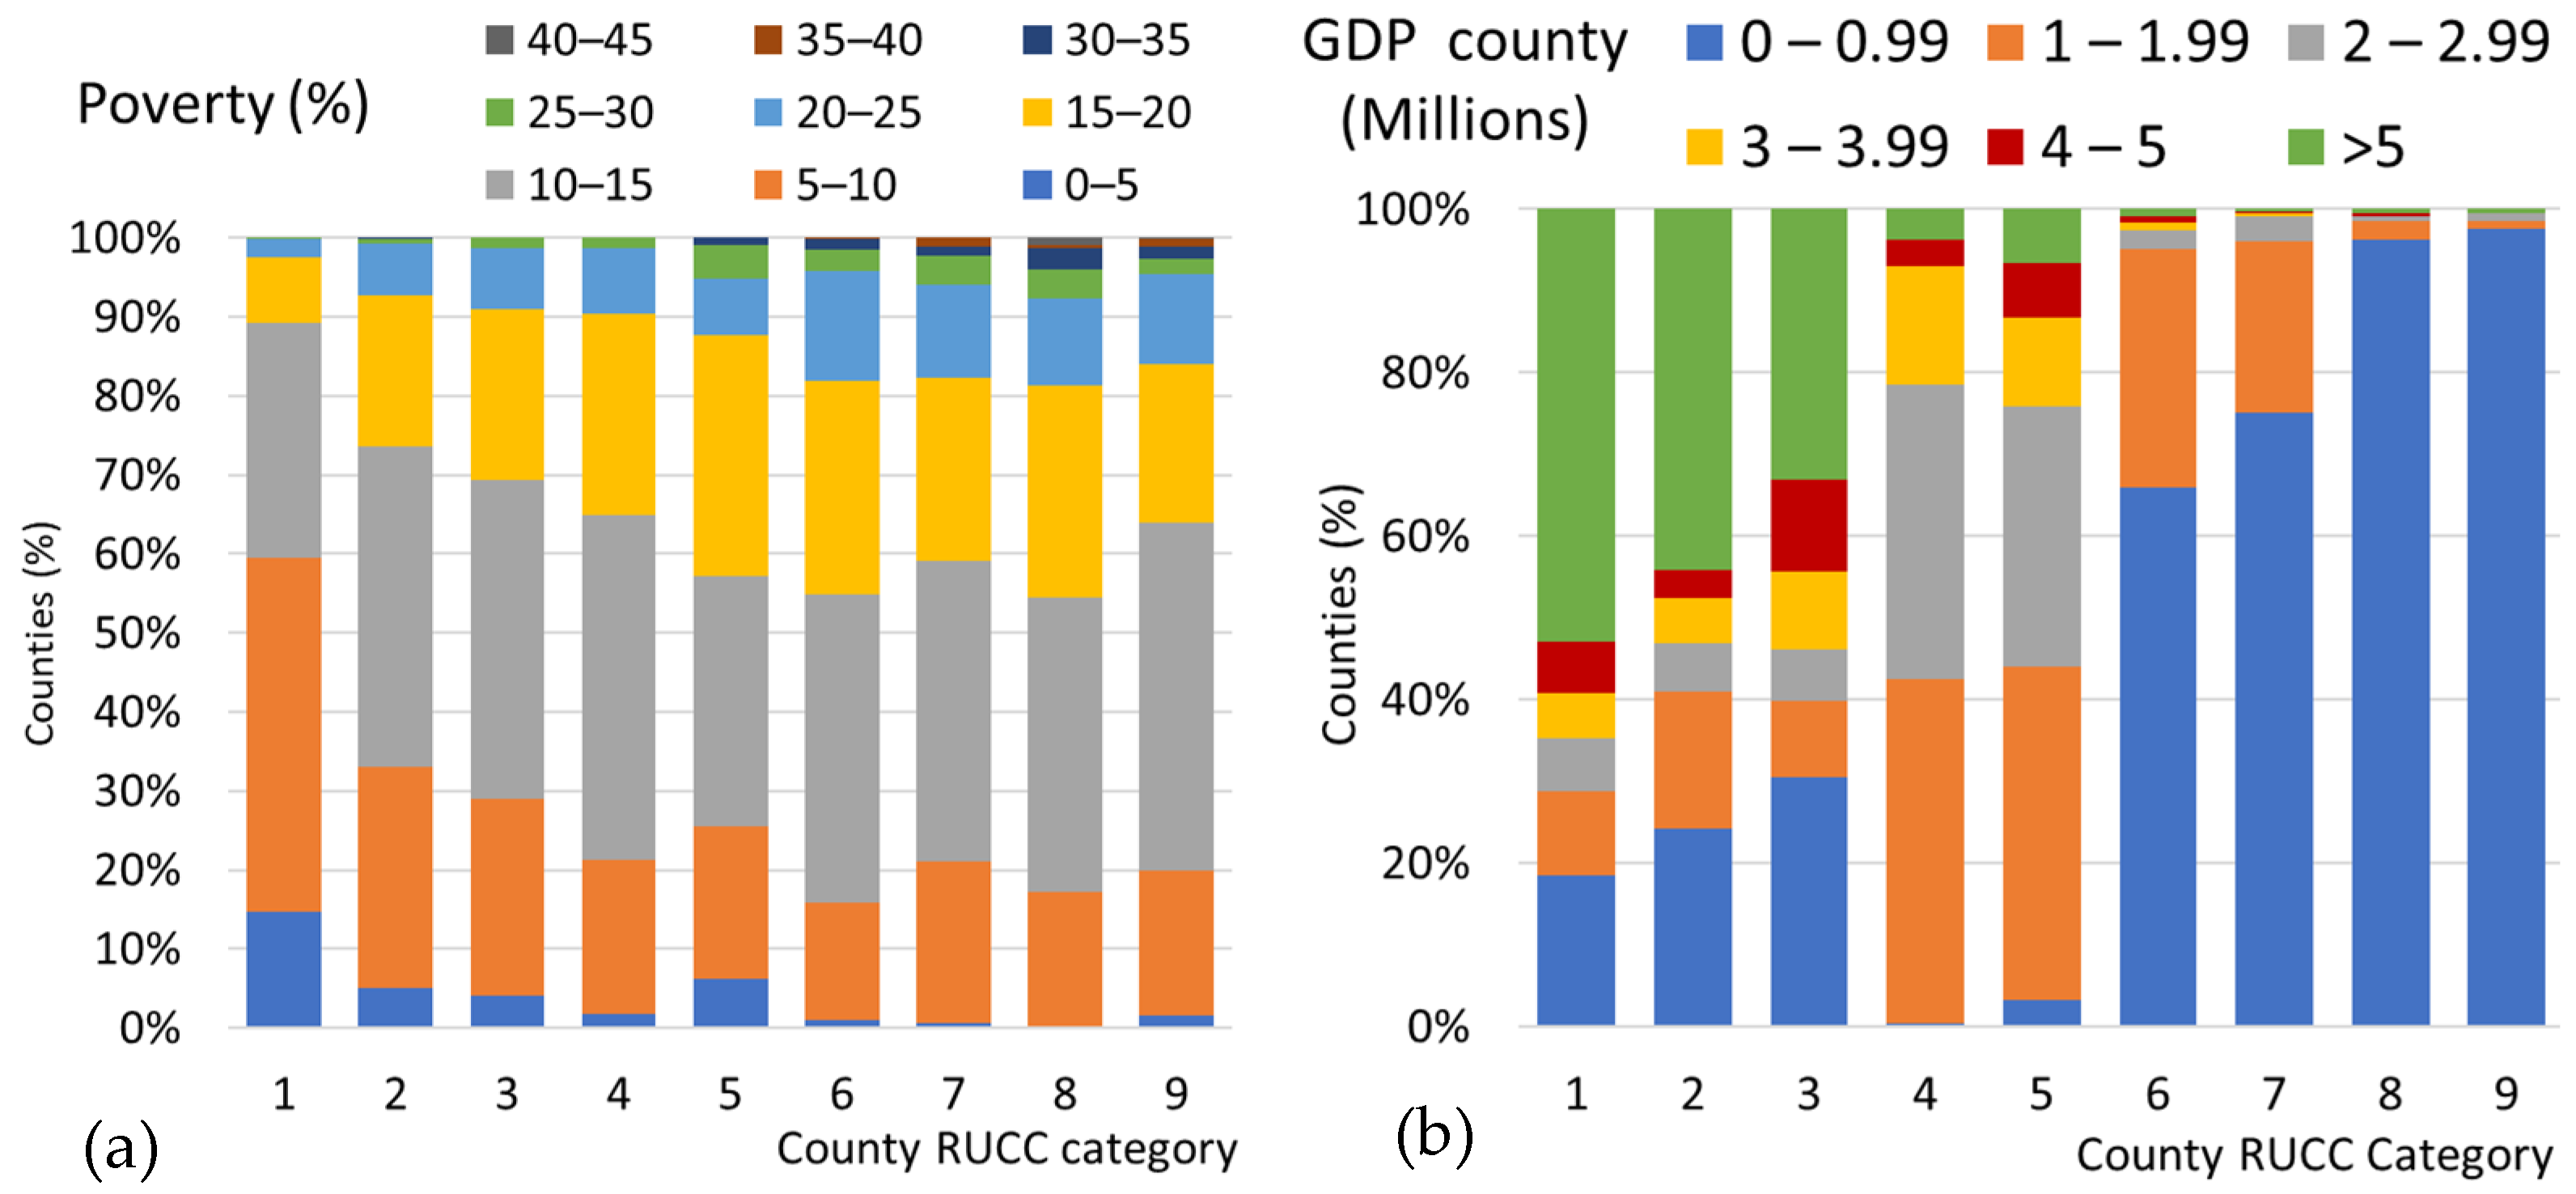
A US national assessment for rural populations in regard to economic activity and poverty was generated by the study as a benchmark to evaluate potential financial benefits to these locations from wind energy. Figure 4 provides this US national assessment classifying counties according to the Rural–Urban Continuum Codes developed by the US Department of Agriculture (USDA 2020). Poverty data were obtained from the Small Area Income and Poverty Estimates (SAIPE) Program developed by the US Census Bureau (USCB 2021). Counties economic activity was evaluated applying the Gross Domestic Product by County developed by the Bureau of Economic Analysis from the US Department of Commerce (BEA 2021). Figure 4a presents the Poverty Estimates for each county classified according to the USDA Rural–Urban Continuum. For counties in category one, metro areas of population of more than 1 million, less than 11% of the counties have more than 15% in poverty. For the remaining categories in the Metro bracket (2 and 3) less than 30% of the counties have more than 15% of their population in poverty levels. On the other hand, for non-metro counties, more than 35% of them have more than 15% of its population in poverty and more than 10% of these counties have poverty levels higher than 20%. Furthermore, only non-metro counties have poverty levels above 30%. Figure 4b further highlights the lower level of economic activity in rural counties. Almost all rural counties (categories 4–9) have a GDP of less than USD one million, with 96% of category 8 counties and 98% of category 9 counties in this low level of GDP. In contrast, a large number of metro counties (categories 1–3) have GDP higher than USD5 million, with 53% of category 1 counties having this higher level of GDP. This analysis highlights the relevance of procuring economic opportunities for non-metro rural counties to provide higher living standards to its population and create local interest in the development of new wind farms.
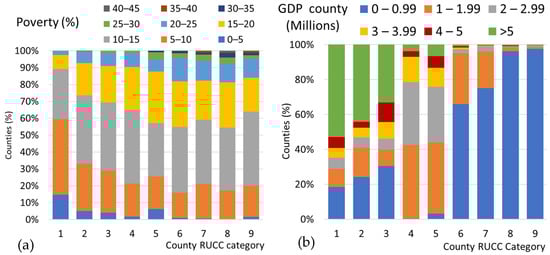
Figure 4.
Counties economic activity and estimated poverty classified considering the USDA Rural–Urban Continuum Codes. (a) Poverty Estimates from USCB-SAIPE. (b) GDP per county from USDC-BEA.
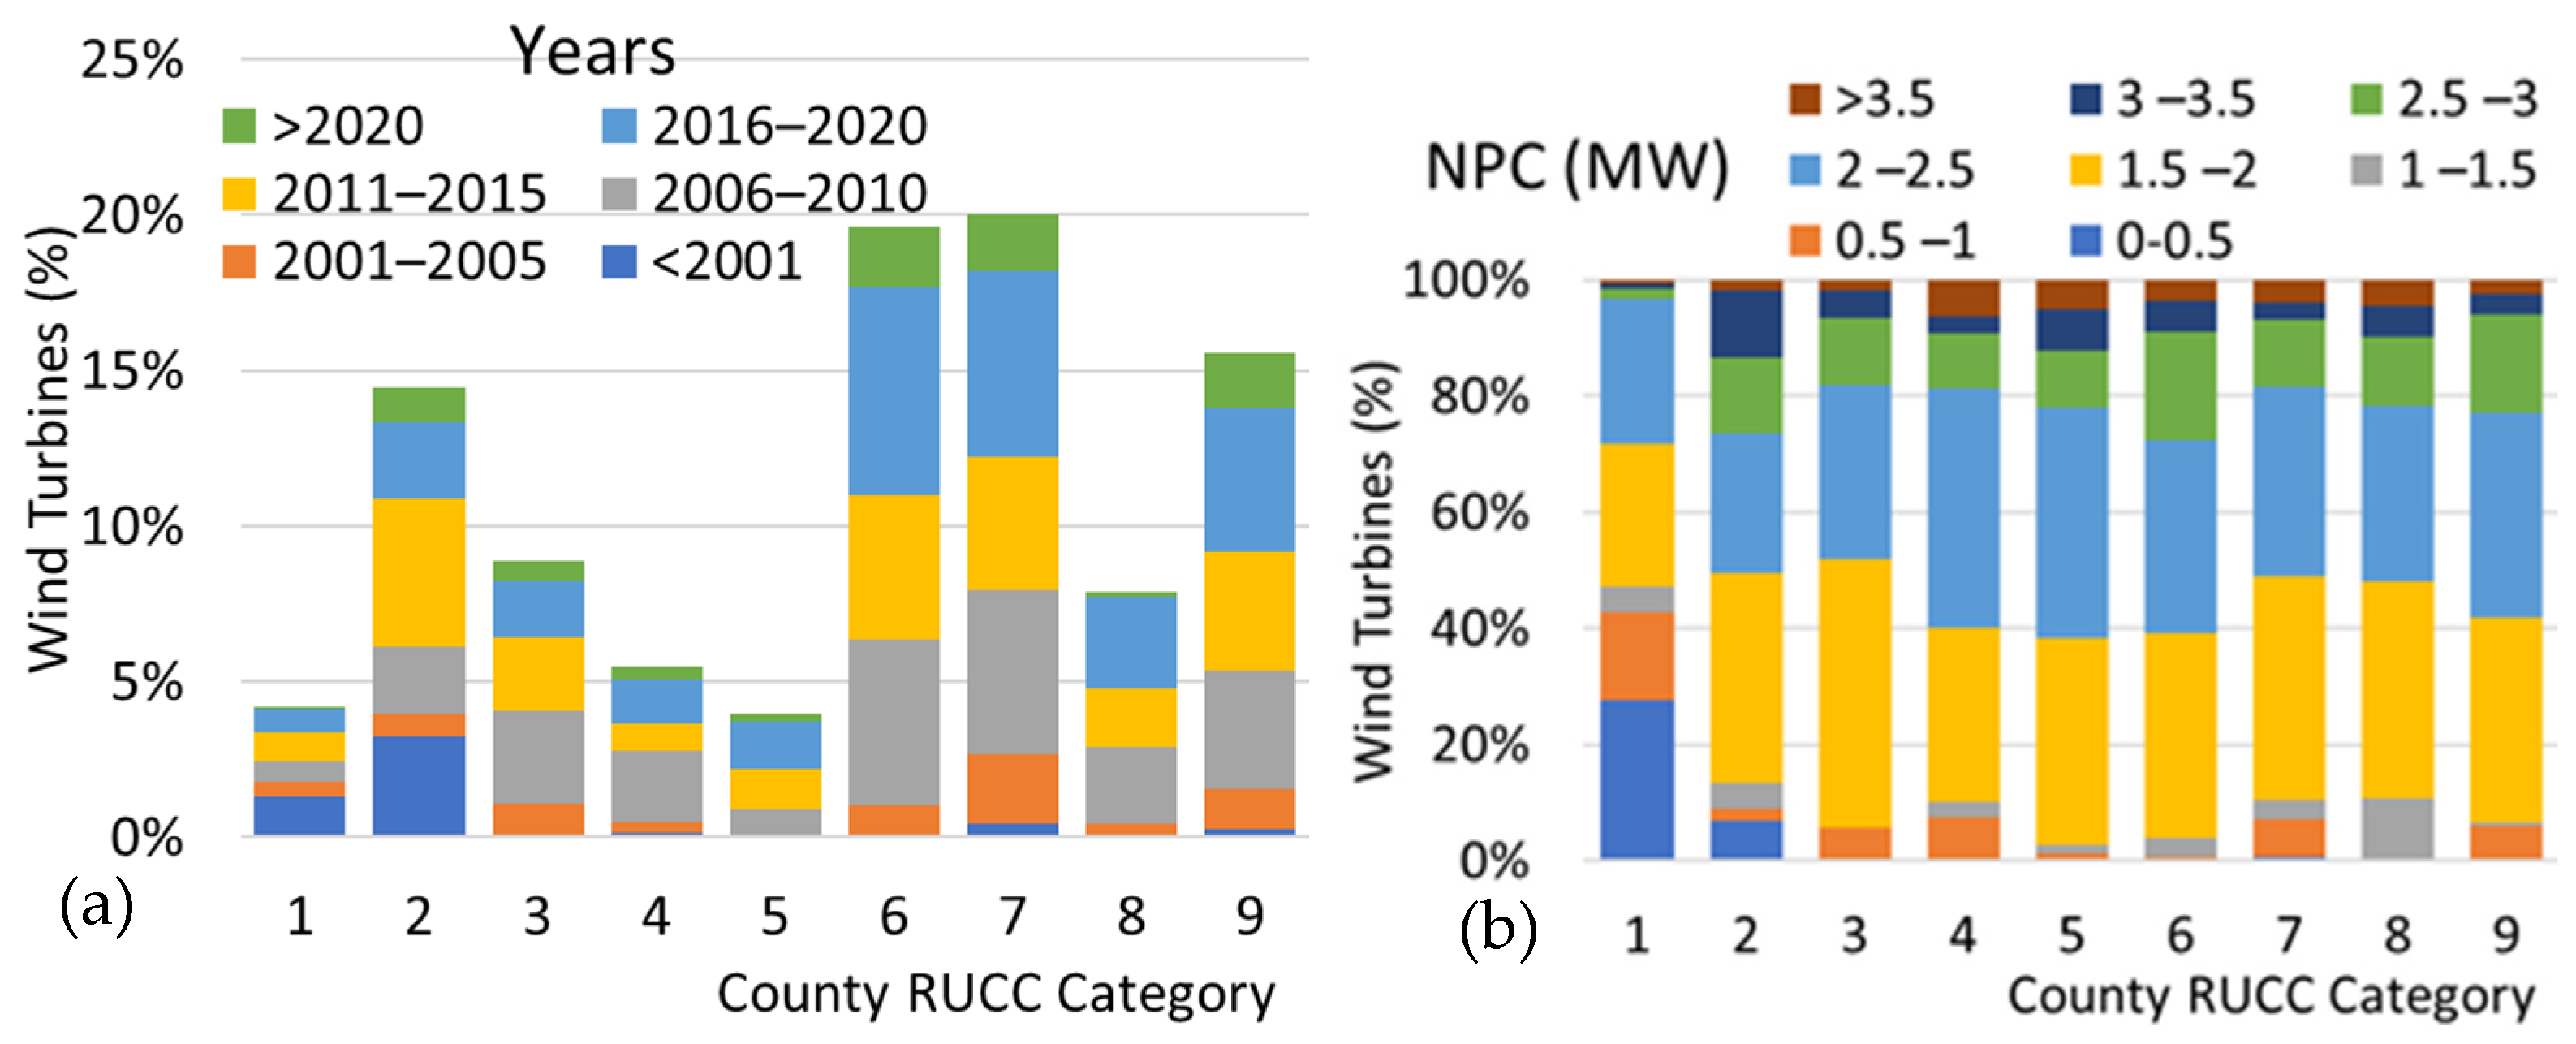
To better understand the potential economic impact of wind energy in rural areas Figure 5 shows the breakdown of the placement of wind turbines across the US classified according to the USDA Rural–Urban Continuum Codes. Figure 5a showcases that more than 72% of all wind turbines are placed in rural areas (categories 4–9) while less than 5% are installed in metro areas of population of more than 1 million (category 1). Furthermore, more than one third of these turbines in category 1 counties are legacy equipment, installed before the year 2001, 60% of which are located in California. Therefore, most of the advanced wind turbines are installed in rural areas, with almost 73% of them located in categories 4–9 areas and 50% installed after the year 2010 in rural placements. The analysis indicates that the trend to install wind turbines in rural locations is accelerating. This is confirmed by results in Figure 5b, considering that smaller Name Plate Capacity (NPC) equipment was installed at historically earlier times. More than 50% of turbines installed in metro areas (category 1–3) are smaller than 2 MW NPC and for category 1 it increases to 72% of all installed equipment. On the other hand, almost 77% of all turbines 2.5 MW NPC or higher are installed in rural locations (category 4–9) and more than 87% of NPC higher than 3.5 MW are installed in these locations. Wind turbine placement is being carried out in greater numbers and for larger NPC in rural locations, benefiting local populations, which have otherwise limited economic opportunities.
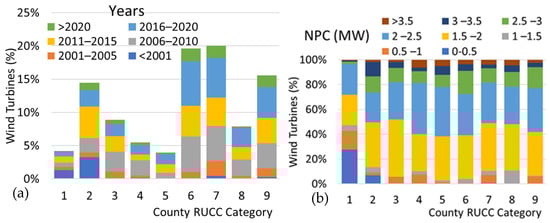
Figure 5.
Wind turbines according to the USDA Rural–Urban Continuum Codes considering (a) the number (%) of wind turbines classified by installation year considering the ranges (in years) indicated in the chart legend and (b) the number (%) of wind turbines classified by NPC.
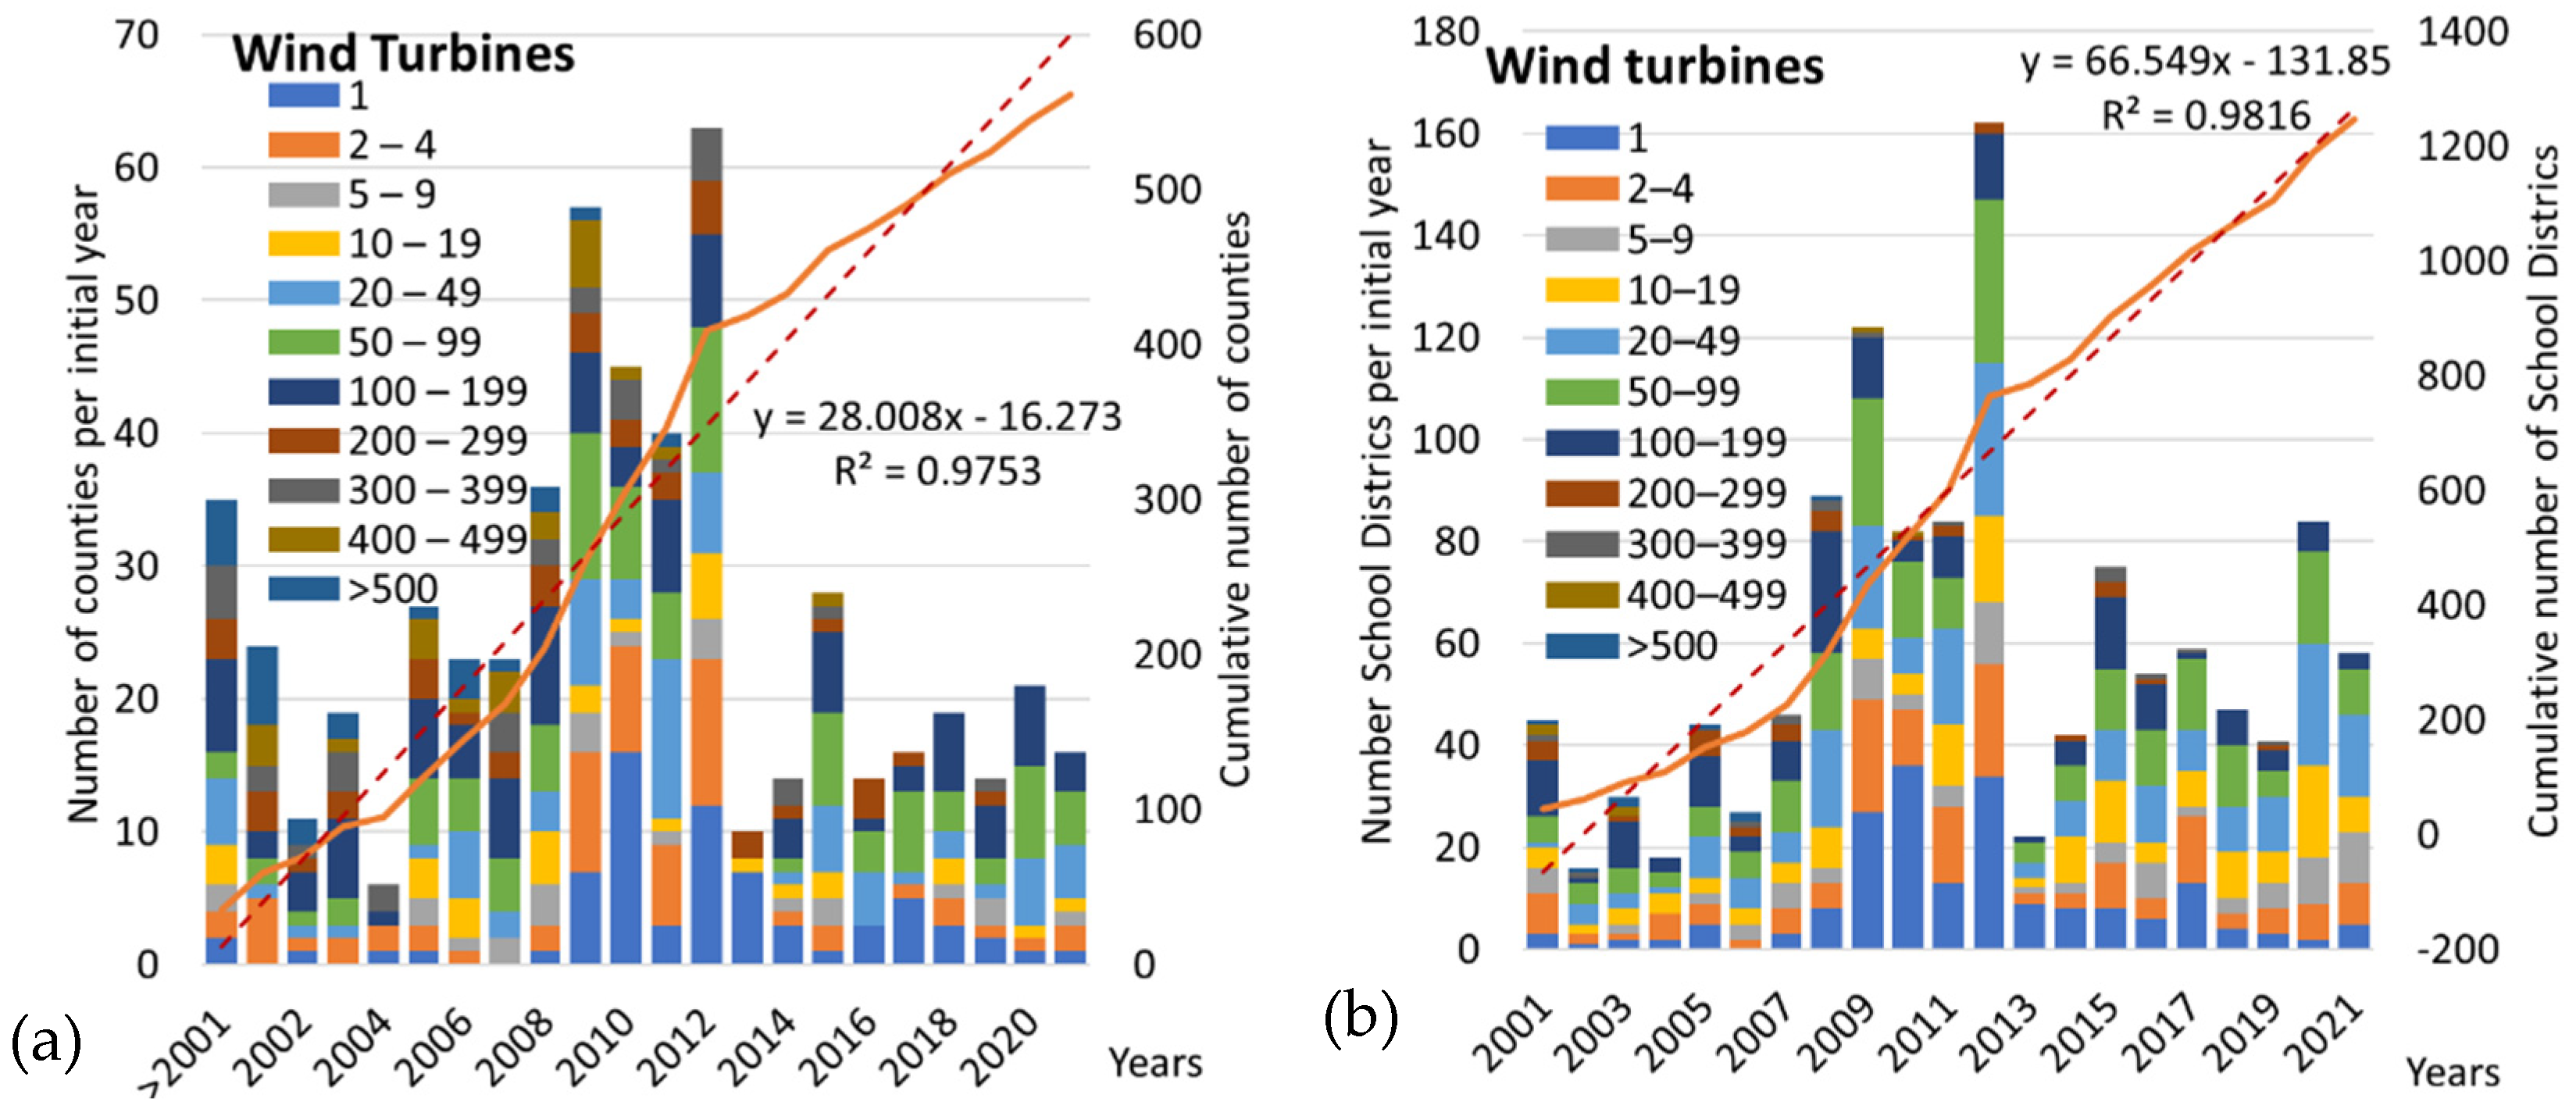
Wind turbines installed in rural locations increase fixed assets capital investment. These new assets increase the revenue base, providing additional tax collection for local counties and income for school districts on which the equipment is located. New employment opportunities and rental income for local landowners are also derived from these investments. Figure 6a indicates that more than 560 counties have wind turbines installed in their jurisdictions. The analysis shows the number of counties that previously did not have wind turbines installing their first equipment each year and categorized by the total number of turbines currently installed in each location. The number of new counties installing wind turbines for the first time shows a linear growth trend with more than 28 new counties being added every new year. Furthermore, the results indicate that counties with more than 200 wind turbines on average started installing their equipment in 2006 and have on average installed new equipment in at least five different years during the last twenty years. This showcases how counties that have already wind power in their territory have incentives for additional equipment installation and new counties are being added every year, in consideration to the potential benefits this industry provides to local populations. For school districts in rural areas wind farms represent a significant influx of resources that help them to provide educational services to many underserved populations. As shown in Figure 6b there are more than 1200 school districts all across the US with wind turbines installed in their geographic limits. This equipment provides additional real estate tax income that benefits the school districts. The chart presents the number of school districts that have turbines installed for the first time in a particular year with brackets classifying the total number of wind turbines in that particular district. The growth of new school districts accepting turbines is significant, with a linear average growth of more than 66 every year, with 2020 showing an addition of 84 new districts that previously did not have this equipment installed. Satisfaction with the results after installing the equipment is reflected by the fact that more than 41% of the school districts have installed wind turbines in two separate years, 20% in three separate years and 9% in four separate years. Furthermore, school districts with more than 200 wind turbines represent 5% of this group but have installed wind turbines on average almost five times during the last twenty years. This reflects strong satisfaction by school districts on having turbines in their district and potential growth to additional untapped school districts territories.
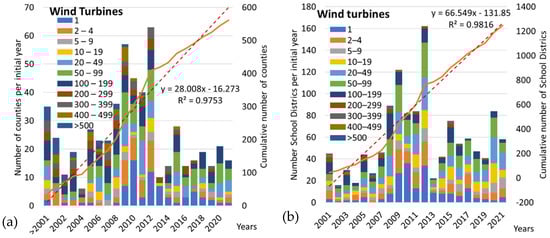
Figure 6.
Wind turbine initial installation year categorized by the total number of wind turbines placed inside as indicated with (a) individual counties (b) School Districts. Data are characterized by applying lineal regression, with the chart displaying the equation for the regression model with x as the independent variable and y as the dependent variable. R2 is the coefficient of determination indicating a very good fitness for a linear regression model.
According to the US Energy Information Administration the average cost for onshore wind generation capacity has significantly decreased in the last decade across the US. In 2013 the average cost was USD1895 per kW while by 2019 it was USD1391 per kW (EIA 2021). Considering that wind turbine NPC has significantly increased in this same period, it is relevant to assess the real economic impact from these investments over individual counties and school districts. The values previously indicated will be considered as lower and higher limits to perform this assessment. Figure 7a for the highest value and Figure 7b for the lowest value both indicate the overall initial valuation of installed wind turbines classified by county USDA category and by installation year. Almost 80% of this value is installed in rural counties (categories 4–9) while in rural counties category 5–9 most of the inventory value was installed recently, with more than 70% deployed after 2010 and more than 50% after 2015. This highlights a trend of wind investment growth in rural counties. This property increase value in diverse counties implies an expansion on the taxable base and increase in revenue for both counties and school districts. The previous literature has indicated that wind energy investment increases the educational quality of local schools, causes a decline in local taxes, and increases overall living standards and quality, proportionally to the investments. In this case, for the lower value of equipment parameter total investment for rural counties would be higher than USD145 billion which could reach almost USD200 billion if the higher USD/kW value was considered. This highlights the relevance of wind investments for local communities and the reduction in social opposition for renewable energy that could be achieved if a wider outreach for this information was attained.
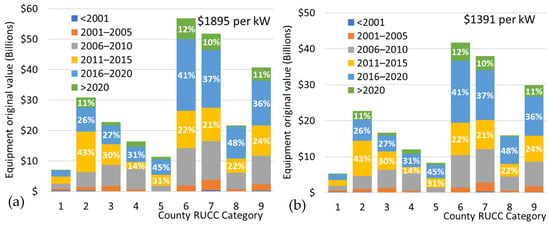
Figure 7.
Wind turbine equipment original value at different values per NPC (a) USD1895 per kW (b) USD1391 per kW.
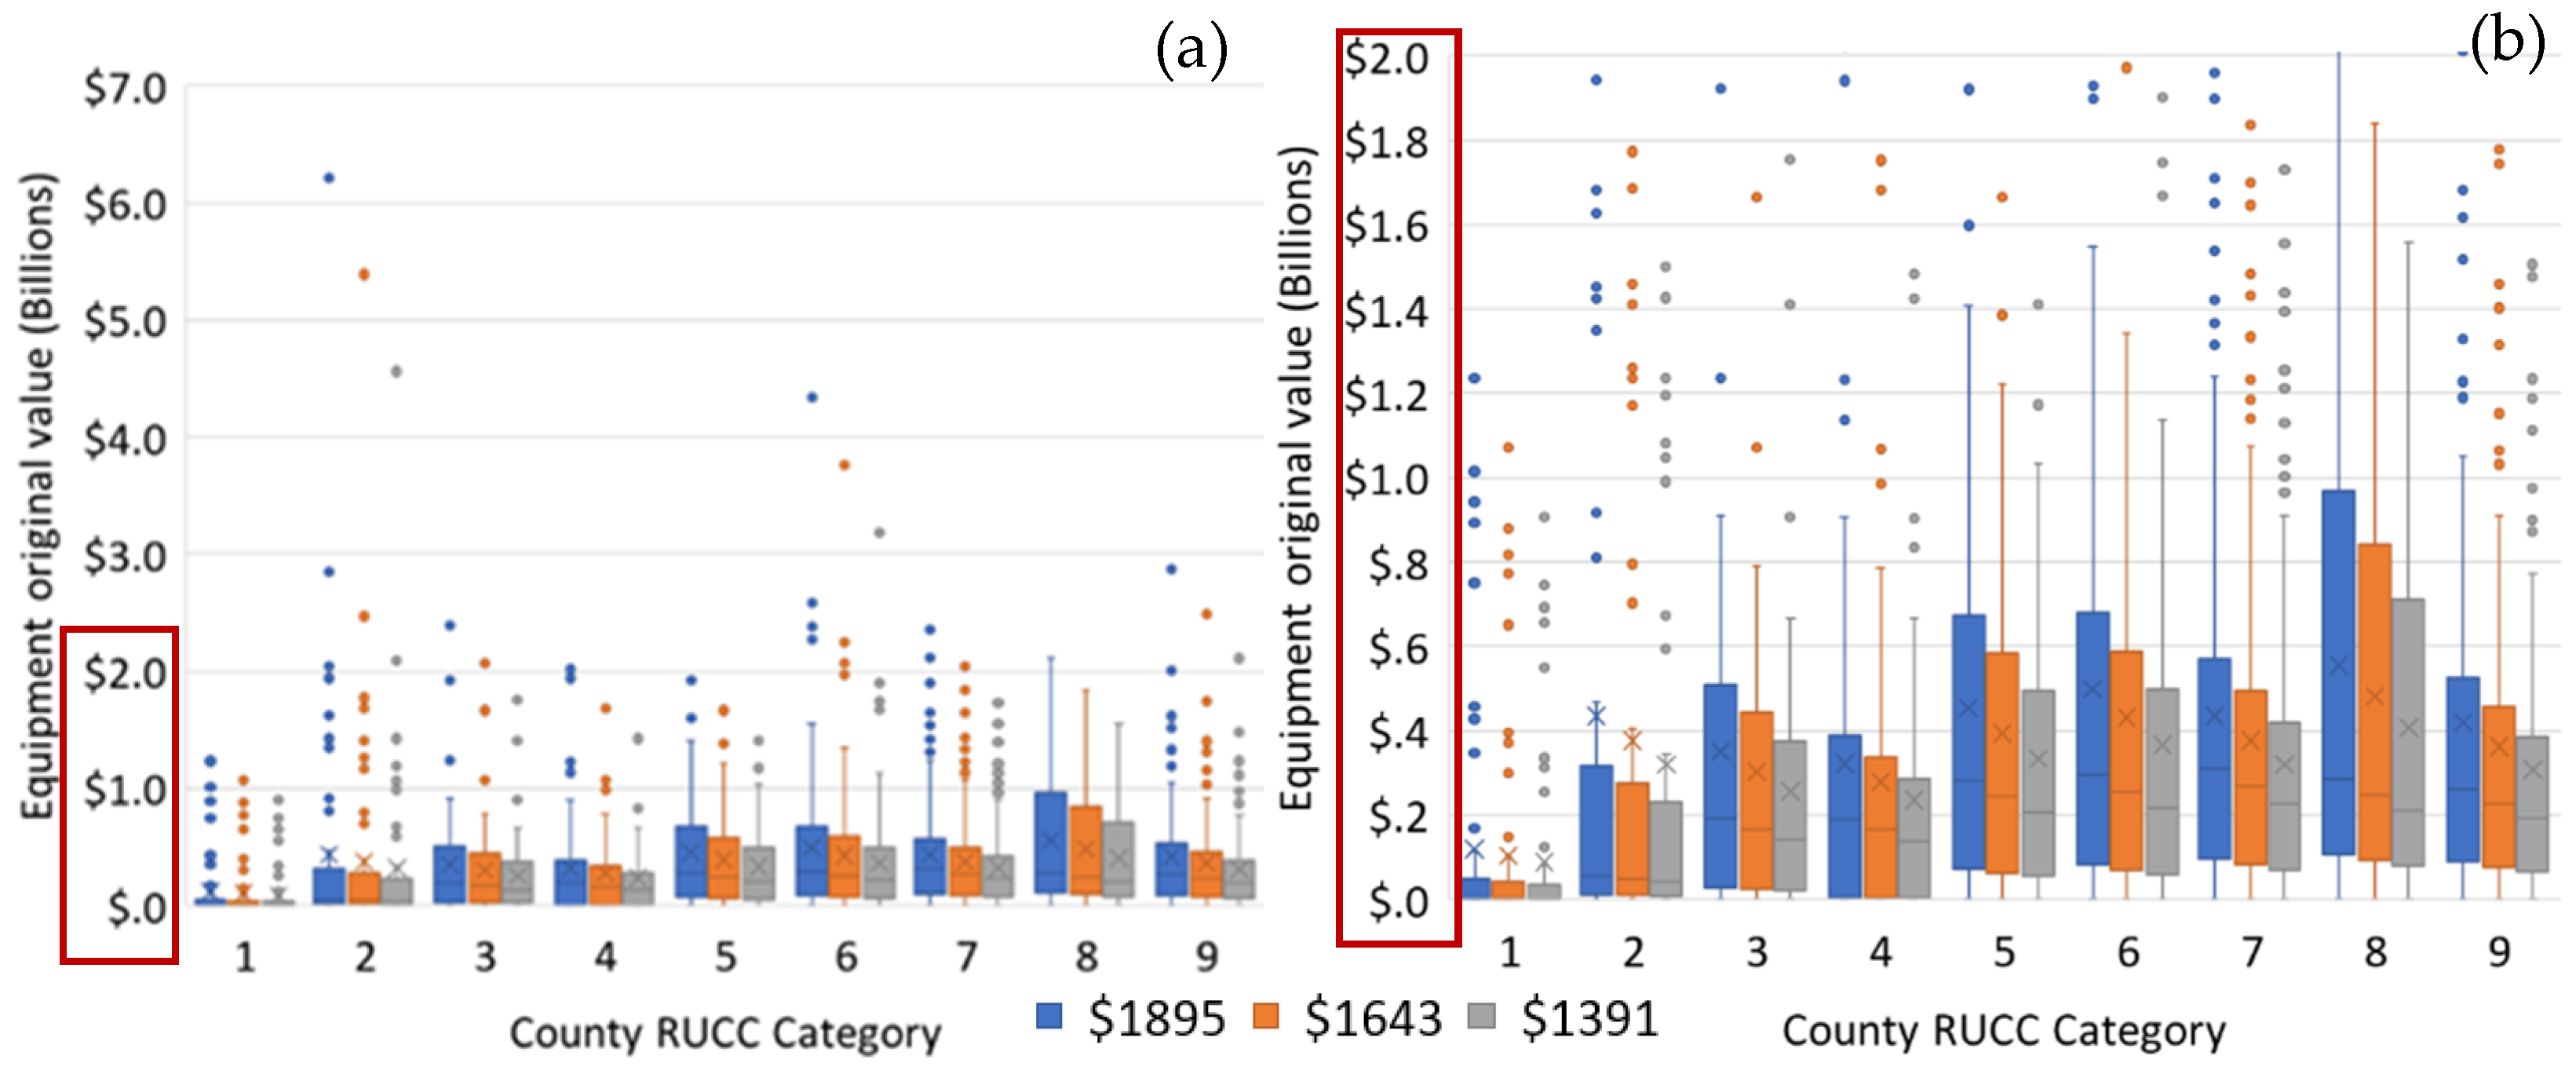
Plot box and whiskers analyses shown in Figure 8 are useful to assess individual county investment from wind turbines applying the three ranges evaluated in NPC values. The overall trend presented in Figure 8a indicates that individual rural counties have each derived a significant investment from wind equipment. For all rural counties higher than USDA category five, the average investment is higher than USD0.2 billion, with most of these counties having a third quartile between USD0.6 and USD1 billion. However, there are significant number of counties reaching to higher values for the last quartile. Applying the lowest valuation parameter, almost 8% of all counties have investment higher than USD1 billion, of which 75% are in rural counties as shown in Figure 8b. The significant number of outliers in the figures highlights the large number of counties starting to reach individual wind energy investments higher than USD1 billion. With this high new taxable base opportunities and additional county improvement projects, each county will be able to significantly increase the standard of living of their populations and therefore reduce poverty levels. Developing outreach material on this recent development will reduce social opposition not only on the benefited counties but on other counties that have wind energy potential and may be reluctant to accept these new projects. Becoming aware of the great relevance of these investments counties without wind power will be more receptive for renewable energy projects. This will not only reduce local poverty levels but achieve global sustainability goals, reducing greenhouse gasses emissions and curving climate change.
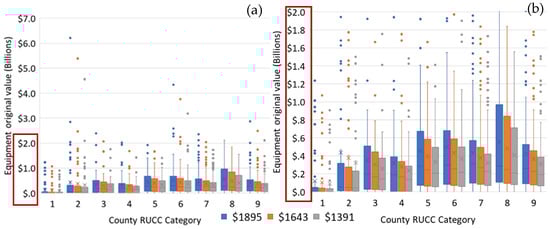
Figure 8.
Wind turbine original value installed in different counties (a) full range values in y-axis (b) limited range values in y-axis to enhance data visibility.
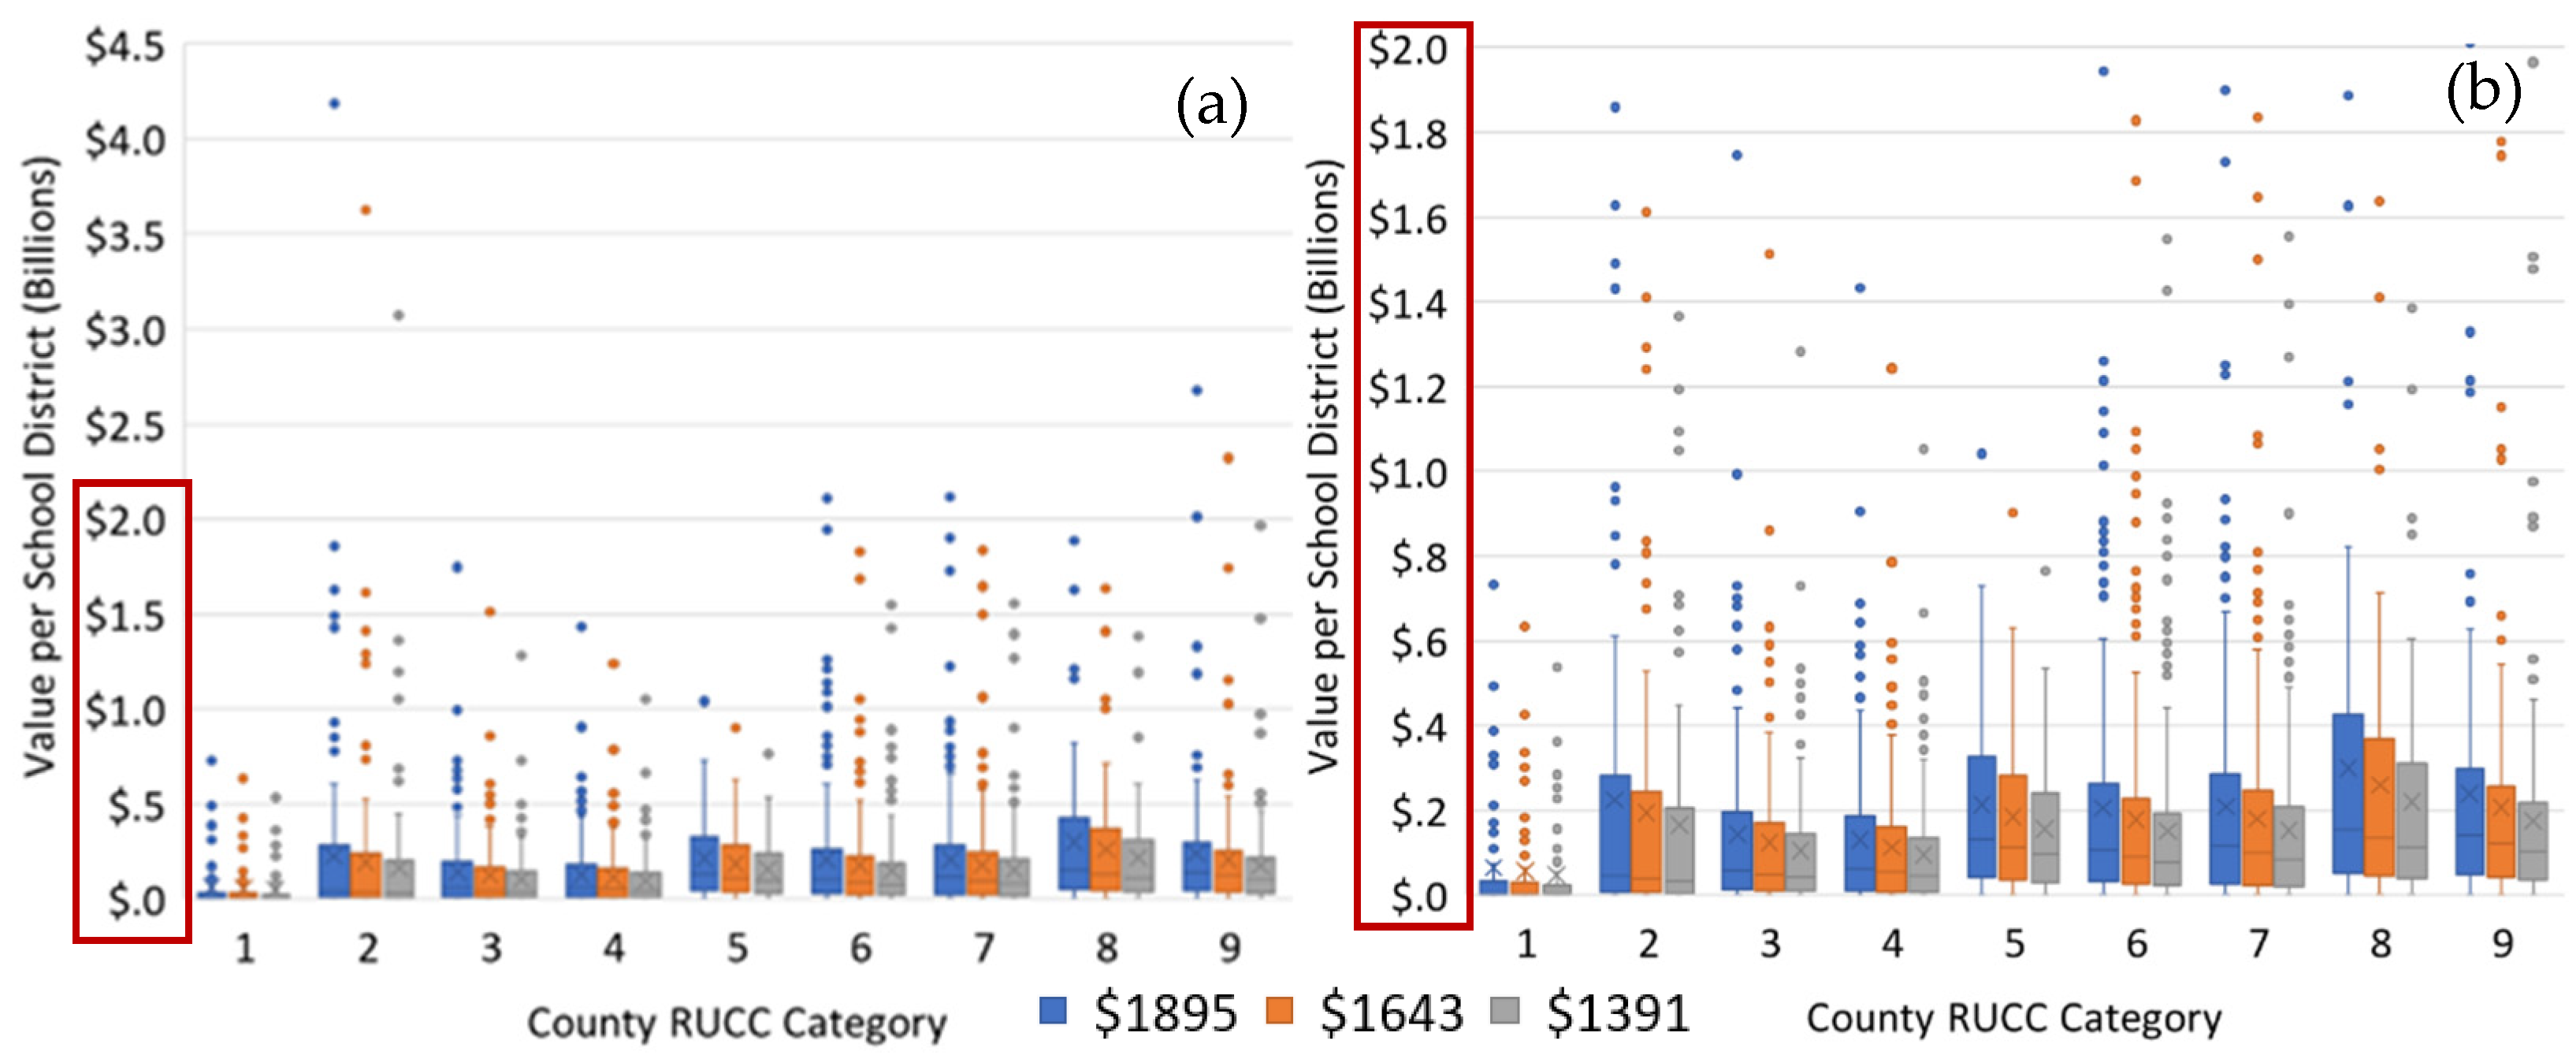
Figure 9a indicates that from the more than 1300 School Districts that have wind turbines installed in their area, many have significant investments in their territory. For School Districts located in USDA rural categories 5 and higher the ranges between the second and third quartile is relevant, reaching up to values higher than USD300 million. Additionally, the fourth quartile reaches values higher than USD500 million and to USD800 million for many of these districts. Figure 9b increases the y-axis resolution to obtain a better perspective on the fourth quartile ranges and outlier values. Performing a conservative assessment on the outlier valuation counties, applying the lowest valuation threshold, it is possible to obtain a better perspective of the significant investment values placed on School Districts. Of all districts with installed wind turbines, 41% have investments higher than USD100 million, while 23% higher than USD200 million and almost 6% have equipment valued higher than USD500 million. The large number of School Districts with wind energy investments that appear as outliers in the present plot box highlights the very good opportunities available to provide additional revenue to improve education in rural communities. The previous literature has indicated that wind energy investment increases on each school district the quality of education increases (Kahn 2013), providing very good arguments to reduce social opposition to these sustainable investments. Therefore, these opportunities not only decrease rural poverty but improve global sustainable energy supplies.
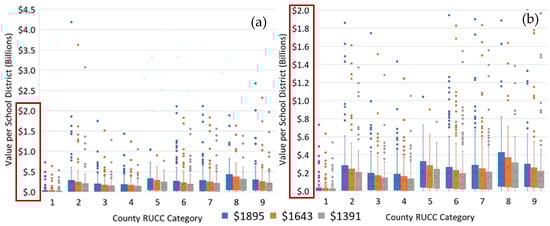
Figure 9.
Wind turbine original value installed in different school districts, classified for their county USDA category. (a) Full range values in y-axis. (b) Limited range values in y-axis to enhance data visibility.
6. Discussion
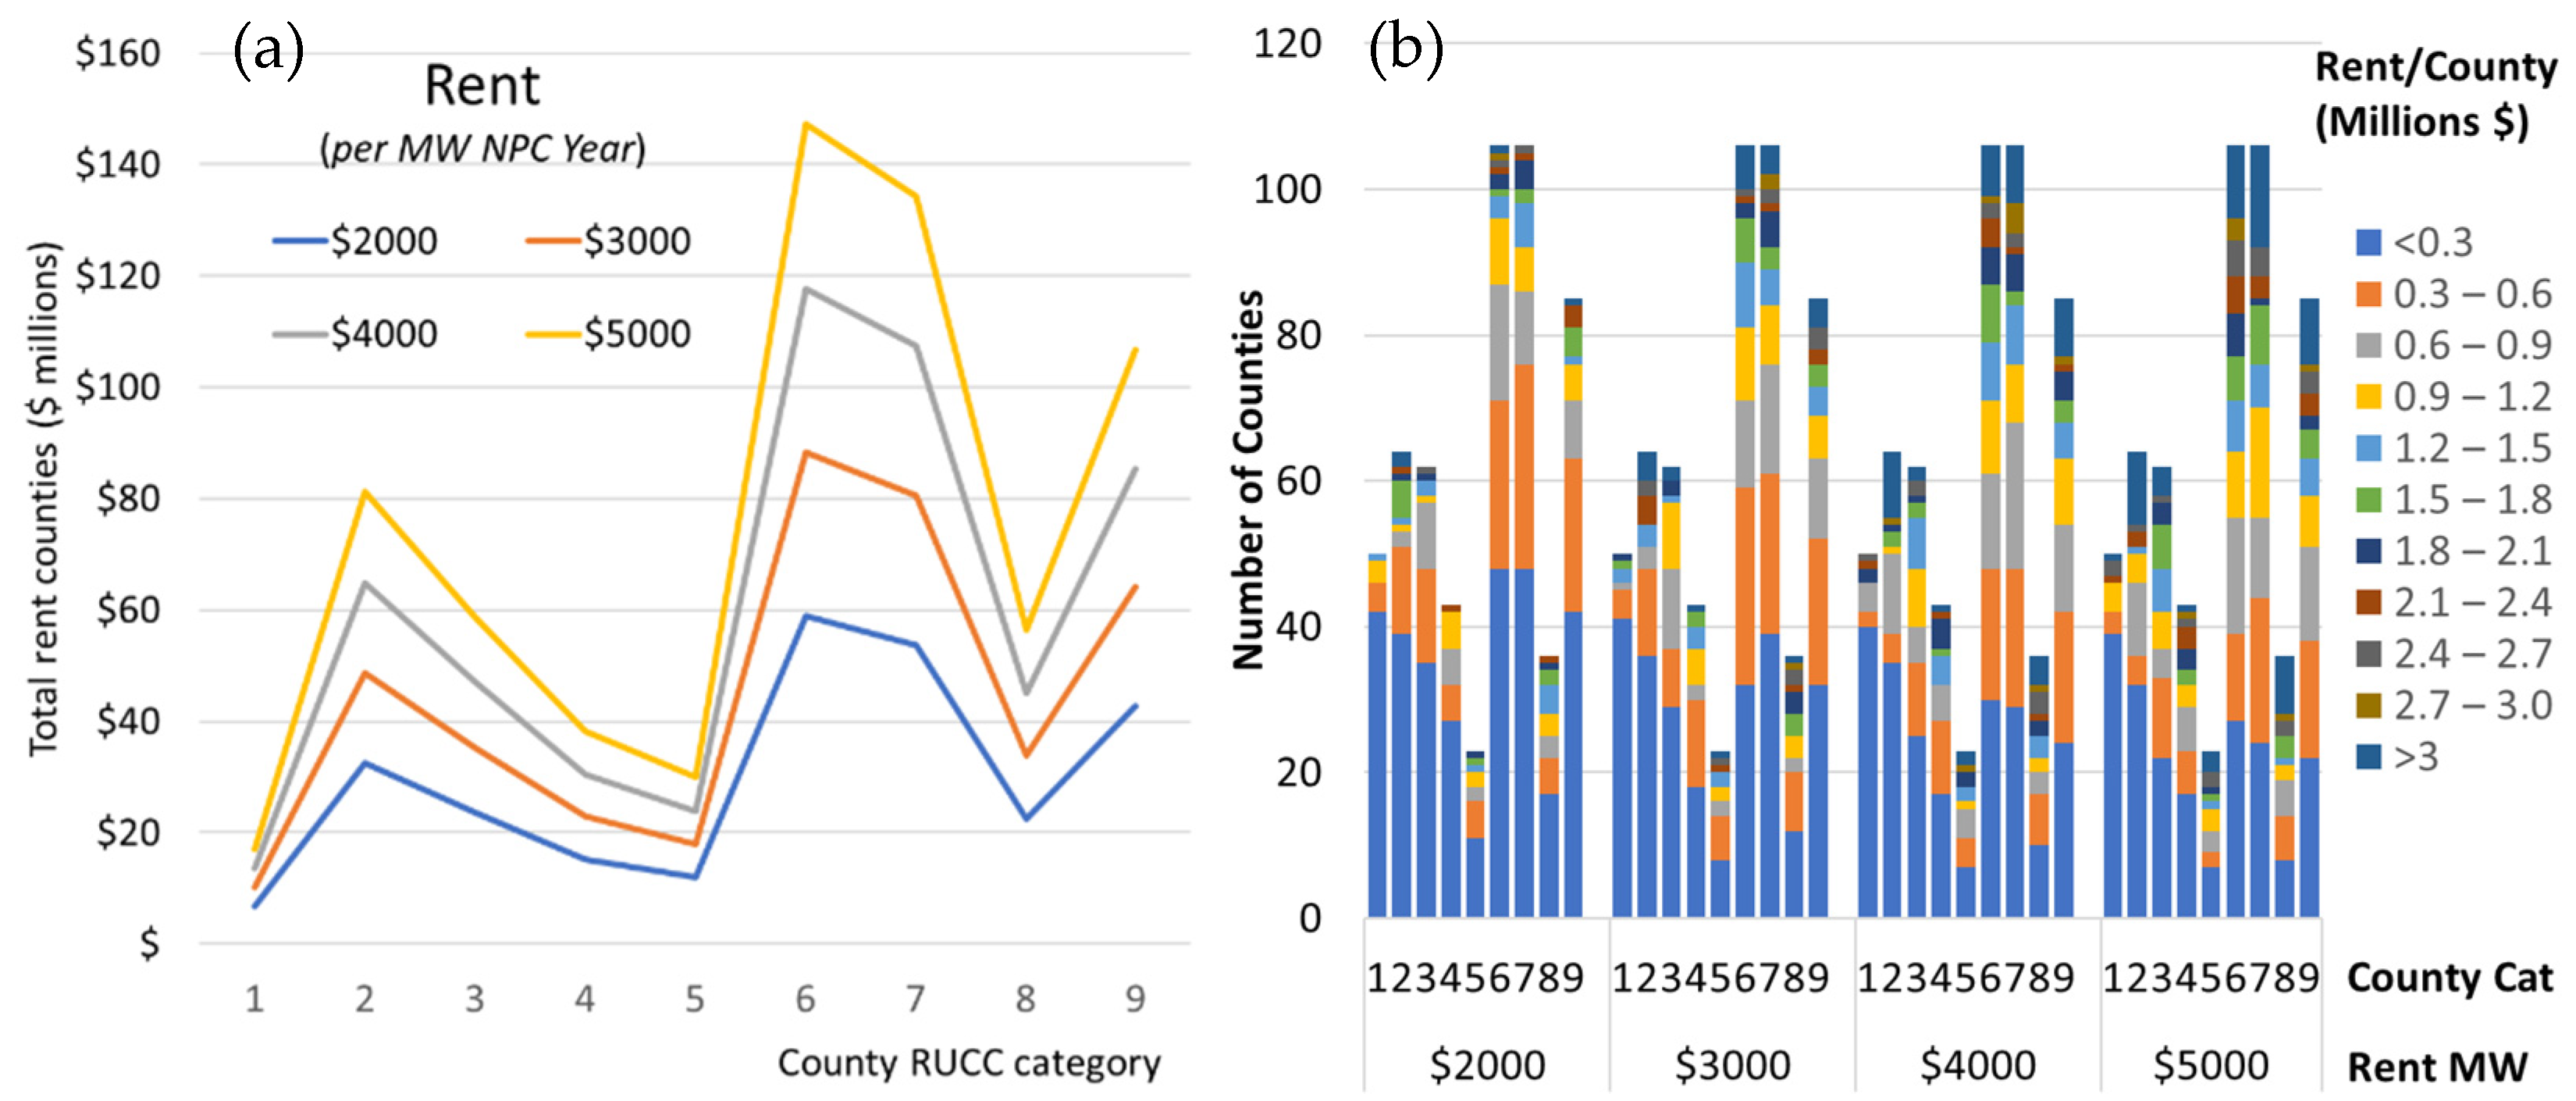
A frequently used approach to calculate rent payment for installed wind turbines is for a fixed yearly sum calculated according to the NPC. The fixed payments range from USD2000 up to USD5000 per MW of NPC per year (Windustry 2009a). Each landowner is paid according to the number of wind turbines placed in its property and the capacity of the equipment. Figure 10a shows the maximum and minimum ranges for wind turbine yearly rent payments for each area type considering four NPC payment options. The higher rent payment ranges correspond to location category 6 ranging from USD59 to USD147 million, while all payments higher limit above USD100 million correspond to equipment placed in rural locations categories 6, 7 and 10. For category 2, which corresponds to counties in lower population metro areas, there is a high rent payment range, between USD33 and USD81 million. However, further analysis indicates that a significant portion of these counties are mostly rural and contain suburbia from middle size cities. For instance, almost 39% of those payments correspond to rural counties in Texas on the vicinity of the cities Corpus Christi, Laredo, Lubbock, and Amarillo. The positive financial impact from rent payments from wind turbines for rural counties is further highlighted in Figure 10b. More than 80% of urban counties in category 1 and more than 50% of category 2 urban counties receive less than USD0.3 million of annual rent from wind turbines. On the other hand, for larger wind turbines rural counties more than 70% of the counties receive annual rents larger than USD0.3 million and between 35% and 45% of rural counties receive more than USD1 million of yearly rents. Furthermore, in the larger rent bracket (USD5000 per MW NPC) more than 22% of category 8 counties and more than 10% of rural counties categories 5, 6, 7, and 9 receive more than USD3 million in annual rent payments. This further highlights the financial benefits that rural counties may obtain from the continued expansion of wind energy applying ever growing equipment.
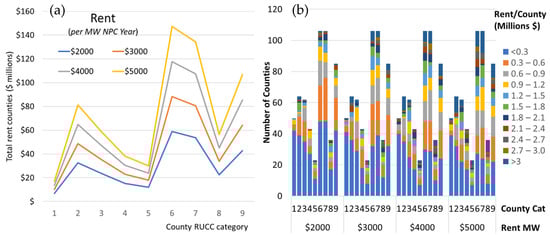
Figure 10.
Rent payments from wind turbines classified according to location type from the USDA Rural–Urban Continuum Codes. (a) Yearly total rent payments per location type. (b) Number of counties classified by ranges of yearly total rent classified and location type.
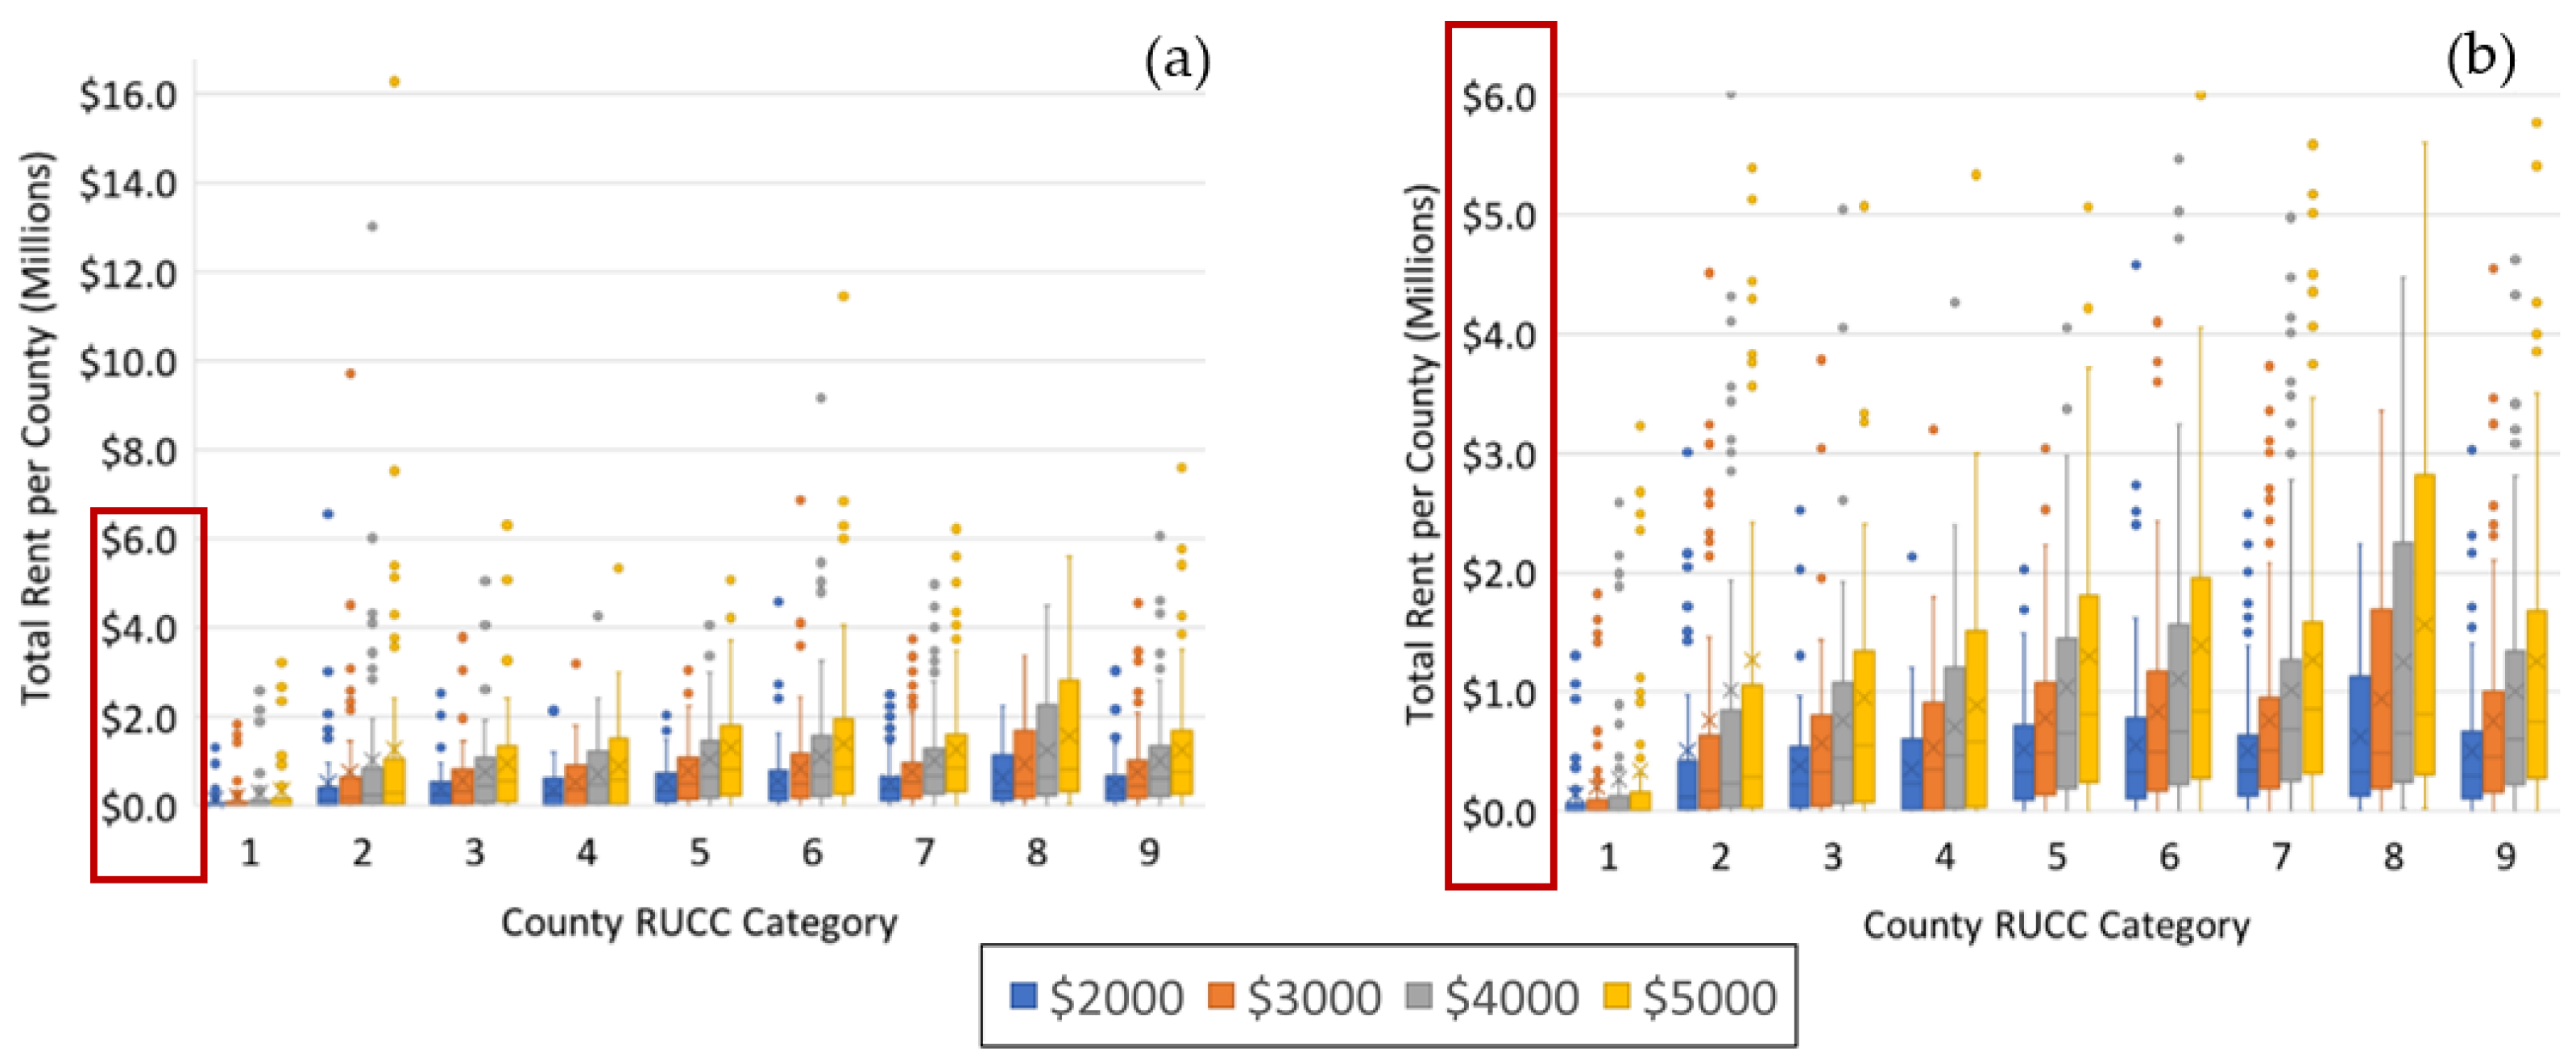
Figure 11 expands the analysis on the benefits that counties may receive from wind turbine annual rental payments. The box and whisker plots shown in Figure 11a present an extended vertical axis range to the maximum potential cumulative yearly rent. This chart showcases rural counties in categories 2 and 6 receiving potential rental income higher than USD16 million and USD11 million, respectively. More than 10% of all counties, as reflected in this chart, have yearly annual rental income from wind turbines higher than USD3 million and more than 4% higher than USD5 million when considering the rental bracket of USD5000 per MW NPC. Figure 11b shows a restricted range on the vertical axis, allowing for a better resolution for the assessment of the financial benefits from this study. All rural areas indicate a tendency to higher yearly rental income per county, with counties category 7 showing a significant number of outliers with income higher than USD2 million and rural counties in categories 5, 6, 8, and 9 extending its whiskers to values higher than USD3 million in most of the rental brackets, indicating a robust potential to growth rental income in these rural locations. This analysis is in line with the US global rental income of USD289 million, reported by AWEA for 2018 paid by the wind industry to landowners (Bergen 2020). Comparing this rental assessment presented in Figure 10 with reported values the analysis suggest that a significant proportion of existing lease agreements were potentially negotiated on the lower brackets for rental payments. This is relevant considering that previous reports have indicated that the lower brackets were prevalent before the year 2000, but as technology has advanced more rental agreements have negotiated higher lease rates (Windustry 2009b). This discussion is useful for local stakeholders to improve negotiation positions and maximize potential rental income for future wind farm developments. Increasing rental income for rural locations will provide additional incentive to promote wind energy and therefore reduce social opposition for these new projects.
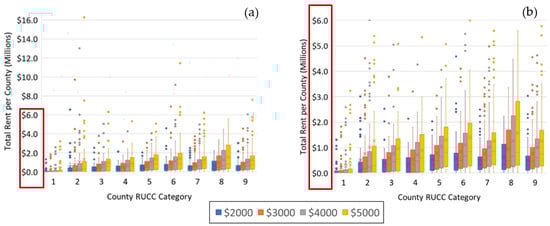
Figure 11.
Box and whisker plots displaying variation in annual rent received by counties from wind turbines considering four potential rental brackets for diverse NPC. (a) Chart with extended vertical axis ranges. (b) Chart with limited vertical axis range.
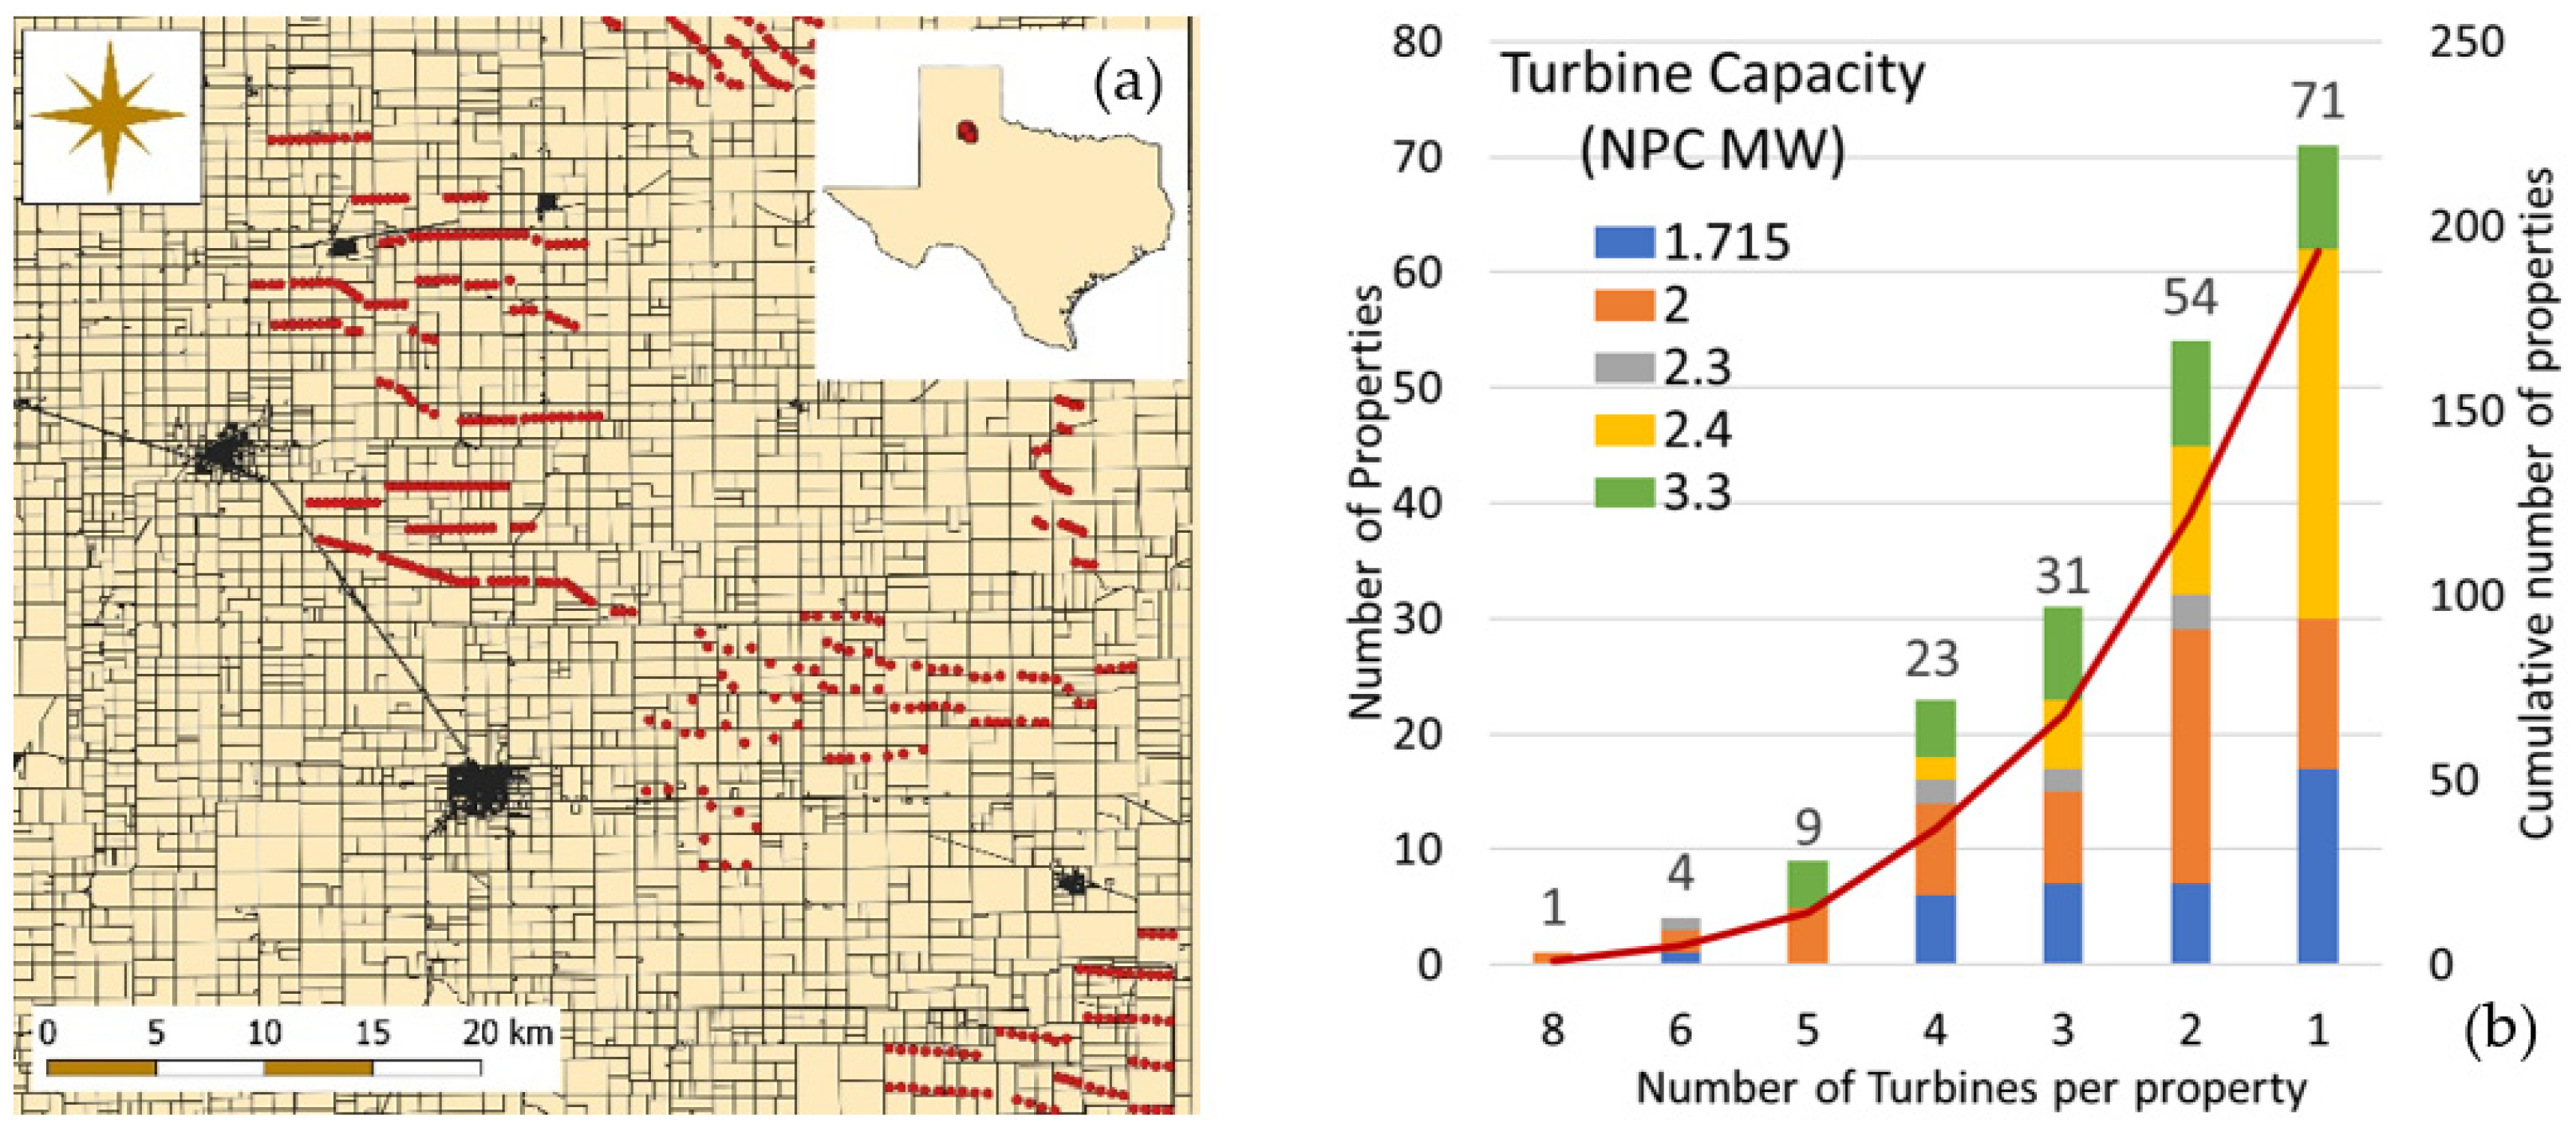
To obtain a better understanding of the financial impact from wind turbine rent on rural property owners, a GIS assessment was performed for Texas applying data obtained from the Land Parcels dataset provided by the Texas Natural Resources Information System (TNRIS 2022). This dataset provides diverse information regarding individual properties collected originally by county appraisal districts. The dataset is continuously expanded and updated. Currently 12% of the wind turbines in Texas are located in properties not included in the dataset. An additional 9% of the wind turbines are located in properties that although included in the dataset do not have the owner’s name. Figure 12a demonstrates the use of the proposed assessment for Floyd County in Texas overlaying the Land Parcels dataset with the USWTDB (Rand et al. 2022). The combined shapefile from all land parcels from the counties with wind turbines indicates that there are 441 wind turbines installed in 193 properties in Taylor County. The characterization of the installed wind turbines per property is presented in Figure 12b. The highest number of wind turbines installed in one individual property is eight, all of them with NPC of 2 MW. Only 8% of the properties have five or more wind turbines, while 65% of the properties with wind turbines have one or two of them installed on their property. This methodological approach to assess the financial individual benefits from wind energy as part of the discussion in this study is critical to better understand the wider benefits distribution among a significant number of the rural population. Benefits are not just concentrated among community organizations, local governments, school districts or reduced number of landowners. The analysis showcases the large number of individual property owners that now and in the future may benefit from new wind energy projects. This will contribute to reduce social opposition and increase generation of sustainable energy considering that fairness in the distribution of financial benefits from wind projects creates higher acceptance levels for these facilities among local populations (Baxter et al. 2013).
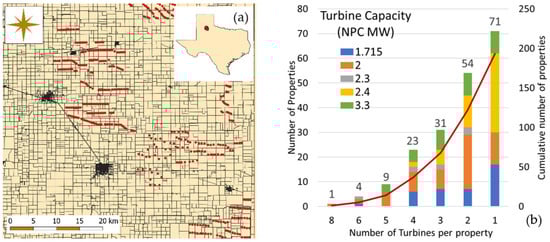
Figure 12.
Assessment for wind turbine placement on individual lots applying data from Floyd County (Texas). (a) Shapefile for individual parcels with corresponding turbines represented as red points overlaid over each individual parcel. (b) Number of properties with turbines categorized number of turbines per property classified according to the Name Place Capacity (NPC) of the turbines with cumulative number of properties represented in the secondary y-axis.
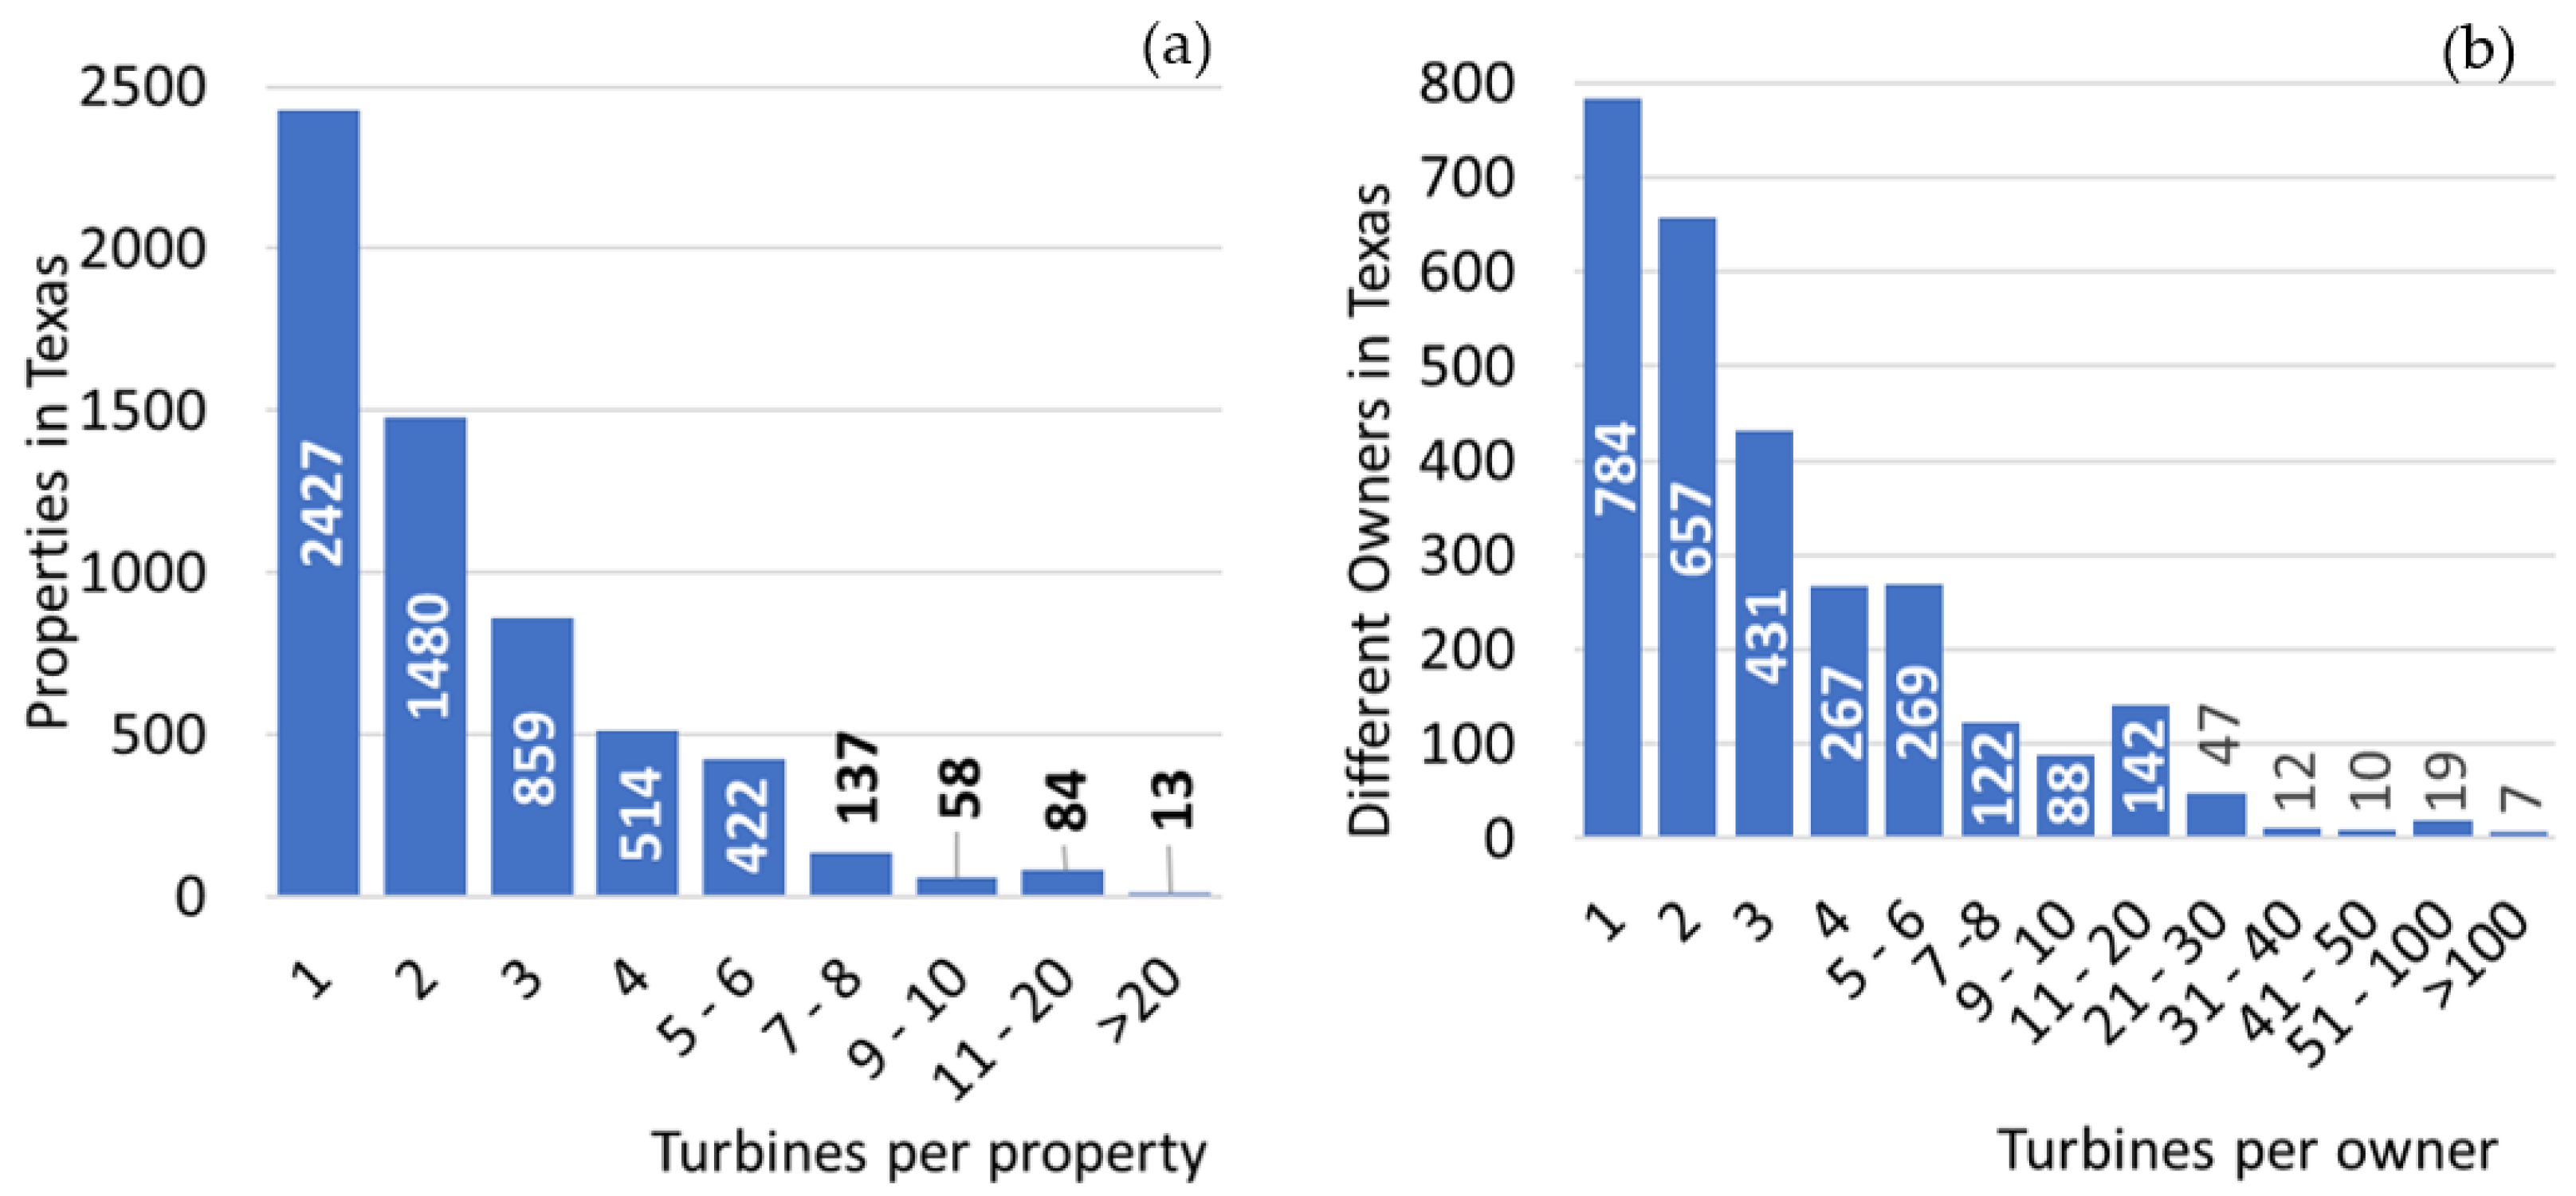
The distribution of wind turbines in diverse land parcels in Texas is presented in Figure 13 using data from TNRIS (TNRIS 2022). The analysis is performed both for individual land parcels and for distinctive owners, considering that several contiguous plots or even dispersed plots in Texas have the same owner. Figure 13a shows that 40% of all parcels have only one wind turbine installed, while almost 80% have three or less wind turbines. This is relevant, showing a high dispersion on rental payments benefits among a large number of properties, potentially providing a wider benefit for rural communities. Figure 13b supplements the previous analysis, focusing on property owners, considering that several lots may have diverse owners. This helps to better understand how financial benefits may be distributed among local landowners. The results indicate that the almost 6000 Texas land parcels which have wind turbines installed are owned by less than 2900 individual owners or co-owners. Of these owner or co-owners, 28% have only one turbine installed on their properties while a little over than 65% have three or fewer turbines. On the other hand, almost 320 individual owners or co-owners have more than 10 wind turbines in their properties, while almost 90 owners have more than 30 turbines installed. These results and discussion show a high dispersion both for land parcels and diverse owners, potentially creating expansive distribution on the benefits from wind turbine rent payments. This increases social acceptance for new wind farms (Baxter et al. 2013). However, it is important to further discuss that high dispersion may create challenges for wind farm developers, when negotiating and formalizing leases for a potentially large number of contiguous properties that will compose the facility. Community organizations or local stakeholders may attract wind energy new projects by creating bundled property packages, where owners are ready to provide the same terms to developers and improve opportunities to attract these investment projects.

Figure 13.
Assessment on the number wind turbine installed on individual lots in Texas classified according to (a) distinctive lots on which the number of wind turbines indicated in the x-axis are installed and (b) the number of different owners in Texas that have the number of wind turbines indicated in the x-axis installed in their plots.
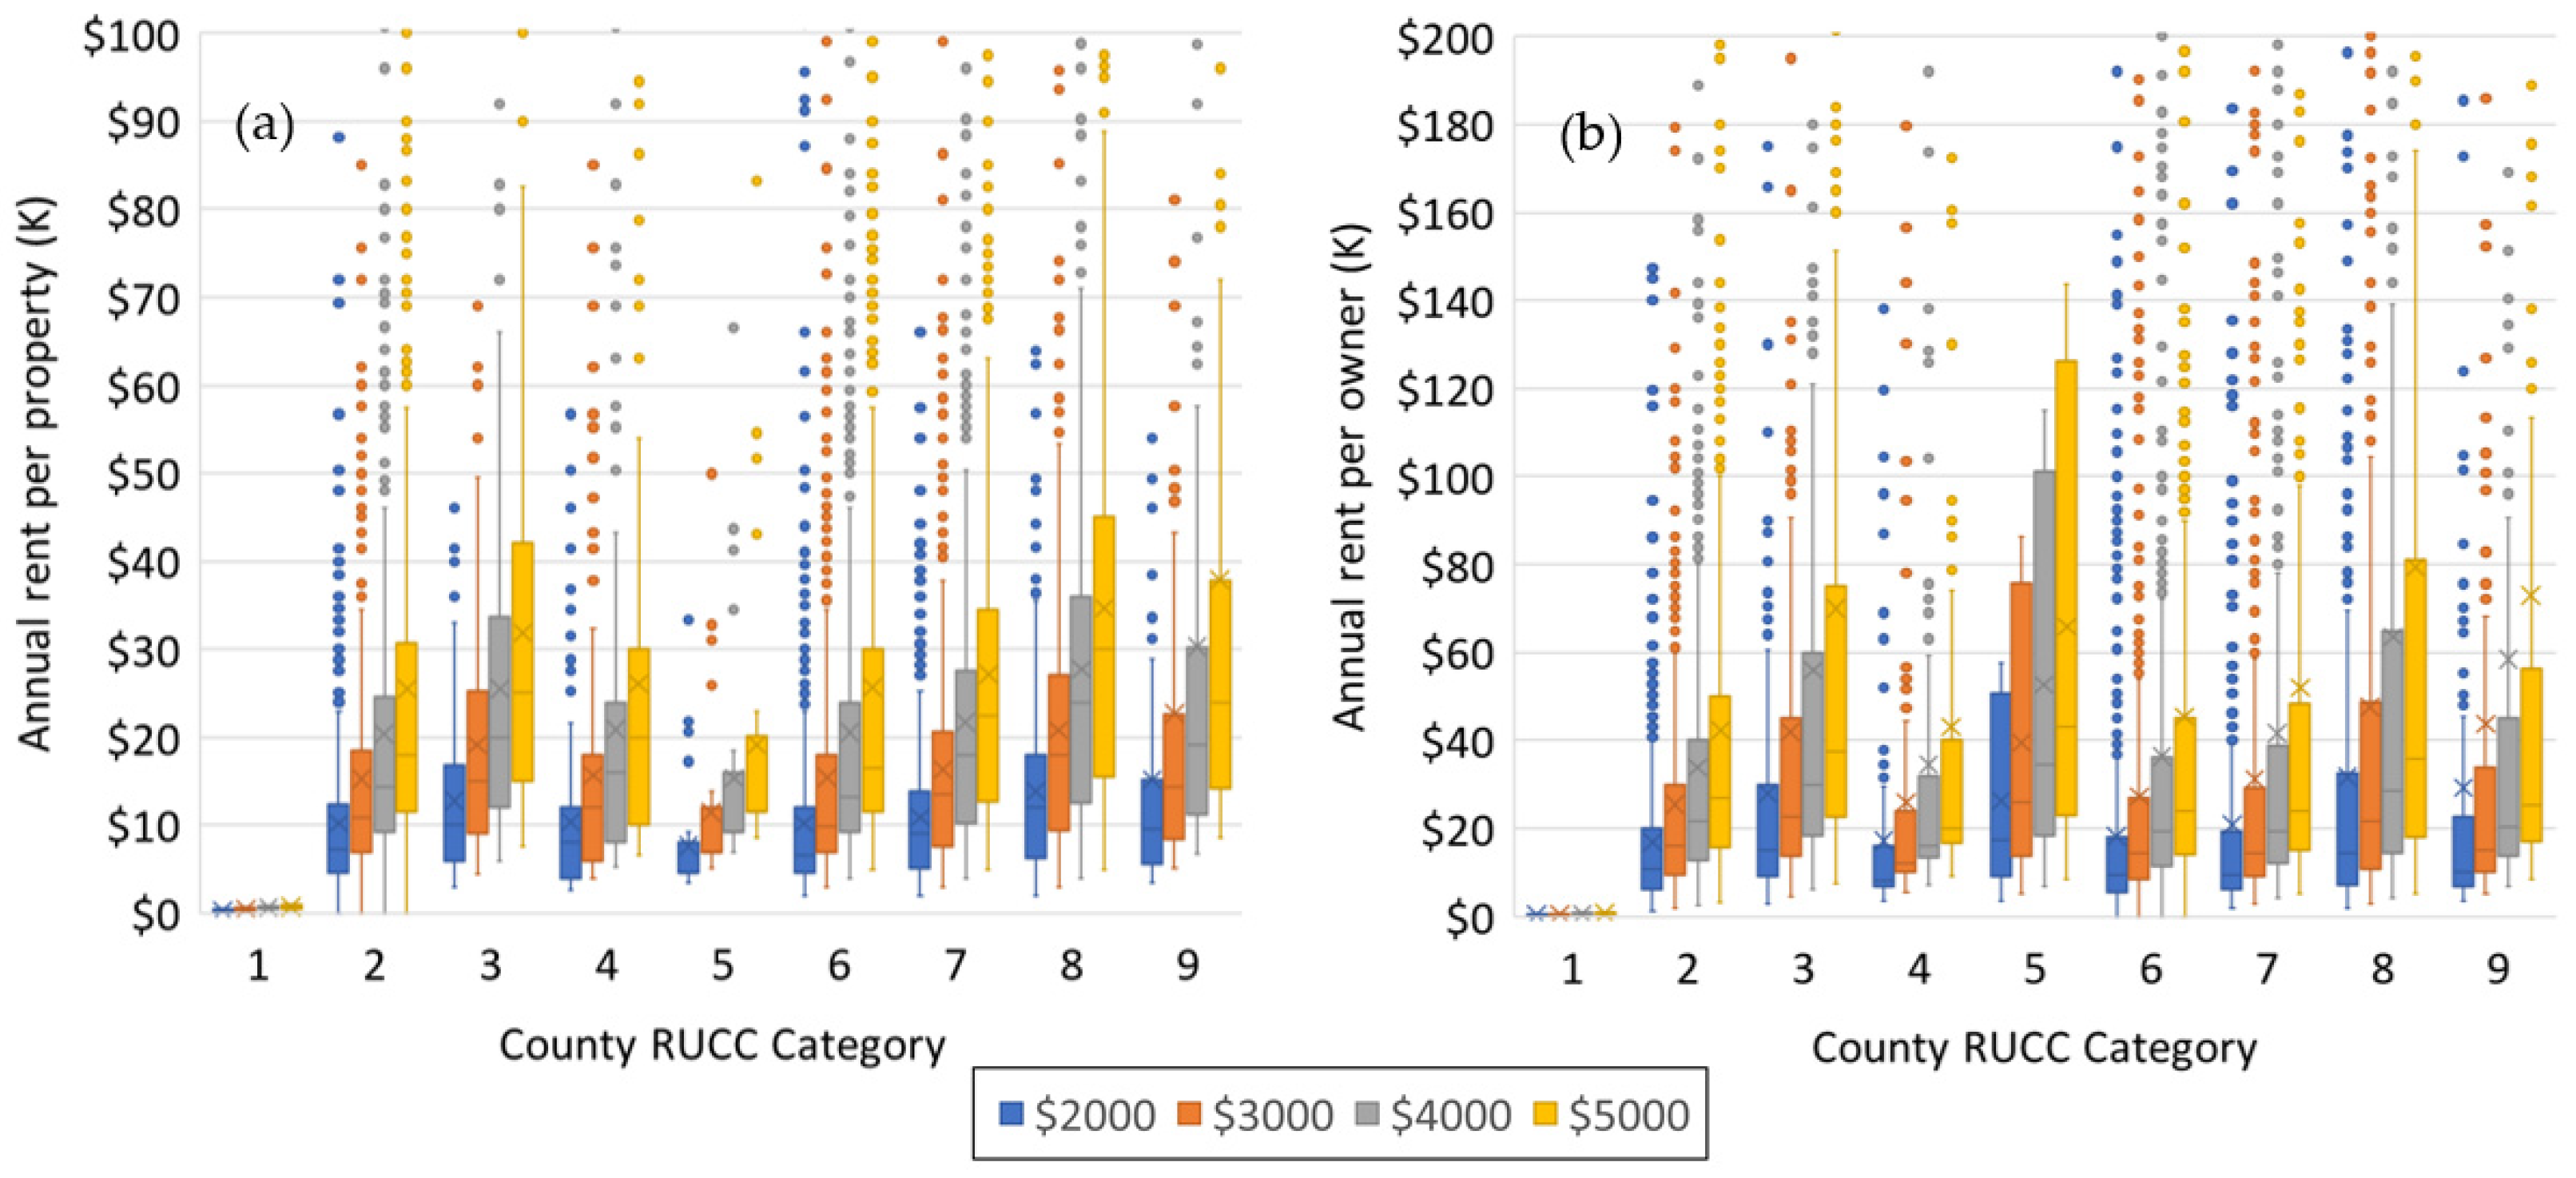
Figure 14 presents an assessment of potential rental payments for each individual land parcels in Texas from installed wind turbines. The box plot analysis was performed considering the four potential rental parameters per year of MW of installed capacity. Smaller wind turbines will generate lower payments, which will increase as the equipment size grows. In Figure 14 the payments are calculated considering individual land parcels. The first quartile for equipment paying USD2000 per MW the yearly rental payment would be USD4800 increasing to almost USD14,000 for the third quartile while for the fourth quartile it would be higher than USD27,000. On the other hand, for the highest payment bracket (USD5000 per MW) the first quartile would be USD12,000, increasing to USD34,500 on the third quartile and to USD68,000 yearly per property in fourth quartile. It is relevant to discuss that there is a significant number of outliers beyond the fourth quartile, indicating properties receiving yearly rents much higher than these values. More than 300 properties are included in these outliers, with 25% of the outliers receiving more than USD100,000 per year and 7% of the outliers more than USD200,000. Analysis for annual payments received by owners or co-owners presented in Figure 14b indicate higher payments, as the same person may own several properties with installed turbines. This further confirms the relevance of neighboring properties having the potential to be bundled and provide similar rental conditions for wind farm developers. For the USD2000 per MW bracket the first quartile is USD6000 while the third and fourth quartile indicate USD20,000 and almost USD41,000, respectively. For owners receiving USD5000 per MW of installed wind turbine capacity the first quartile grows to USD15,000, while the third and fourth quartile reached levels of USD50,000 and USD102,000 yearly rental payments.
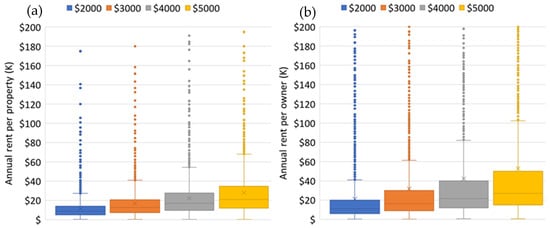
Figure 14.
Box plot assessing the annual rent payments from wind turbine installed on individual lots in Texas considering diverse rental payments (USD/MW) as negotiated by proprietaries, represented by four different colors. (a) Annual rent payments for distinctive lots. (b) Annual rent payment considering different owners.
Figure 15 provides a more granular analysis on the distribution of financial benefits from wind turbine leases for individual properties and owners. The analysis presented characterizes financial benefits for each of the categories for counties according to USDA RUCC. Figure 15a shows individual parcels payments under four potential rental agreements per MW of installed capacity (NPC). Based on this analysis it is possible to discuss that most of the rural counties (4–8) indicate significant financial benefit from turbine leases. Category 3 high financial benefits represent counties containing a small metro area with wind equipment in the rural portion of the county. Considering the lower rental bracket (USD2000 per MW) for all rural counties (except category 5) in the first quartile income ranges between USD4000 and USD6000 with third and fourth quartiles higher than USD12,000 and USD22,000, respectively. For the highest rental bracket (USD5000 per MW), the first quartile consistently exceeds USD10,000, while the third and fourth quartile are higher than USD30,000 and USD50,000, respectively. In fact, in this higher rental bracket category 8 reaches almost USD90,000. This further highlights the significant individual benefits received by rural populations and their potential to reduce social opposition for new or repowered projects. The results presented in Figure 15b considering income for owners or co-owners increases potential rental revenue. Category 5 shows a significant divergence with the analysis evaluating only parcels. On closer analysis the difference relates to the fact that four proprietors in category 5 counties each own more than ten individual plots which have wind turbines installed, reaching levels higher than USD140,000 for the fourth quartile of the highest lease price bracket. For all rural counties there is a significant annual rental increase in this analysis, owing to the fact that several properties have the same owners. This highlights that counties, school districts, or landowners may pursue a strategy to bundle diverse owners’ properties into coherent land packages to incentivize wind developers on new project developments. Avoiding individual negotiations with landowners and providing uniform leasing conditions would encourage wind developers to invest on locations offering these opportunities. Additionally, the previous discussion helps to better understand wind energy development in rural locations and the financial benefits received from wind industry leases to rural county landowners.
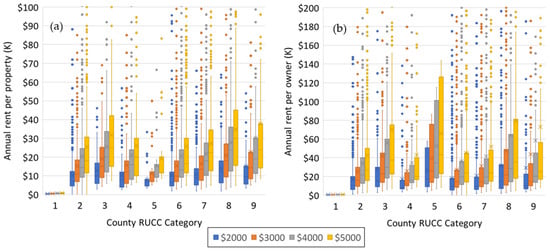
Figure 15.
Assessment on the annual rent payments from wind turbine installed on individual lots in Texas categorized by USDA RUCC, classified according to (a) distinctive lots and (b) different owners.
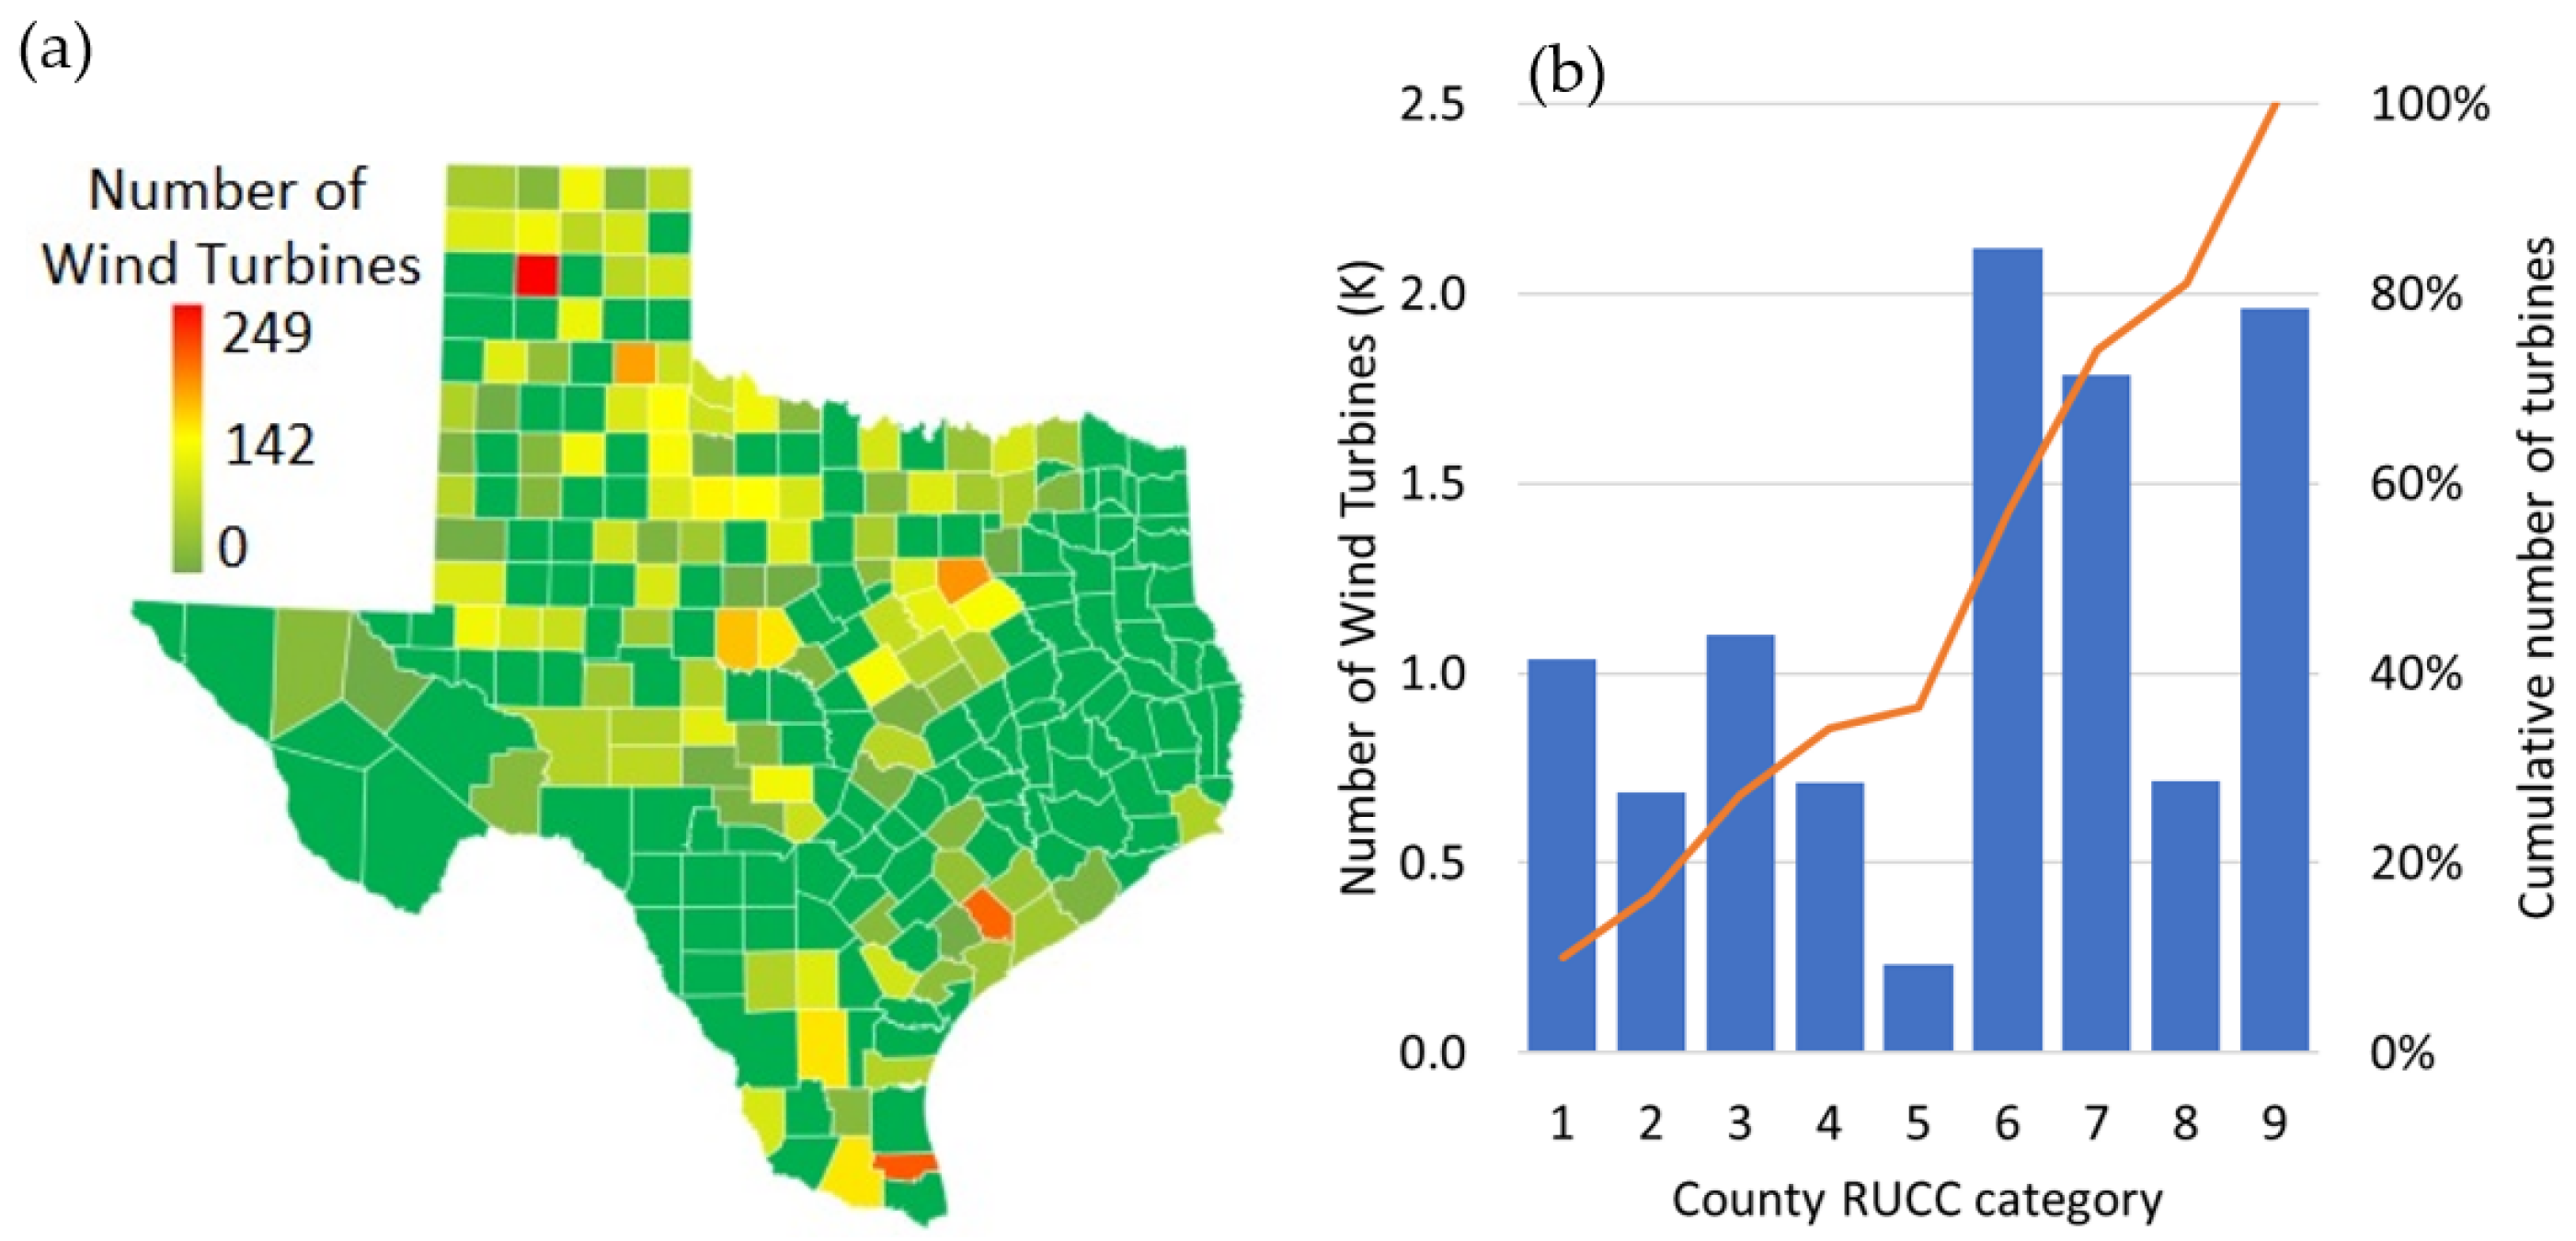
To evaluate the financial benefits from future wind farms the study incorporated data published by ERCOT, identifying potential sites to develop new utility-scale wind farms in Texas (Rojowsky et al. 2020). More than 31 Gigawatts (GW) of future capacity were modeled across 148 wind farms distributed across Texas as indicated in Figure 16a. To evaluate potential financial benefits from lease income derived from these future facilities this study modeled potential spatial distribution applying GIS analysis. This analysis considered the installation of 3 MW wind turbines with a diameter of 110 m, which is one of the current most frequently used models. The map in Figure 16a shows that these new wind farms will be distributed in 114 counties all across Texas, with the largest capacity per county reaching almost 750 MW in Potter County, equivalent to 249 future wind turbines. Almost 83% of these counties will have more than 50 turbines, 43% of them more than 100 turbines, and 8% more than 150 wind turbines. This showcases the significant opportunity to provide additional financial benefits through rental income for property owners. Furthermore, Figure 16b shows that from these future wind turbines more than 62% will be in rural areas category 4–9 from the USDA RUCC, representing a significant financial boost for these areas that normally do not have industrial activities in their jurisdictions. Discussion in this assessment highlights counties that can potentially benefit from wind energy investments. With this information wind developers and local stakeholders can take measures for wide outreach on this industry benefits, reducing potential local opposition and creating structures to support and attract this industry.
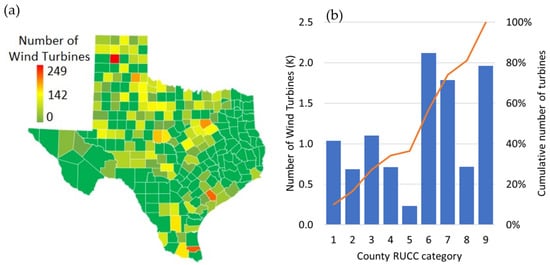
Figure 16.
Assessment of ERCOT’s future proposed wind farms for Texas. (a) Map of proposed future wind turbines per county, (b) Number of proposed future wind turbines per counties categorized by USDA RUCC.
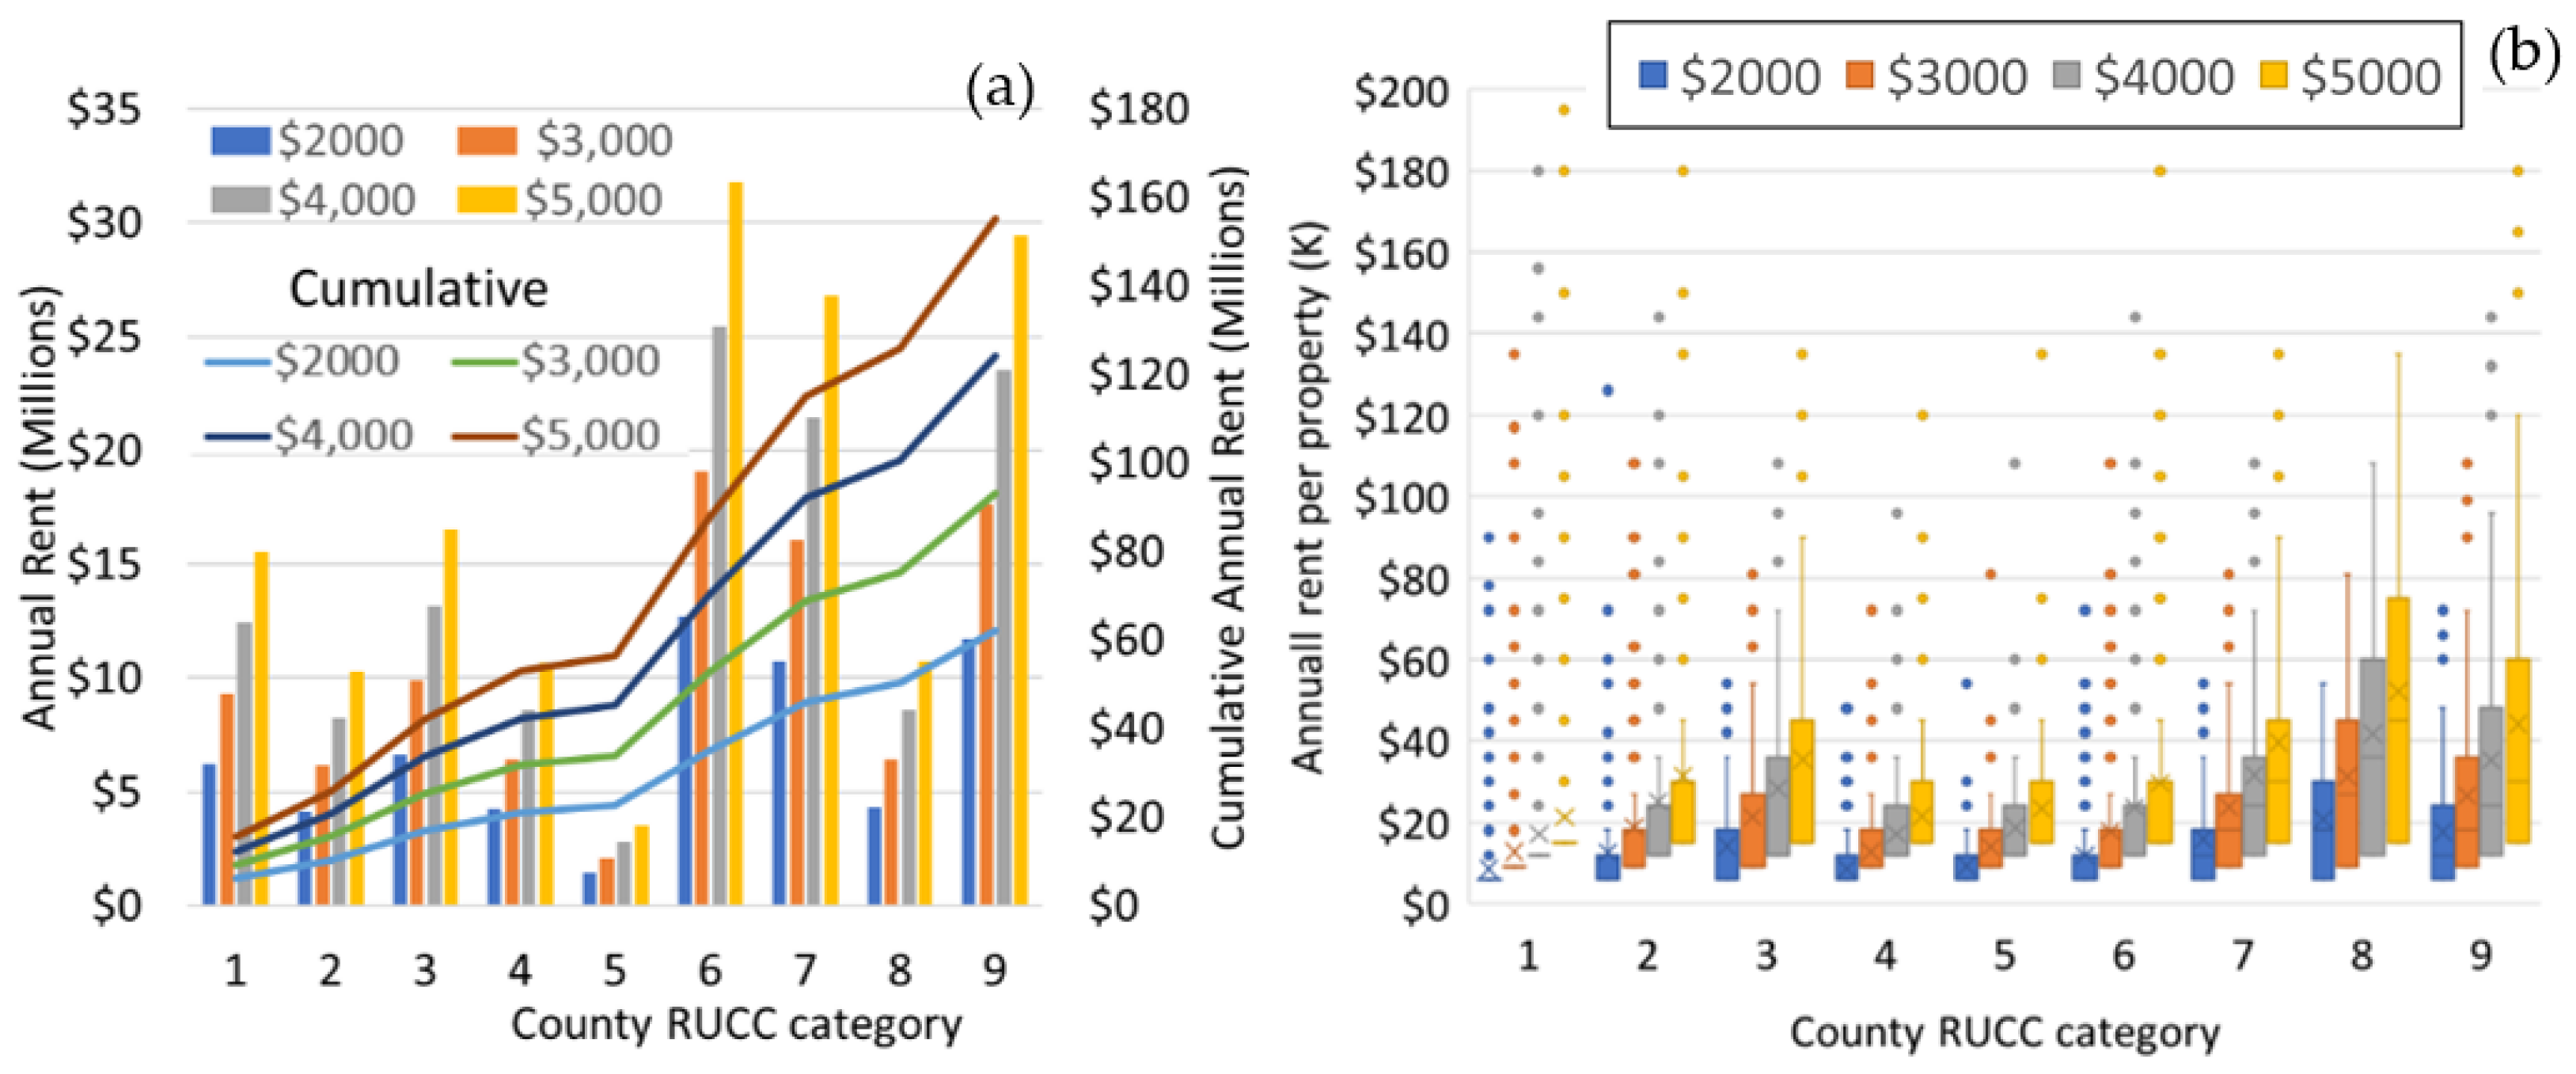
Assessment of potential future income from wind turbine leases is presented in Figure 17. The assessment and discussions were performed both for county level and for individual land parcels from data provided by TNRIS (TNRIS 2022). GIS analyses were performed to ascertain the placement of individual equipment on the properties on the location of the new wind farm, as indicated by ERCOT (Rojowsky et al. 2020). A separation of 7 diameters was considered for the design of the wind farms layout with a cluster distribution surrounding the location of the potential wind farm. A uniform grid separation was evaluated for the equipment to perform individual parcel placement. Figure 17a shows that the lease income from future wind farms in Texas could range between USD62 and USD155 million, depending on the bracket value negotiated for MW of installed power between developers and owners. However, it is relevant to discuss that as more advance equipment is installed negotiated rent values tend to the higher bracket levels, potentially providing owners with revenue closer to the higher payment levels, as highlighted in previous sections of this study. Furthermore, the results indicate that 88% of all rental income will be generated in rural counties (USDA RUCC levels 4–9), providing significant future income to rural property owners. A more detailed perspective on the potential benefits that individual parcel owners may obtain from these wind farm leases is provided by Figure 17b. Results indicate that for rural properties that negotiated the lowest rental bracket (USD2000 per MW) generated yearly rental income on the first quartile is USD6000, for the third quartile income ranges between USD10,000 and USD30,000; while for the fourth quartile payments increase to ranges between USD20,000 and USD55,000. However, if the highest bracket rental level was negotiated (USD5000 per MW) yearly rental income may increase significantly. On rural properties for the first quartile rental payment would be USD15,000; for the third quartile values would range between USD30,000 and USD75,000 while for the fourth quartile rental income would fluctuate between USD45,000 and USD135,000. This provides significant insights to both local stakeholders and wind energy developers to better understand avenues and strategies to maximize future wind project developments.
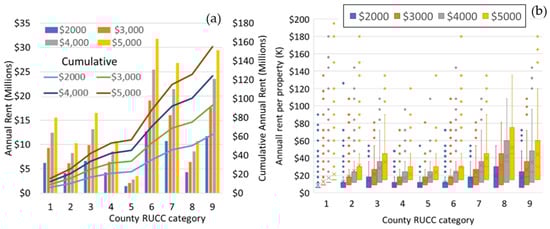
Figure 17.
Assessment of rental payments on ERCOT’s future proposed wind farms for Texas categorized by USDA RUCC (a) Total rent per county RUCC category (b) Annual rent for individual lots for future proposed wind turbines.
Financial benefits have diverse magnitudes according to the indicators that impact the different evaluated group of actors, as previously shown in this study. The benefits for communities, comprising school districts new investments, new rural area investment projects and tax revenue increase from wind energy are several orders of magnitude larger than the benefits received by individuals. Among the benefits for individuals such as lease income, employment, and improvement projects for particular properties, as shown in Figure 2 the value of each individual benefit is smaller. However, both general types of financial benefits are very significant for rural populations. Individual benefits aid farmers and landowners to supplement their income and maintain their operations in financial health. Community benefits, which are significantly larger than individual benefits, provide local stakeholders with the potential to provide better public services, decreasing poverty levels and increasing overall standard of living. The public communication of this benefits to rural communities generates the additional benefit of incentivizing the growth of renewable energy in the United States by reducing local social opposition. This allows for the fulfillment of sustainability objectives on energy generation while simultaneously providing significant benefits to rural populations that normally have higher poverty risk levels.
7. Conclusions
Lack of economic opportunities in rural communities exacerbates problems related to poverty, education, employment, and community wellbeing, fomenting migration, and rural depopulation. Over the last two decades, wind energy has been growing exponentially in the US and the trend is expected to continue. Most of wind farms are installed in rural locations, creating opportunities to provide financial benefits for these communities. However, a lack of high resolution, granular, and compiled data for each rural community has hindered the potential of benefiting from wind energy continued growth. This research combined diverse subject matter databases to provide a high-resolution assessment on the potential benefits that wind energy may provide each rural community.
Results from the research confirmed that rural locations have higher levels of poverty and general lack of economic opportunities. Wind farms have been growing on these locations over the last twenty years, providing potential financial benefits. Data were converted to a geospatial framework to overlay them, showing that the number of wind farms installed on individual rural counties and school districts has grown significantly. Furthermore, it showcased that both rural counties and school districts that installed wind farms earlier in time repeated the investment several times afterwards, showcasing positive experiences from these locations. Results showcased the significant financial benefits that counties and school districts are receiving from wind energy. Some counties and school districts present extraordinarily high financial benefits, highlighting the potential for this industry to grow in rural locations in the United States. As these financial benefits are more widely reported, social opposition is expected to decrease, further incentivizing the development of renewable energy.
Applying geospatial data for land parcels in Texas it was possible to assess benefits for landowners from wind turbine rental, showing that both individual properties receive significant income from this activity. Furthermore, as wind industry continues to grow the placement of future wind farms was identified and geospatial analysis performed to identify potential individual properties and owners that may receive rental benefits from these facilities. As wind turbines continue to grow, both in size and in number, the rental income will increase, considering that the payment is based both on the Name Plate Capacity of the equipment and on the number of turbines.
This approach can be applied for other locations, both in the US and all over the world, providing the relevant geospatial data that can be combined to generate high resolution assessments. Results from these analyses will be important for local rural stakeholders, helping them attract and better negotiate wind farms development. On the other hand, wind operators will receive significant benefits from the assessments provided by this research, allowing them to have a much better understanding of the expectation of rural stakeholders and potential placement parcels, helping them to better negotiate lease agreements, secure permits and avoid creating social opposition. This will help to create a robust growth for renewable energy, reducing greenhouse gasses emissions and preventing the most damaging effects from climate change.
Limitations for this study include the availability of data for the assessment of the diverse metrics to determine the financial benefits from wind energy to rural locations. As additional information continues to become available from government sources and industry stakeholders it will be possible to further refine results for their use by local communities. Future research will include new measures on how much members of the social opposition could lose by not agreeing to wind turbine investments. A breakdown on the potential benefits and losses per individual stakeholders or interest groups will be developed in future research.
Funding
This research was funded by the College of Business Administration 2022–2023 Summer Research Grant at Texas A&M University, Kingsville.
Data Availability Statement
All data used in this research are publicly available. They are available as indicated in the referenced databases.
Acknowledgments
I would like to gratefully acknowledge the support of the College of Business Administration at Texas A&M University, Kingsville.
Conflicts of Interest
The author declares no conflict of interest.
Abbreviations
| AWEA | American Wind Energy Association now American Clean Power Association |
| BEA | United States Bureau of Economic Analysis |
| BLS | United States Bureau of Labor Statistics |
| EIA | United States Energy Information Administration |
| ERCOT | Electric Reliability Council of Texas |
| GIS | Geographic Information Systems |
| IES | Institute of Education Sciences |
| NCES | United Stats National Center for Education Statistics |
| NPC | Wind turbine Name Plate Capacity (MW) |
| SAIPE | Small Area Income and Poverty Estimates |
| TNRIS | Texas Natural Resources Information System |
| USCB | United States Census Bureau |
| USDE | United States Department of Energy |
| USDA | United States Department of Agriculture |
| URCC | Rural–Urban Continuum Codes |
| WRI | World Resources Institute |
References
- Anríquez, Gustavo, and Kostas Stamoulis. 2007. Rural Development and Poverty Reduction: Is Agriculture Still the Key? ESA Working Paper No. 07-02. Rome: Agricultural Development Economics Division (ESA), The Food and Agriculture Organization. [Google Scholar]
- AWEA. 2017. How the US Wind Sector Is Building Momentum, Driving Economic Benefits. Greentech Media March 2017. American Wind Energy Association. Available online: https://www.statista.com/statistics/688155/land-lease-payments-for-wind-power-projects-select-us/ (accessed on 2 March 2022).
- Barthelmie, Rebecca J., and Sara C. Pryor. 2021. Climate change mitigation potential of wind energy. Climate 9: 136. [Google Scholar] [CrossRef]
- Baxter, Jamie, Rakhee Morzaria, and Rachel Hirsch. 2013. A case-control study of support/opposition to wind turbines: Perceptions of health risk, economic benefits, and community conflict. Energy Policy 61: 931–43. [Google Scholar] [CrossRef]
- Bergen, Molly. 2020. How Wind Turbines Are Providing a Safety Net for Rural Farmers. World Resources Institute. Available online: https://www.wri.org/insights/how-wind-turbines-are-providing-safety-net-rural-farmers (accessed on 13 October 2020).
- Blanco, Maria Isabel, and Glória Rodrigues. 2009. Direct employment in the wind energy sector: An EU study. Energy Policy 37: 2847–57. [Google Scholar] [CrossRef]
- BLS-Bureau of Labor Statistics, U.S. Department of Labor. 2020. Occupational Outlook Handbook. Wind Turbine Technicians. Available online: https://www.bls.gov/ooh/installation-maintenance-and-repair/wind-turbine-technicians.htm (accessed on 1 March 2022).
- Bristow, Gillian, Richard Cowell, and Max Munday. 2012. Windfalls for whom? The evolving notion of ‘community’ in community benefit provisions from wind farms. Geoforum 43: 1108–20. [Google Scholar] [CrossRef]
- Brunner, Eric, Ben Hoen, and Joshua Hyman. 2022. School district revenue shocks, resource allocations, and student achievement: Evidence from the universe of US wind energy installations. Journal of Public Economics 206: 104586. [Google Scholar] [CrossRef]
- Bureau of Economic Analysis (BEA). 2021. GDP by County, Metro, and Other Areas. US Department of Commerce. Available online: https://www.bea.gov/data/gdp/gdp-county-metro-and-other-areas (accessed on 2 June 2022).
- Castleberry, Becca, and J. Scott Greene. 2017. Impacts of wind power development on Oklahoma’s public schools. Energy, Sustainability and Society 7: 1–14. [Google Scholar] [CrossRef]
- Clausen, Laura Tolnov, and David Rudolph. 2020. Renewable energy for sustainable rural development: Synergies and mismatches. Energy Policy 138: 111289. [Google Scholar] [CrossRef]
- Copena, Damián, and Xavier Simón. 2018. Wind farms and payments to landowners: Opportunities for rural development for the case of Galicia. Renewable and Sustainable Energy Reviews 95: 38–47. [Google Scholar] [CrossRef]
- Deavers, Ken. 1992. What is rural? Policy Studies Journal 20: 183. [Google Scholar] [CrossRef]
- Delicado, Ana, Elisabete Figueiredo, and Luís Silva. 2016. Community perceptions of renewable energies in Portugal: Impacts on environment, landscape and local development. Energy Research & Social Science 13: 84–93. [Google Scholar]
- Dimitropoulos, Alexandros, and Andreas Kontoleon. 2009. Assessing the determinants of local acceptability of wind-farm investment: A choice experiment in the Greek Aegean Islands. Energy Policy 37: 1842–54. [Google Scholar] [CrossRef]
- Duncan, Cynthia M., ed. 1992. Rural Poverty in America. Westport: Greenwood Publishing Group. [Google Scholar]
- EIA-US Energy Information Administration. 2021. Average U.S. Construction Cost for Onshore Wind Generation Decreased by 27% since 2013. 17 August 2021. Available online: https://www.eia.gov/todayinenergy/detail.php?id=49176 (accessed on 29 June 2022).
- Geverdt, Douglas E. 2019. Education Demographic and Geographic Estimates Program (EDGE): Locale Boundaries File Documentation, 2017; (NCES 2018-115). Washington, DC: U.S. Department of Education, National Center for Education Statistics. Available online: http://nces.ed.gov/pubsearch (accessed on 23 May 2022).
- Greene, John Scott, and Mark Geisken. 2013. Socioeconomic impacts of wind farm development: A case study of Weatherford, Oklahoma. Energy, Sustainability and Society 3: 1–9. [Google Scholar] [CrossRef]
- Gross, Catherine. 2007. Community perspectives of wind energy in Australia: The application of a justice and community fairness framework to increase social acceptance. Energy Policy 35: 2727–36. [Google Scholar] [CrossRef]
- Groth, Theresa M., and Christine A. Vogt. 2014. Rural wind farm development: Social, environmental and economic features important to local residents. Renewable Energy 63: 1–8. [Google Scholar] [CrossRef]
- Haces-Fernandez, Francisco, Alvaro Martinez, Lucy Camacho, David Ramirez, Haibin Su, and Hua Li. 2017. GIS based tool for analyzing US wind farms development. In IIE Annual Conference. Proceedings. Peachtree Corners: Institute of Industrial and Systems Engineers (IISE), pp. 109–14. [Google Scholar]
- Haces-Fernandez, Francisco, Hua Li, and David Ramirez. 2019. Improving wind farm power output through deactivating selected wind turbines. Energy Conversion and Management 187: 407–22. [Google Scholar] [CrossRef]
- Haces-Fernandez, Francisco, Mariee Cruz-Mendoza, and Hua Li. 2022. Onshore Wind Farm Development: Technologies and Layouts. Energies 15: 2381. [Google Scholar] [CrossRef]
- Hall, Nina, Peta Ashworth, and Patrick Devine-Wright. 2013. Societal acceptance of wind farms: Analysis of four common themes across Australian case studies. Energy Policy 58: 200–8. [Google Scholar] [CrossRef]
- IES-NCES. 2022. Locale Boundaries Data; Washington, DC: U.S. Department of Education, National Center for Education Statistics. Available online: http://nces.ed.gov/pubsearch (accessed on 23 May 2022).
- Jacquet, Jeffrey B., and Joshua T. Fergen. 2018. The vertical patterns of wind energy: The effects of wind farm ownership on rural communities in the Prairie Pothole Region of the United States. Journal of Rural and Community Development 13: 2. [Google Scholar]
- Janvry, Alain de, and Elisabeth Sadoulet. 2000. Growth, poverty, and inequality in Latin America: A causal analysis, 1970–94. Review of Income and Wealth 46: 267–87. [Google Scholar] [CrossRef]
- Kahn, Matthew E. 2013. Local non-market quality of life dynamics in new wind farms communities. Energy Policy 59: 800–7. [Google Scholar] [CrossRef]
- Lavalley, Megan. 2018. Out of the Loop: Rural Schools Are Largely Left out of Research and Policy Discussions, Exacerbating Poverty, Inequity, and Isolation. In Center for Public Education; Austin: ERIC. [Google Scholar]
- Lienhoop, Nele. 2018. Acceptance of wind energy and the role of financial and procedural participation: An investigation with focus groups and choice experiments. Energy Policy 118: 97–105. [Google Scholar] [CrossRef]
- Loomis, David G., Jared Hayden, Sarah Noll, and James E. Payne. 2016. Economic impact of wind energy development in Illinois. Journal of Business Valuation and Economic Loss Analysis 11: 3–23. [Google Scholar] [CrossRef]
- Lundheim, Sigurd Hilmo, Giuseppe Pellegrini-Masini, Christian A. Klöckner, and Stefan Geiss. 2022. Developing a Theoretical Framework to Explain the Social Acceptability of Wind Energy. Energies 15: 4934. [Google Scholar] [CrossRef]
- Marcacci, Silvio. 2019. Renewable Energy Job Boom Creates Economic Opportunity As Coal Industry Slumps. Forbes, April 22. [Google Scholar]
- Mulvaney, Kate K., Patrick Woodson, and Linda Stalker Prokopy. 2013a. A tale of three counties: Understanding wind development in the rural Midwestern United States. Energy Policy 56: 322–30. [Google Scholar] [CrossRef]
- Mulvaney, Kate K., Patrick Woodson, and Linda Stalker Prokopy. 2013b. Different shades of green: A case study of support for wind farms in the rural midwest. Environmental Management 51: 1012–24. [Google Scholar] [CrossRef]
- Pavlowsky, Caroline E., and Travis Gliedt. 2021. Individual and local scale interactions and adaptations to wind energy development: A case study of Oklahoma, USA. Geography and Sustainability 2: 175–81. [Google Scholar] [CrossRef]
- Rand, Joseph, and Ben Hoen. 2017. Thirty years of North American wind energy acceptance research: What have we learned? Energy Research & Social Science 29: 135–48. [Google Scholar]
- Rand, Joseph T., Louisa A. Kramer, Christopher P. Garrity, Ben D. Hoen, Jay E. Diffendorfer, Hannah E. Hunt, and Michael Spears. 2022. United States Wind Turbine Database. U.S. Geological Survey, American Clean Power Association, and Lawrence Berkeley National Laboratory data release: USWTDB Version 5 (2022)? Available online: https://eerscmap.usgs.gov/uswtdb (accessed on 8 July 2022).
- Reategui, Sandra, and Stephen Hendrickson. 2011. Economic Development Impact of 1,000 MW of Wind Energy in Texas; No. NREL/TP-6A20-50400; Golden: National Renewable Energy Lab (NREL).
- Rojowsky, K., A. Gothandaraman, and P. Beaucage. 2020. Hourly Wind and Solar Generation Profiles (1980–2019). Database, UL-AWS Truepower, LLC Ref. No.: 19-08-027944. Austin: Electric Reliability Council of Texas (Ercot). [Google Scholar]
- Schwabe, Paul D., David J. Feldman, Donald E. Settle, and Jason Fields. 2017. Wind Energy Finance in the United States: Current Practice and Opportunities; (No. NREL/TP-6A20-68227); Golden: National Renewable Energy Lab (NREL).
- Shoeib, Eman Ahmed Hamed, Elisabeth Hamin Infield, and Henry C. Renski. 2021. Measuring the impacts of wind energy projects on US rural counties’ community services and cost of living. Energy Policy 153: 112279. [Google Scholar] [CrossRef]
- Shoeib, Eman Ahmed Hamed, Henry C. Renski, and Elisabeth Hamin Infield. 2022. Who benefits from Renewable Electricity? The differential effect of wind power development on rural counties in the United States. Energy Research & Social Science 85: 102398. [Google Scholar]
- Slattery, Michael C., Eric Lantz, and Becky L. Johnson. 2011. State and local economic impacts from wind energy projects: Texas case study. Energy Policy 39: 7930–40. [Google Scholar] [CrossRef]
- Song, Qing, Jieming Chen, Adeshile Ajayi, Francisco Haces-Fernandez, Kai Jin, and Hua Li. 2016. Social Attitudes of College Students toward Wind Farm Development in South Texas. International Journal of Sustainable and Green Energy 5: 103–10. [Google Scholar]
- Tickamyer, Ann R. 2006. Rural poverty. In Handbook of Rural Studies. Hong Kong: Sage, pp. 411–26. [Google Scholar]
- Tickamyer, Ann R., and Cynthia M. Duncan. 1990. Poverty and opportunity structure in rural America. Annual Review of Sociology 16: 67–86. [Google Scholar] [CrossRef]
- TNRIS-Texas Natural Resources Information System. 2022. Land Parcels Dataset. TNRIS. State of Texas. AppGeo. Available online: https://tnris.org/stratmap/land-parcels/#:~:text=TNRIS%20collects%20these%20data%20to,a%20visual%20representation%20of%20property (accessed on 8 July 2022).
- US DE-US Deparment of Energy. 2020. Wind Energy’s Economic Impacts to Communities. Wind Energy Technologies Office. WINDExchange. Project Development. Available online: https://windexchange.energy.gov/projects/economic-impacts (accessed on 22 July 2022).
- USCB-US Census Bureau Centers of Population. 2010. Available online: https://www.census.gov/geographies/reference-files/time-series/geo/centers-population.html (accessed on 3 June 2022).
- USCB-US Census Bureau Mapping Files. 2019. TIGER/Line Shapefiles; U.S. Department of Commerce Geography Division, U.S. Census Bureau. Available online: https://www.census.gov/geographies/mapping-files/time-series/geo/tiger-line-file.html (accessed on 13 June 2022).
- USCB-US Census Bureau. 2021. Small Area Income and Poverty Estimates (SAIPE) Program. Available online: https://www.census.gov/programs-surveys/saipe.html (accessed on 21 June 2022).
- USDA-US Department of Agriculture. 2020. Rural-Urban Continuum Codes 2013. USDA Economic Research Service. Updated in 12 October 2020. Available online: https://www.ers.usda.gov/data-products/rural-urban-continuum-codes/ (accessed on 21 June 2022).
- USDA-US Department of Agriculture. 2021. Poverty estimates for the U.S., States, and Counties, 2019. USDA Economic Research Service. Available online: https://www.ers.usda.gov/data-products/county-level-data-sets/download-data/ (accessed on 26 May 2022).
- Weber, Bruce, Leif Jensen, Kathleen Miller, Jane Mosley, and Monica Fisher. 2005. A critical review of rural poverty literature: Is there truly a rural effect? International Regional Science Review 28: 381–414. [Google Scholar] [CrossRef]
- Windustry. 2009a. Wind Energy Easements and Leases: Compensation Packages. Published September 2005. Updated June 2009 Windustry’s Wind Easement Work Group. Available online: https://www.windustry.org/community_wind_toolbox (accessed on 12 May 2022).
- Windustry. 2009b. Wind Energy Easements and Leases: Compensation Packages. Windustry Reports. Minneapolis, MN. Available online: https://www.windustry.org (accessed on 28 July 2022).
- Wiser, Ryan, Mark Bolinger, and Eric Lantz. 2019. Assessing wind power operating costs in the United States: Results from a survey of wind industry experts. Renewable Energy Focus 30: 46–57. [Google Scholar] [CrossRef]
- Wiser, Ryan, Joseph Rand, Joachim Seel, Philipp Beiter, Erin Baker, Eric Lantz, and Patrick Gilman. 2021a. Expert elicitation survey predicts 37% to 49% declines in wind energy costs by 2050. Nature Energy 6: 555–65. [Google Scholar] [CrossRef]
- Wiser, Ryan, Mark Bolinger, Ben Hoen, Dev Millstein, Joseph Rand, Galen Barbose, Naïm Darghouth, Will Gorman, Seongeun Jeong, and Ben Paulos. 2021b. Land-Based Wind Market Report: 2021 Edition; Berkeley: Lawrence Berkeley National Lab (LBNL).
- WRI, US Department of Energy. 2017. Number of Jobs in the Wind Energy Industry in the U.S. in 2016, by Select State. Survey by US Department of Energy. Published by WRI. Release Date March 2017. Available online: https://www.statista.com/statistics/690076/jobs-in-the-wind-energy-industry-us-states/ (accessed on 2 March 2022).


Publisher’s Note: MDPI stays neutral with regard to jurisdictional claims in published maps and institutional affiliations. |
© 2022 by the author. Licensee MDPI, Basel, Switzerland. This article is an open access article distributed under the terms and conditions of the Creative Commons Attribution (CC BY) license (https://creativecommons.org/licenses/by/4.0/).