1. Introduction
According to earlier research carried out by the authors (
Babkin et al. 2020), achieved through a deep comparative analysis of ICO and IPO as tools of financial institutions, it can be noted that in terms of digitalization, the most developed segment of the financial market in Russia is the stock market—IPO (initial public offering) after ICO (initial coin offering).
As noted by A.V. Vorontsovsky: “The subjects for trading on the stock markets have long been converted into electronic form, because they were digitized at the end of the twentieth century, when trading in real-time could already be observed on the screens of monitors” (
Shein and Postnikova 2019).
However, today the process of improving electronic technologies for carrying out operations on the stock market is also continuing. First of all, they aim to increase the availability of operations in the stock market for private investors.
Tinkoff Bank JSC actively implements and develops products that allow its clients to increase their level of knowledge and financial literacy in general and in terms of participation in financial markets, by offering them training on the subject of investment and allowing them to purchase a starting shareholding for a certain amount of money. Similar services are also offered by Yandex: Investments with the support of VTB Capital Broker LLC. All of this, firstly, increases the availability of the stock market for ordinary citizens interested in investing temporarily free funds and increasing their capital, and, secondly, increases the financial literacy of the country’s population.
The purpose of the study is to assess the development of the stock market using the example of the Russian Federation under the conditions of new restrictions.
To do this, we propose the author’s methodology, assessing the development of the stock market in the Russian Federation between 2016–2020, and based on the data obtained, we propose measures to improve the performance of the stock market.
2. Materials and Methods
The article uses classical methods for economic research, namely: analysis and synthesis, induction and deduction, exploration of economic processes, graphical method of economic analysis, and modeling.
Table 1 presents a methodology for assessing the development of the stock market using the example of the Russian Federation with a description of the essence of the assessment indicator, the calculation formula and the threshold value.
When choosing indicators, authors used only those that could be calculated based on the data presented in open sources.
Compared to the previous period or that of the past 5 years, most of the indicators characterize a change in the stock market. The basis lies in the assessment of the dynamics of the stock market in monetary terms.
The indicator characterizes the rate of change in comparison with the previous year, i.e., it examines the current rate of change in the federal bond market compared to the previous period. (Volume of exchange transactions of the current year-VETCY; the volume of exchange transactions of the previous year-VETPY; FLB market size of the current year-FLBMSCY; FLB market size of the previous year-FLBMSPY; the volume of the FLB market in the previous year-VFLBMPY). Characterizes the degree of development of the stock market in terms of the level capitalization. (Stock market capitalization-SMC; average value of capitalization of the stock market-AVCSM. Characterizes the degree of development of the stock market in terms of the level of development of exchange transactions: volume of exchange transactions and average value of the volume of exchange transactions). Characterizes the degree of development of the stock market in terms of the level capitalization (Indicator 1), characterizes the degree of development of the stock market in terms of the level of development of exchange transactions (Indicator 2),
Table 1.
In this part, we investigated various factors that can affect the efficiency of the stock market as a segment of the financial market using the example of the Russian stock market.
In recent years, the importance of the stock market as a segment of the financial market in the context of the COVID-19 pandemic crisis has increased, which has led to an expanded role and place in the economy. This study is built on a number of previous international studies that investigated and evaluated aspects of the stock market. The studied literature contains examples of the practice of economists from European and Asian countries. The main research on the stock market during the crisis is presented in
Table 2.
Priem R. conducted a study on the impact of the COVID-19 limitation on the financial behavior of individual investors in 2021 (
Maisigova et al. 2021;
Priem 2021).
A group of scientists
Senchagov (
2015) investigated the cryptocurrencies bitcoin and ether, and the impact of anonymous cryptocurrencies on them.
Economists
Wen et al. (
2012) have shown that measuring the relationship between the energy market and the stock market during the financial crisis. The cumulative approach is applied as time-varying links, and also an effect of dependence between the energy and stock markets during the recent financial crisis were observed using the WTI spot price, the S & P500 index and the Shanghai stock market composite index.
The authors of
Botzen and Marey (
2010) note that the financial crisis has shown the economic consequences of financial instability and that they can be devastating. The consensus on the role that asset prices should play in monetary policy appears to be changing.
The authors of
Khan and Batteau (
2011) noted that in contrast to foreign exchange markets, where central banks often intervene, governments tend not to intervene in stock markets because the intervention conveys negative signals and side effects associated with the market.
The authors of
Nobi et al. (
2014) examined the impact of the 2008 global financial crisis on the threshold networks of the local Korean financial market during the crisis and provided the prices of individual shares held by KOSPI 200 (Korea Composite Stock Price Index 200).
A number of scholars have conducted an empirical study of the impact of the 1997 financial crisis on the performance of eight Asian stock markets using bicorrelation rolling test statistics for three sub-periods of the pre-crisis, crisis and post-crisis periods, by country
Lim et al. (
2008).
The authors of (
Jethwani and Achuthan 2013) examined the concept of the efficient market hypothesis (EMH) and noted that it has always been a controversial issue in the research world. An analysis of the efficiency of the stock market as the most important factor in assessing various areas of investment was carried out.
The study examines long-term price relationships and price dynamics between the United States, Germany and the four largest stock markets of emerging Eastern Europe, with a particular focus on the impact of the 1998 Russian financial crisis (
Nurpeisova et al. 2021;
Yang et al. 2006;
Yashchenko 2020).
Scientists
Zhao et al. (
2016) calculated daily correlations between 322 S&P 500 stocks explored using a correlation-based network (CB). Using heterogeneous time frames, we define global expansion and local clustering of market behavior during crises.
Analysis of the literature shows a sufficient base of research in the field of financial markets, while it remains relevant to consider the assessment of the development of the stock market in the example of the Russian Federation in the context of new restrictions, taking into account the selection of indicators based on open sources.
3. Results
Let us consider the dynamics of a number of indicators characterizing the development of the stock market in the Russian Federation during 2016–2020.
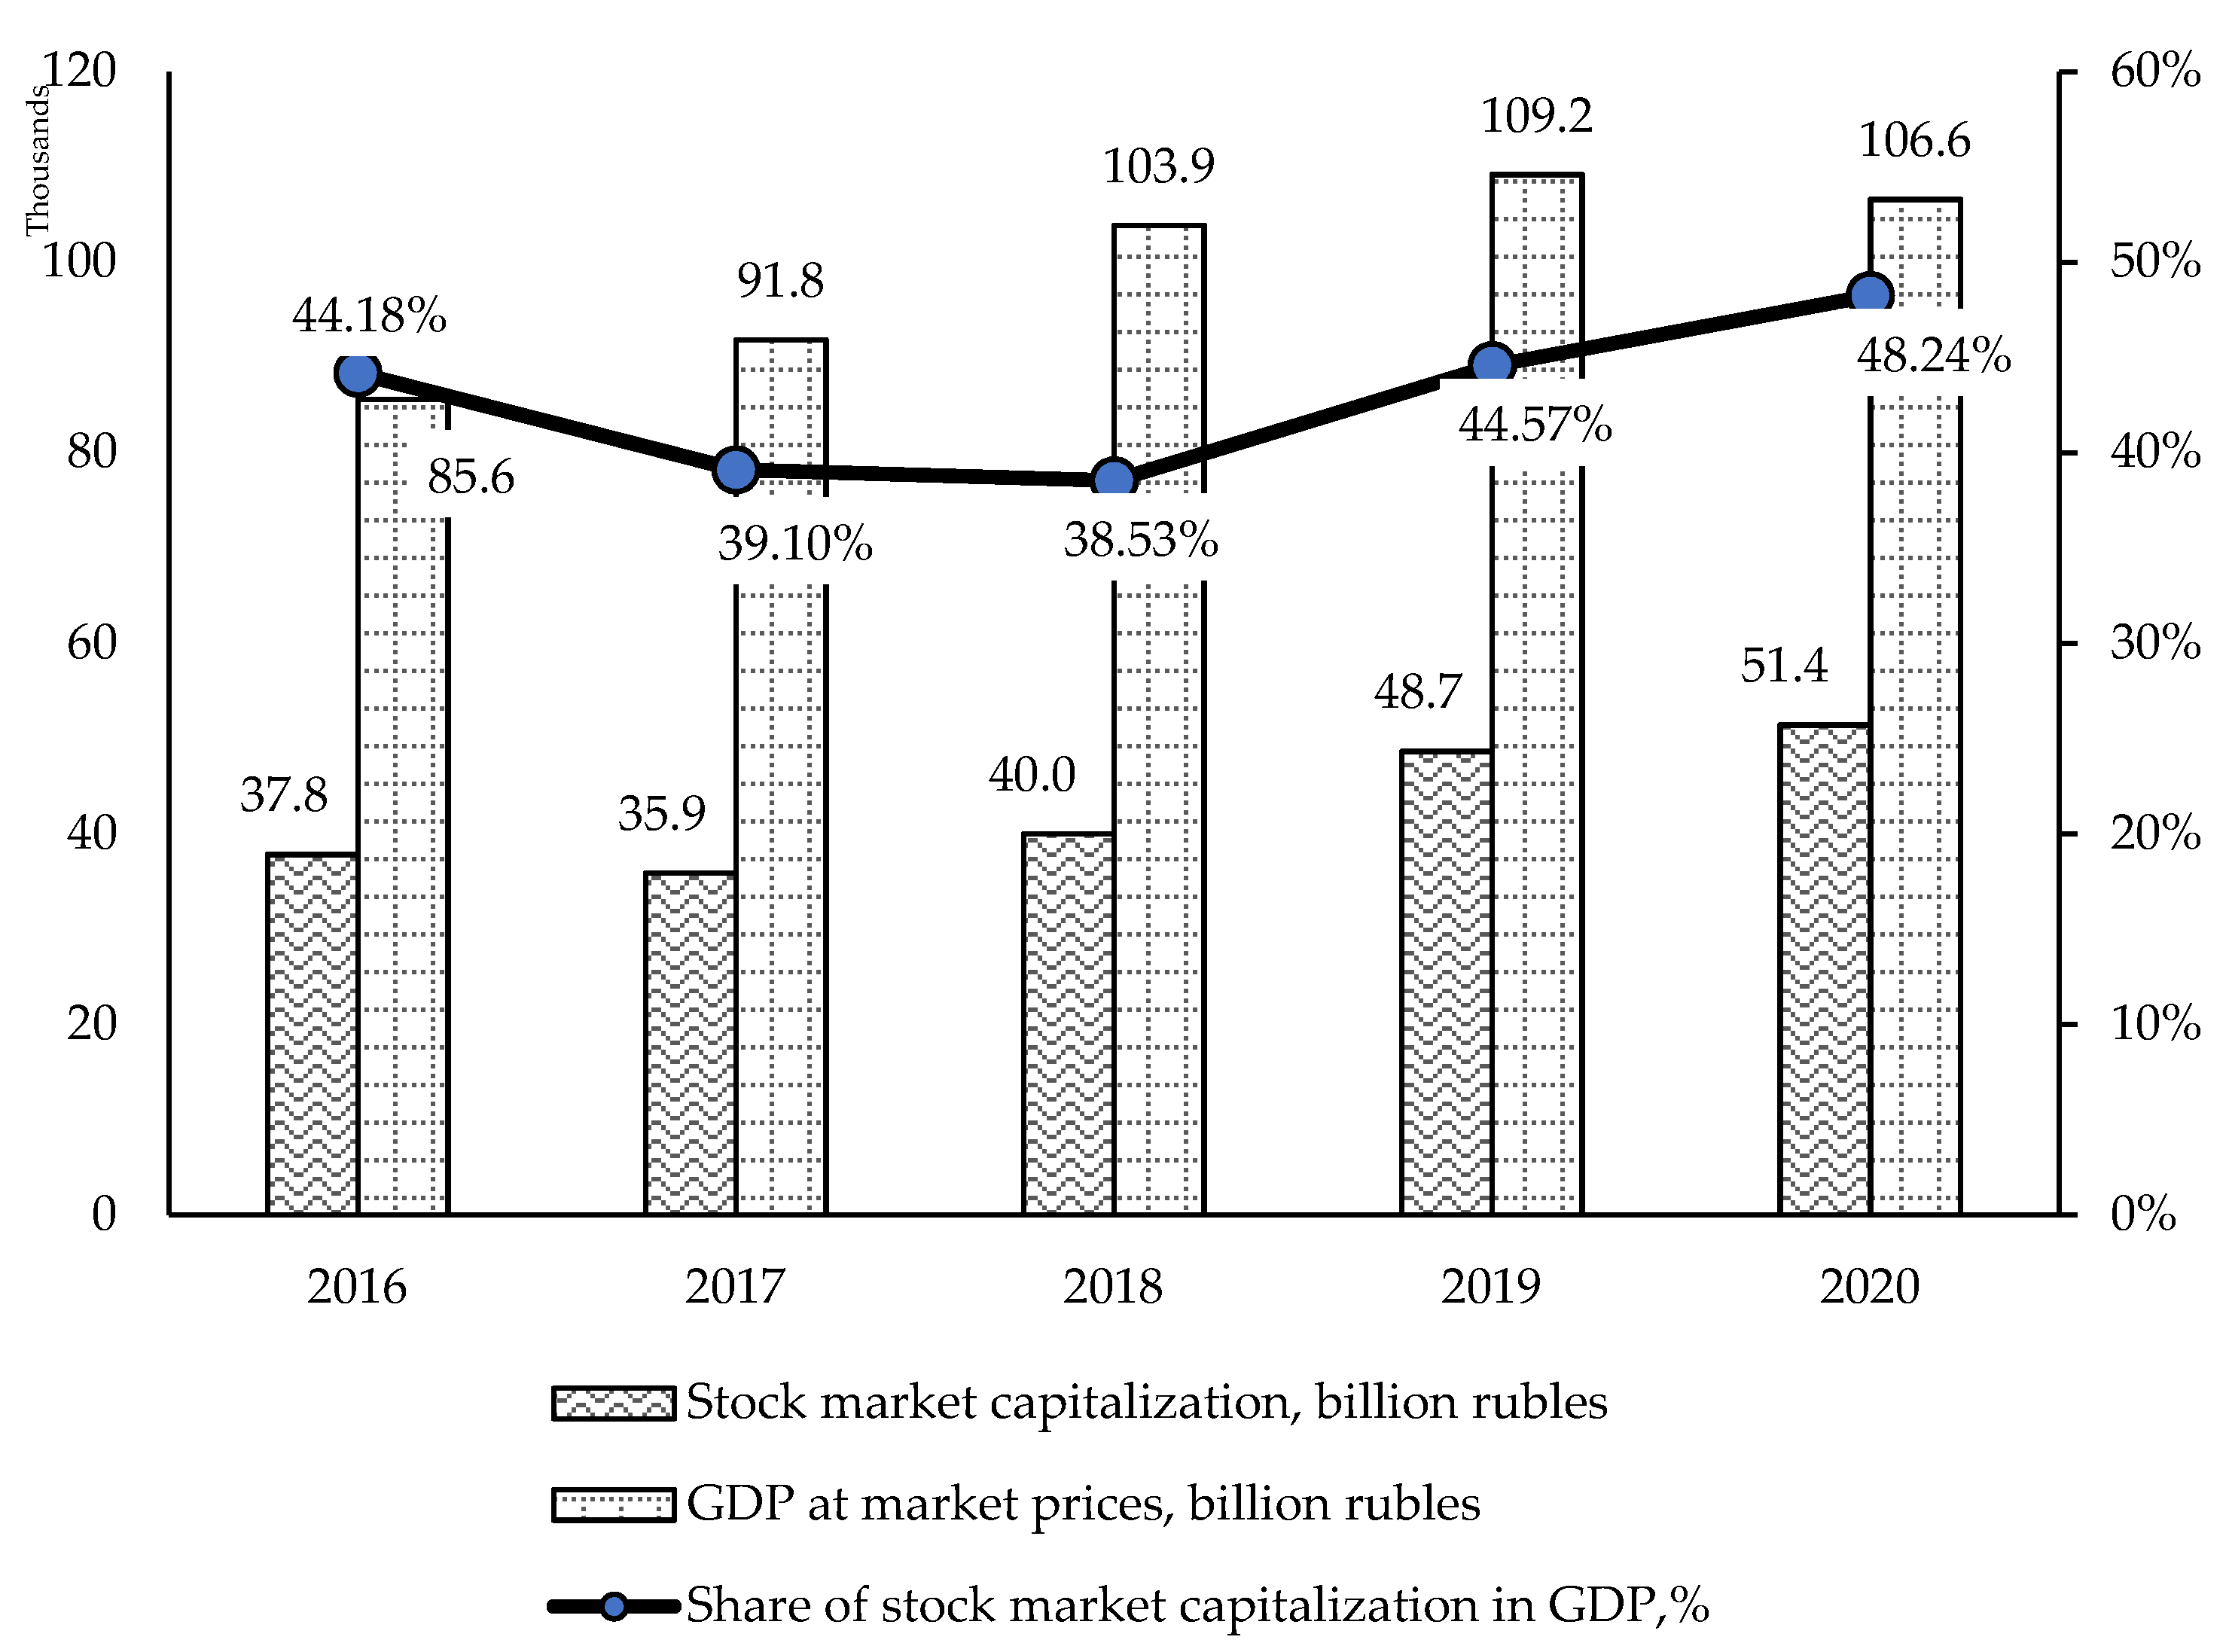
Let us consider the dynamics of the share of stock market capitalization in GDP (
Figure 1).
The indicator «share of stock market capitalization in GDP» during the analyzed period had different dynamics. It should be noted that during 2016–2018 the indicator was constantly decreasing, and during 2018–2020 it was constantly increasing and amounted to 48.24% in 2020. The resulting value in 2020 suggests that in this period the capitalization of the stock market is slightly below 50% of the generated GDP in this period. It should be noted that it was in this period that the highest value of this indicator was recorded. It should be noted that GDP has steadily increased during 2016–2019. In 2017, compared to 2016, the capitalization of the stock market decreased as a result of the indicator «the share of capitalization of the stock market in GDP» decreased. In 2018, compared to 2017, the capitalization of the stock market increased, but its growth rate was lower than the GDP growth rate, which also led to a decrease in the resulting indicator. During 2018–2020, the capitalization of the stock market has steadily increased. At the same time, its growth exceeded GDP growth during 2018–2019, and in 2020, compared to 2019, GDP generally decreased. Such a change in the components during 2018–2020 led to an increase in the indicator «share of stock market capitalization in GDP» during the specified period. At the same time, the obtained values of this indicator were always within the standard range of values.
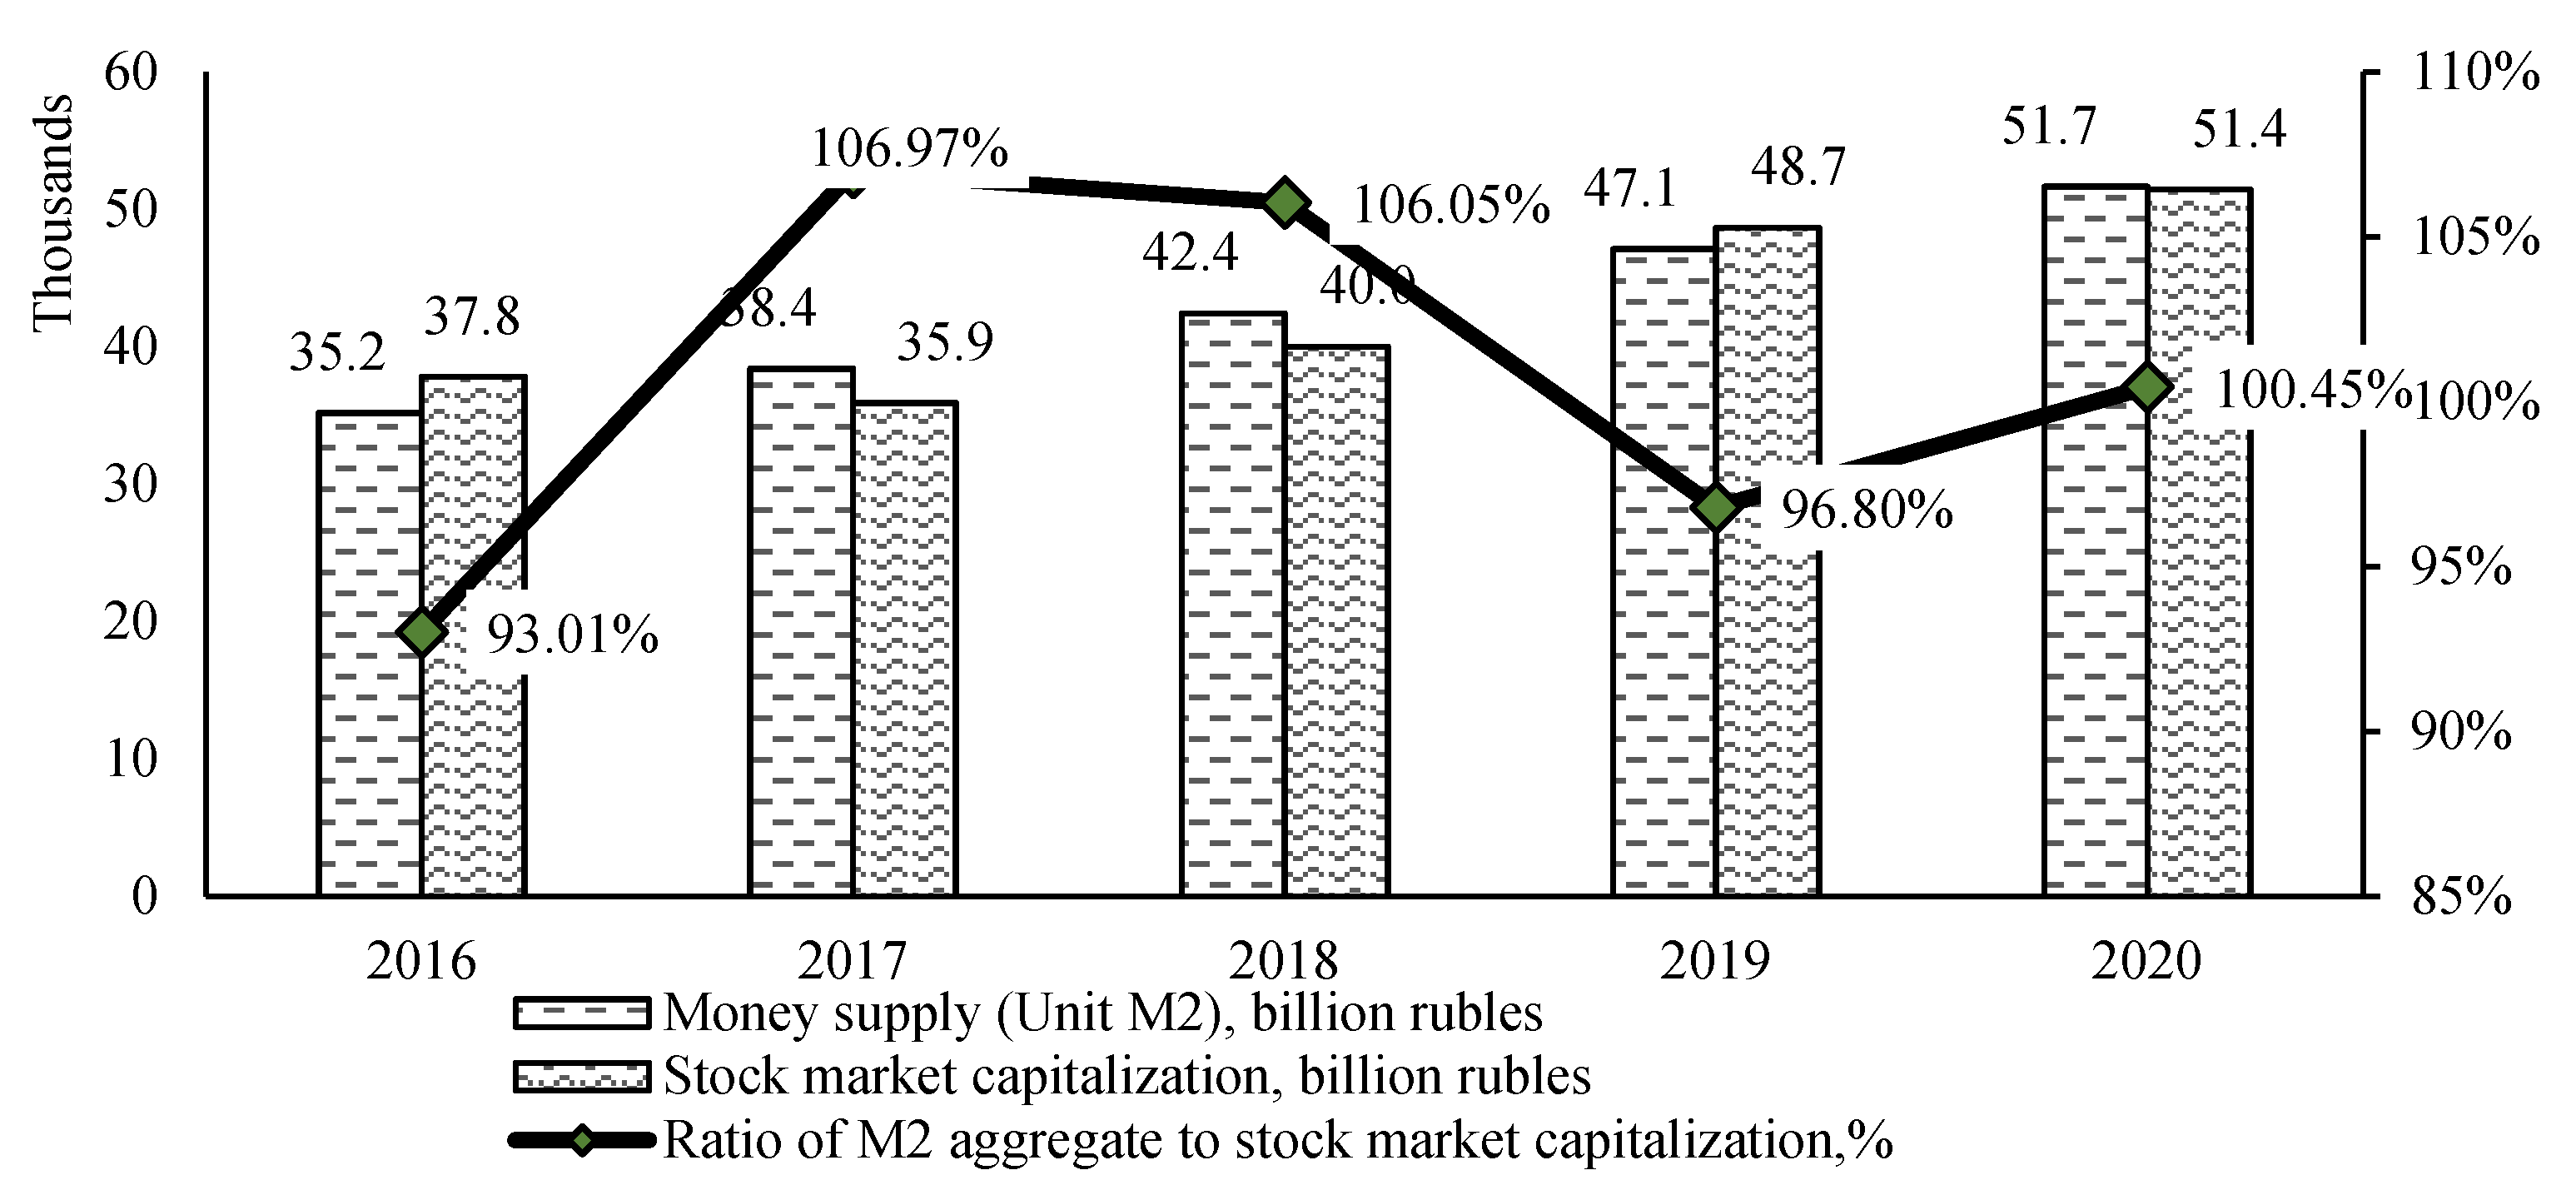
Let us consider the dynamics of the indicator «ratio of the M2 aggregate to the capitalization of the stock market» (
Figure 2).
The indicator «ratio of M2 aggregate to stock market capitalization» had different dynamics. In 2017, compared to 2016, the indicator increased significantly, during 2017–2019 this indicator was constantly decreasing, and in 2020, compared to 2019, it increased again. The money supply in the Russian Federation has been constantly increasing during 2016–2020. The capitalization of the stock market in 2017 decreased compared to 2016, which led to an increase in the resulting indicator. In 2018, compared to 2017, the capitalization of the stock market increased to a greater extent than the money supply, which led to an increase in the indicator «ratio of the M2 aggregate to the capitalization of the stock market». In 2019, compared to 2018, the growth rate of the money supply exceeded the growth rate of the stock market capitalization, as a result, this indicator decreased. The growth of the indicator «ratio of the M2 aggregate to the capitalization of the stock market» in 2020 compared to 2019 is explained by a greater increase in the capitalization of the stock market than the money supply in this period.
It should be noted that the indicator «ratio of the M2 aggregate to the capitalization of the stock market» obtained in 2020 is higher than the same indicators in 2016 and 2019, but less than the values of 2017 and 2018. One must also pay attention to the fact that in 2017, 2018 and 2020, the volume of money supply exceeded the value of the capitalization of the stock market of the Russian Federation.
During the analyzed period, the volume of exchange transactions in the stock market of the Russian Federation was constantly increasing. If in 2015 the volume of exchange transactions amounted to 9100 billion RUB, then in 2020 this volume amounted to 47,797 billion RUB, i.e., during the analyzed period, the volume of exchange transactions increased by 5.3 times. This change indicates the development of the stock market in the Russian Federation during the analyzed period. It should be noted that, to the greatest extent, both in absolute terms and in relative terms, the volume of exchange transactions in the stock market increased in 2017 compared to 2016, when the growth rate was 235.78%. Moreover, a significant increase in the volume of exchange transactions occurred in 2018 compared to 2017 (growth by 1.4 times).
During the analyzed period, the volume of the federal loan bonds (FLB) market in the Russian Federation was constantly increasing (
Table 3). If in 2015 the FLB market was 4991 billion RUB, then in 2020 the market volume amounted to 13,669 billion RUB, that is, during the analyzed period, the FLB market grew 2.7 times. This change testifies to the development of the federal loan bond market in the Russian Federation during the analyzed period. It should be noted that, to the greatest extent, both in absolute terms and in relative terms, the volume of exchange transactions in the stock market increased in 2020 compared to 2019, when the growth rate was 53.50%. Also, a significant increase in the volume of the FLB market occurred in 2019 compared to 2018 (the growth rate is 21.45%). It should be noted that the growth of the FLB market that occurred during 2018–2020 was 2.7 times higher than the similar change in the federal loan bond market that occurred during 2015–2018.
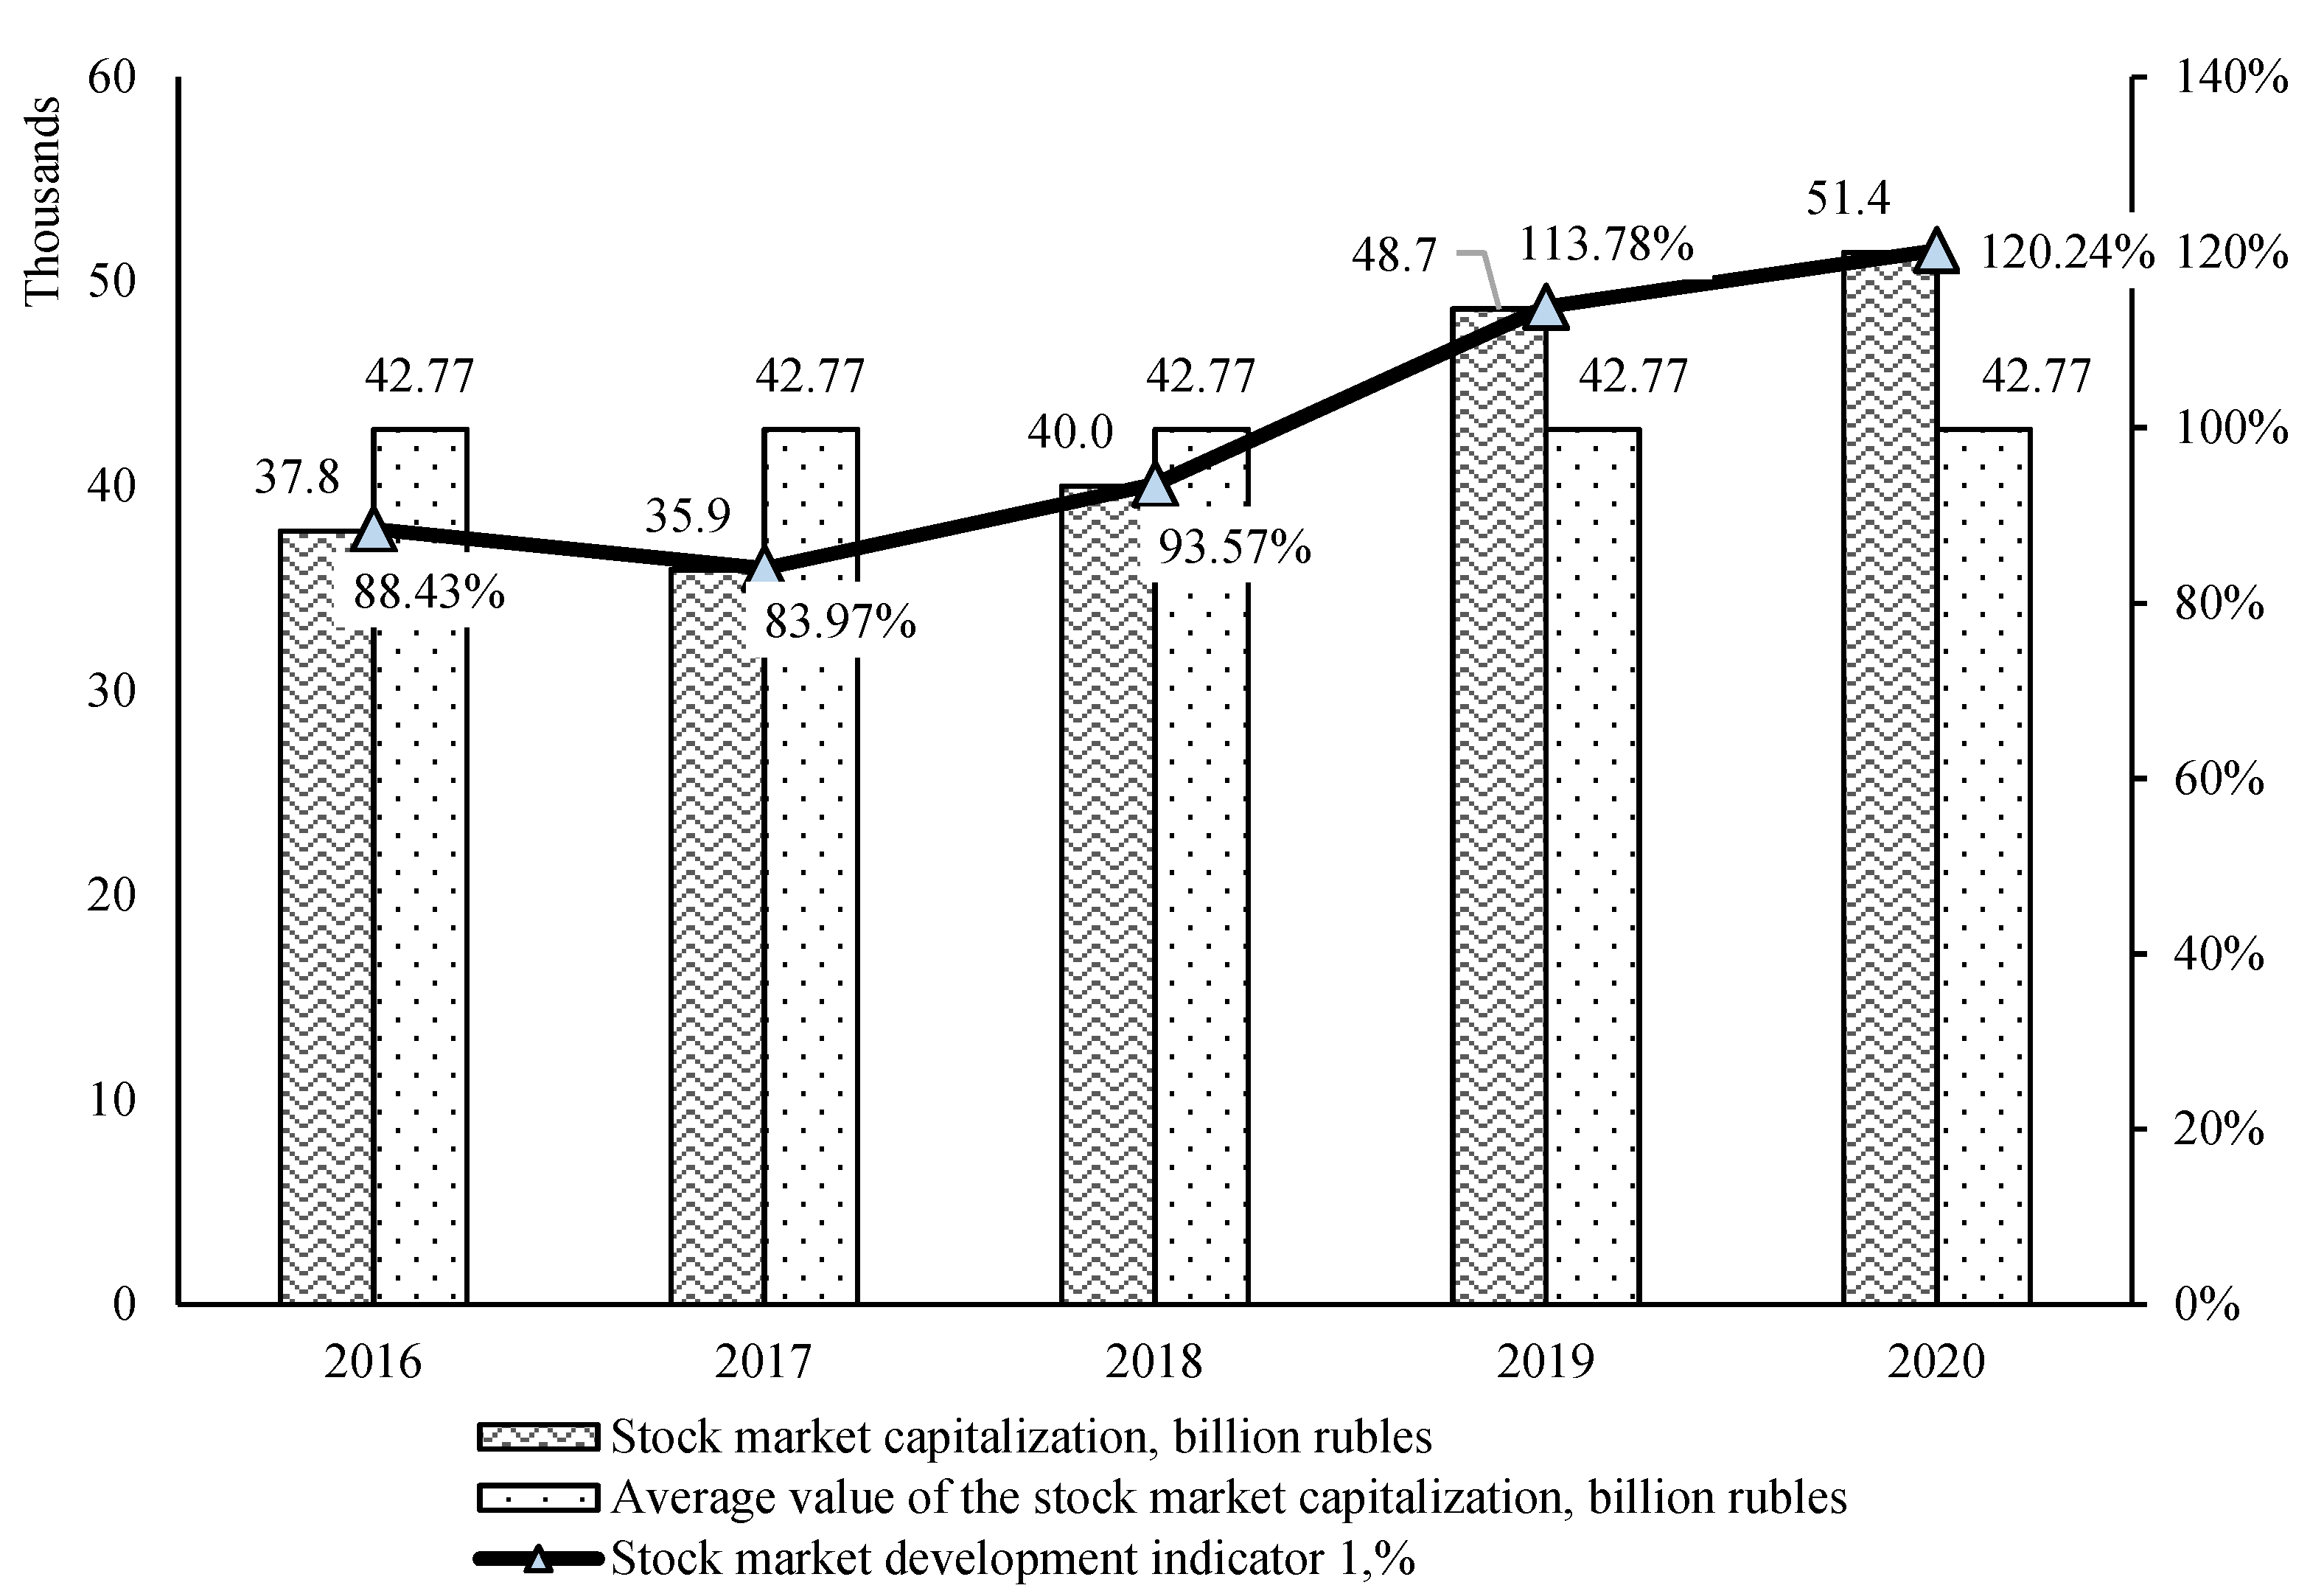
Let us consider the dynamics of the stock market development Indicator 1 (
Figure 3).
The stock market development Indicator 1 during 2016–2020 had different dynamics. In 2017, compared to 2016, the stock market development Indicator 1 decreased, and during 2017–2020 it constantly increased, and in 2020 it reached the highest value equal to 120.24%. The dynamics of the indicator depend entirely on changes in the capitalization of the stock market in the Russian Federation during the analyzed period. In 2017, compared to 2016, the stock market volume decreased, which led to a decrease in the stock market development Indicator 1. In the future, this indicator only increased. It should be noted that in 2016, 2017 and 2018 the stock market development Indicator 1 was less than 100%, so the volume of capitalization of the stock market during these periods was less than the average annual value of this market for 5 years. The stock market development Indicator 1 only exceeded 100% in 2019 and 2020, since the values of the stock market capitalization in these periods exceeded the average annual value of this market. At the same time, the largest excess of the capitalization of the stock market over the average annual value was recorded in 2020, when the volume of capitalization of the stock market in the Russian Federation exceeded the average annual value of this market for 2016–2020 by 20.24%.
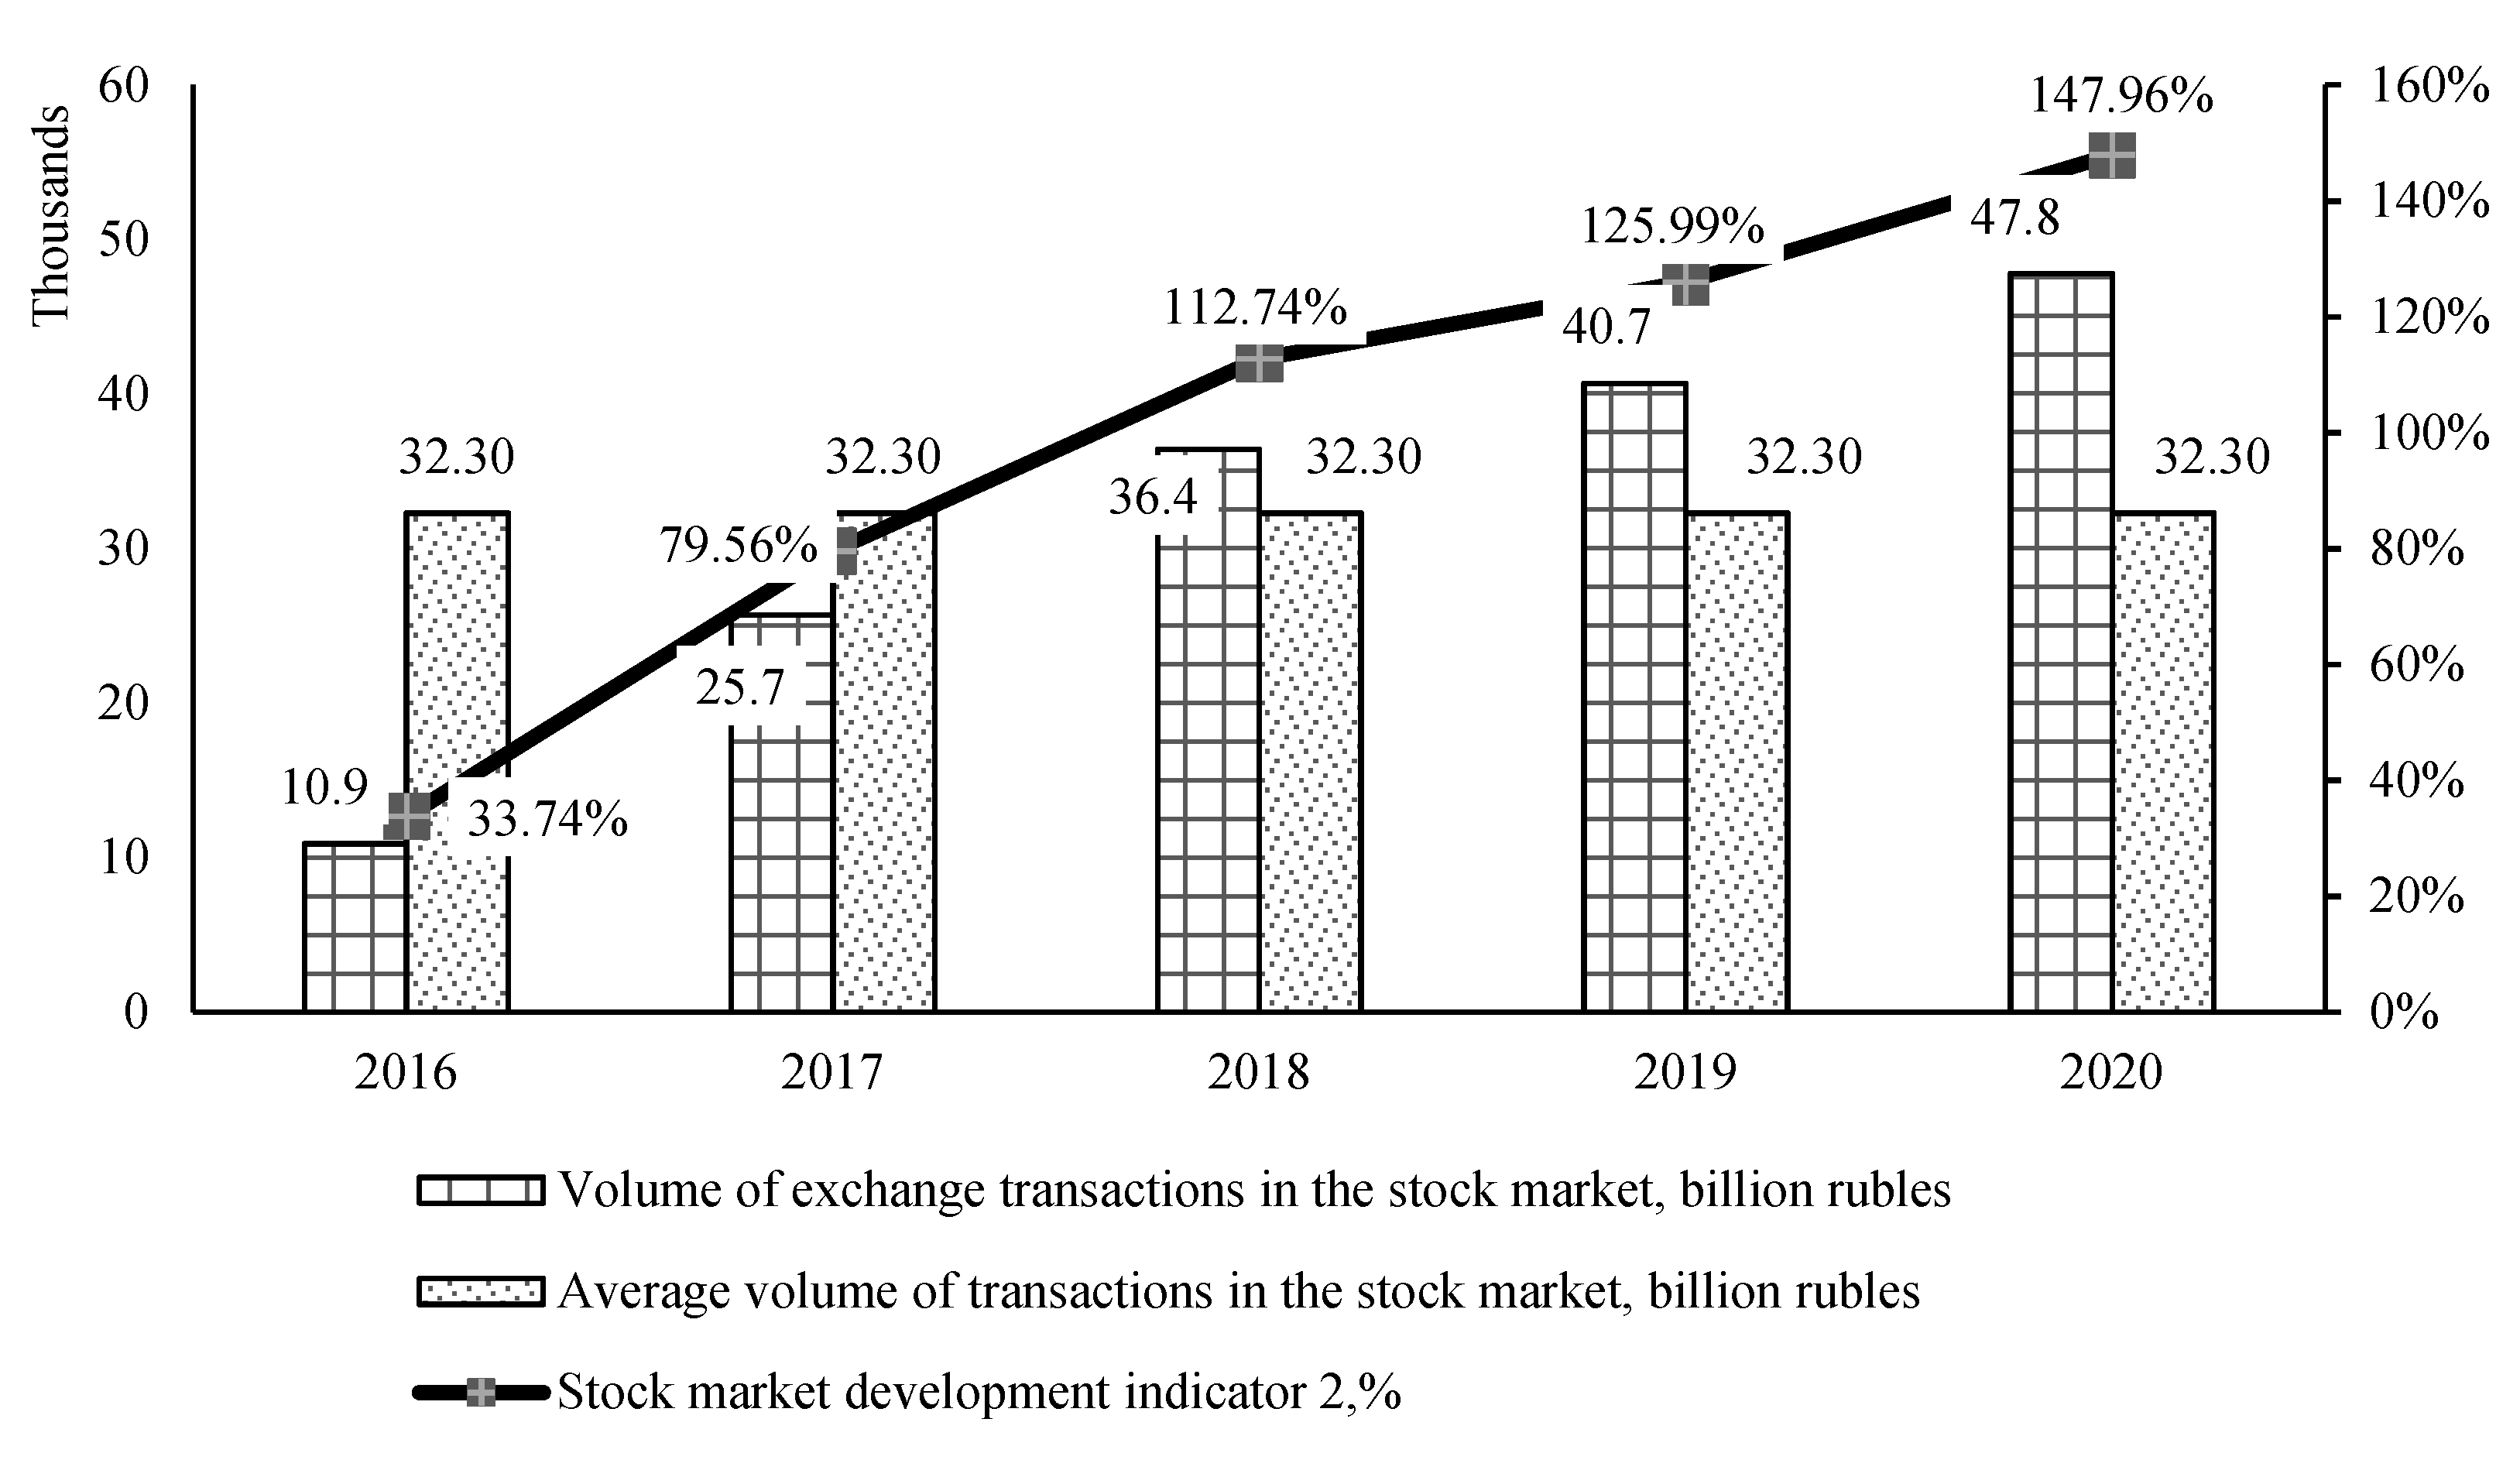
Let us consider the dynamics of the stock market development Indicator 2 (
Figure 4).
The stock market development Indicator 2 has been constantly increasing during 2016–2020. This is due to the fact that during the analyzed period, the volumes of exchange transactions in the stock market were constantly increasing. It should be noted that in 2016 and 2017, the obtained value of this indicator was below the standard equal to 100%, and in 2018, 2019 and 2020 it exceeded the established standard. It should be noted that in 2020 the credit market development Indicator 1 was the highest. It was in this period between 2016–2020 that the largest volume of exchange transactions in the stock market was recorded. It should be noted that the growth in the volume of exchange transactions in the stock market was abrupt. During 2016–2018, the volume of exchange transactions in the stock market increased 3.4 times, and then the growth of exchange transactions slowed down (the growth rate of exchange transactions in 2018–2020 was only 31.24%).
We conducted a comprehensive assessment of the development of the stock market in the Russian Federation for 2016–2020. To do this, we calculated a single indicator of the stock market development (SISMD–Single Indicator of Stock Market Development).
The calculation of a single indicator of the stock market development showed that in 2016, 2018 and 2019 the stock market did not develop at an adequate pace, and in 2017 and 2020 the stock market development rate was acceptable.
The worst state of stock market development was recorded in 2016, when the single indicator of stock market development was 0.7156. During this period, the development of the stock market was insufficient. It should be noted that the negative impact of four indicators exceeded the positive impact of one indicator, as a result of which the single indicator of the stock market development turned out to be less than 1. At the same time, the indicator of the stock market development had the greatest negative impact on the resulting indicator.
A slightly better state of stock market development was recorded in 2018, when the single indicator of stock market development was 0.8. During this period, the development of this market was also insufficient, since the single indicator is less than 1. It should be noted that the negative impact of four indicators exceeded the positive impact of one indicator, as a result of which the single indicator of the stock market development turned out to be less than 1. The rate of change in the volume of the federal loan bonds market had the greatest negative impact on the resulting indicator.
An even better state of development of the stock market was recorded in 2019. It is true that in this period the development of the stock market in the Russian Federation was insufficient, since the single indicator of the stock market was 0.9. It should be noted that the negative impact of two indicators exceeded the positive impact of three indicators, as a result of which the single indicator of the stock market development turned out to be less than 1. At the same time, it was precisely the low value of the rate of change in the volume of exchange transactions in the stock market that led to the development of the stock market in this period being insufficient.
The best state of stock market development was recorded in 2017, when the single indicator of stock market development was 1.2. During this period, the stock market developed at its best. At the same time, this state was ensured by only one factor—the rate of change in the volume of exchange transactions in the stock market. More than a twofold increase in the volume of such transactions exceeded the negative impact of the other four factors, as a result of which the resulting indicator exceeded 1.
4. Discussion
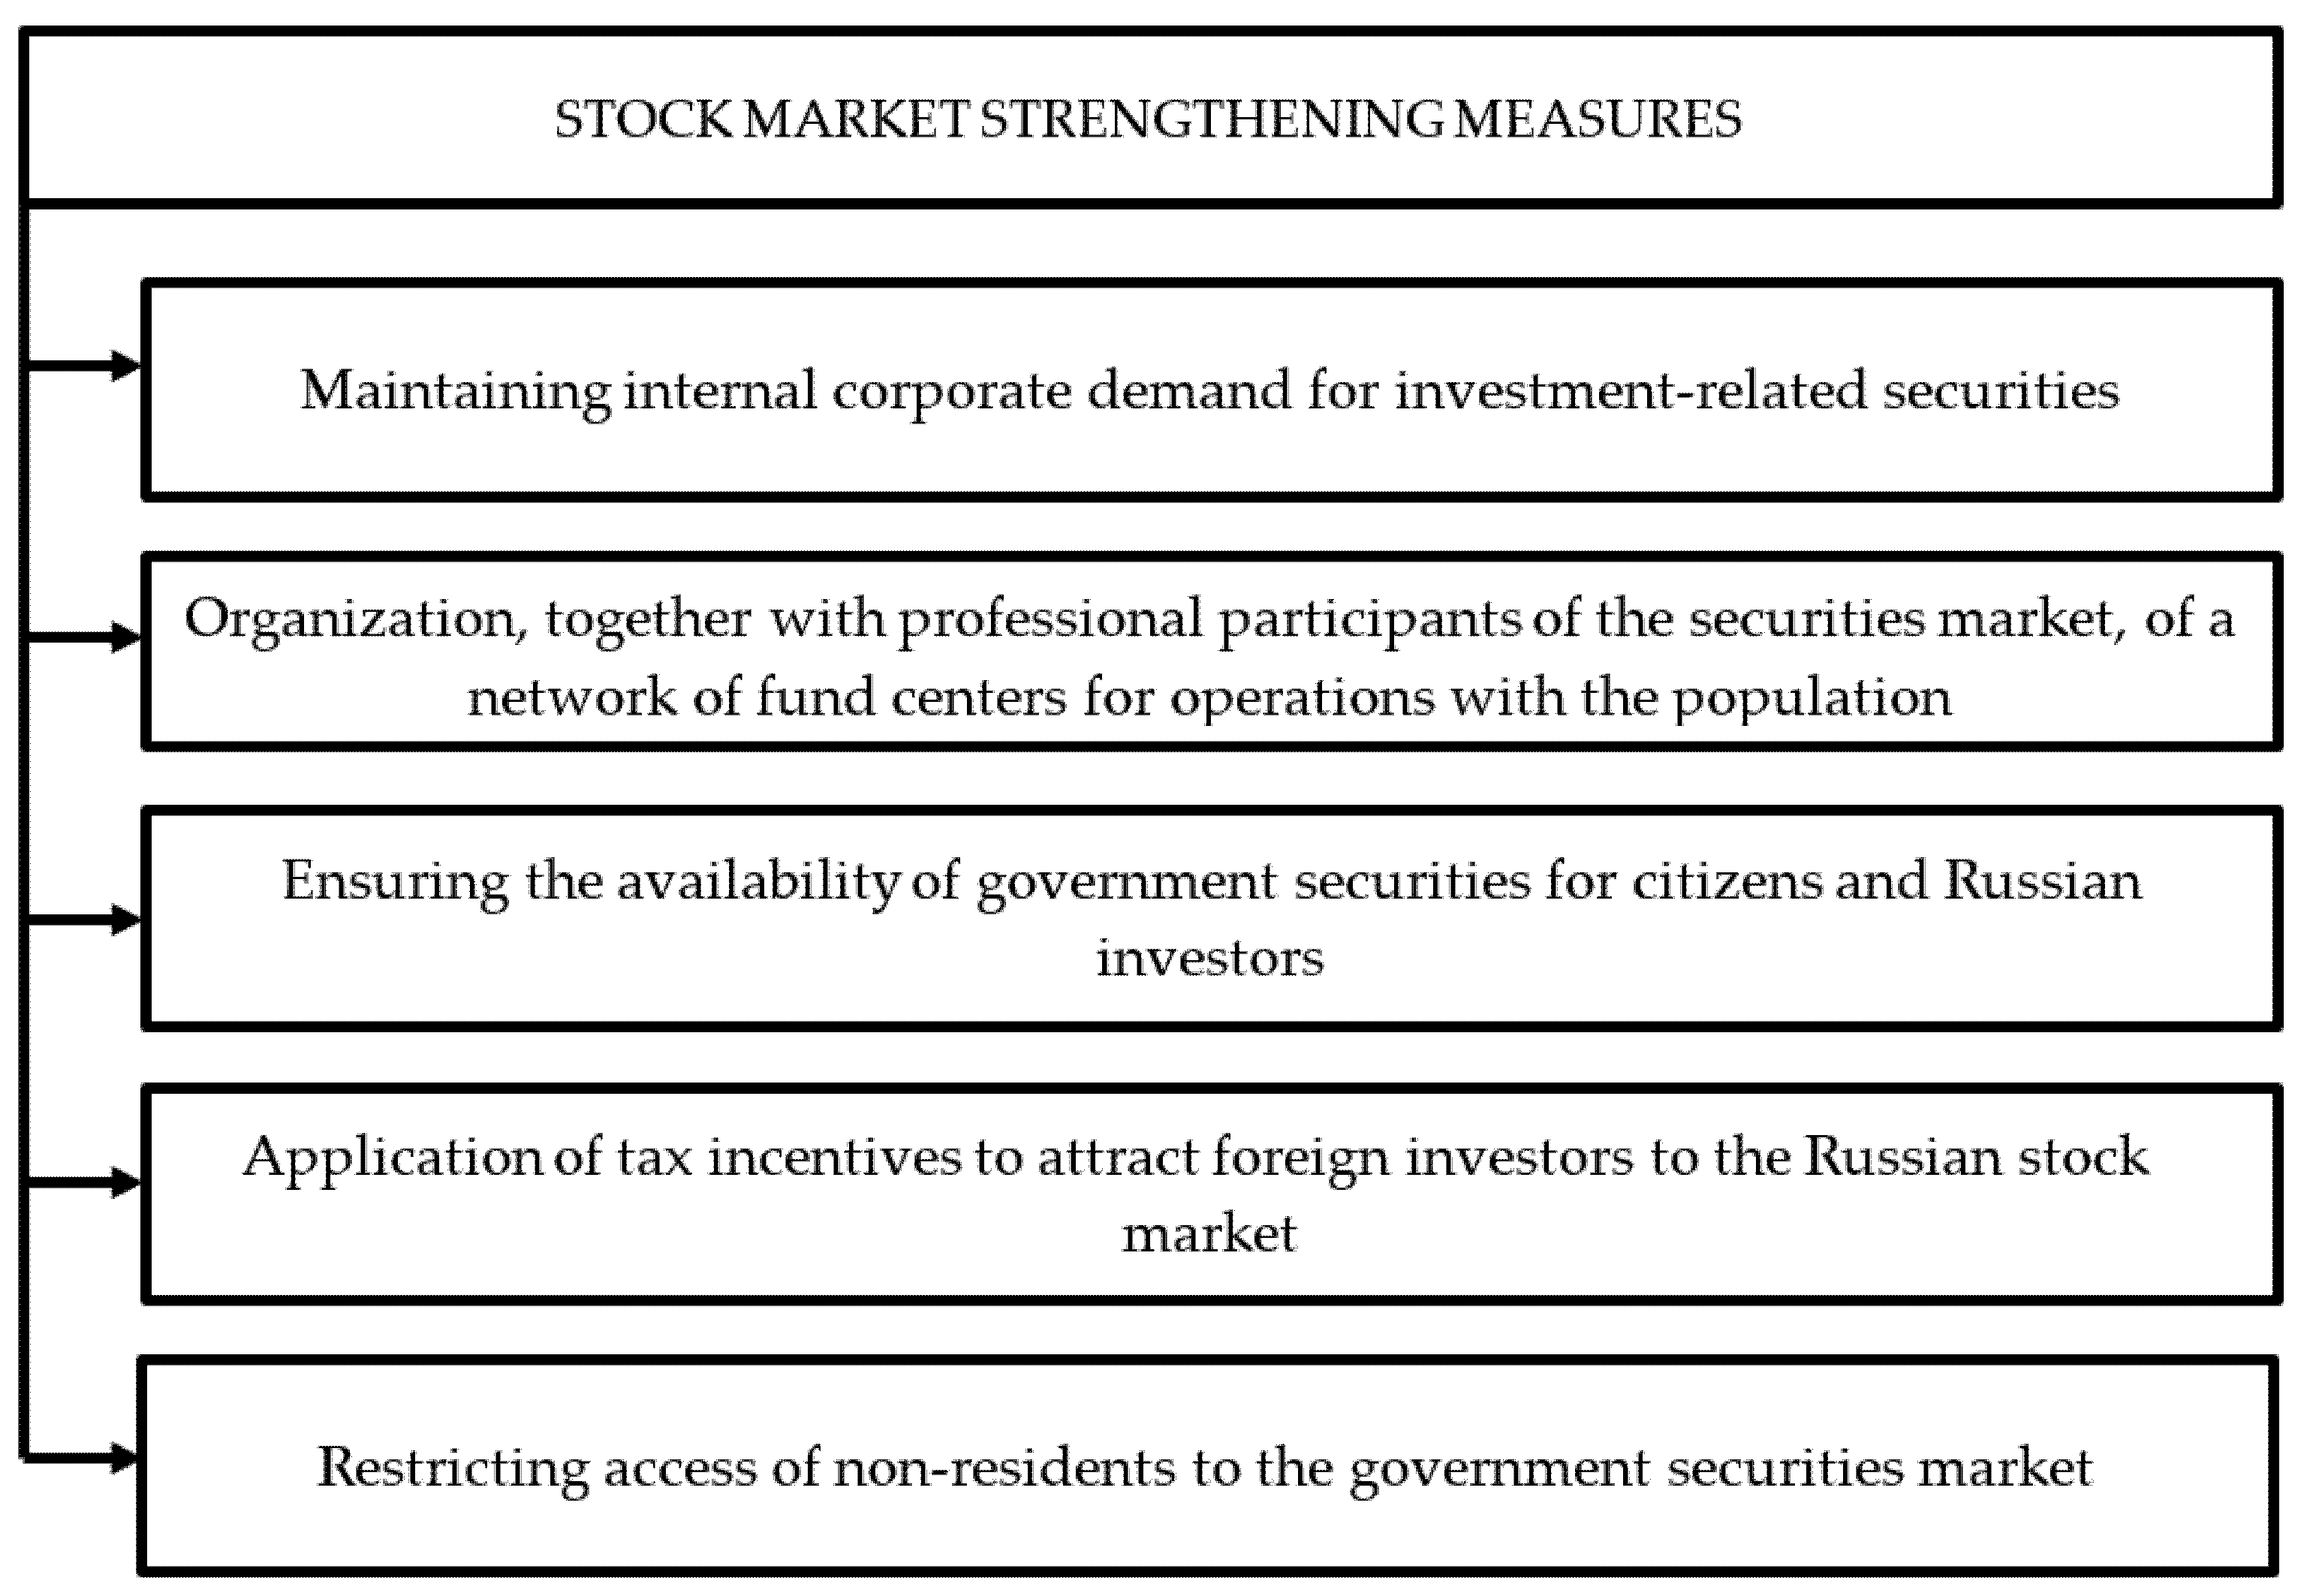
The next block of measures to increase the level of development of the financial market-measures to stabilize the stock market are represented in
Figure 5.
2020 is the first year in which the development of the stock market was sufficient, since the single indicator of the development of the stock market in this period was 1.2. In this period, four indicators had a positive effect on the resulting indicator, and one had a negative effect. The greatest positive impact on the resulting indicator was made by the rate of change in the volume of the federal loan bond market.
5. Conclusions
According to the assessment of the development of the stock market in the Russian Federation between 2016–2020, the worst state of the stock market development was recorded in 2016, when the single indicator of the stock market development was 0.7. During this period, the development of the stock market was insufficient. It should be noted that the negative impact of four indicators exceeded the positive impact of one indicator, as a result of which the single indicator of the stock market development turned out to be less than 1. At the same time, the indicator of the stock market development had the greatest negative impact on the resulting indicator.
The best state of stock market development was recorded in 2017, when the single indicator of stock market development was 1.2. During this period, the stock market developed at its best. At the same time, this state was ensured by only one factor—the rate of change in the volume of exchange transactions in the stock market. More than a twofold increase in the volume of such transactions exceeded the negative impact of the other four factors, as a result of which the resulting indicator exceeded 1.
The proposed measures to improve the work of the stock market are aimed at increasing the attractiveness of the stock market for both Russian and foreign investors. For this purpose, it is proposed to involve households in operations on the stock market as an important subject of financial relations, which will require active informatization of citizens, as well as opening a network of fund cents together with professional participants that will allow the population to make a decision on investing in certain securities.
In addition, among the proposals for strengthening the stock market, one can single out the establishment of a mandatory minimum share of investments by financial institutions in securities that circulate in organized financial markets, the funds from the placement of which are used by issuers to invest in production. This is necessary to maintain internal corporate demand for stocks and bonds. This event will provide an opportunity not only to increase the capitalization of the stock market, but also to attract investments in fixed assets.
It is also necessary to ensure the availability of government securities for the population, because, often, announcements of the issue of federal loan bonds are disseminated, and the places where they can be purchased are not reported.
Measures to strengthen the Russian stock market should also include the application of tax incentives to non–residents while limiting their access to government securities in order to avoid the growth of dependence of the Russian economy on changes in the external economic environment and decisions of non-resident investors, in particular.
Further research should be directed to approbation of the declared measures and their partial or full implementation.
Further research should be directed towards further presenting the results obtained in the framework of empirical discussions or a critical assessment of the main research findings, where data collection and analysis can be revised and discussed even more comprehensively.
Author Contributions
Conceptualization, S.N., M.A.K.J., V.R., O.B. and S.Y.; methodology, S.N., M.A.K.J., E.K, A.N., and Z.Y.; formal analysis, S.N., M.A.K.J., V.R, A.N., O.B. and V.D.; investigation, S.N., E.K. and D.M.; resources, S.N., M.A.K.J., V.R., S.Y., A.N., Z.Y.; writing—original draft preparation, S.N., A.N., D.B., N.B., D.M., V.D. and Z.Y.; writing—review and editing, S.N., V.R., A.N., S.Y., and V.D.; visualization, S.N., M.A.K.J., N.B, V.D., D.M., E.K., A.N. and Z.Y.; supervision, S.N., M.A.K.J., N.B, E.K., D.M., O.B., S.Y. and A.N. All authors have read and agreed to the published version of the manuscript.
Funding
This research received no external funding.
Institutional Review Board Statement
Not applicable.
Informed Consent Statement
Informed consent was obtained from all subjects involved in the study.
Data Availability Statement
The data used to support the findings of this study are available from the corresponding author upon request.
Conflicts of Interest
The authors declare that he has no known competing financial interests or personal relationships with anyone that could have appeared to influence the work reported in this paper.
References
- Adzhamatova, Djiannetta, Dina Hasanova, and Valentina Kremleva. 2019. Russian stock market: The impact of Western sanctions and the prospects for overcoming the crisis. Bulletin of the Altai Academy of Economics and Law 5: 17–22. [Google Scholar]
- Babkin, Aleksander, Diana Burkaltseva, Andrey Tyulin, Pulod Azimov, and Oleg Blazhevich. 2020. Initial coin offering (ICO) as a transformation of financial institution of collective investment. Moscow University Economic Bulletin, 81–103. Available online: https://www.elibrary.ru/item.asp?id=42584483 (accessed on 21 March 2021).
- Blazhevich, Oleg, and Natalia Safonova. 2021a. Comprehensive assessment of the Russian Federation financial market development and development of recommendations for its improvement. Scientific Bulletin: Finance, Banks, Investments 2: 111–28. [Google Scholar]
- Blazhevich, Oleg, and Natalia Safonova. 2021b. Features of the development of the financial market in the context of digitalization. Scientific Bulletin: Finance, Banks, Investments 1: 106–24. [Google Scholar]
- Bodner, Galina. 2018. Stable state of the stock market of the Russian Federation as the basis for ensuring its financial security. Scientific Bulletin: Finance, Banks, Investments 4: 128–34. [Google Scholar]
- Borsch, Ludmila. 2018. Influence of fundamental factors and mechanisms on the development of the stock market. Scientific Bulletin: Finance, Banks, Investments 4: 153–64. [Google Scholar]
- Botzen, Wouter, and Philip Marey. 2010. Did the ECB respond to the stock market before the crisis? Journal of Policy Modeling 32: 303–22. [Google Scholar] [CrossRef]
- Demilkhanova, Bela. 2019. The Russian stock market in the system of financial markets and its structure. Trends in the Development of Science and Education 56: 92–96. [Google Scholar]
- Gorda, Olga. 2020. Formation and development of global networks of stock exchanges. Scientific Bulletin: Finance, Banks, Investments 2: 104–12. [Google Scholar]
- Gunchikov, Dmitry, Andrey Letov, and Andrey Vaichulis. 2018. Economic security and stability of stock markets in modern conditions. Prospects for the Development of the Construction Complex 12: 293–97. [Google Scholar]
- Ionescu, Luminita. 2020. The Economics of the Carbon Tax: Environmental Performance, Sustainable Energy, and Green Financial Behavior. Geopolitics, History, and International Relations 12: 101–7. [Google Scholar] [CrossRef]
- Ionescu, Luminita. 2021a. Corporate Environmental Performance, Climate Change Mitigation, and Green Innovation Behavior in Sustainable Finance. Economics, Management, and Financial Markets 16: 94–106. [Google Scholar] [CrossRef]
- Ionescu, Luminita. 2021b. Leveraging Green Finance for Low–Carbon Energy, Sustainable Economic Development, and Climate Change Mitigation during the COVID-19 Pandemic. Review of Contemporary Philosophy 20: 175–86. [Google Scholar] [CrossRef]
- Ionescu, Luminita. 2021c. Transitioning to a Low-Carbon Economy: Green Financial Behavior, Climate Change Mitigation, and Environmental Energy Sustainability. Geopolitics, History, and International Relations 13: 86–96. [Google Scholar] [CrossRef]
- Jethwani, Kinjal, and Sarla Achuthan. 2013. Stock market efficiency and crisis: Evidence from India. Asia–Pacific Finance and Accounting Review 1: 35. [Google Scholar]
- Khan, Salman, and Pierre Batteau. 2011. Should the government directly intervene in stock market during a crisis? The Quarterly Review of Economics and Finance 51: 350–59. [Google Scholar] [CrossRef]
- Lim, Kian, Robert Brooks, and Jae Kim. 2008. Financial crisis and stock market efficiency: Empirical evidence from Asian countries. International Review of Financial Analysis 17: 571–91. [Google Scholar] [CrossRef]
- Luchtenberg, Kimberly, and Quang Vu. 2015. The 2008 financial crisis: Stock market contagion and its determinants. Research in International Business and Finance 33: 178–203. [Google Scholar] [CrossRef]
- Lukasevich, Igor. 2020. Research of dependencies and assessment of the impact of world stock markets on the Russian stock market. Economy Taxes Right 13: 44–56. [Google Scholar] [CrossRef]
- Maisigova, Leila, Bibigul Isayeva, and Tamara Dzholdosheva. 2021. Features of Relations between Government Authorities, Business, and Civil Society in the Digital Economy. In Socio–Economic Systems: Paradigms for the Future. Studies in Systems, Decision and Control. Edited by Elena Popkova, Valentina Ostrovskaya and Anna Bogoviz. Cham: Springer, vol. 314. [Google Scholar] [CrossRef]
- Mikhailov, Aleksander, Timur Iskandarov, and Vladimir Gorodnov. 2019. The role of the stock market in financing the Russian economy. Economic Sciences 173: 22–26. [Google Scholar]
- Nobi, Ashadun, Seong Maeng, Gyeong Ha, and Jae Lee. 2014. Effects of global financial crisis on network structure in a local stock market. Physica A: Statistical Mechanics and its Applications 407: 135–43. [Google Scholar] [CrossRef]
- Nurpeisova, Ardak, Laila Smailova, Bibigul Akimova, and Elena Borisova. 2021. Condition and Prospects of Innovative Development of the Economy in Kazakhstan. In Socio–Economic Systems: Paradigms for the Future. Studies in Systems, Decision and Control. Edited by Elena Popkova, Valentina Ostrovskaya and Anna Bogoviz. Cham: Springer, vol. 314. [Google Scholar] [CrossRef]
- Priem, Randy. 2021. An Exploratory Study on the Impact of the COVID-19 Confinement on the Financial Behavior of Individual Investors. Economics, Management, and Financial Markets 16: 9–40. [Google Scholar] [CrossRef]
- Reutov, Viktor, Diana Burkaltseva, Blazhevich Oleg, Ludmila Borsch, Oleg Gabrielyan, Natalia Khlybova, and Olga Guk. 2018. The Method of Assessing the State’s Financial Security Level. International Journal of Engineering & Technology 7: 404–11. [Google Scholar]
- Russia in Numbers. 2020. Brief Statistical Collection. Moscow: Federal State Statistics Service of the Russian Federation, 550p. [Google Scholar]
- Schinckus, Christophe, Canh Nguyen, and Felicia Chong. 2021. Are Bitcoin and Ether Affected by Strictly Anonymous Crypto–Currencies? An Exploratory Study. Economics, Management, and Financial Markets 16: 9–27. [Google Scholar] [CrossRef]
- Senchagov, Vladimir. 2015. Economic Security of Russia. General Course. Textbook, 5th ed. Moscow: Publishing House “BINOM. Knowledge Laboratory”, 516p. [Google Scholar]
- Shein, Sergey, and Anna Postnikova. 2019. Analysis of the development of the stock market in modern economic conditions. Science of the XXI Century: Current Directions of Development 2: 90–97. [Google Scholar]
- Sidorov, Aleksader. 2018. The influence of macroeconomic factors on the Russian stock market: A sectoral approach. Today and Tomorrow of the Russian Economy 91–92: 87–97. [Google Scholar] [CrossRef]
- Sorochaikin, Igor, and Aleksandra Sorochaikina. 2020. The nature of the stock market. Economy, Governance and Lave Basis 3: 28–34. [Google Scholar] [CrossRef]
- Vorobyov, Yuri. 2017a. Stock market of the Russian Federation: State and prospects. Scientific Bulletin: Finance, Banks, Investments 1: 111–26. [Google Scholar]
- Vorobyov, Yuri. 2017b. The role of the stock market of the Russian Federation in the financial support of the economy. Scientific Bulletin: Finance, Banks, Investments 2: 80–89. [Google Scholar]
- Wen, Xiaoqian, Yu Wei, and Dengshi Huang. 2012. Measuring contagion between energy market and stock market during financial crisis: A copula approach. Energy Economics 34: 1435–46. [Google Scholar] [CrossRef]
- Yang, Jiang, Cheng Hsiao, Quaing Li, and Zijun Wang. 2006. The emerging market crisis and stock market linkages: Further evidence. Journal of Applied Econometrics 21: 727–44. [Google Scholar] [CrossRef]
- Yashchenko, Elena. 2020. Problems and prospects of integration of the Russian stock market into the world securities market. Modern Economy Success 3: 200–6. [Google Scholar]
- Zhao, Longfeng, Wei Li, and Xu Cai. 2016. Structure and dynamics of stock market in times of crisis. Physics Letters A 380: 654–66. [Google Scholar] [CrossRef]
| Publisher’s Note: MDPI stays neutral with regard to jurisdictional claims in published maps and institutional affiliations. |
© 2021 by the authors. Licensee MDPI, Basel, Switzerland. This article is an open access article distributed under the terms and conditions of the Creative Commons Attribution (CC BY) license (https://creativecommons.org/licenses/by/4.0/).


 ,
, 

