
Predictability of the Realised Volatility of International Stock Markets Amid Uncertainty Related to Infectious Diseases


Abstract
:1. Introduction
2. Data and Methodology
2.1. Data
2.2. Methodology: Heterogeneous Autoregressive Realised Variance (HAR-RV) Model
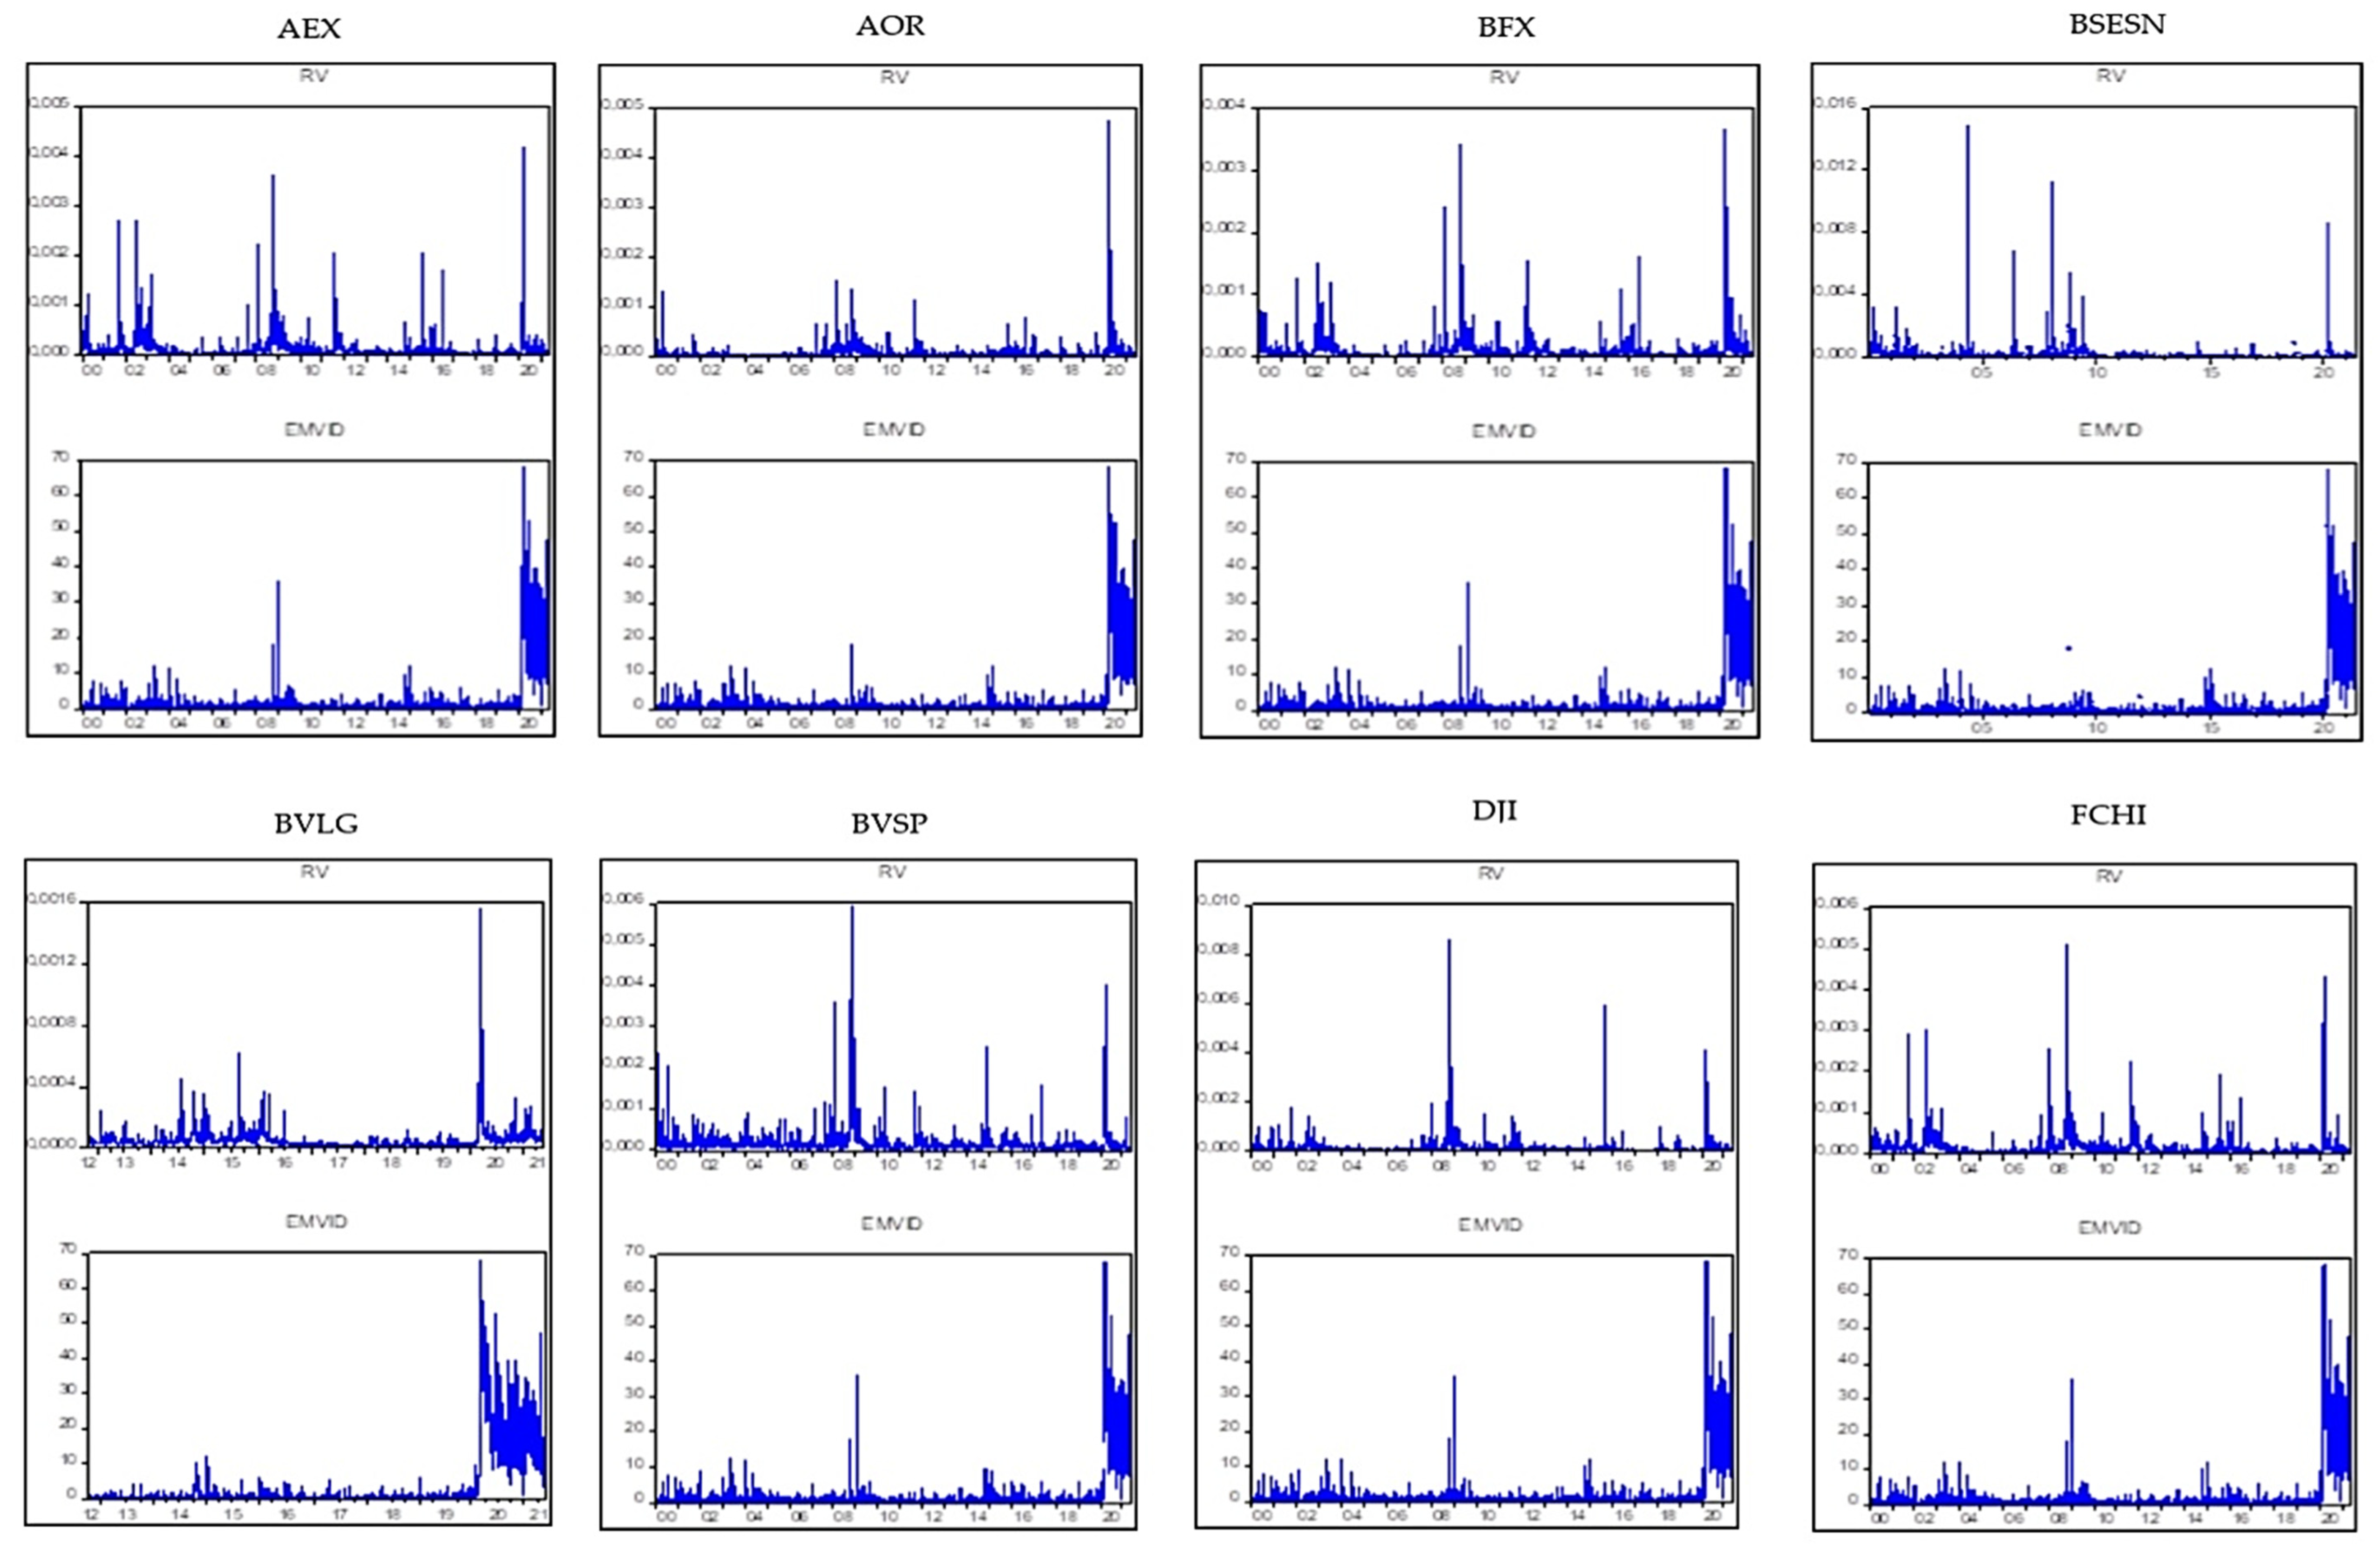
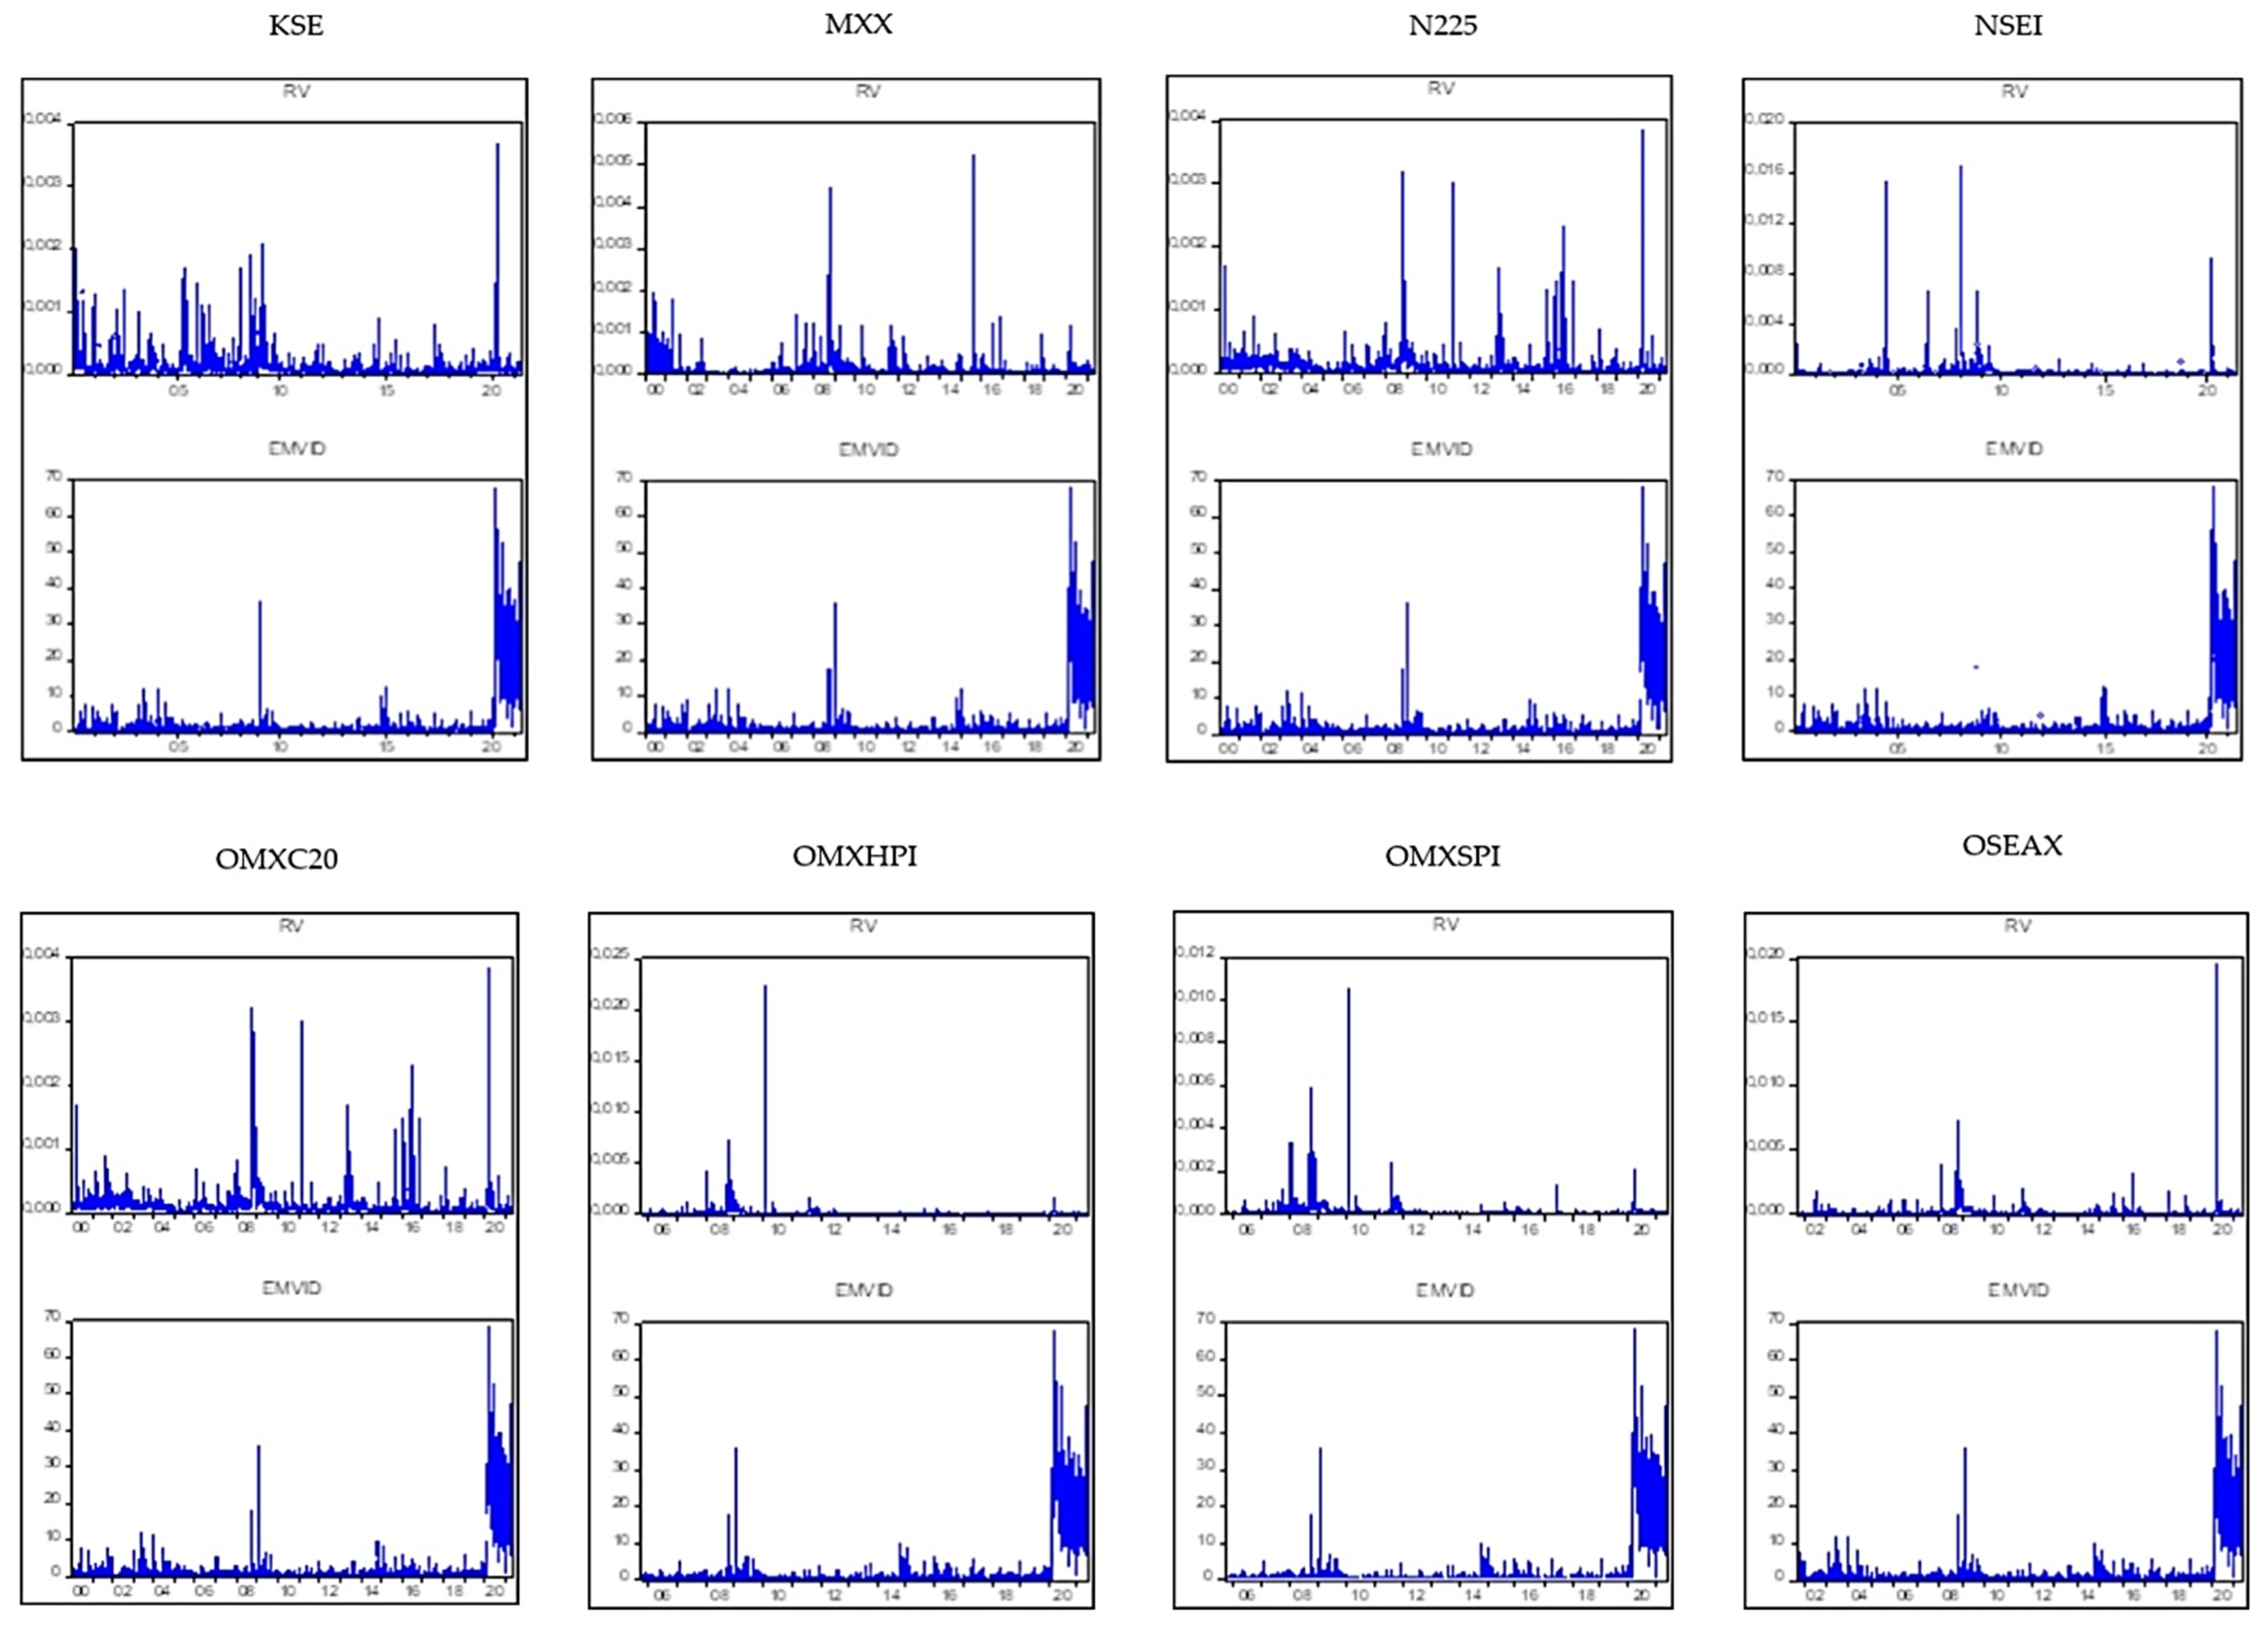
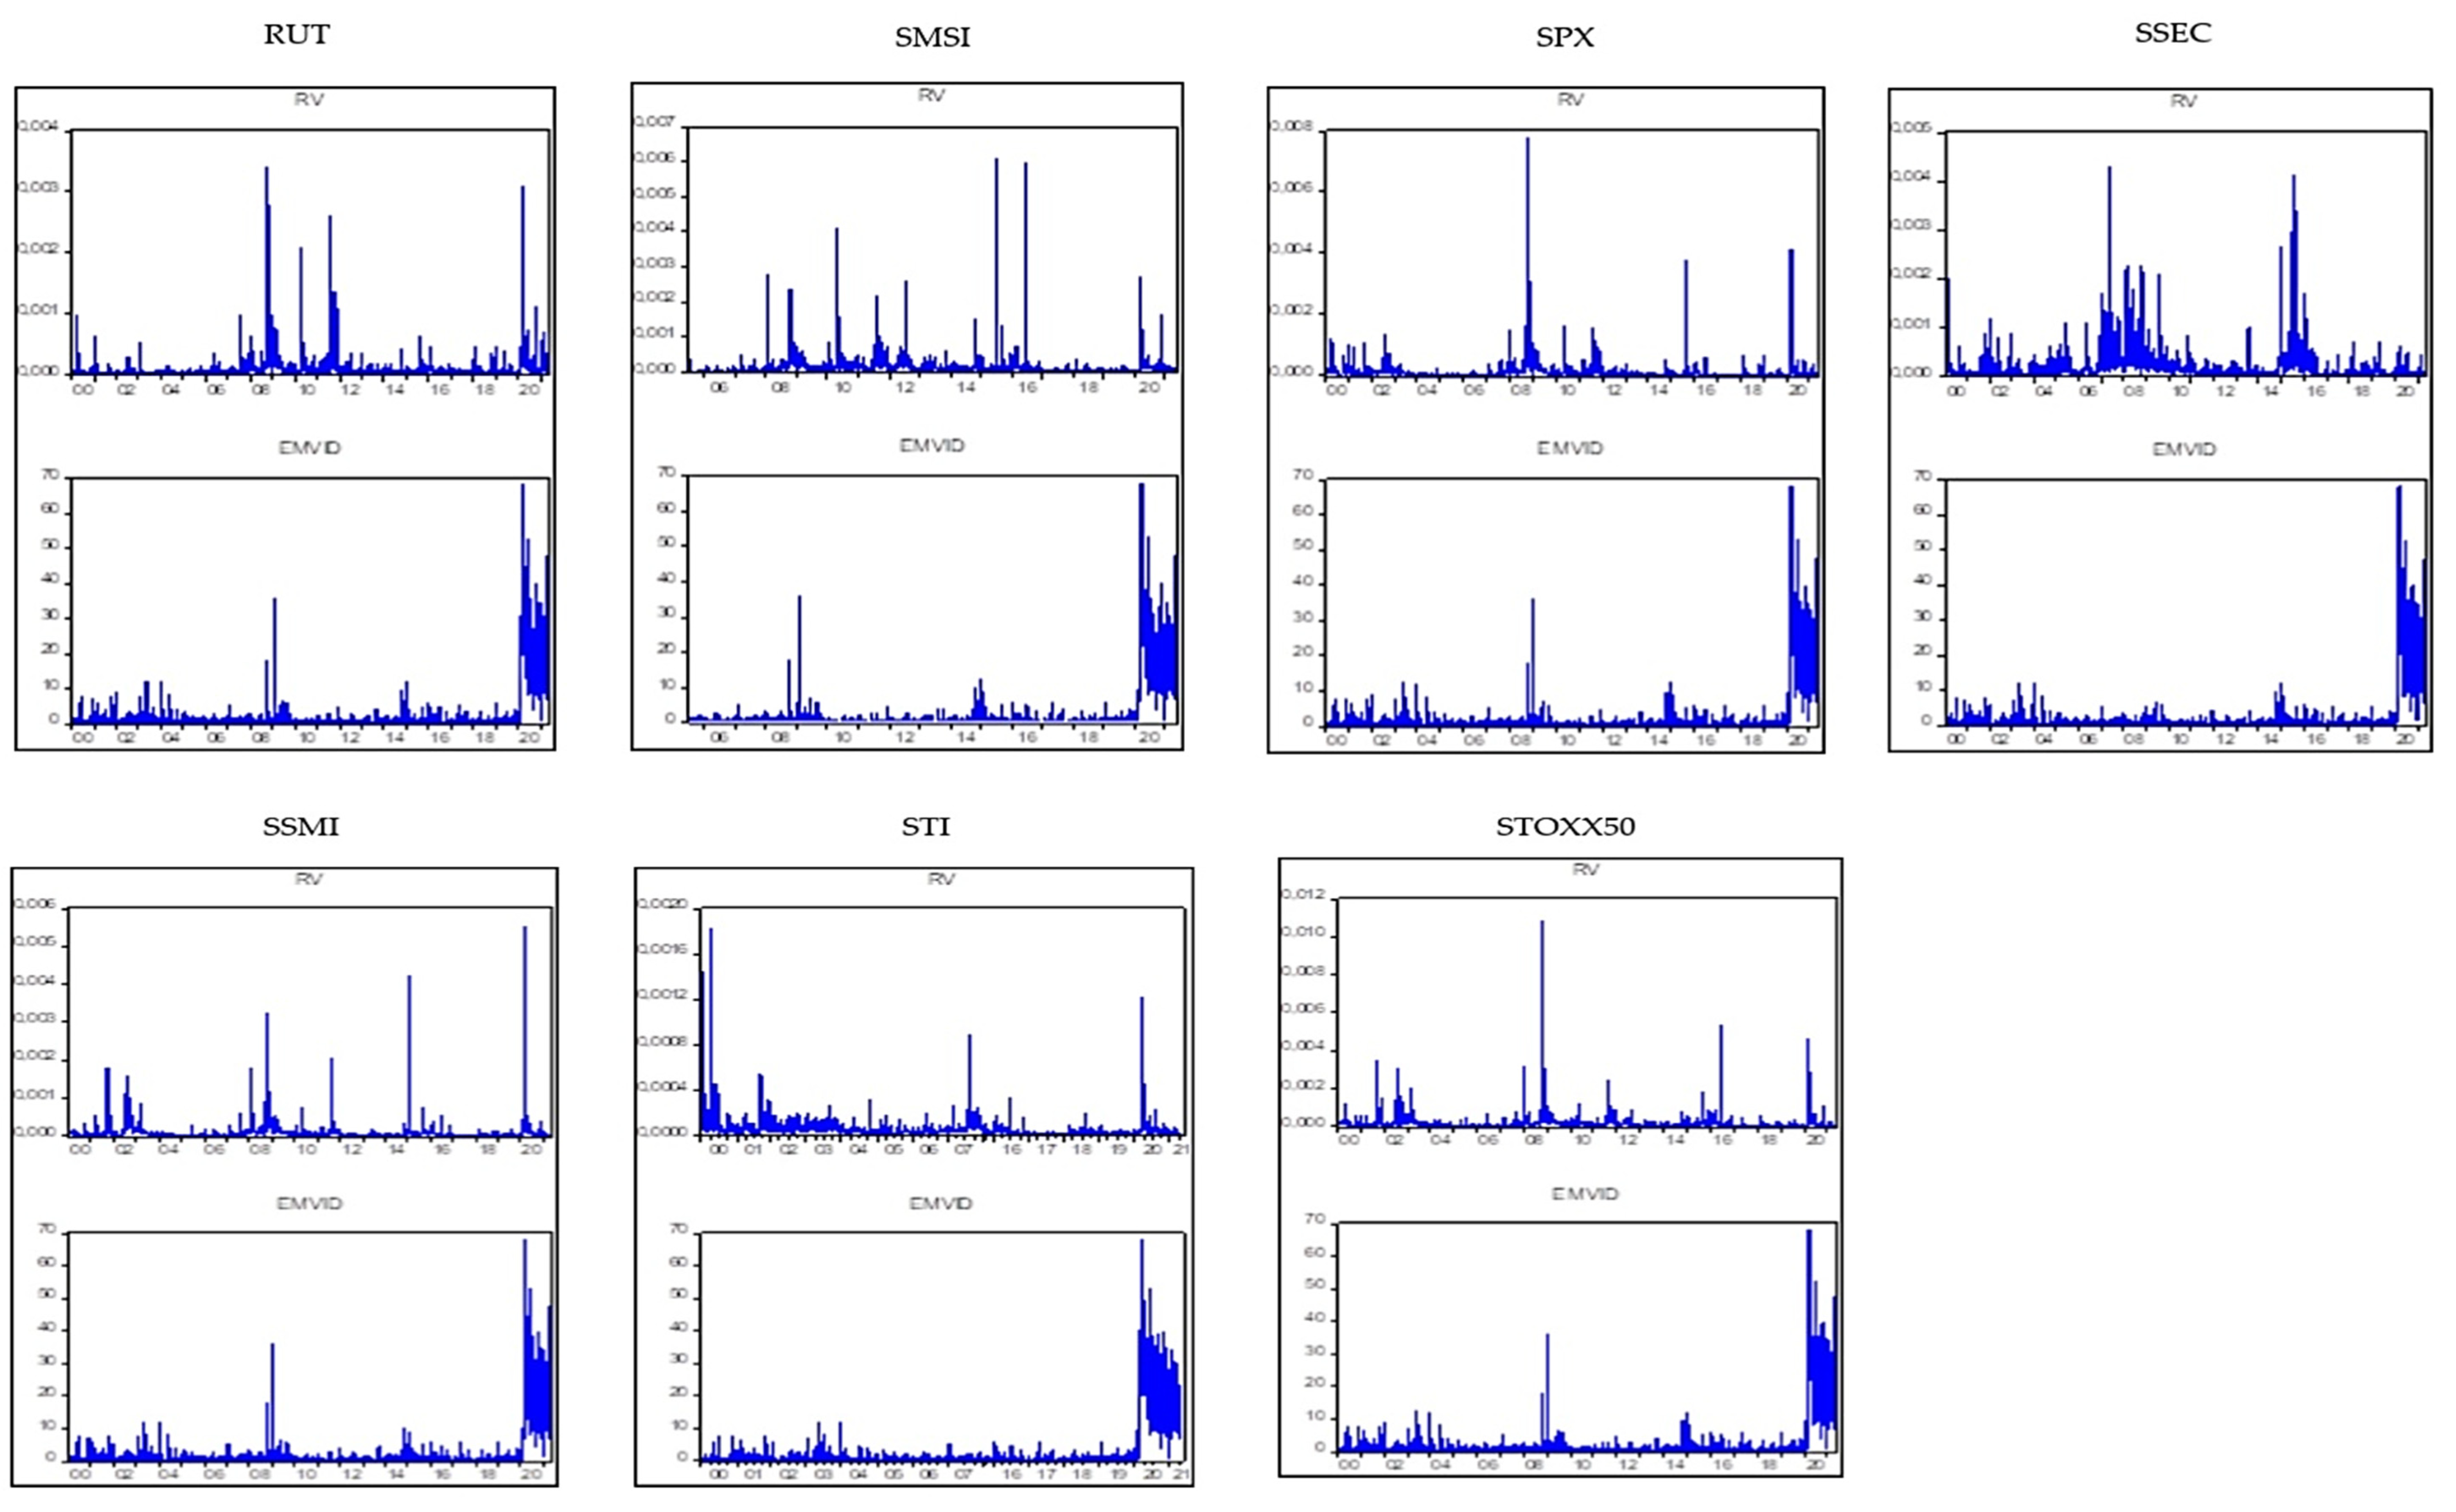
3. Empirical Results
4. Discussion of the Results
5. Conclusions
Author Contributions
Funding
Institutional Review Board Statement
Informed Consent Statement
Data Availability Statement
Conflicts of Interest
Appendix A

| Symbol | Name | City, Country |
|---|---|---|
| Europe | ||
| 1. AEX | Amsterdam Exchange index | Amsterdam, Netherlands |
| 2. BFX | Bell 20 Index | Brussel, Belgium |
| 3. BVLG | PSI All-Share Index | Lisbon, Portugal |
| 4. FCHI | CAC 40 | Paris, France |
| 5. FTMIB | FTSE MIB | Milan, Italia |
| 6. FTSE | FTSE 100 | London, United Kingdom |
| 7. GDAXI | DAX | Frankfurt, Germany |
| 8. IBEX | IBEX 35 Index | Madrid, Spain |
| 9. OMXC20 | OMX Copenhagen 20 Index | Copenhagen, Denmark |
| 10. OMXHPI | OMX Helsinki All Share Index | Helsinki, France |
| 11. OMXSPI | OMX Stockholm All Share Index | Stockholm, Sweden |
| 12. OSEAX | Oslo Exchange All-share Index | Oslo, Norway |
| 13. SMSI | Madrid General Index | Madrid, Spain |
| 14. SSMI | Swiss Stock Market Index | Zurich, Switzerland |
| 15. STOXX50E | EURO STOXX 50 | Eschborn, Germany |
| Asia | ||
| 16. BSESN | S&P BSE Sensex | Bombay, India |
| 17. HSI | HANG SENG Index | Hong Kong, China |
| 18. KS11 | Korea Composite Stock Price Index (KOSPI) | Seaul, South Korea |
| 19. KSE | Karachi SE 100 Index | Karachi, Paristan |
| 20. N225 | Nikkei 225 | Tokyo, Japan |
| 21. NSEI | NIFTY 50 | Mumbai, Maharashtra, India |
| 22. SSEC | Shanghai Composite Index | Shanghai, China |
| 23. STI | Straits Times Index | Shenton Way, Singapore |
| North America | ||
| 24. DJI | Dow Jones Industrial Average | New York, United State |
| 25. GSPTSE | S&P/TSX Composite index | Toronto, Canada |
| 26. IXIC | Nasdaq 100 | New York, United State |
| 27. MXX | IPC Mexico | Mexico City, Mexico |
| 28. RUT | Russel 2000 | New York, United State |
| 29. SPX | S&P 500 Index | New York, United State |
| South America | ||
| 30. BVSP | BVSP BOVESPA Index | Rio de Janeiro, Brazil |
| Australia | ||
| 31. AORD | All Ordinaries | Sydney, Australia |

| h | RMSE0 | RMSEE 1 | FGs | RMSE0 | RMSEE 1 | FGs |
|---|---|---|---|---|---|---|
| Europe | ||||||
| Panel 1: AEX: 3/16/2020 | Panel 2: BFX: 3/16/2020 | |||||
| 1 | 1.9360 | 1.9505 | −0.7438 | 2.1234 | 2.1210 | 0.1135 |
| 5 | 0.6168 | 0.6193 | −0.4034 | 0.5541 | 0.5545 | −0.0853 |
| 22 | 0.1865 | 0.1867 | −0.0691 | 0.1618 | 0.1615 | 0.2155 |
| Panel 3: BVLG: 3/18/2020 | Panel 4: FCHI: 3/16/2020 | |||||
| 1 | 0.6593 | 0.6572 | 0.3162 | 2.4805 | 2.4790 | 0.0597 |
| 5 | 0.1838 | 0.1839 | −0.0625 | 0.6902 | 0.6899 | 0.0406 |
| 22 | 0.0660 | 0.0654 | 0.9168 | 0.1916 | 0.1913 | 0.1490 |
| Panel 5: FTMIB: 3/16/2020 | Panel 6: FTSE: 3/16/2020 | |||||
| 1 | 1.0847 | 1.0839 | 0.0824 | 1.7204 | 1.7216 | −0.0692 |
| 5 | 0.3324 | 0.3326 | −0.0532 | 0.6743 | 0.6712 | 0.4635 |
| 22 | 2.4875 | 2.4842 | 0.1301 | 0.2173 | 0.2168 | 0.2048 |
| Panel 7: GDAX1: 3/16/2020 | Panel 8: IBEX: 3/18/2020 | |||||
| 1 | 1.6569 | 1.6574 | −0.0350 | 1.6970 | 1.6990 | −0.1178 |
| 5 | 0.4315 | 0.4322 | −0.1485 | 0.5262 | 0.5269 | −0.1329 |
| 22 | 0.1357 | 0.1355 | 0.2045 | 0.1713 | 0.1713 | 0.0012 |
| Panel 9: OMXC20: 3/18/2020 | Panel 10: OMXHPI: 3/16/2020 | |||||
| 1 | 1.1987 | 1.1988 | −0.0105 | 0.8285 | 0.8291 | −0.0776 |
| 5 | 0.2935 | 0.2939 | −0.1337 | 0.2196 | 0.2200 | −0.2041 |
| 22 | 0.1009 | 0.1008 | 0.1478 | 0.0706 | 0.0703 | 0.5281 |
| Panel 11: OMXSPI: 3/17/2020 | Panel 12: OSEAX: 3/11/2020 | |||||
| 1 | 0.8960 | 0.8957 | 0.0394 | 2.6408 | 2.7287 | −3.2222 |
| 5 | 0.2071 | 0.2071 | −0.0092 | 2.0396 | 2.0436 | −0.1945 |
| 22 | 0.0814 | 0.0811 | 0.2996 | 0.5292 | 0.5297 | −0.0831 |
| Panel 13: SMSI: 3/16/2020 | Panel 14: SSMI: 3/17/2020 | |||||
| 1 | 1.4601 | 1.4571 | 0.2040 | 1.8434 | 1.8452 | −0.0942 |
| 5 | 0.3939 | 0.3938 | 0.0422 | 0.5770 | 0.5786 | −0.2798 |
| 22 | 0.1312 | 0.1310 | 0.1557 | 0.2138 | 0.2129 | 0.4335 |
| Panel 15: STOXX50E: 3/16/2020 | ||||||
| 1 | 2.1622 | 2.1663 | −0.1882 | |||
| 5 | 0.5424 | 0.5441 | −0.3121 | |||
| 22 | 0.2152 | 0.2141 | 0.5133 | |||
| Asia | ||||||
| Panel 16: BSESN: 6/16/2004 | Panel 17: HIS: 3/17/2020 | |||||
| 1 | 1.5849 | 1.6314 | −2.8460 | 0.5010 | 0.5184 | −3.3552 |
| 5 | 0.9199 | 0.9189 | 0.1121 | 0.2843 | 0.2839 | 0.1406 |
| 22 | 0.2426 | 0.2427 | −0.0387 | 0.0665 | 0.0668 | −0.4584 |
| Panel 18: KS11: 3/17/2020 | Panel 19: KSE: 3/16/2020 | |||||
| 1 | 1.4359 | 1.4280 | 0.5490 | 2.2063 | 2.1875 | 0.8595 |
| 5 | 0.4078 | 0.4017 | 1.5029 | 0.6173 | 0.6116 | 0.9344 |
| 22 | 0.1037 | 0.1035 | 0.1082 | 0.1541 | 0.1539 | 0.1410 |
| Panel 20: N225: 3/18/2020 | Panel 21: NSEI: 3/17/2020 | |||||
| 1 | 0.8578 | 0.8597 | −0.2159 | 1.6255 | 1.6764 | −3.0350 |
| 5 | 0.3704 | 0.3722 | −0.4707 | 0.9785 | 0.9769 | 0.1570 |
| 22 | 0.1205 | 0.1207 | −0.1459 | 0.2558 | 0.2564 | −0.2297 |
| Panel 22: SSEC: 3/18/2020 | Panel 23: STI: 3/16/2020 | |||||
| 1 | 0.5192 | 0.5222 | −0.5686 | 0.5072 | 0.5045 | 0.5404 |
| 5 | 0.1389 | 0.1394 | −0.3243 | 0.1697 | 0.1688 | 0.5718 |
| 22 | 0.0400 | 0.0400 | −0.0350 | 0.0456 | 0.0456 | 0.0153 |
| North America | ||||||
| Panel 24: DJI: 3/16/2020 | Panel 25: GSPTSE: 3/17/2020 | |||||
| 1 | 1.8333 | 1.8403 | −0.3792 | 0.6681 | 0.6831 | −2.1965 |
| 5 | 0.4916 | 0.4932 | −0.3256 | 0.3700 | 0.3716 | −0.4322 |
| 22 | 0.1832 | 0.1826 | 0.3675 | 0.1108 | 0.1105 | 0.3033 |
| Panel 26: IXIC: 3/18/2020 | Panel 27: MXX: 3/18/2020 | |||||
| 1 | 1.3779 | 1.3990 | −1.5101 | 0.5697 | 0.5700 | −0.0575 |
| 5 | 0.5258 | 0.5279 | −0.4052 | 0.1697 | 0.1697 | −0.0471 |
| 22 | 0.1631 | 0.1626 | 0.3014 | 0.0441 | 0.0442 | −0.2601 |
| Panel 28: RUT: 3/17/2020 | Panel 29: SPX: 3/16/2020 | |||||
| 1 | 1.8075 | 1.8110 | −0.1880 | 1.8732 | 1.8788 | −0.2985 |
| 5 | 0.5059 | 0.5058 | 0.0263 | 0.5181 | 0.5190 | −0.1746 |
| 22 | 0.1644 | 0.1627 | 1.0222 *** | 0.1824 | 0.1820 | 0.2539 |
| South America | Australia | |||||
| Panel 30: BVSP: 3/10/2020 | Panel 31: AORD: 3/17/2020 | |||||
| 1 | 2.3643 | 2.3499 | 0.6146 | 2.6429 | 2.6307 | 0.4641 |
| 5 | 0.6400 | 0.6367 | 0.5303 | 0.6724 | 0.6694 | 0.4553 |
| 22 | 0.2010 | 0.2011 | −0.0055 | 0.2126 | 0.2126 | 0.0075 |
| EUROPE | |
| VSTOXX VOLATILITY INDEX | EU |
| VDAX-NEW VOLATILITY INDEX | GERMANY |
| VSMI VOLATILITY INDEX | SWISS |
| ASIA | |
| HSI VOLATILITY INDEX | HONG KONG |
| INDIA VOLATILITY INDEX | INDIA |
| VKOSPI VOLATILITY INDEX | KOREA |
| CBOE CHINA ETF VOLATILITY INDEX | CHINA |
| NIKKEI STOCK AVERAGE VOLATILITY INDEX | JAPAN |
| NORTH AMERICA | |
| CBOE SPX VOLATILITY VIX (NEW) | USA |
| S&P/TSX COMPOSITE LOW VOLATILITY | CANADA |
| AUSTRILIA | |
| S&P/ASX 200 VOLATILITY INDEX | AUSTRILIA |
| SOUTH AMERICA | |
| CBOE BRAZIL ETF VOLATILITY INDEX | BRAZIL |
| AFRICA | |
| SOUTH AFRICA VOLATILITY INDEX | SOUTH AFRICA |
| EUROPE | |||
| RMSE0 | RMSEE 1 | FGs | |
| Panel 1: VSTOXX VOLATILITY INDEX | |||
| h = 1 | 1.7999 | 1.6686 | 7.8705 |
| h = 5 | 0.4366 | 0.4293 | 1.7119 |
| h = 22 | 0.1735 | 0.1330 | 30.4683 |
| Panel 2: VDAX-NEW VOLATILITY INDEX | |||
| h = 1 | 2.9079 | 2.0593 | 41.2069 |
| h = 5 | 0.5717 | 0.5126 | 11.5170 |
| h = 22 | 0.2712 | 0.2159 | 25.6034 |
| Panel 3: VSMI VOLATILITY INDEX | |||
| h = 1 | 2.0768 | 1.6741 | 24.0544 |
| h = 5 | 0.4200 | 0.4204 | −0.1066 |
| h = 22 | 0.2076 | 0.1870 | 11.0462 |
| ASIA | |||
| Panel 4: HSI VOLATILITY INDEX | |||
| h = 1 | 1.8673 | 1.8127 | 3.0174 |
| h = 5 | 0.4847 | 0.4517 | 7.2982 |
| h = 22 | 0.1889 | 0.1673 | 12.8981 |
| Panel 5: INDIA VOLATILITY INDEX | |||
| h = 1 | 1.5582 | 1.5562 | 0.1331 |
| h = 5 | 0.4077 | 0.3992 | 2.1224 |
| h = 22 | 0.1879 | 0.1879 | −0.0218 |
| Panel 6: VKOSPI VOLATILITY INDEX | |||
| h = 1 | 2.2884 | 1.8664 | 22.6129 |
| h = 5 | 0.6329 | 0.4665 | 35.6702 |
| h = 22 | 0.1999 | 0.1858 | 7.5766 |
| Panel 7: CBOE CHINA ETF VOLATILITY INDEX | |||
| h = 1 | 2.7090 | 2.7104 | −0.0524 |
| h = 5 | 0.8047 | 0.7594 | 5.9612 |
| h = 22 | 0.2272 | 0.2105 | 7.9264 |
| Panel 8: NIKKEI STOCK AVERAGE VOLATILITY INDEX | |||
| h = 1 | 1.8115 | 1.7283 | 4.8149 |
| h = 5 | 0.4289 | 0.4025 | 6.5451 |
| h = 22 | 0.2105 | 0.1588 | 32.5444 |
| NORTH AMERICA | |||
| Panel 9: CBOE SPX VOLATILITY VIX (NEW) | |||
| h = 1 | 2.4810 | 2.4959 | −0.5952 |
| h = 5 | 0.6034 | 0.6030 | 0.0721 |
| h = 22 | 0.2605 | 0.2270 | 14.7473 |
| Panel 10: S&P/TSX COMPOSITE LOW VOLATILITY | |||
| h = 1 | 4.8002 | 4.6895 | 2.3597 |
| h = 5 | 1.2127 | 1.1976 | 1.2536 |
| h = 22 | 0.4849 | 0.4843 | 0.1334 |
| AUSTRILIA | |||
| Panel 11: S&P/ASX 200 VOLATILITY INDEX | |||
| h = 1 | 1.7999 | 1.6686 | 7.8705 |
| h = 5 | 0.4366 | 0.4293 | 1.7119 |
| h = 22 | 0.1735 | 0.1330 | 30.4683 |
| SOUTH AMERICA | |||
| Panel 12: CBOE BRAZIL ETF VOLATILITY INDEX | |||
| h = 1 | 3.3812 | 3.3574 | 0.7070 |
| h = 5 | 0.8698 | 0.8543 | 1.8186 |
| h = 22 | 0.3665 | 0.3673 | −0.2164 |
| AFRICA | |||
| Panel 13: SOUTH AFRICA VOLATILITY INDEX | |||
| h = 1 | 1.1539 | 1.1568 | −0.2519 |
| h = 5 | 0.2886 | 0.2876 | 0.3320 |
| h = 22 | 0.1140 | 0.1149 | −0.7554 |
| 1 | The critical values at 10%, 5% and 1% are 3.951, 1.548 and 0.616. |
| 2 | It is worth noting that at 5% level of significance several stock markets index in our analysis are statistically significant except for the GDAX1, GSPTSE, HIS, BSESN, OMXHPI, OSEAX, SPX and SSEC. |
| 3 | Also, this is the phase where the vaccination programmes rollout were implemented. |
| 4 | The critical values at 10%, 5% and 1% are 3.811, 1.583 and 0.693. |
| 5 | Based on the suggestion of any anonymous referee, we also conducted a similar analysis involving the forecastability of the available implied volatility indices of various countries, as listed in Table A3. As can be seen from the forecasting results reported in Table A4, using the same set-up as in Table A2, COVID-19 related uncertainty tend to produce higher forecasting gains for the implied volatilities of developed rather than emerging equity markets. |
References
- Al-Awadhi, Abdullah M., Khaled Alsaifi, Ahmad Al-Awadhi, and Salah Alhammadi. 2020. Death and contagious infectious diseases: Impact of the COVID-19 virus on stock market returns. Journal of Behavioral and Experimental Finance 27: 100326. [Google Scholar] [CrossRef]
- Ashraf, Badar Nadeem. 2021. Stock markets’ reaction to COVID-19: Moderating role of national culture. Finance Research Letters 41: 101857. [Google Scholar] [CrossRef]
- Bai, Jushan, and Pierre Perron. 2003. Computation and analysis of multiple structural change models. Journal of Applied Econometrics 18: 1–22. [Google Scholar] [CrossRef] [Green Version]
- Baker, Scott R., Nicholas Bloom, Steven J. Davis, and Stephen J. Terry. 2020a. COVID-Induced Economic Uncertainty; National Bureau of Economic Research No. w26983. Cambridge: National Bureau of Economic Research.
- Baker, Scott R., Nicholas Bloom, Steven J. Davis, Kyle J. Kost, Marco C. Sammon, and Tasaneeya Viratyosin. 2020b. The Unprecedented Stock Market Impact of COVID-19; National Bureau of Economic Research No. w26945. Cambridge: National Bureau of Economic Research. [CrossRef]
- Boubaker, Heni, Juncal Cunado, Luis A. Gil-Alana, and Rangan Gupta. 2020. Global crises and gold as a safe haven: Evidence from over seven and a half centuries of data. Physica A: Statistical Mechanics and Its Applications 540: 123093. [Google Scholar] [CrossRef] [Green Version]
- Bouri, Elie, Riza Demirer, Rangan Gupta, and Christian Pierdzioch. 2020. Infectious Diseases, Market Uncertainty and Oil Market Volatility. Energies 13: 4090. [Google Scholar] [CrossRef]
- Campbell, John Y. 2008. Estimating the equity premium. Canadian Journal of Economics/Revue Canadienne D’économique 41: 1–21. [Google Scholar] [CrossRef] [Green Version]
- Chen, Yufeng, Wenqi Li, and Fang Qu. 2019. Dynamic asymmetric spillovers and volatility interdependence on China’s stock market. Physica A: Statistical Mechanics and Its Applications 523: 825–38. [Google Scholar] [CrossRef]
- Corsi, Fulvio. 2009. A Simple Approximate Long-Memory Model of Realized Volatility. Journal of Financial Econometrics 7: 174–96. [Google Scholar] [CrossRef]
- Cunado, Juncal, David Gabauer, and Rangan Gupta. 2021. Realized Volatility Spillovers between Energy and Metal Markets: A Time-Varying Connectedness Approach. University of Pretoria, Departament of Economics Working Paper Series. Pretoria: University of Pretoria. [Google Scholar]
- Gao, Xue, Yixin Ren, and Muhammad Umar. 2021. To what extent does COVID-19 drive stock market volatility? A comparison between the U.S. and China. Economic Research-Ekonomska Istraživanja, 1–21. [Google Scholar] [CrossRef]
- Gupta, Rangan, Sowmya Subramaniam, Elie Bouri, and Qiang Ji. 2021. Infectious disease-related uncertainty and the safe-haven characteristic of US treasury securities. International Review of Economics & Finance 71: 289–98. [Google Scholar] [CrossRef]
- Harjoto, Maretno Agus, Fabrizio Rossi, and John K. Paglia. 2021. COVID-19: Stock market reactions to the shock and the stimulus. Applied Economics Letters 28: 795–801. [Google Scholar] [CrossRef]
- Kang, Sang Hoon, Ron McIver, and Seong-Min Yoon. 2017. Dynamic spillover effects among crude oil, precious metal, and agricultural commodity futures markets. Energy Economics 62: 19–32. [Google Scholar] [CrossRef]
- Khan, Karamat, Huawei Zhao, Han Zhang, Huilin Yang, Muhammad Haroon Shah, and Atif Jahanger. 2020. The Impact of COVID-19 Pandemic on Stock Markets: An Empirical Analysis of World Major Stock Indices. The Journal of Asian Finance, Economics and Business 7: 463–74. [Google Scholar] [CrossRef]
- Kinateder, Harald, Ross Campbell, and Tonmoy Choudhury. 2021. Safe haven in GFC versus COVID-19: 100 turbulent days in the financial markets. Finance Research Letters 43: 101951. [Google Scholar] [CrossRef]
- Kizys, Renatas, Panagiotis Tzouvanas, and Michael Donadelli. 2021. From COVID-19 herd immunity to investor herding in international stock markets: The role of government and regulatory restrictions. International Review of Financial Analysis 74: 101663. [Google Scholar] [CrossRef]
- Kopyl, Kateryna Anatoliyevna, and John Byong-Tek Lee. 2016. How safe are the safe haven assets? Financial Markets and Portfolio Management 30: 453–82. [Google Scholar] [CrossRef]
- Liu, Yuntong, Yu Wei, Qian Wang, and Yi Liu. 2021. International stock market risk contagion during the COVID-19 pandemic. Finance Research Letters, 102145. [Google Scholar] [CrossRef]
- Lyócsa, Štefan, and Peter Molnár. 2020. Stock market oscillations during the corona crash: The role of fear and uncertainty. Finance Research Letters 36: 101707. [Google Scholar] [CrossRef]
- Lyócsa, Štefan, Eduard Baumöhl, Tomáš Výrost, and Peter Molnár. 2020. Fear of the coronavirus and the stock markets. Finance Research Letters 36: 101735. [Google Scholar] [CrossRef]
- Mazur, Mieszko, Man Dang, and Miguel Vega. 2021. COVID-19 and the march 2020 stock market crash. Evidence from S&P1500. Finance Research Letters 38: 101690. [Google Scholar] [CrossRef]
- McCracken, Michael W. 2007. Asymptotics for out of sample tests of Granger causality. Journal of Econometrics 140: 719–52. [Google Scholar] [CrossRef]
- Müller, Ulrich A., Michel M. Dacorogna, Rakhal D. Davé, Richard B. Olsen, Olivier V. Pictet, and Jacob E. Von Weizsäcker. 1997. Volatilities of different time resolutions—Analyzing the dynamics of market components. Journal of Empirical Finance 4: 213–39. [Google Scholar] [CrossRef]
- Poon, Ser-Huang, and Clive W. J. Granger. 2003. Forecasting volatility in financial markets: A review. Journal of Economic Literature 41: 478–539. [Google Scholar] [CrossRef]
- Shiba, Sisa, and Rangan Gupta. 2021. Uncertainty related to infectious diseases and forecastability of the realized volatility of us treasury securities. Annals of Financial Economics 16: 2150008. [Google Scholar] [CrossRef]
- Wang, Xinya, Huifang Liu, Shupei Huang, and Brian Lucey. 2019. Identifying the multiscale financial contagion in precious metal markets. International Review of Financial Analysis 63: 209–19. [Google Scholar] [CrossRef]
- Wang, Jiqian, Xinjie Lu, Feng He, and Feng Ma. 2020. Which popular predictor is more useful to forecast international stock markets during the coronavirus pandemic: VIX vs. EPU? International Review of Financial Analysis 72: 101596. [Google Scholar] [CrossRef]
- Zaremba, Adam, Renatas Kizys, David Y. Aharon, and Ender Demir. 2020. Infected Markets: Novel Coronavirus, Government Interventions, and Stock Return Volatility around the Globe. Finance Research Letters 35: 101597. [Google Scholar] [CrossRef]
- Zaremba, Adam, Renatas Kizys, Panagiotis Tzouvanas, David Y. Aharon, and Ender Demir. 2021. The quest for multidimensional financial immunity to the COVID-19 pandemic: Evidence from international stock markets. Journal of International Financial Markets, Institutions and Money 71: 101284. [Google Scholar] [CrossRef]
- Zhang, Yue-Jun, and Yi-Ming Wei. 2010. The crude oil market and the gold market: Evidence for cointegration, causality and price discovery. Resources Policy 35: 168–77. [Google Scholar] [CrossRef]
- Zhang, Dayong, Min Hu, and Qiang Ji. 2020. Financial markets under the global pandemic of COVID-19. Finance Research Letters 36: 101528. [Google Scholar] [CrossRef] [PubMed]
- Zhang, Ning, Aiqun Wang, Naveed-Ul Haq, and Safia Nosheen. 2021. The impact of COVID-19 shocks on the volatility of stock markets in technologically advanced countries. Economic Research-Ekonomska Istraživanja, 1–26. [Google Scholar] [CrossRef]
| Continent | |||||
|---|---|---|---|---|---|
| Structural Breakpoints | Europe | Asia | North America | South America | Australia |
| 2002 | STI | ||||
| 2003 | AEX, BFX, FCHI, GDAX1, IBEX and STOXX50E | N225 and SSEC | DJI, IXIC, MXX, RUT and SPX | AORD | |
| 2004 | FTSE and SSMI | BSESN, HIS, KS11 and NSEI | BVSP | ||
| 2005 | OSEAX | KSE | GSPTSE | ||
| 2007 | SMSI | ||||
| 2008 | OMXC20, OMXHPI and OMXSPI | ||||
| 2011 | FTMIB | ||||
| 2014 | BVLG | ||||
| Horizon | RMSE0 | RMSEE 1 | FGs | RMSE0 | RMSEE 1 | FGs |
|---|---|---|---|---|---|---|
| Europe | ||||||
| Panel 1: AEX. 8/05/2003 | Panel 2: BFX. 7/04/2003 | |||||
| 1 | 1.3045 | 1.3038 | 0.0571 *** | 1.1004 | 1.0985 | 0.1751 *** |
| 5 | 0.3400 | 0.3398 | 0.0412 | 0.2957 | 0.2955 | 0.0805 *** |
| 22 | 0.0886 | 0.0886 | 0.0406 | 0.0741 | 0.0741 | 0.0108 |
| Panel 3: BVLG. 5/23/2014 | Panel 4: FCHI. 8/05/2003 | |||||
| 1 | 0.5028 | 0.5012 | 0.3110 *** | 1.5860 | 1.5852 | 0.0510 *** |
| 5 | 0.1272 | 0.1270 | 0.1456 *** | 0.4106 | 0.4105 | 0.0244 |
| 22 | 0.0363 | 0.0363 | 0.1020 | 0.1049 | 0.1049 | 0.0124 |
| Panel 5: FTMIB. 9/07/2011 | Panel 6: FTSE. 6/16/2004 | |||||
| 1 | 1.0066 | 1.0061 | 0.0562 | 2.3748 | 2.3740 | 0.0337 |
| 5 | 0.2611 | 0.2611 | 0.0069 | 0.6379 | 0.6376 | 0.0453 *** |
| 22 | 1.5762 | 1.5746 | 0.1050 *** | 0.1544 | 0.1544 | 0.0071 |
| Panel 7: GDAX1. 11/27/2003 | Panel 8: IBEX. 5/14/2003 | |||||
| 1 | 1.6491 | 1.6488 | 0.0169 | 1.6762 | 1.6756 | 0.0367 |
| 5 | 0.4298 | 0.4297 | 0.0014 | 0.4403 | 0.4403 | 0.0191 |
| 22 | 0.1123 | 0.1122 | 0.0134 | 0.1129 | 0.1128 | 0.0346 |
| Panel 9: OMXC20. 10/15/2008 | Panel 10: OMXHPI. 10/17/2008 | |||||
| 1 | 2.9683 | 2.9674 | 0.0291 | 4.2473 | 4.2464 | 0.0214 |
| 5 | 0.8047 | 0.8046 | 0.0211 | 1.1248 | 1.1246 | 0.0179 |
| 22 | 0.2017 | 0.2016 | 0.0198 | 0.2787 | 0.2787 | 0.0165 |
| Panel 11: OMXSPI. 10/02/2008 | Panel 12: OSEAX. 10/06/2005 | |||||
| 1 | 2.5614 | 2.5610 | 0.0158 | 3.7652 | 3.7651 | 0.0007 |
| 5 | 0.5640 | 0.5640 | 0.0080 | 0.9853 | 0.9853 | 0.0036 |
| 22 | 0.1646 | 0.1646 | 0.0158 | 0.2398 | 0.2398 | 0.0142 |
| Panel 13: SMSI. 12/17/2007 | Panel 14: SSMI. 3/29/2004 | |||||
| 1 | 2.1409 | 2.1398 | 0.0491 | 1.4816 | 1.4812 | 0.0238 |
| 5 | 0.5566 | 0.5564 | 0.0259 | 0.3832 | 0.3830 | 0.0368 |
| 22 | 0.1392 | 0.1391 | 0.0374 | 0.0988 | 0.0988 | 0.0051 |
| Panel 15: STOXX50E. 8/07/2003 | ||||||
| 1 | 2.4806 | 2.4795 | 0.0454 *** | |||
| 5 | 0.6680 | 0.6677 | 0.0368 | |||
| 22 | 0.1606 | 0.1606 | 0.0062 | |||
| Asia | ||||||
| Panel 16: BSESN. 6/16/2004 | Panel 17: HIS. 11/09/2004 | |||||
| 1 | 2.8070 | 2.8047 | 0.0822 *** | 1.2294 | 1.2294 | 0.0009 |
| 5 | 0.7339 | 0.7334 | 0.0608 *** | 0.3281 | 0.3281 | 0.0003 |
| 22 | 0.2083 | 0.2082 | 0.0404 | 0.0793 | 0.0793 | 0.0025 |
| Panel 18: KS11. 6/16/2004 | Panel 19: KSE. 4/01/2005 | |||||
| 1 | 1.2386 | 1.2384 | 0.0161 | 1.2807 | 1.2801 | 0.0478 *** |
| 5 | 0.3273 | 0.3273 | 0.0095 | 0.3395 | 0.3393 | 0.0601 *** |
| 22 | 0.0860 | 0.0860 | 0.0058 | 0.0840 | 0.0840 | 0.0012 |
| Panel 20: N225. 6/06/2003 | Panel 21: NSEI. 5/18/2004 | |||||
| 1 | 1.3336 | 1.3332 | 0.0304 | 3.5197 | 3.5167 | 0.0865 *** |
| 5 | 0.3479 | 0.3479 | 0.0089 | 0.9980 | 0.9974 | 0.0552 |
| 22 | 0.0897 | 0.0897 | 0.0111 | 0.2498 | 0.2497 | 0.0401 |
| Panel 22: SSEC. 11/18/2003 | Panel 23: STI. 2/28/2002 | |||||
| 1 | 1.9674 | 1.9673 | 0.0066 | 0.3886 | 0.3872 | 0.3634 *** |
| 5 | 0.5201 | 0.5200 | 0.0060 | 0.1032 | 0.1029 | 0.2681 *** |
| 22 | 0.1350 | 0.1350 | 0.0000 | 0.0253 | 0.0253 | 0.0830 *** |
| North America | ||||||
| Panel 24: DJI. 5/23/2003 | Panel 25: GSPTSE. 11/25/2005 | |||||
| 1 | 2.0634 | 2.0629 | 0.0220 | 4.9173 | 4.9166 | 0.0131 |
| 5 | 0.5358 | 0.5357 | 0.0088 | 1.2551 | 1.2550 | 0.0053 |
| 22 | 0.1372 | 0.1372 | 0.0146 | 0.3107 | 0.3107 | 0.0077 |
| Panel 26: IXIC. 4/30/2003 | Panel 27: MXX. 4/30/2003 | |||||
| 1 | 1.3706 | 1.3699 | 0.0496 *** | 1.4505 | 1.4502 | 0.0177 |
| 5 | 0.3524 | 0.3523 | 0.0304 | 0.3870 | 0.3870 | 0.0116 |
| 22 | 0.0601 | 0.0601 | 0.0000 | 0.0930 | 0.0930 | 0.0075 |
| Panel 28: RUT. 4/29/2003 | Panel 29: SPX. 4/25/2003 | |||||
| 1 | 1.2246 | 1.2232 | 0.1099 *** | 1.8266 | 1.8264 | 0.0097 |
| 5 | 0.3199 | 0.3196 | 0.0798 *** | 0.4807 | 0.4807 | 0.0046 |
| 22 | 0.0833 | 0.0833 | 0.0012 | 0.1217 | 0.1217 | 0.0132 |
| South America | Australia | |||||
| Panel 30: BVSP. 10/21/2004 | Panel 31: AORD. 5/02/2003 | |||||
| 1 | 1.8477 | 1.8470 | 0.0405 | 1.0930 | 1.0900 | 0.2710 *** |
| 5 | 0.4764 | 0.4763 | 0.0227 | 0.2706 | 0.2698 | 0.2791 *** |
| 22 | 0.1270 | 0.1270 | 0.0394 | 0.0724 | 0.0724 | 0.0069 |
Publisher’s Note: MDPI stays neutral with regard to jurisdictional claims in published maps and institutional affiliations. |
© 2022 by the authors. Licensee MDPI, Basel, Switzerland. This article is an open access article distributed under the terms and conditions of the Creative Commons Attribution (CC BY) license (https://creativecommons.org/licenses/by/4.0/).
Share and Cite
Shiba, S.; Cunado, J.; Gupta, R. Predictability of the Realised Volatility of International Stock Markets Amid Uncertainty Related to Infectious Diseases. J. Risk Financial Manag. 2022, 15, 18. https://doi.org/10.3390/jrfm15010018
Shiba S, Cunado J, Gupta R. Predictability of the Realised Volatility of International Stock Markets Amid Uncertainty Related to Infectious Diseases. Journal of Risk and Financial Management. 2022; 15(1):18. https://doi.org/10.3390/jrfm15010018
Chicago/Turabian StyleShiba, Sisa, Juncal Cunado, and Rangan Gupta. 2022. "Predictability of the Realised Volatility of International Stock Markets Amid Uncertainty Related to Infectious Diseases" Journal of Risk and Financial Management 15, no. 1: 18. https://doi.org/10.3390/jrfm15010018
APA StyleShiba, S., Cunado, J., & Gupta, R. (2022). Predictability of the Realised Volatility of International Stock Markets Amid Uncertainty Related to Infectious Diseases. Journal of Risk and Financial Management, 15(1), 18. https://doi.org/10.3390/jrfm15010018