Abstract
Subsidies in the form of direct transfers from the government to citizens constitute a powerful mechanism for crisis mitigation and for the alleviation of economic inequalities. However, the connection between direct transfers of cash assistance to selected individual beneficiaries and the prosperity of their immediate surrounding local economy has not been sufficiently explored. This paper presents a case study which analyzes the effects of allocating cash assistance in the form of a local currency. It shows that, under certain conditions, such a transfer not only provides the beneficiaries with additional purchasing power to satisfy their needs but also that the monetary injection benefits local SMEs by generating additional turnover. Using transactional data from the system, some indicators are proposed to analyze the properties of the system, namely, user satisfaction, total and average income generated by local businesses, the local multiplier, the recirculation of the local currency, and the velocity of its circulation. Our findings indicate that cash assistance provided in the REC local currency could contribute to local economic development and financial stability by sustaining local commerce, while preserving most of the original positive effects of cash assistance in a legal tender.
1. Introduction
Complementary currencies are monetary devices that are frequently issued as not-for-profit initiatives with the purpose of fostering social and economic transformation and development at the local and regional level (Gómez 2019; Gómez and Dini 2016) to protect, stimulate, or reorient economic activities (Blanc 2011).
On the other hand, subsidies in the form of cash transfers have been increasingly used in the mitigation of economic inequalities and for the development and humanitarian aid initiatives. Over the last few years, much research has been devoted to cash transfer public subsidies and the factors that determine their success in generating wealth and welfare (e.g., Devarajan et al. 2013; Shaefer et al. 2019). However, the number of experiences and studies devoted to the possibility of transferring subsidies by means of a Complementary currency, considering the combined positive impact of both, are limited.
This article analyzes the performance of REC, a pilot local-virtual currency, which is part of a bimonetary system in Barcelona, Spain. This consists of the REC monetary system and a euro prepaid bank card, and it is used to pay the so-called Municipal Inclusion Subsidy, provided by the Barcelona city council to disfavored citizens of 10 predefined neighborhoods. Such public policy is aimed at creating a positive economic impact, not only on the subsidized beneficiaries, but also on their surrounding local economy. This strategy seeks to boost the activity of local stores, usually small and medium enterprises, and to increase the effectiveness and impact of public spending.
Our study presents the features of the REC system and analyzes data on the transactions in REC performed during the pilot, as well as the results of two surveys carried out with consumers and businesses participating in the system, to evaluate the effectiveness of paying subsidies in a new local currency (instead of the national currency) to foster local development.
In the next section, we present the background of our study, including research related to cash transfer subsidies, the concept of buying local and its multiplier effects, an account of previous research on similar experiences with complementary currencies, and a description of the REC system itself. Next, the methodology section presents the indicators and the data sources analyzed in the paper and the conditions that we aimed to evaluate with these indicators. These conditions are grounded in previous research reviewed in the background section. The results section analyzes a set of six indicators of the performance of the REC, namely, (1) currency usability, (2) sales in the local currency by the affiliated businesses, (3) affiliated businesses owners’ satisfaction, (4) local multiplier effect of public spending, (5) recirculation rate, and (6) local currency circulation velocity. In the discussion section, we evaluate the ability of the REC to regenerate and develop local economic activity on the basis of the results. We do so by contrasting three conditions in the local effects of alternative spending strategies that we established on the basis of previous research, as presented in the methodology section. The final section presents the conclusions, the limitations, and further lines of research that should be undertaken to provide further validation and explore factors that may have an impact on the observed results.
2. Background
2.1. Cash Transfer Subsidies
Over the last decade, cash transfers have been increasingly used in the mitigation of economic inequalities and in development and humanitarian aid. The World Bank states that, in response to the socioeconomic impacts of the COVID-19 pandemic, governments have introduced over 1600 social protection measures in almost all of the world’s countries and territories. Cash assistance has grown by 240% during this time, reaching 1.1 billion people (Gentilini et al. 2020). Over the last few years, much research has been devoted to public subsidies in the form of cash transfers and the factors that determine their success in generating wealth and welfare. For instance, in India, a case was made in favor of a decentralized local management of cash assistance to allow for greater flexibility (Kapur et al. 2008). In Africa, research showed that, by transferring a portion of resource-related government revenues uniformly and universally as direct payments to the population, some countries could increase both private consumption and the provision of public goods, thereby reducing poverty and enhancing social welfare (Devarajan et al. 2013). In the USA, cash assistance has declined in favor of in-kind aid, and this has been associated with a reduction in the wellbeing of impoverished families with children (Shaefer et al. 2019).
Cash transfers are used as crisis relief funds as a form of humanitarian aid in the event of disasters, for poverty alleviation, and for the mitigation of economic and social inequalities in development projects. Since 2016, humanitarian aid and development have been linked as part of the so-called New Way of Working in the UN’s Humanitarian-Development nexus (OCHA 2016). According to the United Nations Office for the Coordination of Humanitarian Affairs (OCHA), “the New Way of Working can be described as working toward achieving collective outcomes that reduce need, risk, and vulnerability, over multiple years, based on the comparative advantage of a diverse range of actors. This notion of “collective outcomes” has been placed at the center of the commitment to the New Way of Working to achieve the Sustainable Development Goals” (OCHA 2016). The “collective outcomes” have the ultimate goal of fulfilling needs by reducing risks and vulnerability. The capacity of different actors to contribute to solving each other’s needs stands out as the key concept of Comparative Advantage, defined as “the unique, demonstrated capacity and expertise (…) of one individual, group, or institution to meet needs and contribute to risk and vulnerability reduction, over the capacity of another actor” (OCHA 2016).
2.2. The Concept of Buying Local in Local Economic Development
The concept of buying local links cash transfers with the economic development of local communities, and it requires that private investment or direct support from government bodies be attracted, and that this money is retained in the local economy (Thatcher and Sharp 2008). The latter can only be achieved through a shift in the focus of economic activity to meet local needs wherever possible (Hines 2000; Williams 1996; Dobson 1993; Thatcher and Sharp 2008). Buying local or the so-called “import substitution” (Persky et al. 1993) has played an essential role in localizing economic activity and the development of metropolitan areas of the world (Thatcher and Sharp 2008; quoting Persky et al. 1993). The origin of this concept can be traced back to Keynes and, more specifically, to Myrdal’s theory of circular and cumulative causation (Myrdal 1957, pp. 13, 26), which states that “the play of forces in the market normally tends to increase, rather than decrease the inequalities between regions” because, “in the normal case, a change does not call forth countervailing changes but, instead, supporting changes, which move the system in the same direction as the first change but much further. Because of such circular causation (…) a social process tends to become cumulative and often gathers speed at an accelerating rate” (Myrdal 1957, pp. 13–26; Pike et al. 2016, p. 95). Myrdal’s theory was based on the tendency to disequilibrium and the multiplier effects that are rooted in the Keynesian approach to economic development (Pike et al. 2016, p. 93). This approach has resulted in the regenerative local development approach (Gómez and Helmsing 2008), as well as the indigenous and place-based approaches to local and regional development (Pike et al. 2016, p. 247).
On these foundations, the local multiplier effect of spending (Sacks 2002) has been validated as a tool to measure the effects of local expenditure (Silovská and Kolaříková 2016). For instance, it has been used in the analysis of the impact of public procurement in the UK, when a hospital in the Cornwall area decided to source its food from local suppliers (Thatcher and Sharp 2008), as well as for the analysis of impact of environmental policies, to measure the effects of shortening the supply chain of subsidized operators in a protected area (Březina et al. 2013, p. 3), and to evaluate the economic impact of the operations of an online retailer of local food in an English market town (Mitchell and Lemon 2019).
As cash transfers may have a multiplier effect associated with their regenerative impact on local economic development, the question becomes whether there are mechanisms that may help to boost their buying local impact. The promotion of community and complementary currencies has been proposed to have a significant potential in this direction.
2.3. Complementary Currencies
Community and complementary currencies are monetary devices frequently aimed at fostering social and economic transformation and development at the local and regional level (Gómez 2019; Gómez and Dini 2016). In the operation of these devices, which are often managed at a community level, the organizers typically operate in two ways: (1) they provide credit limits to each individual and then allow them to buy goods and services from other participants using credit supported by the community (mutual credit systems), or (2) they encourage individuals to participate, which they can do by exchanging funds in legal tender for funds in the complementary currency and by buying other participants’ goods and services in the complementary currency (local currencies).
Community and complementary currencies are, in many instances, promoted and aimed at encouraging buying local within a given community (Blanc 2018, p. 69; De La Rosa and Stodder 2015; Groppa 2013). Moreover, the digitalization of local currencies has improved their appeal (Christy et al. 2019) and facilitated the analysis of the payment transactions by increasing their traceability (Segura Bonet and Muns Terrats 2019).
The local multiplier effects of complementary currencies have been found to be higher than those of legal tender currencies (e.g., Groppa 2013). The fact that complementary currencies have not been designed for saving purposes, as they are potentially perceived as weaker in backing than the legal tender (Gómez 2019), implies that the marginal propensity to consume induced via the complementary currencies is close to 100%. This is a factor that raises the local multiplier effect above that of the legal tender. Several previous experiences of complementary currencies have shown this. Such is the case, for instance, of Punto Transactions in El Salvador, whose local performance was exemplified in the theoretical study by Groppa (2013). It is noteworthy that, in that study, the low saving propensity induced by the complementary currency was not deemed as a weakness, given that this feature enhances the purpose that it seeks: to promote a higher frequency of transactions in the local economy (Blanc 2018, p. 89).
In addition to the local multiplier effect, a way of measuring the capacity of community currencies to generate local expenditure is the velocity of circulation that they generate. The income velocity of circulation of money is “the frequency with which money is transferred between different money holders and, thus, determines how much money is required to service a particular level of nominal transactions” (Gerdesmeier and Rofia 2002, p. 7). The multiplier effect and velocity of circulation are two measurements of the same phenomenon (Blanc 2018, p. 90). While the multiplier effect measures how many transactions a unit of currency injected in the system undergoes (with no time limit), the velocity of circulation is the number of transactions that a unit of currency experiences in a given period of time—normally 1 year. The velocity of circulation in complementary currencies is very often higher than that of legal tender. This was shown in the study by De La Rosa and Stodder (2015), who analyzed the velocity of circulation of different complementary currencies, to define the features of the currencies that are correlated with higher velocities of circulation. They found that the factors with a higher impact on the velocity of circulation are (1) the existence of negative interest rates (demurrage), (2) a strong base of business participants with potential to exchange with other participant businesses, (3) consumer’s involvement, (4) a medium size of network of participants (not too big, not too small), and (5) blended loans issued in the legal tender and in the complementary currency.
Some complementary currency systems have also been shown to increase macroeconomic stability. Two examples stand out. On the one hand, the WIR system in Switzerland started as a community-based mutual credit system but is currently a community-owned bank. The WIR, has generated a countercyclical effect over a period of more than 85 years, in which the circulation of the currency (volume of transactions and velocity) has increased in times of crisis (when legal tender was scarcer) and stalled when conventional money was stable. This was shown in several studies based on the operational data of the WIR System and World Bank’s M2 and GDP data of the Swiss Economy (Stodder 2000, 2009; Stodder and Lietaer 2016). The second example is the case of cash transfers using only local currencies at a national level as South Korea’s response to the COVID-19 pandemic. They used monetary tools already put in place in 2016, when a vast network of 31 complementary local currencies (in paper and digital formats) were launched to channel the payment of a basic income subsidy to young people in large regions. The initiative was released by the Korean government, with the involvement of local, regional, and national governments in the organization. As a part of the COVID-19 relief program, the equivalent of about 1691 million EUR was injected from January to August 2020, using established channels. One of the effects of this deployment of local payment tools is that the income of local SMEs obtained by government transfers completely compensated for the reduction in income from sales caused by the pandemic, and consumption levels were sustained throughout the last 6 months of 2020, when they sank in other parts of the world. This study is based on the local currency system data and national statistics of the South Korean Ministry of Small and Medium Enterprises (BIRG 2021).
The provision of a cash assistance subsidy had an earlier experience in Brazil, where a large-scale program (Bolsa Familia) was issued to transfer cash to more than 13 million impoverished families. A recent study on the impact of this program on the local labor market, including its potential detrimental effects in the form of labor disincentive, showed that the positive multiplier effects of the Bolsa Familia scheme compensated for any downside effects. This study analyzed differences in the application of the Bolsa Familia program across the country (difference-in-differences design), based on the program’s official data and national statistics on formal labor. The results showed that, in the municipalities of the country where the total Bolsa Familia cash assistance per capita was higher (13.2% higher on average), formal labor increased by 2%, including recipients and nonrecipients of the Bolsa Familia program (Gerard et al. 2021). However, the study of this subsidy did not take into account the effect of local and community currencies issued by community development banks such as Banco Palmas, which are often also Brazilian public bank branches, and which manage both conventional and community currencies (Instituto Banco Palmas | Como Implantar Um Banco Comunitário n.d.). The use of community currency has increased local consumption in Brazil (de França Filho et al. 2012); hence, it remains to be seen if the Bolsa Familia program’s multiplier effects could be connected to the use of complementary currencies in Brazil. It is to be noted that, in 2012, there were about 78 community development banks in Brazil (Scalfoni Rigo 2014) issuing their own local currency for regional development purposes (Fare et al. 2015); today, there are 121 banks affiliated with the electronic money platform E-Dinheiro, which offers the digital version of the wide network of complementary currencies in Brazil (E-dinheiro Brasil n.d.). The case study of the Mumbuca E-Dinheiro analyzed the performance of a complementary currency adopted by the municipality of Maricá in 2013 and used to deliver basic income during the COVID-19 pandemic. The study showed how this initiative enabled a quick and safe cash distribution aimed at mitigating the effects of the COVID-19 pandemic in Brazil. The analysis was based on E-Dinheiro Platform system data and reported the implementation problems of the basic income subsidy delivery, revealed mainly by the press (Gonzalez et al. 2020). Similar and additional advantages were highlighted by Joseph Stiglitz in the 2021 South Korean Basic Income Conference (Gyeonggi Province Basic Income Conference) regarding the aforementioned Korean COVID19 relief program in local currency where he stated the following: “I think the kind of [basic income] program that you have [in South Korea] is a particularly well-designed program given the nature of the pandemic (…); if we would have had [in the US] a program based on a voucher (sic) that has to be used locally it would have helped more”.1
International humanitarian aid organizations have also started to provide aid in complementary currencies. Such is the case of the assistance that the Red Cross is providing in Kenya, which is channeled using the Sarafu complementary currency (Dama 2019).
In Spain, some NGOs and municipalities have engaged in a collaboration to channel public subsidies through local currencies. The Ossetana, in the town of San Juan de Aznalfarache, Seville, belongs to this category. The currency was launched in 2012 as paper vouchers with the aim of channeling subsidies for impoverished families in the aftermath of the 2008 crisis; it went digital in 2016 and, to date, remains in circulation. The Grama, in Santa Coloma de Gramenet, Barcelona, was launched in 2016 by the municipality as a digital currency aimed at channeling subsidies addressed to local stores and SME associations to strengthen the local economy. Lastly, the REC in Barcelona city, also digital from its start, was launched in 2018 in association with the Barcelona city council (Martín Belmonte 2019). This later experience is the object of our research.
Although the existing precedents indicate that cash transfers provided in a local currency can potentially bridge economic support (and humanitarian aid subsidies) with regenerative local development, research on this topic is limited. Moreover, while cash transfers in local currencies have had important results for macroeconomic stability in non-Western economies, the adaptability of such schemes to Western economies and their ability to have a local multiplier effect require further analysis. Buying local in public procurement has increased local multiplier effects; however, the impact of using local currencies for public procurement has yet to be tested in terms of the local multiplier effect, the velocity of currency circulation, and macroeconomic stability. Lastly, as most local currencies are only accepted by SMEs, the advantages of injecting money through a funnel of SMEs is to be explored.
2.4. The REC
This paper analyzes the case of the REC, the Barcelona citizen currency, a local-virtual currency that, for a pilot project of 13 months, between 2018 and 2019, channeled 25% of a guaranteed minimum income called Municipal Inclusion Support provided by the Barcelona City Council Social Services to 600 families. The remaining 75% of the subsidy was provided to the beneficiaries in EUR (via a prepaid bank card). The subsidy was given to citizens living in 10 neighborhoods of El Besòs, an impoverished area in the northeast of Barcelona (Spain) which suffers from commercial desertification and a weakened economy. In the period of the intervention, 789,592 REC was put in circulation, generating transactions worth 901,004 REC, of which 643,532 REC was exchanged for EUR by the affiliated businesses.
The REC system was implemented as a virtual currency, backed with payment accounts in EUR in a Payment Institution regulated under SPD2. The Municipal Inclusion Support beneficiaries were to spend their subsidy in local, independently managed businesses that were invited to be affiliated with the currency, initially at no cost. The participant businesses operating in REC were committed by contract to keep a parity between prices in REC and prices in EUR. These businesses could exchange REC for EUR without any penalty, although the REC promoters actively encouraged them to spend their REC in the area. The actual payment was channeled via a mobile app, which allowed the identification of the recipient with a QR code and the search for goods and services with a geopositioned marketplace, in which businesses could upload their offers daily.
At the moment of publication of this article, the REC system remains in circulation, but no further cash subsidy additional to the 789,592 REC has been paid in REC yet. Instead, it has been used to provide incentives for local consumption (15% of the exchanges to local currency, paid partly by the city council and partly by local businesses). Additional information on the project during the intervention period can be found in the project’s report (Martín Belmonte 2019).
3. Methodology
Our research was based on the case study of the REC initiative. We grounded our analysis in the operational data of the REC system, as well as surveys conducted on the individual participants and the businesses that took part in the system during the 13 month treatment period. From the theoretical propositions that led to the case study (reviewed in the background section), we focused our attention on key questions and data, from which we extracted a set of indicators that allow evaluating to what extent cash assistance paid in REC achieved the objective of linking aid (the so-called Humanitarian-Development Nexus) with local economic development or promotion. We next present the set of indicators under analysis, the data sources that we used to obtain them, and the conditions evaluated in the discussion section.
3.1. Indicators
The following indicators were used to analyze the results of the REC as a means of spending subsidies, in terms of its ability to foster local economic development:
- Usability of the local currency, based on user satisfaction surveys to cash assistance beneficiaries. We analyzed whether cash assistance payments in a digital local currency achieve the utility of cash assistance in conventional currency.
- Amount of cash perceived by the affiliated businesses, computed from the data on the turnover obtained by these businesses in the local currency.
- Satisfaction of participant businesses, based on a survey to study whether the increase in their income and the experience with the system are satisfactory.
- The local multiplier of the REC payments in local currency, obtained using the data of the system as the ratio between the global value of transactions operated in REC and the amount of REC introduced in the system. This ratio is compared with the equivalent fiscal multiplier in Spain at the time.2
- Recirculation of the REC, measuring the percentage of local currency expenditures over local currency income of retailers as a measurement of the extent to which consumers are “buying local”.
- Velocity of circulation of the REC, computed as the sum of transactions of each period divided by average money supply of the period and multiplied by 12 to annualize the monthly values, as compared with the EUR and USD velocity at the time.3
3.2. Data Sources
The data to obtain these indicators were collected using three sources:
- The transaction data of the 25% of the Municipal Inclusion Subsidy (cash assistance provided to the beneficiaries) in the REC local currency. The data were obtained from the records of the digital management system of the currency.
- Two surveys to the beneficiaries of the subsidy using community currency. The first survey was performed in February 2019, when the currency had been in circulation for 4 months, and the second survey was carried out almost 1 year after launching the currency, in early September 2019. The methodology used was CATI (computer-assisted telephone interviewing), with a standard questionnaire of 13 questions of different types. The total number of beneficiaries was of 496 in December and 520 in July (when the fieldwork was conducted). They were all called up to three times to participate in the survey, and the total number of interviews was 232 in February (46.77%) and 264 in September (50.64%). The questionnaire of the survey is provided in Supplementary File S1.
- Two surveys of the businesses that participated in the scheme by accepting community currency from their customers and potentially using them for their own payments. These surveys were conducted simultaneously to the beneficiary surveys. The methodology used was CATI (computer-assisted telephone interviewing) with a standard questionnaire of 13 questions. The total number of affiliated businesses was of 130 in December and 137 in July (when the fieldwork was conducted). All businesses were contacted up to three times to participate, and a total of 76 responses were obtained in February (58.46%) and 77 responses were obtained in September (56.20%). The questionnaire of the survey is provided in Supplementary File S2.
3.3. Conditions Evaluated in the Discussion of Results
We formulated three conditions for cash assistance in a local currency to drive a regenerative local economic development based on the literature regarding the link between aid (the so-called Humanitarian-Development Nexus) and local economic development or promotion, as analyzed by Gómez and Helmsing (2008) and Thatcher and Sharp (2008), and in line with the priorities stated in the New Way of Working (OCHA 2016).
The following are the conditions evaluated in the discussion section:
- Condition 1: cash transfers in the local currency should be carried out in a way that fulfils the initial intention of the transfer: to help cover or alleviate the needs of the beneficiary;
- Condition 2: cash transfers should be an additional monetary injection that is sufficient enough to make a difference to the local economy.
- Condition 3: the money injected should remain local to a greater extent than under previous circumstances.
Table 1 presents a summary of the indicators computed and presented in the results section, their measurement methodology, and their purpose with respect to the three conditions evaluated in the discussion section.

Table 1.
Summary of indicators.
4. Results
4.1. Usability of the Currency
The average income in REC for individual users of the B-MINCOME program was 130 REC per month per household. All usability indicators showed an increase between the first and second surveys. The satisfaction indicator for individual users in September 2019 was 92% (indicating that beneficiaries were ‘quite’ or ‘very’ satisfied), 10% higher than when first measured in February 2019. At that time, 89% of consumers found the REC payment app easy to use. Moreover, 99% of users knew where they could spend REC, which was above the 84% initially reported. The user help service dealt with an average of 16 queries per month from individual users. Most queries were received in the implementation phase of the REC. They were mainly attended by telephone or in person, and the help service itself received a 98% approval rating from individual users.
The users indicated that payment in REC had an impact on their consumption habits. In total, 55% indicated so in the last survey, compared with 35% in February. The main change that users identified in their consumption was a switch from bigger to smaller local shops and markets, followed by an increase in their purchasing product diversity and quantity. Another impact that consumers identified was their feeling of contributing to the neighborhood’s economy (87.5% of those surveyed), as well as an increased trust among consumers toward affiliated businesses (74% in the last survey, compared to 61% in the first). Nevertheless, when asked whether the REC had helped them to improve their skills in the use of new technologies, a majority of consumers answered positively in the first survey (57%), whereas 64% responded negatively in the second survey.
Analyzing the interrelation among responses reveals that the users who considered that the currency had a positive impact on the neighborhood were those who were the most generally satisfied with the REC. In particular, only 7% of the participants surveyed answered that they considered that the REC had a negative or no impact on the local economy. Nevertheless, over half of these respondents (53%) reported being satisfied or very satisfied with the REC. It appears that the use of the currency did not, therefore, help or reinforce consumers’ perception regarding how the local economy was performing. Moreover, for those for who perceived that the currency generated a positive impact on the neighborhood, which was the majority (93%), the association with a positive overall satisfaction rating was highly significant, at over 96% (Pearson correlation coefficient).
The aspects that consumers spontaneously highlighted most frequently as positive traits of the system were the ease and convenience of paying with the app (68%), the boost it represented with respect to their finances (18%), and the perception of helping to promote trade in the neighborhood (12%). Negative aspects that were mentioned included the lack of variety among the affiliated businesses (52%), their high prices (52%), and payment problems due to slow connections or insufficient coverage (28%), together with other aspects related with the REC operating system (12%) which could be related to problems of mobile phone coverage in the districts of operation. This evaluation persisted during the period under study despite the fact that municipal markets worked on ameliorating the situation with the installation of freely available Wi-Fi networks.
4.2. Sales in the Local Currency by the Affiliated Businesses
The REC entered in circulation in September 2018, with 82 affiliated businesses. These were mainly retailers who placed their trust in the program from its beginning, despite its novelty. As the REC system became established, the number of active affiliated businesses rose to 160 by 30 October 2019, including two wholesalers, plus 13 local entities (associations and foundations based in the area of implementation). The food sector rapidly became the predominant sector in the system, in terms of the number of affiliated businesses, revenue, and payments in REC. The revenue in REC in the food sector represented 74% of the total, followed by pharmacies (7%) and supermarkets (5%). The average revenues for active affiliated businesses throughout the period studied was 5559 REC, and the median was 2035 REC, suggesting a high concentration of revenue. Furthermore, 20% of the affiliated businesses received 72% of the revenue, as revealed in Figure 1.
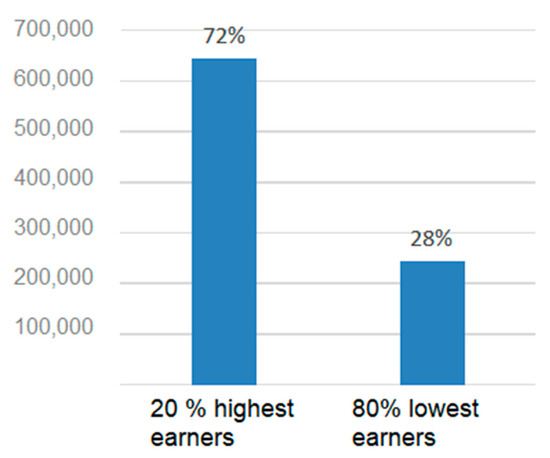
Figure 1.
Revenue distribution in REC among businesses in the period.
4.3. Affiliated Business Owners’ Satisfaction
4.3.1. General Satisfaction
The majority of business owners were satisfied or very satisfied with the REC system (88% in the second survey compared with 80% in the first survey). As in the first survey, most affiliated businesses owners agreed they had received sufficient information on the REC mechanism (97%), and the percentage that were aware about where to spend REC slightly increased, from 77% to 79%. Most of the enquiries to the help desk service were related to petitions to exchange REC to EUR, which the affiliated business owners could not access automatically from the app (26%). Affiliated business owners’ satisfaction with the help desk service in dealing with other incidents was very high (100%).
4.3.2. Perception of Increased Sales and Customers
A majority of affiliated businesses stated that their sales volumes had increased by up to 5% in the first survey (64%) and up to 10% in the second survey (66%), and that they had experienced an increase in the number of customers of up to 5% (79%) in the first survey and up to 10% (78%) in the second survey. However, they expressed not having noticed a significant increase in sales in EUR due to the REC system: 72% noticed no increase in the second survey, although this is an improvement with respect to the first survey, when 84% did not notice an increase.
4.3.3. Boosting of Local Businesses
In the first survey, businesses expressed that they did not perceive the REC as having boosted local business (only 46% indicated that it did). In the second survey, however, this changed, and a majority of affiliated businesses expressed that the REC had increased local trade (65%).
4.3.4. Other Perceived Effects of the System
Businesses expressed not believing that the REC had helped them to improve their skills in the use of new technologies (84% responded “little” or “none” to the corresponding question) nor did they express considering that the REC had led them to change any of their consumption habits (87%).
4.3.5. Overall Evaluation
When asked to openly quote two positive aspects of the REC system, businesses highlighted the profits it generated for their businesses (34%), the ease of use and security of the app and payment channel (30%), the fact that it was a positive initiative (15%), and its ability to help local people (3%). When asked about the negative traits, 38% of the businesses expressed that they could not think of any remarkable downsides. The remaining 62% referred to problems with aspects related to the app and system (44%), the difficulty in requesting the exchange of REC to EUR by email (22%), and minor aspects regarding the REC mechanism (19%).
A comparison of the survey data with the transaction data in the system revealed the following:
- The participant businesses who collected the highest amounts in REC had the highest levels of satisfaction and a stronger perception that the REC was helping the local economy.
- It is noteworthy that affiliated businesses seemingly underestimated their revenue in REC when they responded to the surveys. Cross-analyzing the survey responses with turnover figures in the system, 22 retailers (28.57% of respondents) stated not noticing any increase in turnover due to the REC, despite having cumulatively collected a total of 33,632.68 REC, which represents an average of 1528.75 REC per shop and 127.39 REC per month. The same occurred in the first survey, where 27 businesses (35% of the total) cumulatively collected 33,714 REC during the period of circulation, which represents an average of 250 REC per business per month. These businesses, therefore, understated the effects of REC displayed in the data.
4.4. Local Economic Multiplier Effect of Public Spending
Using the transaction data available for the first 13 months of the REC (October 2018 to October 2019), the cumulative local economic multiplier of public expenditure was calculated to be 2.11 by October 2019. Table 2 shows the results obtained for the monthly multiplier, calculated as the proportion of the global sum of REC transactions over the injected REC units in that month. The accumulative monthly multiplier was also calculated as the proportion of the accumulated global sum of REC transactions up to that specific month divided by the accumulated injected REC units up to that month. In the process of calculating the local multipliers, we could use perfect information about the transactions made in REC since all the subsidy payments were formalized through a mobile application (providing full traceability of the local currency in terms of volume of exchanges, involved agents, and the moment those transactions occurred). As expected, the multiplier effect captured by the cumulative monthly multiplier rose month by month.
Table 2.
Evolution of multiplier of the public spending in the REC System from October 2018 to October 2019.
The results obtained for the local multiplier must be interpreted as the economic impact or the multiplicative power that each REC monetary unit initially injected into the system (and, therefore, at a microeconomic level) had over the local area in which it was deployed. For reference purposes, moving to a macroeconomic level, these results could be compared with the national spending or fiscal multiplier (increase in monetary units of the GDP for each additional spent unit). Martínez and Zubiri (2014) provided estimations of the fiscal multiplier for the Spanish economy by following two different methodologies. In particular, the average estimated values for the period of 1979–2012 ranged between 1.20 and 1.84, calculated over four quarters (1 year) in a stagnant environment.
4.5. Recirculation Rate
In the initial months of the project, businesses were only recirculating 1.4% of the REC cashed, whereas, at its peak, 33.4% of the REC collected was recirculated. This indicates that REC businesses were finding it easier to spend them as the project developed, and more options for spending them were introduced, including two wholesalers in the food sector. The recirculation ratio presented in Figure 2 shows spending in REC as a proportion of the revenues collected by retail businesses, clearly showing an upward trend during the period.
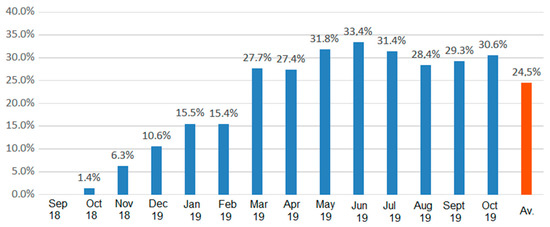
Figure 2.
Recirculation ratio for REC-affiliated businesses (retailers) from October 2018 to October 2019.
4.6. Velocity of Circulation
The REC’s velocity of circulation was calculated as the sum of transactions of each period divided by the average money supply of the period and multiplied by 12 to annualize the monthly values. An exception was made for the last value, where the velocity of circulation over the last 365 days was calculated as the sum of transaction volumes of this period (6 November 2018 to 6 November 2019) divided by the average money supply of the 365th day. Figure 3 shows the evolution of the velocity of circulation of the REC, which was on average 5.80 during the period of intervention. This value is 5–6 times higher than the M3 income circulation of the EUR, which was 0.9450 in the first quarter of 2018 (TTID 2018b), and also higher than the USD M2 velocity in the same period, which was 1.454 (TTID 2018a).
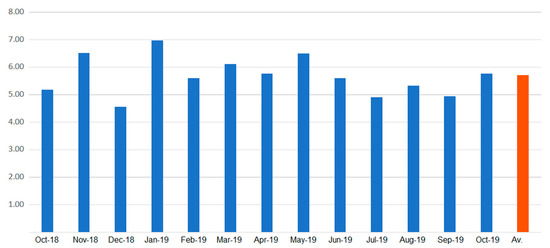
Figure 3.
Annualized velocity of REC local currency from October 2018 to October 2019.
5. Discussion
The REC system was supported with nearly 800,000 in cash assistance to 600 beneficiaries, which was spent in local SMEs. The analysis of the transaction data and the results of the surveys to the Municipal Inclusion Subsidy beneficiaries and affiliated businesses are consistent with those obtained from previous analyses on the effects of complementary currencies. In particular, they show that (1) the multiplier effect of public spending is higher for complementary currencies than conventional currencies (Groppa 2013), (2) public spending in a complementary currency has the potential to increase macroeconomic stability by increasing GDP at a local level in times of crisis (Stodder 2000, 2009; Stodder and Lietaer 2016), and (3) the potential for complementary currencies to produce local economic development (Blanc 2018; Fare et al. 2015; Gómez 2019) is boosted when combined with public expenditure (Gómez and Helmsing 2008).
The indicators obtained corroborate the three conditions evaluated. Data support Condition 1 stating that cash transfers were compliant with the initial intention of the transfer. The cash subsidy in the REC local currency was significantly satisfactory to most beneficiaries and enabled them to buy goods and services to cover basic needs (92% were satisfied or very satisfied). Thus, the main objective of the cash transfer was achieved, including the payment of 25% of the subsidy in a local currency. Since many beneficiaries’ expenditures were only payable in conventional currency (such as utilities and repayments of bank mortgages), it remains an open question whether a 100% payment in local currency or mixed payments in other percentages would have had the same result.
Data also support Condition 2 stating that the cash monetary injections into the local economy should be sufficient to make a difference. According to the system’s data, the average income of businesses in the local currency system (not including the income in EUR) was 5559 REC in the analyzed 13 month period. This caused a positive evaluation of the system by the businesses. One cannot compare with the income that businesses would have had if the system had not been in place, but the positive results of the survey to businesses (of which 88% declared being satisfied or very satisfied) can help assess that a substantial part of it might have been new income, helping the local SMEs improve their economic results. Moreover, since only transactions in REC were analyzed in our study, it is relevant to inquire whether the same result could have been achieved if the Municipal Inclusion Subsidy was 100% paid in EUR. This interpretation is not supported by the results of the survey to shop owners in which they expressed not having noticed a significant increase in sales in EUR due to the REC system; 72% noticed no increase in the second survey, although, in the first survey, 84% noticed no increase. This means that, at least the 600 beneficiaries participating in the REC system were spending mostly REC and not EUR in local shops, and it is doubtful that Condition 2 could have been achieved if the subsidy was paid only in EUR.
Lastly, Condition 3 requires that the money injected via a subsidy stays local to a greater extent than before. The three indicators analyzed—the recirculation rate, the local multiplier, and the velocity of circulation—suggest that this condition was also satisfied. The recirculation rate, which started at 1.4% in the first month and reached 30.6% by the end of the period analyzed, shows that businesses increasingly spent their income in REC in the area of circulation, and that they favored the system by inviting their usual local suppliers to participate. The accumulated multiplier effect of public spending was strong, as it reached a value of 2.11 by the end of the analyzed period, especially when compared with the average fiscal multiplier value in Spain over four quarters (1 year), which was between 1.20 and 1.84. This means that, during the period of analysis, for each EUR of subsidy spent in the area, transactions for the equivalent of 1.11 EUR were maintained within the area of circulation. This indicator shows the power of cash assistance paid in a local currency to increase the aggregated income in the local area and positively impact the GDP. Moreover, from a financial stability standpoint, the steady velocity of circulation of the local currency (around 5.8) was much higher than the M3 income circulation velocity of the EUR (0.98 in Q1 2018), which shows the potential of the local currency to increase economic activity, particularly important in times of crisis where money circulation velocity usually stalls and public policies are sought to increase it. A summary of the conditions analyzed and the results of the indicators evaluated can be found in Table 3.
Table 3.
Descriptive framework of REC Barcelona 13 month pilot study.
6. Conclusions, Limitations, and Further Research
The study of the REC initiative provides evidence of a relationship between public expenditure in the form of a local complementary currency and the promotion and development of the local economy. All indicators analyzed favor the three conditions that enhance local development. Thus, our results are encouraging for further initiatives and research to tackle the specific ways in which paying cash assistance in a local currency can be fostered to strengthen its capacity to promote local SMEs and, potentially, to reduce risks and social vulnerability, to mitigate the impacts of inequality and crises, and to improve financial stability.
It is to be noted that the fact that our analysis was based on a case study implies that the extent to which conclusions can be upscaled to other contexts is limited (Yin 2011). Further research on the effects of public expenditure in local complementary currencies should be conducted to analyze which factors enhance or are detrimental to the effectiveness of such public policy instruments. For instance, notwithstanding the positive results experienced by the REC, it is obvious that a critical mass is required for the potential impacts of such public policies and mechanisms to materialize. That is, the provision of cash assistance in a local currency can only achieve impact if the number of beneficiaries and participating businesses is sufficiently high. The size of a public money injection using a local currency in a given area and the minimum period it should last to have a significant impact in the local economy are factors that may affect its effectiveness and should be the object of further study. Indeed, a limitation of our study is that the REC experience was analyzed for 13 months and, therefore, we were not able to contrast longer-term effects of the initiative.
At a methodological level, we based our analysis on several well-established indicators of the performance of subsidies and complementary currencies, as well as their effect on the local economy. However, it is to be noted that we were not able to compare the indicators of the expenditure made in REC with those associated with the expenditure made in EUR (also part of the Municipal Inclusion Subsidy), since the associated data were not similarly traceable by the system or were not available for analysis. Thus, we had to limit our analysis to a comparison to reference macro-indicators from other studies. For instance, while velocity is generally calculated on the macro level as GDP divided by the money supply, the GDP cannot be equated to the sum of all transactions in a given economy. Nevertheless, previous research, such as that of De La Rosa and Stodder (2015), used the same method to calculate and contrast local currency velocity. Further methodological research should aim to develop enhanced measures and procedures that allow contrasting the effectiveness of public policies based on local complementary currencies with a direct comparison of expenditure in the conventional currency (where indicators could be obtained for perfectly comparable scenarios).
In summary, the analysis of our study presents results that are to be evaluated in the specific context of the REC experience. Moreover, there are methodological enhancements that should be tackled in further research. Nonetheless, the results derived from the REC Barcelona case study constitute an important contribution in that they indicate the potential of new mechanisms for public policy aiming at the promotion of the local economy. The study shows that, under the appropriate circumstances, paying cash assistance in a complementary currency can lead to a significant advantage for the beneficiaries, contributing to reduced inequality, risk, and vulnerability, while changing consumption habits to buy locally, as well as promoting local businesses and, thus, boosting the local economy.
Supplementary Materials
The following are available online at https://www.mdpi.com/article/10.3390/jrfm14090430/s1.
Author Contributions
Funding acquisition, conceptualization, investigation, and original draft preparation, S.M.B.; validation, review and editing, methodology, and data curation, M.R., J.P., M.S. and S.M.B. All authors have read and agreed to the published version of the manuscript.
Funding
This research received no external funding although it was written on the basis of data of the B-MINCOME project, carried out with the funding of the EUROPEAN COMMISSION (Urban Innovative Actions Program) and the Barcelona city council, and it was grounded in the final report of the REC project (Martín Belmonte 2019), which contained the work carried out by the research team of the REC project at NOVACT, the ESCI-UPF (Universitat Pompeu Fabra), and the market research consultancy Optimum.
Institutional Review Board Statement
Not applicable. The study does not involve human/animal experimentation.
Informed Consent Statement
Informed consent was obtained from all subjects involved in the study.
Data Availability Statement
The transaction data presented in this study are available on request from the corresponding author. The data are not publicly available due to contractual data protection liabilities of the REC system management team with the users of the REC system. The survey questionnaires are included in Supplementary Files S1 and S2.
Acknowledgments
The publication of this paper was financially supported by Monneta (https://monneta.org/en, accessed on 7 July 2021), a German not-for-profit organization, and the Development Economics Research Group at the International Institute of Social Sciences of Erasmus University Rotterdam (https://www.iss.nl/en, accessed on 7 July 2021). We would also like to thank Santiago Marti for his selfless contribution to the B-MINCOME project, Dani Duocastella from NOVACT for his contribution to the survey design, Ariádne Scalfoni for her useful information on the Brazil complementary currency experience, and Kirsten Sutherland Ruibérriz for her insights into cash assistance for humanitarian aid.
Conflicts of Interest
The leading author of this paper was the promoter of the pilot project that resulted in the launching of the REC system. Other than that, the authors declare no conflicts of interest. The funders had no role in the design of the study; in the collection, analyses, or interpretation of data; in the writing of the manuscript, or in the decision to publish the results.
Notes
| 1 | (Gyeonggi Province Basic Income International Conference 2021) Joseph Stiglitz keynote speech on the The 3rd Gyeonggi Province Basic Income International Conference, 5 April 2021 (minute 35.10) Available in: https://www.youtube.com/watch?v=pQO0_KdTEEM&t=641s, accessed on 25 July 2021. |
| 2 | In the calculation of the multiplier effect, we do not follow previous studies’ methodology and rather base this on the perfect information obtained from the REC system. For instance, Gerard et al. (2021), compare cash assistance payments and formal labour increase data from national statistics which do not apply to our study, rather than transactions. Neither can we use the methodology used by Groppa (2013) since this analyses the credit circuits of a mutual credit system, which is not applicable to the case of the REC. |
| 3 | In the calculation of the velocity, we have followed the same method as De La Rosa and Stodder (2015). |
References
- BIRG (Basic Income Research Group). 2021. The Effects of Gyeonggi Local Currency on Consumers and Small Businesses in Gyeonggi Province: Focused on Covid-19 Response. Suwon: The Gyeonggi Research Institute. [Google Scholar]
- Blanc, Jérôme. 2011. Classifying “CCs”: Community, complementary and local currencies’ types and generations. International Journal of Community Currency Research 15: 4–10. [Google Scholar]
- Blanc, Jérôme. 2018. Les Monnaies Alternatives. Paris: La Découverte. [Google Scholar]
- Březina, David, Dalibor Šafařík, and Petra Hlaváčková. 2013. LM3—Local multiplier in environmental economics. In Public Recreation and Landscape Protection—With Man Hand in Hand…—Conference Proceeding. Brno: Department of Landscape Management FFWT Mendel University in Brno, pp. 77–80. [Google Scholar]
- Christy, Xebax, Dante Edme-Sanjurjo, Mathilde Fois-Duclerc, Yannick Lung, Julien Milanesi, Fabienne Pinos, Nicolas Piriou, and Txomin Poveda. 2019. The Impact of Digitization on the Trajectory of a Complementary Local Currency: The Eusko in the Northern Basque Country. Easy Chair Preprints. Available online: https://easychair.org/publications/preprint/K1MB (accessed on 25 July 2021).
- Dama, Caroline. 2019. Red Cross’ Impact Continues Post Cash. Grassroots Economics. Available online: https://www.grassrootseconomics.org/post/red-cross-impact-continues-post-cash (accessed on 7 July 2021).
- de França Filho, Genauto Carvalho, Jeová Torres Silva Júnior, and Ariádne Scalfoni Rigo. 2012. Solidarity finance through community development banks as a strategy for reshaping local economies: Lessons from Banco Palmas. Revista de Administração 47: 500–15. [Google Scholar] [CrossRef][Green Version]
- De La Rosa, Josep Lluís, and James Stodder. 2015. On Velocity in several Complementary Currencies. International Journal of Community Currency Research 19: 114–27. [Google Scholar]
- Devarajan, Shantayanan, Marcelo M. Giugale, Helene Ehrhart, Tuan Minh Le, and Huong Nguyen. 2013. The Case for Direct Transfers of Resource Revenues in Africa. Social Science Research Network 333: 2364568. [Google Scholar] [CrossRef][Green Version]
- Dobson, Ross V.G. 1993. Bringing the Economy Home from the Market. Montreal: Black Rose Books. [Google Scholar]
- E-dinheiro Brasil. n.d. Available online: http://edinheirobrasil.org/rede-brasileira-bancos-comunitarios/# (accessed on 20 June 2021).
- Fare, Marie, Carlos de Freitas, and Camille Meyer. 2015. Territorial development and Community currencies: Symbolic meanings in Brazilian Community development banks. IJCCR. Available online: https://ijccr.net/2015/02/25/territorial-development/ (accessed on 1 March 2021).
- Gentilini, Ugo, Mohamed Almenfi, and Pamela Dale. 2020. Social Protection and Jobs Responses to COVID-19: A Real-Time Review of Country Measures. World Bank—Working Paper. Available online: https://documents1.worldbank.org/curated/en/467521607723220511/pdf/Social-Protection-and-Jobs-Responses-to-COVID-19-A-Real-Time-Review-of-Country-Measures-December-11-2020.pdf (accessed on 7 July 2021).
- Gerard, François, Joana Naritomi, and Joana Silva. 2021. Cash Transfers and Formal Labor Markets—Evidence from Brazil. Available online: https://www.dropbox.com/s/kano5q63269623i/CT_GerardNaritomiSilva.pdf?dl=0 (accessed on 10 July 2021).
- Gerdesmeier, Claus Brand Dieter, and Barbara Rofia. 2002. Estimating the trend of M3 Income Velocity underlying the Referece Value for Monetary Growth. ECB Occasional Paper Series N.3. Available online: https://www.ecb.europa.eu/pub/pdf/scpops/ecbocp3.pdf?e93b61ea2210d7d401c1d59a87300482 (accessed on 5 June 2021).
- Gómez, Georgina, and Bert Helmsing. 2008. Selective Spatial Closure and Local Economic Development: What Do We Learn from the Argentine Local Currency Systems? World Development 36: 2489–511. [Google Scholar] [CrossRef]
- Gómez, Georgina, and Paolo Dini. 2016. Making sense of a crank case: Monetary diversity in Argentina (1999–2003). Cambridge Journal of Economics 40: 1421–37. [Google Scholar] [CrossRef]
- Gómez, Georgina. 2019. For the Policy Maker: When and How Is Monetary Plurality an Option? In Monetary Plurality in Local, Regional and Global Economies. Abingdon and New York: Routledge, pp. 275–87. ISBN 978-1-138-28028-1. [Google Scholar]
- Gonzalez, Lauro, Adrian Kemmer Cernev, Marcelo Henrique de Araujo, and Eduardo H. Diniz. 2020. Moedas complementares digitais e políticas públicas durante a crise da COVID-19. Revista de Administração Pública 54: 1146–60. Available online: http://bibliotecadigital.fgv.br/ojs/index.php/rap/article/view/81909 (accessed on 20 July 2021). [CrossRef]
- Groppa, Octavio. 2013. Complementary currency and its impact on the economy. International Journal of Community Currency Research 17: 45–57. [Google Scholar]
- Gyeonggi Province Basic Income International Conference. 2021. Necessity of Basic Income as Universal Expenditure in COVID-19 Pandemic and Social Transformation. Keynote Speech by Josepth Stiglitz at The 3rd Gyeonggi Province Basic Income International Conference on 15-04-2021. Available online: https://www.youtube.com/watch?v=pQO0_KdTEEM&t=641s (accessed on 3 May 2021).
- Hines, C. 2000. Localization: A Global Manifesto. London: Earthscan Earth Scan from Routledge. [Google Scholar]
- Instituto Banco Palmas | Como Implantar Um Banco Comunitário. n.d. Available online: https://www.institutobancopalmas.org/como-implantar-um-banco-comunitario/ (accessed on 27 May 2021).
- Kapur, Devesh, Partha Mukhopadhyay, and Arvind Subramanian. The Case for Direct Cash Transfers to the Poor. Economic and Political Weekly 43: 37–43.
- Martín Belmonte, Susana. 2019. REC Citizen Currency—Final Report—B-MINCOME Project. NOVACT. p. 42. Available online: https://rec.barcelona/wp-content/uploads/2020/02/informe-final_EN_compressed.pdf (accessed on 25 July 2021).
- Martínez, Jabier, and Ignacio Zubiri. 2014. Los multiplicadores de la política fiscal en España. Papeles de Economía Española 139: 174–98. [Google Scholar]
- Mitchell, Andrew, and Mark Lemon. 2019. Using the LM3 method to evaluate economic impacts of an on-line retailer of local food in an English market town. Local Economy 34: 51–67. [Google Scholar] [CrossRef]
- Myrdal, Gunnar. 1957. Economic Theory and Underdeveloped Regions. London: Duckworth. [Google Scholar]
- OCHA. 2016. Humanitarian Development Nexus. Available online: https://www.unocha.org/es/themes/humanitarian-development-nexus (accessed on 15 July 2021).
- Persky, Joseph, David Ranney, and Wim Wiewel. 1993. Import Substitution and Local Economic Development. Economic Development Quarterly 7: 18–29. [Google Scholar] [CrossRef]
- Pike, Andy, Andrés Rodríguez-Pose, and John Tomaney. 2016. Local and Regional Development, 2nd ed. London: Routledge. [Google Scholar]
- Sacks, Justin. 2002. The Money Trail: Measuring Your Impact on the Local Economy Using LM3. London: New Economics Foundation. [Google Scholar]
- Scalfoni Rigo, Ariádne. 2014. Moedas Sociais e Bancos Comunitários no Brasil: Aplicações e Implicações, Teóricas e Práticas. Ph.D. Dissertation, University Federal of Bahia, Salvador, Brazil. [Google Scholar]
- Segura Bonet, Marta, and Lluís Muns Terrats. 2019. La importancia de conocer la trazabilidad de las monedas complementarias. International Journal of Community Currency Research 23: 63–70. [Google Scholar] [CrossRef]
- Shaefer, H Luke, Kathryn Edin, Vincent Fusaro, and Pinghui Wu. 2019. The Decline of Cash Assistance and the Well-Being of Poor Households with Children. Social Forces 98: 1000–25. [Google Scholar] [CrossRef]
- Silovská, Hana Černá, and Jana Kolaříková. 2016. Observation and assessment of local economic development with regard to the application of the local multiplier. European Planning Studies 24: 1978–94. [Google Scholar] [CrossRef]
- Stodder, James. 2000. Reciprocal exchange networks: Implications for macroeconomic stability. Paper presented at 2000 IEEE Engineering Management Society, EMS—2000 (Cat. No.00CH37139), Albuquerque, NM, USA, August 15; pp. 540–45. [Google Scholar] [CrossRef]
- Stodder, James. 2009. Complementary credit networks and macroeconomic stability: Switzerland’s Wirtschaftsring. Journal of Economic Behavior & Organization 72: 79–95. [Google Scholar] [CrossRef]
- Stodder, James, and Bernard Lietaer. 2016. The Macro-Stability of Swiss WIR-Bank Credits: Balance, Velocity, and Leverage. Comparative Economic Studies 58: 570–605. [Google Scholar] [CrossRef]
- Thatcher, Jenny, and Liz Sharp. 2008. Measuring the local economic impact of National Health Service procurement in the UK: An evaluation of the Cornwall Food Programme and LM3. Local Environment 13: 253–70. [Google Scholar] [CrossRef]
- This Time Is Different (TTID). 2018a. The Curious Case of Low U.S. Money Velocity. This Time It Is Different. Available online: https://thistimeitisdifferent.com/us-money-velocity-may-2018 (accessed on 7 July 2021).
- This Time Is Different (TTID). 2018b. Euro Area or Eurozone Money Velocity Seems to Be Shockingly Low. This Time It Is Different. Available online: https://thistimeitisdifferent.com/eurozone-money-velocity-august-2018 (accessed on 7 July 2021).
- Williams, Colin C. 1996. Local Purchasing Schemes and Rural Development: An Evaluation of Local Exchange and Trading Systems (LETS). Journal of Rural Studies 12: 231–44. [Google Scholar] [CrossRef]
- Yin, Robert K. 2011. Case-Study Research: Design and Methods, 3rd ed. Thousand Oacks: SAGE Publications, Inc. [Google Scholar]
Publisher’s Note: MDPI stays neutral with regard to jurisdictional claims in published maps and institutional affiliations. |
© 2021 by the authors. Licensee MDPI, Basel, Switzerland. This article is an open access article distributed under the terms and conditions of the Creative Commons Attribution (CC BY) license (https://creativecommons.org/licenses/by/4.0/).