Article

The Behavioural Aspects of Financial Literacy

1
Faculty of Business, University of Wollongong in Dubai, Dubai P.O. Box 20183, United Arab Emirates
2
Researchers Sans Frontiers, Dubai P.O. Box 73000, United Arab Emirates
3
Postgraduate Business, Faculty of Health, Education, and Environment, Toi Ohomai Institute of Technology, Rotorua 3046, New Zealand
4
UniSA Business, University of South Australia, Adelaide 5000, Australia
5
Faculty of Humanities and Social Sciences, Khalifa University of Science and Technology, Abu Dhabi P.O. Box 127788, United Arab Emirates
6
Faculty of Management, Canadian University Dubai, Dubai P.O. Box 117781, United Arab Emirates
*
Author to whom correspondence should be addressed.
J. Risk Financial Manag. 2021, 14(9), 395; https://doi.org/10.3390/jrfm14090395
Submission received: 7 June 2021 / Revised: 13 August 2021 / Accepted: 18 August 2021 / Published: 25 August 2021
(This article belongs to the Special Issue Financial Literacy and Financial Inclusion)

Abstract

:
In this paper, we investigate the contribution of behavioural characteristics to the financial literacy of UAE residents after controlling for demographic factors. Specifically, we test the relationship between financial literacy and behavioural biases such as representativeness, self-serving, overconfidence, loss aversion, and hindsight bias. Using data collected through survey questionnaires, we apply the methodology developed by the Organization of Economic Co-operation and Development (OECD) to compute financial literacy scores. Our overall results show that all behavioural biases except for overconfidence bias are positively related to financial literacy. Furthermore, some biases exhibit a stronger quantitative relationship with financial literacy than others. For example, hindsight bias displays the strongest link to financial literacy, followed by self-serving bias. The weakest but still statistically significant effect is loss aversion bias. Although biases, in general, have negative connotations, behavioural biases appear to be related to higher levels of financial literacy.

1. Introduction

Research on behavioural finance (e.g., Baker et al. 2019) suggests that individuals, investors, and markets do not always act rationally and systematically deviate from optimal financial decision making. Behavioural finance draws insights, mainly from psychology and finance; considers financial behaviour in various market settings that may deviate from standard suppositions; and indicates that individual and market decisions are sometimes inefficient (Yoong and Ferreira 2013). Behavioural biases are often the driving force behind an individual’s financial inconsistencies. Kahneman and Tversky (1979) suggest that people make irrational decisions under risk and uncertainty and violate axioms of expected utility theory. Financial literacy is the ability to make informed judgments and effective decisions related to using and managing money (Noctor et al. 1992). Therefore, Baker et al. (2019) indicate that there exists a necessity to improve individuals’ behaviour concerning financial products and services. As economic and financial literacy are crucial for sound financial decisions, the impact of education on financial behaviour has increasingly been investigated by academics in recent years. For instance, in the form of financial literacy, education has a significant effect on risk-taking behaviour. Bianchi (2018), for instance, shows that more financially literate households rebalance their portfolios to hold a greater portion of riskier funds within their portfolios. These more literate households are also contrarian investors who rebalance their portfolios toward funds that have experienced relatively lower returns in the past.
According to Baker et al. (2019), only slight evidence is available on how individuals’ financial literacy and various demographic characteristics relate to behavioural biases, except for risk-taking behaviour. Of the studies in this area, Jonsson et al. (2017) show that financial literacy can mitigate disposition biases, while Kiymaz et al. (2016) indicate that overconfidence is related to financial literacy through investor sophistication. Carpena et al. (2019) highlight the limitations of financial education. They show that financial education improves financial awareness and attitudes but fails to improve longer-term behavioural outcomes. However, in conjunction with tailored interventions, financial education helps individuals circumvent behavioural constraints. Financial literacy may play a role in the way individuals react to certain situations within the confines of individuals’ behavioural biases. This point is even more valid in the context of a crisis (see Ramiah 2013), and we propose that individuals may react in a similar way during the novel coronavirus (COVID-19) pandemic.
While the virus outbreak is a human tragedy of many dimensions, its impact on the finance of individuals is alarming. Prior studies have purposefully investigated many scenarios around periods of turmoil, analogous to the COVID-19 outbreak, such as the Global Financial Crisis (GFC). For instance, Klapper et al. (2013) investigate financial literacy and the ability of individuals to deal with macroeconomic shocks. Of specific importance is their main question investigating whether less financially literate individuals can deal with financial crises. Bucher-Koenen and Ziegelmeyer (2014) investigate behavioural characteristics following losses experienced during the GFC. The authors find that households with lower financial literacy are more likely to withdraw entirely from investing in the equity market. This dynamic appears akin to loss aversion bias. We caution the reader from inferring that financial crises cause behavioural biases—empirical evidence does not support or disprove this assumption. We believe that an individual’s behavioural bias exists as an extension of their personality. Irrespective, these biases are easier to identify during potentially traumatic events such as the COVID-19 pandemic. Accordingly, an investigation of the relationships between behavioural biases of individuals, who experienced a financial shock,1 and financial literacy in the context of a crisis is of utmost relevance. Consequently, it is interesting to answer the question: What role do behavioural biases play in improving financial literacy?
Thus, the purpose of this paper is to investigate the effects of behavioural biases on the financial literacy of individuals during the COVID-19 crisis while controlling for demographics factors. The study focuses primarily on five behavioural biases: overconfidence bias, loss aversion bias, hindsight bias (i.e., overreaction to new information), representativeness bias, and self-serving bias and their role in explaining the financial literacy of individuals in times of a crisis.
Research has shown that overconfident individuals (e.g., investors) have a strong faith in their intuitive reasoning, abilities, and judgments (Pompian 2006). Barber and Odean (2000) find that individual investors often exhibit overconfidence bias, which leads to excessive trading and poor performance. Camerer et al. (1989) show that individuals who exhibit hindsight bias tend to be overconfident and overreact to new information. Chen et al. (2007) find that investors extrapolate recent past returns of stocks they purchase. This evidence indicates that investors tend to exhibit representativeness bias by extrapolating the results of past return stock they purchase to recent investments while also being loss averse and expecting to earn higher returns without considering associated risks (Chen et al. 2007).
Although research has investigated the impact of behavioural biases on the performance of investors and individuals, little research exists on how financial literacy relates to behavioural biases or demographics. Baker et al. (2019), for instance, focus on an everyday context rather than a crisis. There has also been little investigation relating to an emerging market, such as the UAE. The UAE is the site under study as it is an emerging market that is transitioning gradually toward a developed country status. The UAE has a population of 10 million and a GDP of USD 371 billion (GDP per capita of USD 37,500) (Statista 2021), and since 1997, the UAE dirham has been pegged to the US dollar at a rate of AED 3.6725 per USD 1. The COVID-19 pandemic has had severe economic and financial consequences on the UAE economy and the population. In addition, individuals within the UAE have access to retirement funds and interact with businesses domestically and internationally. This access and these connections also expose the UAE to crises such as the COVID-19 pandemic. More importantly, the UAE is among the first countries that (1) implemented a stimulus package and (2) opened its economy with social distancing rules.
Our findings show that all significant variables (hindsight, self-serving, loss aversion, and representativeness bias) have a positive statistical relationship with financial literacy. This trend indicates that respondents with any of these behavioural biases have a higher financial literacy than the respondents who do not exhibit them. Overconfidence bias does not show a significant relationship with financial literacy. We note, and reiterate, that these biases are likely to be present in non-crisis periods; however, crisis periods provide a natural event that allows us to measure the biases. Given that losses and financial hardship are likely to be prevalent during crisis periods, measuring biases such as loss aversion and hindsight biases, amongst others, is easier to detect. The ability to detect these biases provides stakeholders, policymakers, and risk managers with information about the resilience or fragility of the population which will, in turn, provide information on methods to recover from crises such as the COVID-19 pandemic.
The paper is structured as follows. The following section reviews the relevant literature involving the behavioural biases of individuals and financial literacy, followed by the research design and the questionnaire in Section 3. Section 4 presents the empirical findings, followed by a conclusion.

2. Literature Review

2.1. Financial Literacy

Financial behaviour and the financial attitude of individuals help determine their financial decisions in terms of financial management, personal financial budgeting, or how individuals decide investment strategies. Prior research demonstrates that financial attitude positively affects financial literacy (Ameliawati and Setiyani 2018; OECD 2013), financial planning (Agarwal et al. 2015; Atkinson and Messy 2012; Lusardi and Mitchell 2011), and a higher tendency to save (Agarwal et al. 2015; Atkinson and Messy 2012).
Understanding how people make financial decisions can advance understanding of how people prepare and recover from adverse events such as the COVID-19 pandemic. This section presents the financial planning literature covering retirement planning, superannuation, and insurance and highlights the importance of financial and economic knowledge contributing to sound financial decisions. In addition, we consider the literature on the demographic factors (gender, age, and income level) that influence these decisions.
Financial literacy and its importance in achieving financial wellbeing have been widely investigated, particularly for retirement planning. For example, Bernheim and Garrett (2003) state that a positive change in financial literacy positively affects retirement planning. Lusardi and Mitchell (2007) demonstrate that inefficient retirement planning can be a result of insufficient knowledge of economics and finance, which also confirms the findings of van Rooij et al. (2007) and Agnew et al. (2012). The most salient factors affecting retirement planning are personal finance (e.g., tax, savings pattern, estate planning) and retirement (e.g., longevity and health risk, insurance coverage, risk of bankruptcy, and clients who stay home instead of moving to care centres). Moreover, risk (i.e., inflation, debt management, market risk, and liquidity risk) and investments (i.e., diversification, asset allocation, clear financial goals, and number of meetings with clients) (Chowk et al. 2016; Delpachitra and Beal 2002; Frank 1935; Ng et al. 2011; van Rooij et al. 2011) also affect retirement planning decisions. These studies document the various factors that are important when conducting any analysis in financial planning.
Many countries around the world use pension funds as a valuable type of retirement plan whereby employers make contributions on the employees’ behalf. These funds are distributed to employees when they retire. The US, for instance, has 401(k) pension plans as well as traditional pension plans, generally consisting of defined benefit plans or a defined contribution plan. In contrast, a defined contribution plan bases payments on the employee’s balance at retirement, which is a function of the employer’s employee’s monetary contributions. The UAE has similar characteristics in that there are fund managers that manage employees’ funds. The employee’s retirement benefits are called a gratuity which the employer holds as a liability until retirement. Australia also has a very similar structure to the US (and the UAE). More importantly, there is a large body of academic research into Australian retirement funds, namely superannuation funds, which cover several aspects of financial literacy. The fundamental elements associated with pension plans are categories of funds (ANZ Survey of Adult Financial Literacy in Australia 2008; Newell 2006; Rice and McEwin 2002), taxation (ANZ Survey of Adult Financial Literacy in Australia 2008; Ingles 2009; Rothman 2003), safety and security (Clare 2013; Clark et al. 2019; Morling and Subbaraman 1995; Rothman 2003, 2011), superannuation fees and disclosures (Finch 2005; Rice and McEwin 2002), superannuation contributions (Clare 2013; Fernandez 2007; MLC 2012; Rothman 2011), and relevant information sources (ANZ Survey of Adult Financial Literacy in Australia 2008).
Gallery (2002) claims that having insufficient information and the difficulty of understanding the architecture of the financial planning systems are why the public is unable to select a fund. Other studies, such as Fry et al. (2007), suggest that it is highly probable that people with inadequate financial knowledge change pension funds, ignore the returns offered by superannuation funds, and are uninformed of the market risk from changing their funds. Babiarz and Robb (2014) find that more financially knowledgeable and confident households are more likely to maintain emergency funds, supporting the growing literature on the relationship between financial knowledge and economic behaviour.
Furthermore, financial literacy is related to education level, profession, homeownership, health, and age, as shown by Xue et al. (2019). While Xue et al. (2019) document a level of financial illiteracy in elderly citizens, people 18 to 24 years are unaware of how many funds they hold in their pension plan (ANZ Survey of Adult Financial Literacy in Australia 2008). Following these examples, the extensive body of research into Australian superannuation funds and the similarities between Australian and UAE funds indicate expected associations between individuals’ financial literacy and their behaviour concerning UAE retirement funds.
According to Lin et al. (2019), it is essential to consider the frequency of meetings with advisors, social networks, publications, workshops, and any other additional information. Gender is a salient demographic factor as per the studies of Jefferson (2005) and Noone et al. (2010), who suggest that household responsibilities, low levels of education, and earnings cause inadequate retirement planning in women. Bernasek and Shwiff (2001) argue that women are more risk-averse when making investment decisions. Additionally, Grable and Joo (2001) argue that women are more likely to ask for financial advice than men. The above-cited literature highlights demographic factors such as gender, age, education, marital status, residency, and nationality as factors influencing financial literacy. In addition, economic factors can also be influential, such as income, employment status, presence of children in the household making financial decisions, homeownership, and sources of financial advice.

2.2. Behavioural Biases

Another stream of literature worth considering is the behavioural finance literature, arguing that individuals are not always rational. Irrationally acting individuals are more likely to follow what others do and avoid losses more than seek gains. They also believe in their abilities during good times while blaming external factors for their failures, explaining errors by heuristics and behavioural biases (Chowk et al. 2016; Tversky and Kahneman 1974; Kahneman and Tversky 1979). Chowk et al. (2016) argue that the prevalent financial biases include loss-aversion, self-serving bias, representativeness, and overconfidence.
Behavioural biases are not necessarily negative. In some circumstances, they may lead to better outcomes. For example, loss aversion bias (i.e., the perception of loss by individuals as psychologically or emotionally more severe than an equivalent gain) deters risk-taking, leading to savings (Kahneman and Tversky 1979). Studies of loss aversion bias (Kahneman and Tversky 1979; Rabin 1998; Shalev 1996) show that the pain of losing outweighs the satisfaction of an equal gain. This imbalance leads to a tendency of evading losses over seeking gains. Similarly, Guthrie (2003) shows that people tend to seek risk in order for them to avoid a loss, but it is less probable for them to consider a risky strategy to achieve or increase gains.
Another well-documented bias is self-serving bias, which attributes personal factors to positive outcomes but external, situational factors to adverse outcomes (Kahneman and Tversky 1972). Miller and Ross (1975) and Zuckerman (1979) classify the factors people attribute their success or failure into either internal or external factors. Self-serving bias occurs when an individual blames the failure on factors outside their control but attributes the success to their skills and abilities. Daniel et al. (1998) and Malmendier and Tate (2008) show that this bias results in (1) under- and over-reaction in the securities market, (2) poor acquisition decisions, (3) an over-reliance on debt financing, (4) an unnecessary increase in stock re-purchases, and (5) small and infrequent dividend payouts. Mezulis et al. (2004) argue that self-serving bias is the most common bias among individuals.
A common interpretation of representativeness bias defined by Grether (1980), Barberis et al. (1998), Kahneman and Tversky (1979), and Tversky and Kahneman (1974) is that people displaying this bias tend to see and consider patterns that have no fundamental basis while ignoring the probabilities associated with the scenario. Moreover, as Mitchell and Utkus (2004) indicated, an essential element of this bias is the tendency to change an arrangement when new information is available while disregarding previous knowledge related to the choice, especially when the decision is hard.
Kahneman and Tversky’s (1979) study on availability and representativeness highlighted scenarios whereby people convince themselves, after an event, that they accurately predicted the scenario before it happened. This behavioural trait is known as hindsight bias. Individuals suffering from this bias tend to use the phrase knew-it-all-along. Fischhoff (1975), Fischhoff and Beyth (1975), and Wood (1978) describe this bias as the tendency for individuals to change their perception once they already know an outcome. In recent studies, Chelley-Steeley et al. (2015) show that individuals exhibit greater hindsight bias when they earn more in a financial market-oriented environment. The authors also suggest that better investment performance may result in increased hindsight bias which, in turn, may also produce a degree of overconfidence. Hindsight bias is also prevalent in Australian Independent Director roles, where bias influences the evaluation of these directors’ performance (Bryce et al. 2021). As such, hindsight bias is prevalent in many settings, from ordinary households to company boardrooms.
As suggested previously, Baker et al. (2019) indicate that slight evidence exists on how financial literacy relates to behavioural biases. This slight evidence entails recent studies into the disposition effect (Jonsson et al. 2017), overconfidence (Kiymaz et al. 2016), and tailored interventions aimed at helping individuals circumvent behavioural constraints (Carpena et al. 2019). Given this dearth of literature and the notion that financial literacy helps individuals recover, or mitigate, from potentially traumatic experiences, this study aims to add to the literature on financial literacy and behavioural biases within the context of the COVID-19 pandemic. Based on the existing literature and the highlighted literature gap, we investigate these behavioural biases concerning individuals and household financial recovery from the COVID-19 pandemic in this paper. This paper examines five behavioural biases: representativeness, self-serving, overconfidence, loss aversion, and hindsight.

3. Research Design

3.1. Questionnaire

We use a similar methodology to that used by Asbi et al. (2020), Chowk et al. (2016), Greer et al. (2000), Linsky (1975), Ramiah et al. (2014, 2016), Sudman et al. (1996), and Gerth et al. (2021) to develop our questionnaire. Following the ethics approval from the American University of Dubai, we interviewed 11 UAE households financially affected by the pandemic to align the prior literature with the effects of the COVID-19 pandemic. This exercise was fruitful in that we were able to: (1) identify charitable programs that emerged during the pandemic (COVID-19 appeal, Community Solidarity Fund against COVID-19, and Together We Are Good program); (2) confirm the various relief packages offered by UAE banks; (3) identify that the lockdown period turned into a forced savings mechanism; (4) understand that seasonality adds to the resilience of particular businesses; (5) recognise that online platforms acted as a revenue stream; and (6) identify travel and leisure as a loss not documented in the literature.
The interviews with these 11 UAE households were crucial to the extent that they identified missing elements in our original, pilot questionnaire. Incorporating refinements gleaned from interviews, a comprehensive questionnaire was developed and used for data collection.2 Due to the social distancing rule imposed during the pandemic period, the traditional face-to-face data collection method was not appropriate due to the risk of infection. Consequently, we advertised the survey via online social media platforms such as LinkedIn, Facebook, WhatsApp, university portals, and emails. The data was collected from interested individuals through a survey platform facilitated by SurveyMonkey. We had over 1500 views on LinkedIn immediately after posting the questionnaire. The interested parties were university professors, research houses, banks, corporate finance specialists, business strategists, salespersons, portfolio managers, and many others. The quick response (QR) code reader seems to have made it easier and more time-efficient for respondents to complete the survey using their smartphones.
Our methodological approach differs from the above-cited papers. We used a snowballing sampling approach to send emails to several UAE residents from our mailing lists. Some of the emails involved inviting the recipients to participate in the survey. In contrast, another stream of emails requested that the recipients forward the link to other people they suspect have experienced losses from the pandemic. We used similar strategies across the entire online platform to increase our response rate and to remain within our budget. Furthermore, we also shared our questionnaire with a group of final year master’s students at the University of Wollongong in Dubai with the sole purpose of collecting more data and allowing students to use their collected data to conduct analyses related to educational purposes. A caveat of the snowballing approach is that it does not allow us to have a response rate, given that we did not have a targeted audience.
In total, our questionnaire had 11 questions (nine closed-ended and two open-ended), and each question has sub-questions (total of 52 questions). Respondents needed between 20 and 30 min to complete the survey, consistent with earlier studies by Bezhani (2010) and Truell et al. (2002). Based on our survey design, the time commitment of our respondents reflects the quality of the data collected. Question 1 documents factors such as gender, age, income level before COVID-19, marital status, residency status, level of education, the industry of employment, employment status, duration of residency in the UAE, ethnicity, homeownership, number of children living with respondent, household size, who manages household finances, the source of financial advice, and geographical location.
Question 2 aims at collecting information about the various losses encountered during COVID-19 and their corresponding recovery time. The variables for loss are adopted and adapted from Asbi et al. (2020). We added travel and leisure as an extra variable based on the in depth-interviews that we conducted. With regard to the loss variables, respondents answered in both financial terms (UAE dirhams) and on a five-point Likert scale ranging from 1 for “no loss” to 5 for “total loss”. For the recovery variables, we collected data in months. Question 3 deals with health information, while Question 4 covers retirement planning. Questions 5 and 6 capture pension plans and insurance. Although Question 7’s heading states it is the investment section, we use this section to conceal the behavioural biases questions similar to Asbi et al. (2020), Chowk et al. (2016), and Ramiah et al. (2014, 2016). Question 8 is about financial planning and COVID-19. In contrast, Question 9 collects data on various tools to recover from the current pandemic, including our variables of interest—bank relief schemes. The last two questions are open-ended questions around COVID-19 impacts and finance in general.
We adapt questions from Asbi et al. (2020), Chowk et al. (2016), and Ramiah et al. (2014, 2016) to construct questions measuring financial bias, specifically representativeness, self-serving, overconfidence, loss aversion, and hindsight biases. We follow the definitions set by Kahneman and Tversky (1979) and Tversky and Kahneman (1974) and the application of the definitions made by Asbi et al. (2020), Chowk et al. (2016), and Ramiah et al. (2014, 2016).

3.2. Construction of Financial Literacy Scores

The empirical analysis in this paper consists of two parts: (i) the construction of financial literacy scores and (ii) the regression modelling that incorporates the information found in the construction of the financial literacy scores. Regarding the former, the computation of the financial literacy scores follows the methodology developed by OECD/INFE (2015).3 Since our questionnaire differs from the one conducted by the OECD in terms of scope and context, we adapted the score calculations while keeping its primary purpose unchanged. The ultimate aim of the measure is to gauge the respondent’s financial knowledge, financial behaviour, and financial attitude. In order to do so, the score includes five categories: (i) financial advice, (ii) retirement planning, (iii) pension planning, (iv) insurance purchase behaviour, and (v) financial instruments. Through a battery of five-point Likert-scale questions, each category intends to elicit the respondent’s financial characteristics. The maximum achievable score is 105 points. A higher score represents a higher degree of financial literacy, a lower score a lower degree of financial literacy.4
In order to facilitate better understanding and comparability, we follow Morgan and Trinh (2019) and convert the different indicators into a common z-score. Calculation of the score is as follows:
s c o r e z = ( s c o r e s c o r e ¯ ) s c o r e s d
where the variable s c o r e z is the normalised, s c o r e is the non-normalised financial literacy score for each individual, s c o r e ¯ is the average score across all 446 respondents, and the standard deviation of the financial literacy score variable is s c o r e s d .
Figure 1 shows a histogram of the variable s c o r e z . The distribution skews to the positive with the central mass of observations (59%) to the left of the mean. It demonstrates that 59% of the respondents have a degree of financial literacy below average and 41% above average. Furthermore, 23% are one standard deviation, and approximately 3% are two standard deviations, to the right of the mean, a trend indicating that a quarter of all respondents are highly skilled in financial matters.
Figure 2 sub-divides the analysis by gender. It shows that in our sample, compared to men, more women have financial literacy scores at the bottom of the spectrum. Furthermore, relatively more men have higher scores above the average. Nevertheless, women dominate the proportion of respondents who have financial expertise 1.5 standard deviations above the mean.
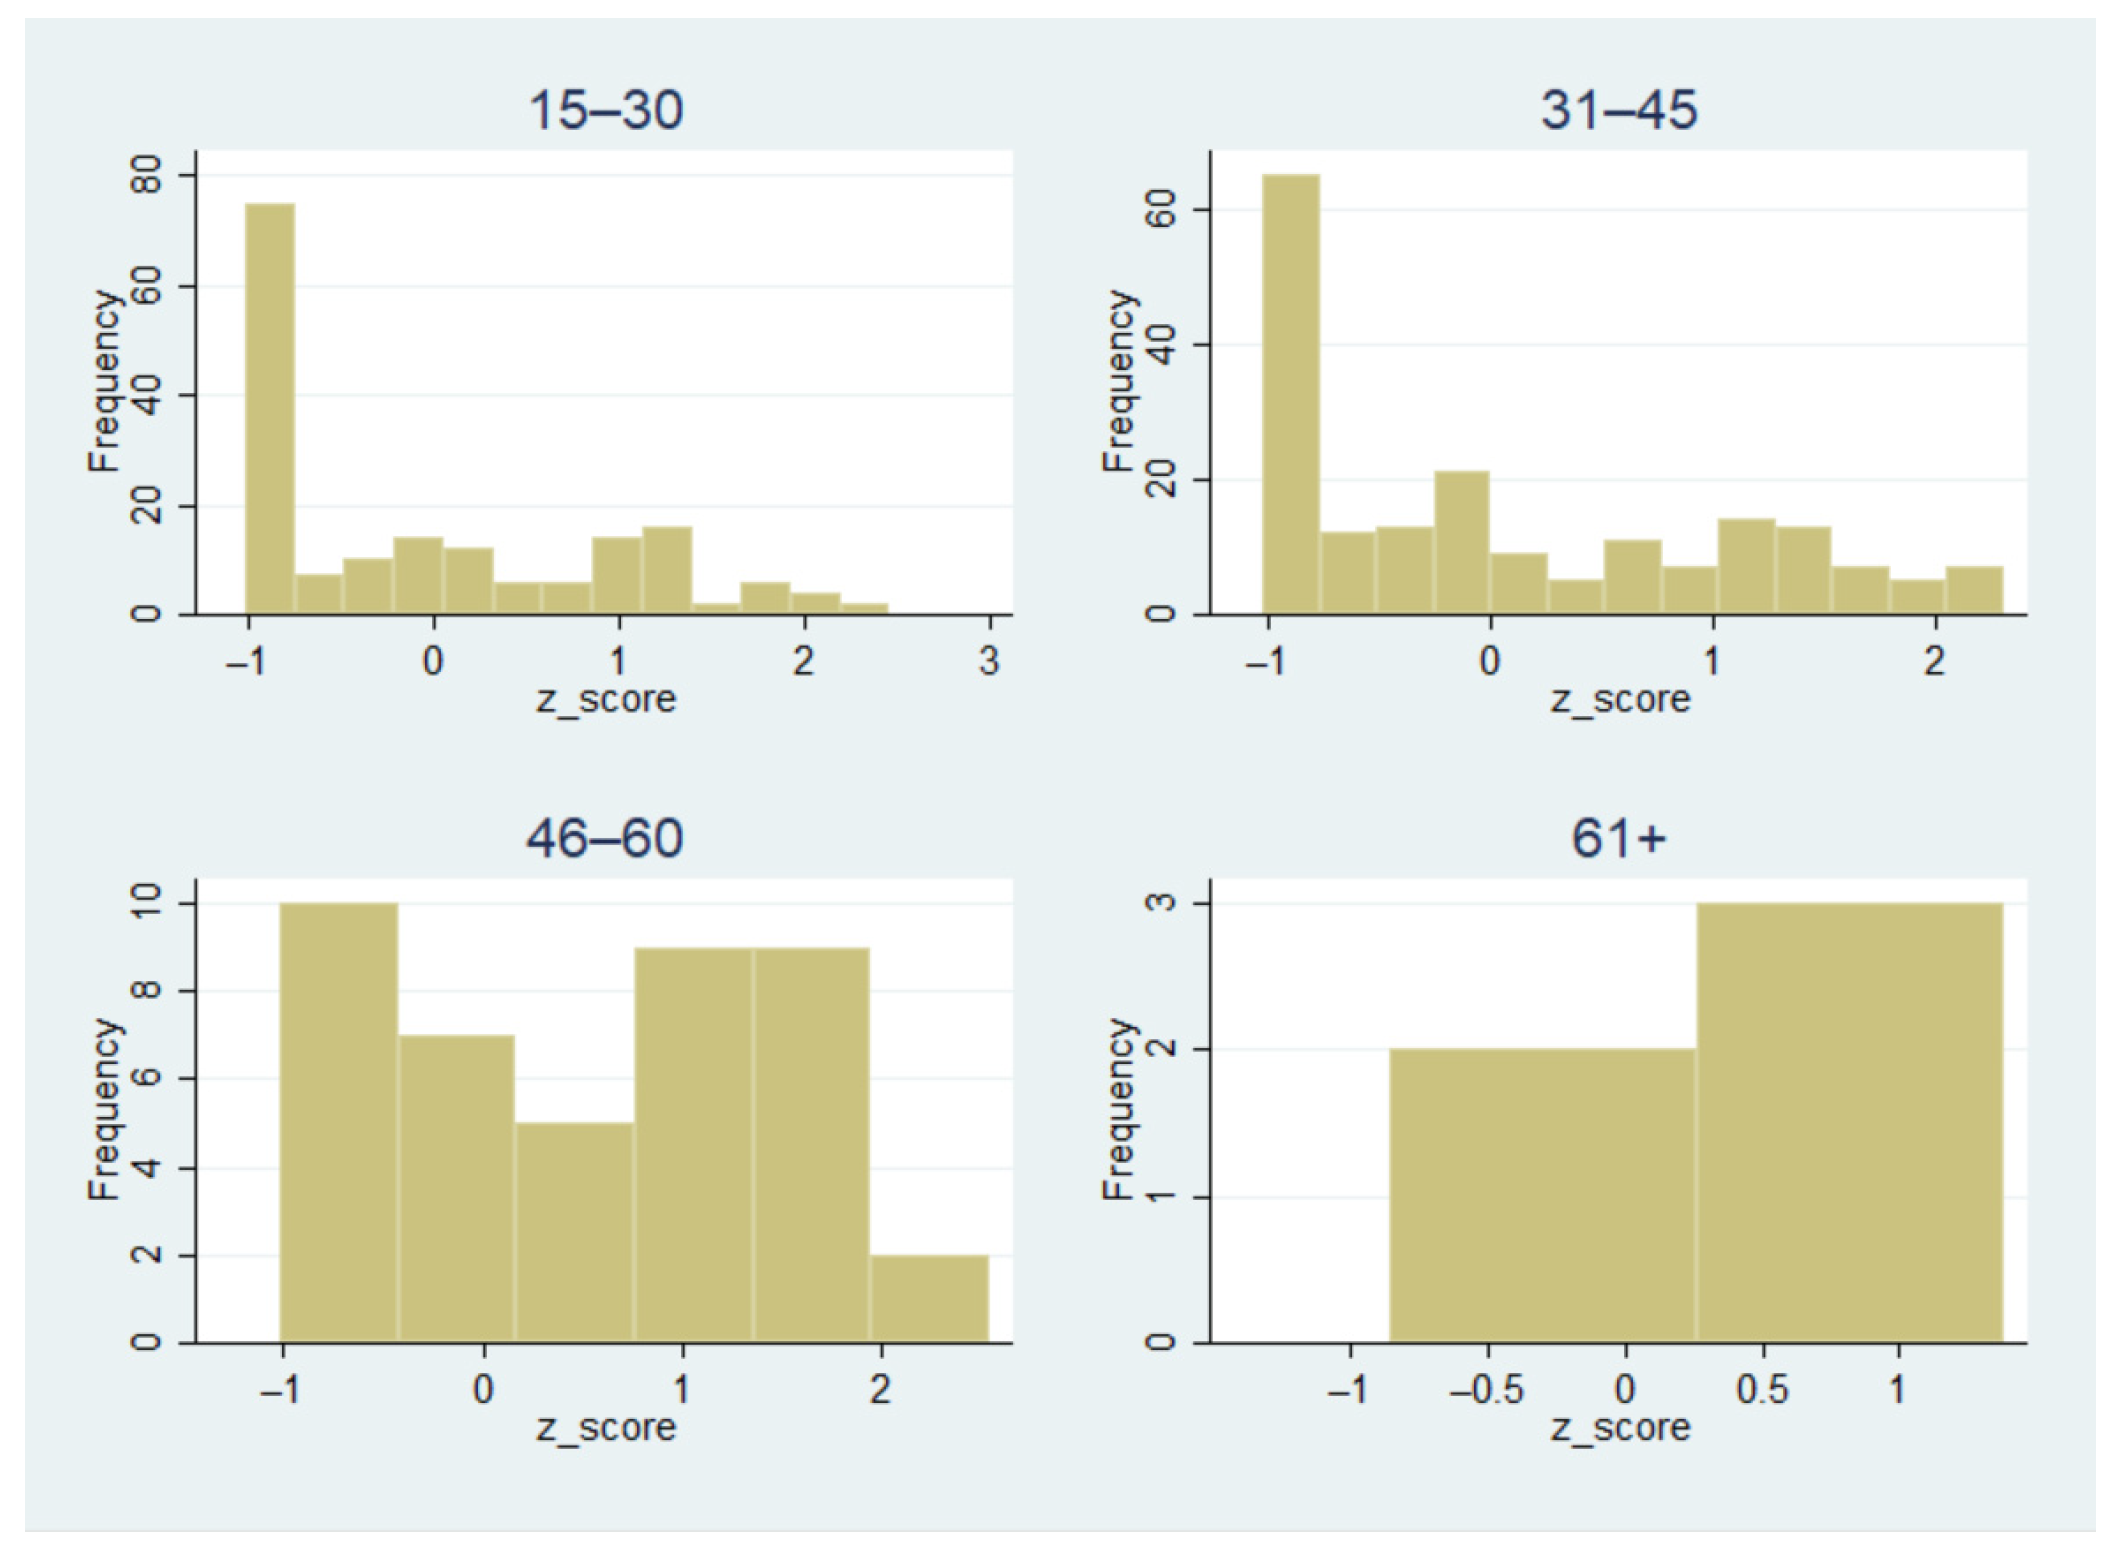
Figure 3 decomposes the financial literacy score into age groups (15–30, 31–45, 46–60, and 61+). It shows that the respondents in the lowest age group exhibit the highest proportion of scores at the bottom of the spectrum. As the age bracket increases, financial literacy increases. The proportion of respondents experiencing a financial literacy score of −1 drops by about two-thirds for the 46–60 group. For the last age group, no respondent exhibits a score as low as −1. This descriptive analysis leads us to believe that younger respondents exhibit a higher degree of financial ignorance than people at a higher age.
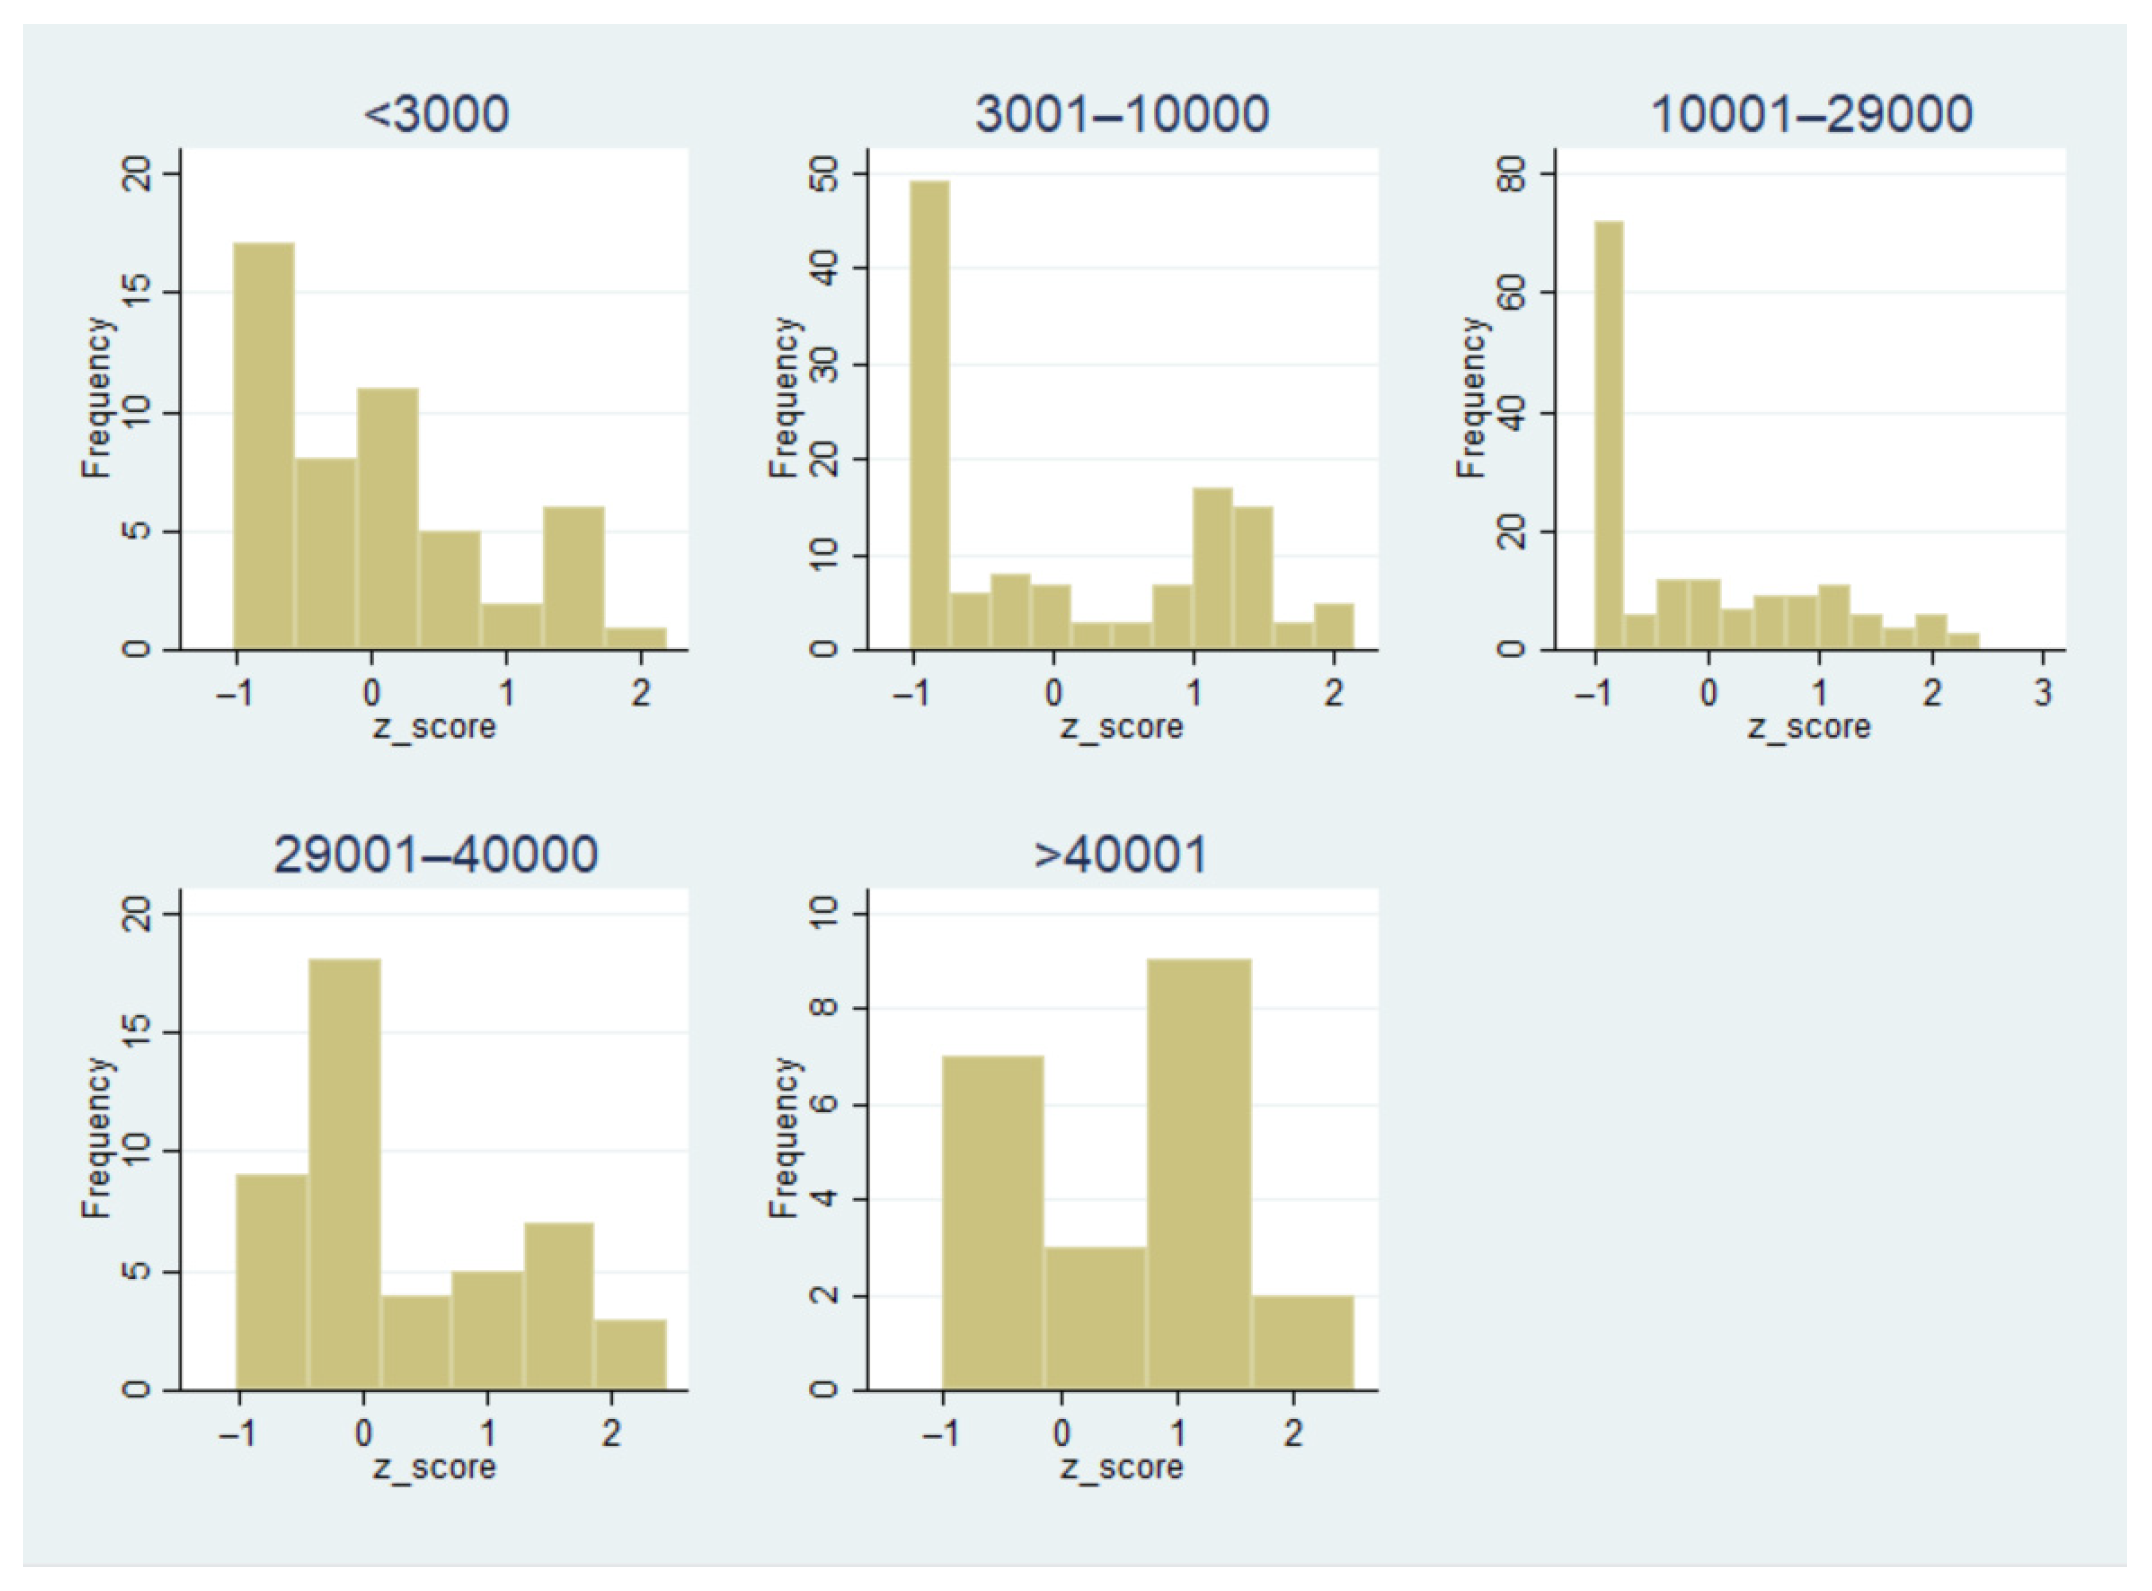
Figure 4 presents financial literacy by income group. It shows that the relationship is not linear. Financial literacy seems to increase until the AED 10,001–29,000 income bracket and after that decreases again. As expected, we find high-income groups exhibit a proportionately lower level of financial ignorance or a higher level of financial literacy.

4. Empirical Results and Discussion

4.1. Descriptive Statistics

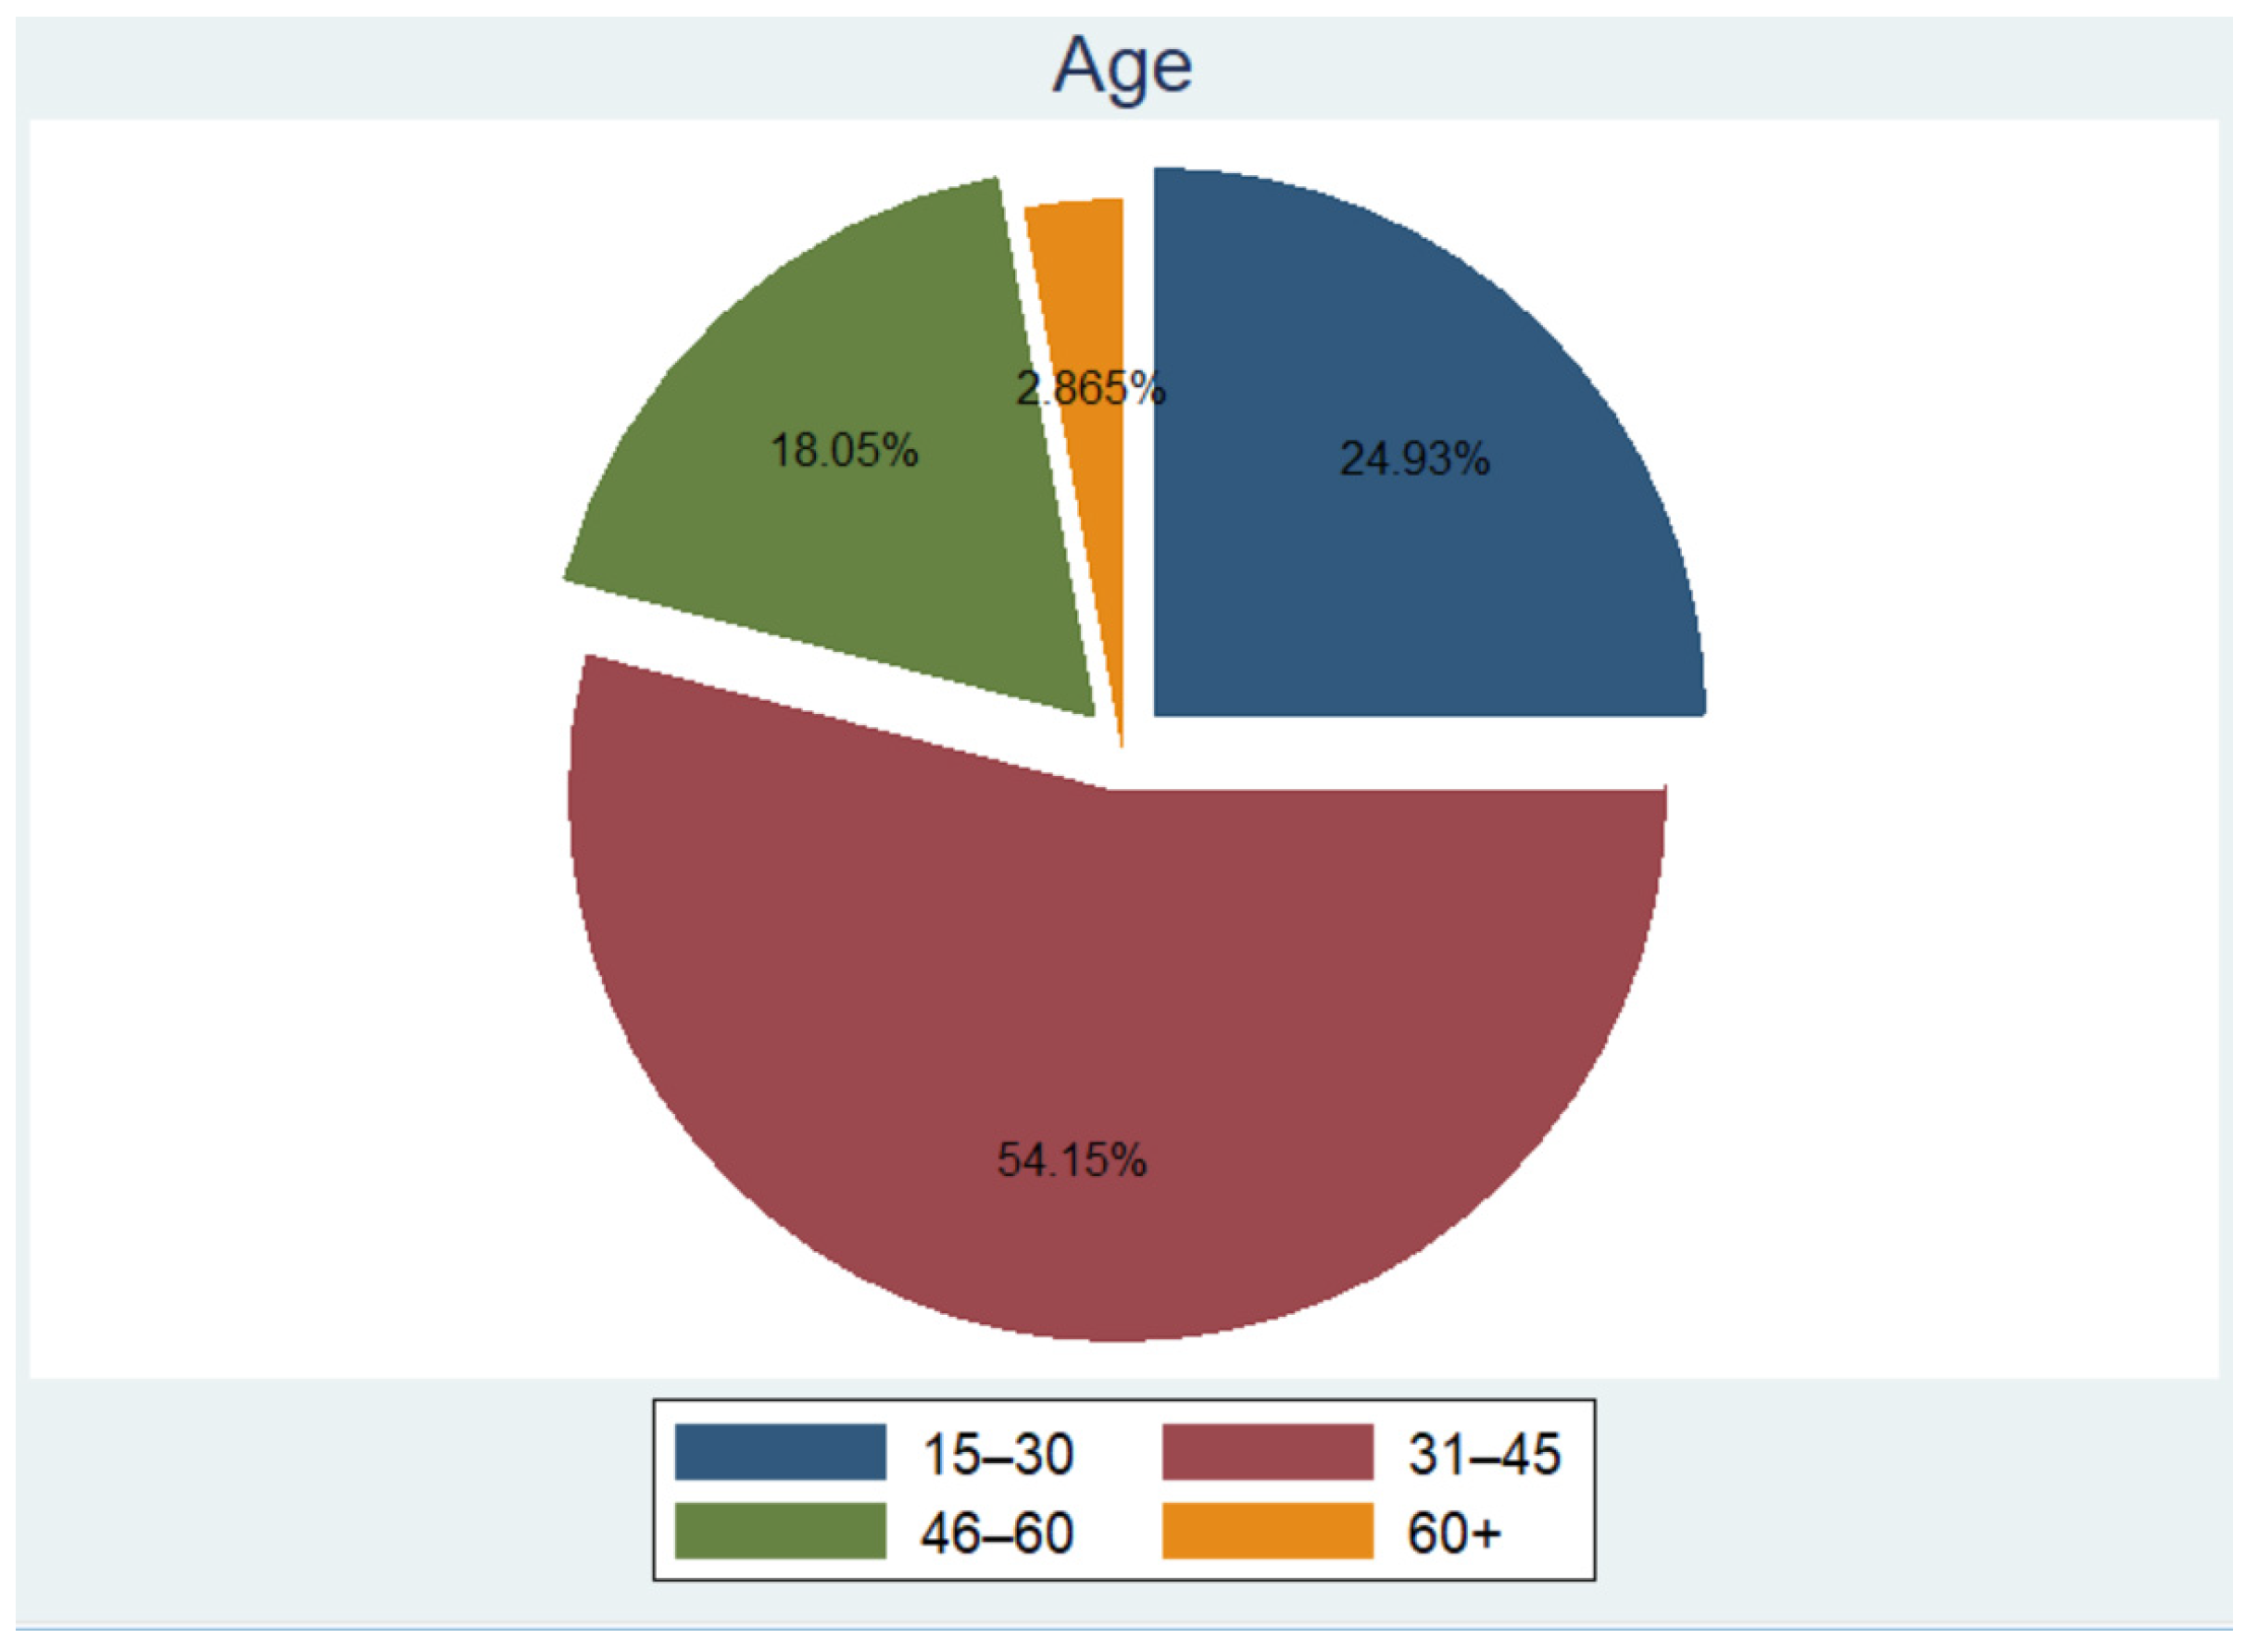
Figure 5 shows the respondent age decomposition. The dataset consists of 446 respondents, out of which 40% are female and 60% male. Regarding age, 54% are between 31 and 45 years. The proportion of under 30 years is 25%, between 46 and 60 years is 18%, and above 60 years is 3%.
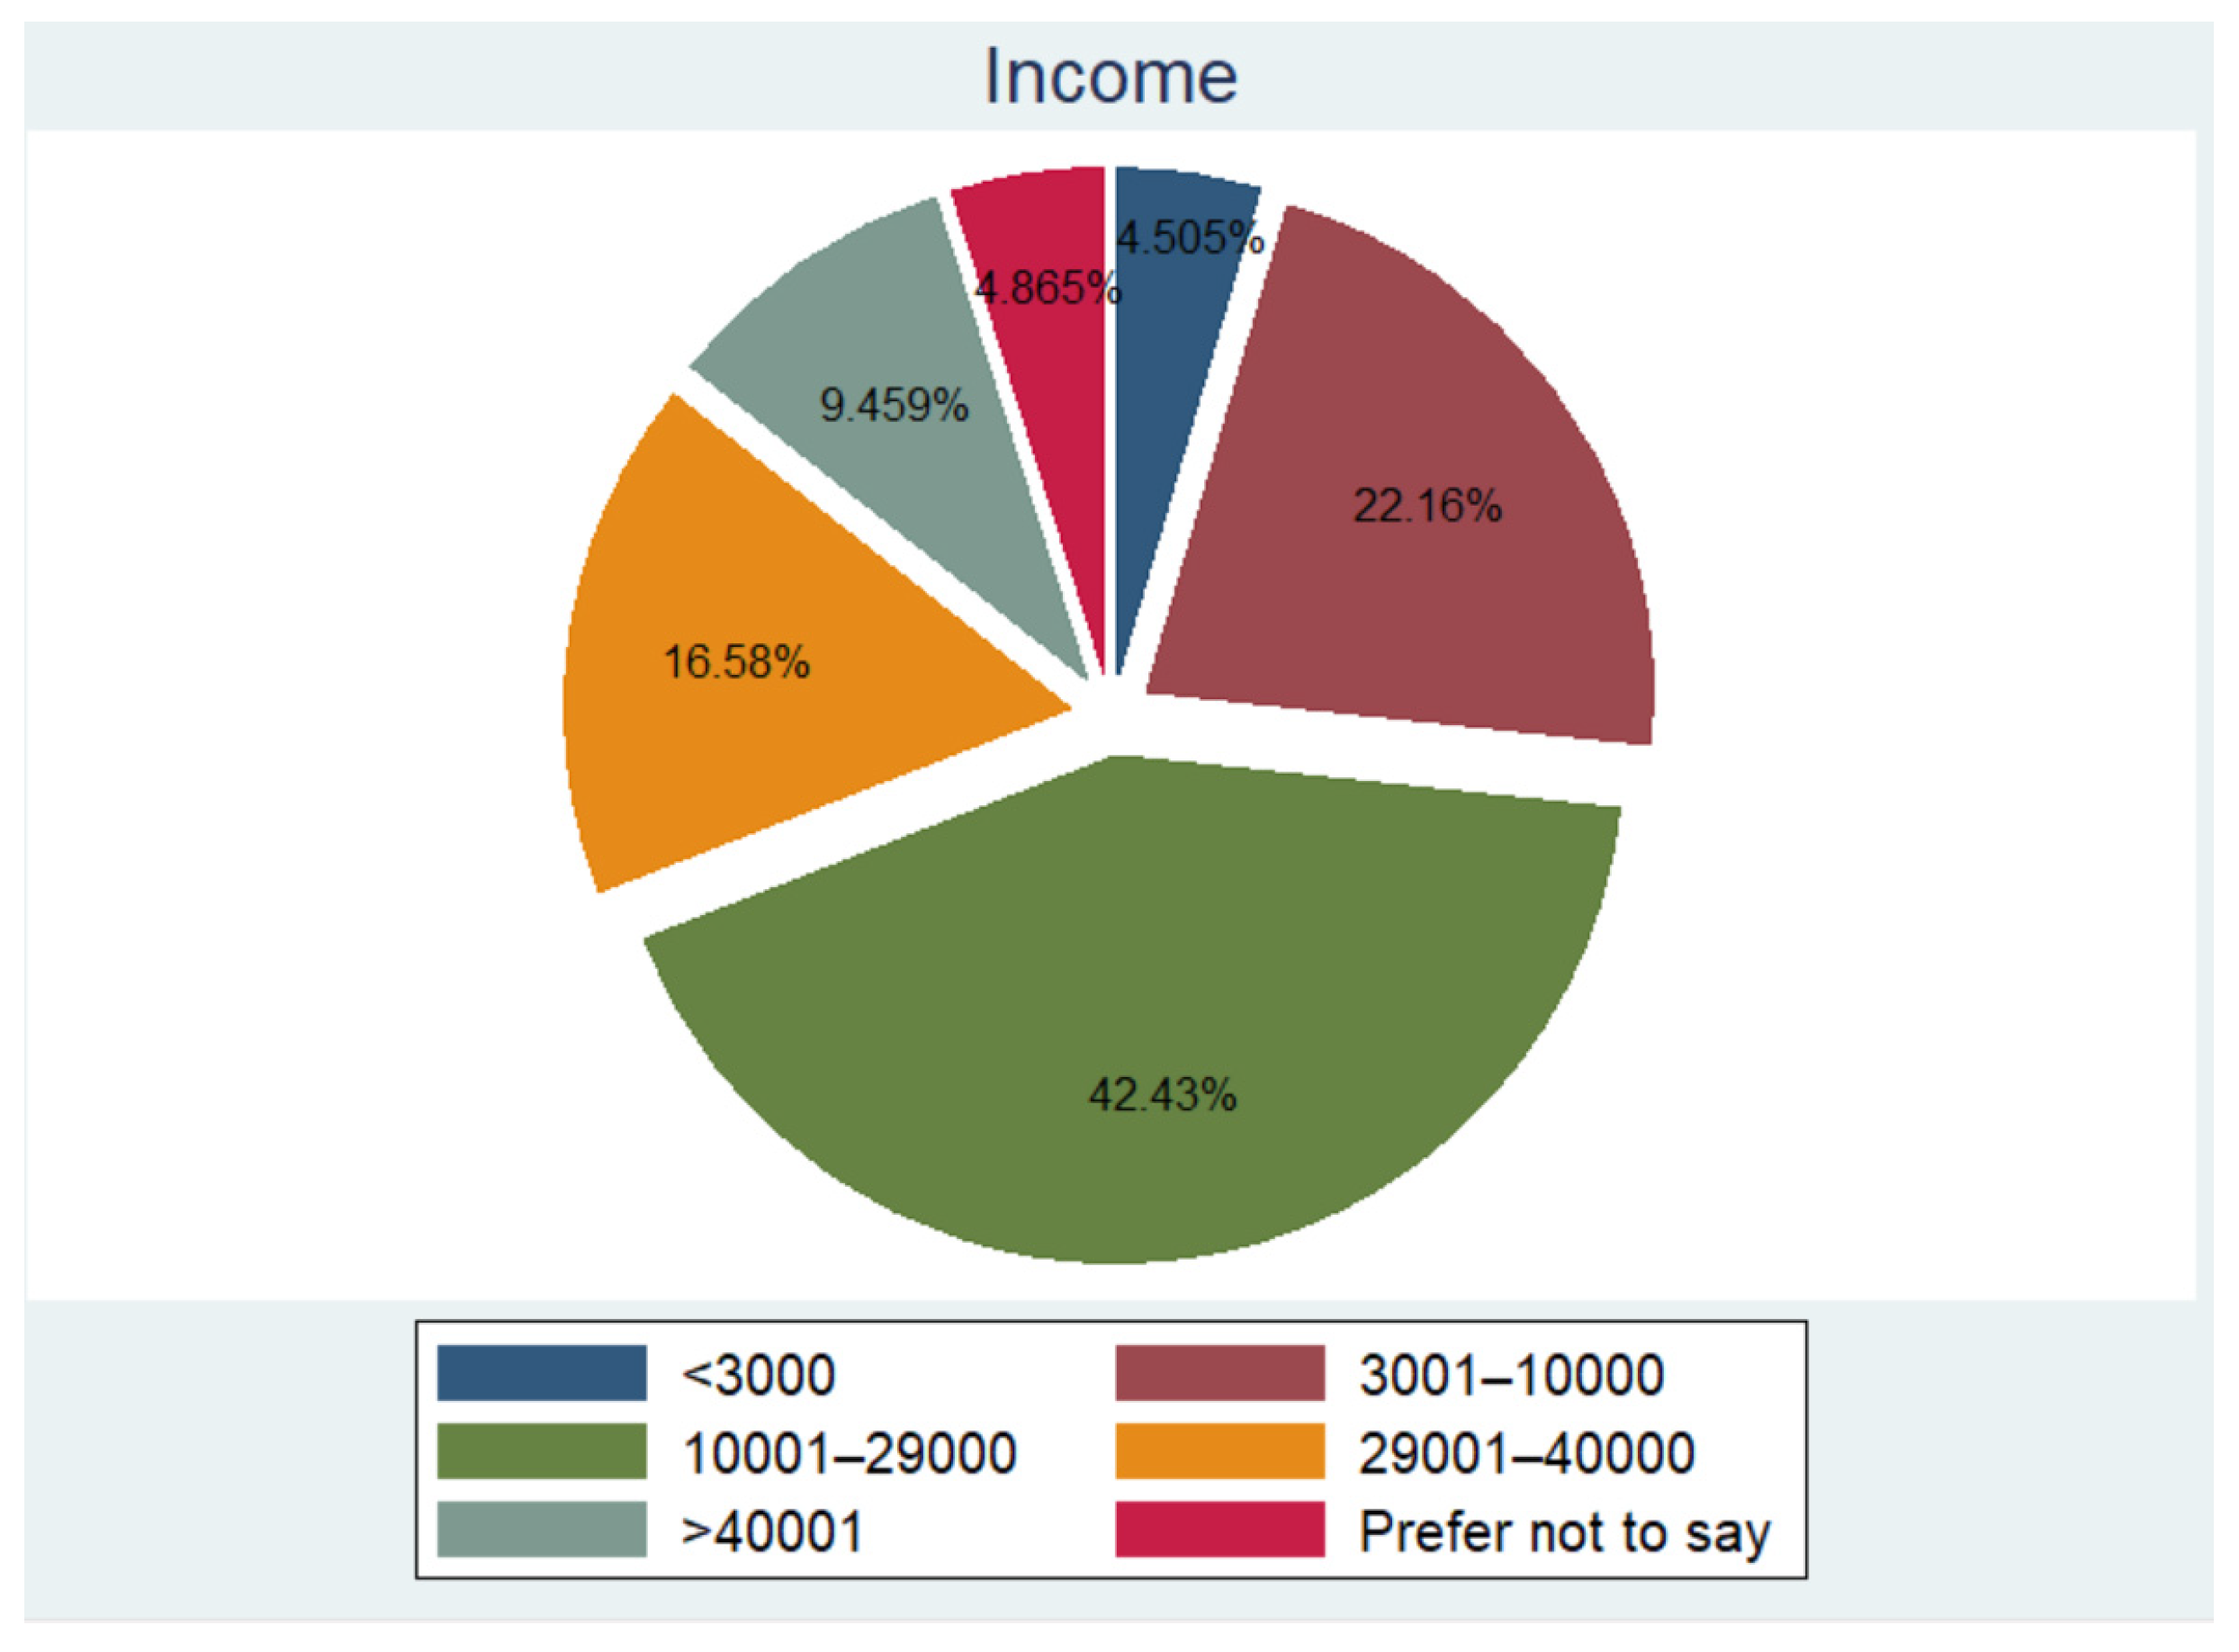
Regarding the income levels of our respondents, displayed in Figure 6, 42.5% of the respondents have monthly earnings between AED 10,001 and AED 29,000. Around 22% earn between AED 3001 and AED 10,000, 16.5% earn between AED 29,001 and AED 40,000, 9.5% earn above AED 40,001, 4.5% earn less than AED 3000, and around 5% prefer not to answer.
Table 1 describes the characteristics of the five behavioural biases studied. The table shows that loss aversion and representativeness biases are the most common biases, with 180 respondents exhibiting the former and 177 the latter. Overconfidence bias, with 24 observations, is the least common. Furthermore, for the whole range, men are more prone to exhibit behavioural impediments than women. The data show that the second and third income groups (3001–10,000 and 10,001–29,000) exhibit the most cases of behavioural biases compared to the others in terms of monthly earnings. Finally, the two youngest age groups (15–30 and 31–45) are more prone to behavioural disorders.

4.2. Empirical Evidence

In order to analyse the empirical relationship between (mis-)behaviour and financial literacy rates, we estimate the following model:
F L i = β 0 + r = 1 6 β r B i a s r , i + n = 1 3 β n C o n t r o l n , i + ε i
where the dependent variable FL is the financial literacy z_score calculated above for individual i, (i = 1, …, 446). As mentioned in Section 2.2, the study focuses on five different behavioural biases: hindsight, self-serving, overconfidence, loss aversion, and representativeness bias. These categories appear in the variable Bias, where r determines the individual bias classification (r = 1, …, 6).5 The second set of exogenous variables, Control, controls for socio-economic and demographic factors. The n different factors are gender (male, female, and others), age (i. 15–30, ii. 31–45, iii. 46–60, and iv. 60+), and income (i. AED 0–3000, ii. AED 3001–10,000, iii. AED 10,001–29,000, iv. AED 29,001–40,001, v. AED 40,001+ per month, and vi. Prefer not to say).6,7 The statistics for the dependent variable, its underlying concept, and the control variables age and income can be found in Table 2.8
We use ordinary least squares (OLS) to model Equation (1) for comparison purposes and ease of reproducing our results. We apply adequate care during the estimation process to comply with the classical linear regression function assumptions. Consequently, the statistical behaviour of the residual terms and the parameter values were analysed and adapted where necessary. Furthermore, to prevent misleading diagnostic tests, we calculated the variance as an exponential function of the covariates specified in the model. The last step is necessary because OLS explicitly assumes that the residuals of the variables are constant, which does not apply to our data. Concerning the stability of our results, we use the method-of-moments estimation technique as a robustness test. We obtain the same qualitative and quantitative results by assuming predeterminedness and imposing the moment condition of non-stochastic covariates.
The empirical results for Equation (1) appear in Table 3.9 To view the full regression model, please see Table A1 in Appendix A. The overall statistical model is significant at a 1% significance level. The coefficient of determination assumes a value of 0.4180, which indicates that the regression covariates explain 41.8% of the variability in the financial literacy score. In the realm of cross-sectional empirics, this signifies a high explanatory power of our empirical specification. Furthermore, except for the two variables capturing the overconfidence bias, all variables are statistically significant, at least at a 5% significance level.10
All significant variables (hindsight, self-serving, loss aversion, and representativeness bias) have a positive statistical relationship with the dependent variable, the financial literacy z_score. The positive coefficients mean that the respondents who exhibit any of these behavioural biases have a higher financial literacy score than the respondents who do not exhibit them. For example, a respondent who inhibits hindsight bias has a financial literacy z_score of 0.7134 standard deviations higher than a respondent that does not inhibit the hindsight bias. Overconfidence bias does not show a significant relationship with financial literacy.
Furthermore, the regression results, based on the coefficients of biases, suggest that some biases exhibit a stronger quantitative relationship with financial literacy than others. For example, having a coefficient value of 0.7134 for the hindsight bias exhibits the most substantial relationship with financial literacy. The second strongest is the self-serving bias with a coefficient of 0.5527, followed by the representativeness bias with a parameter value of 0.5299. The weakest statistically significant covariate is the effect of the loss aversion bias with a coefficient value of 0.4569. These numbers show that each behavioural bias shares an individual statistically robust relationship with the respondents’ financial literacy.

5. Conclusions

Research in financial literacy is an increasing focus of scholarly debate. Prior research shows that many factors influence financial literacy, with knowledge about personal finance at its core. Our research investigates if cognitive and behavioural biases influence the financial literacy of individuals in times of crisis. Despite the extensive literature on behavioural finance, limited academic research (e.g., Baker et al. 2019) has attempted to unravel the relationship between financial literacy and behavioural biases, particularly the behaviour of individuals during the crisis period. Therefore, this study examines the presence of behavioural biases using a sample of individuals who exhibited a loss in the UAE during the COVID-19 context.
Our main results show that behaviourally biased people tend to perform better at their level of financial literacy. Individuals with a high level of hindsight biases believe that certain adverse events will happen one day as they constantly use the phrase “I knew it will happen”. We suspect that people prone to this bias tend to research certain events before their occurrence to prepare themselves against any potential negative outcome. The research for the potential solutions is what improves their financial literacy. Such finding is consistent with the study carried out by Asbi et al. (2020). People with the loss aversion bias will similarly mitigate the risk of a potentially harmful outcome as they feel more financial pain from events with potential adverse outcomes (such as a crisis). We argue that to prevent the pain from any potential loss, they explore mitigating financial solutions that contribute to their financial literacy, an affirmative finding relating to the earlier study by Ramiah et al. (2016). As for representativeness bias, people tend to look at a pattern and, when detecting a possibility of a negative outcome, act on it before others. Their actions lead to finding the correct financial solution, which implies a higher financial literacy score, confirming the findings of Gerth et al. (2021).
Despite the challenges academics face in publishing in this field, we contribute to this important debate by looking at the behavioural attributes. We remain convinced that industry partners (as evidenced by the interest of LinkedIn) have a strong interest in this area. Our unique contribution to this field is establishing a link between behavioural biases, such as representativeness, self-serving, overconfidence, loss aversion, and hindsight, and financial literacy. We can also show the order of importance regarding these biases: hindsight bias, self-serving bias, representativeness bias, and loss aversion bias. The financial planning industry increasingly recognises the importance of behavioural biases, as evidenced by its inclusion in planning software such as Xplan, which includes a behavioural section. Practitioners believe it is a crucial element as it helps them to understand their clients. Our study is documenting this market occurrence.
We caution readers from generalising the findings of this study as it is based on the UAE which is a developing economy but highly influenced by the economic activities of the region and the globe. Additionally, the behaviours of the individuals and households in the UAE may not represent the behaviours of people in other countries. Indeed, as we have polled individuals and measured their biases during the crisis, and not before, we cannot make inferences on the evolution of biases in people or, indeed, whether there are differences between crisis periods and non-crisis periods. However, future researchers could focus on investigating the behavioural biases during the COVID-19 pandemic period of individuals in developed and developing countries. Additionally, as a comparison, polling the same survey participants in the future would identify any differences in behaviour. In terms of the technical feasibilities of our estimation method, our regression modelling approach only tests for statistical correlation, not for causation. Consequently, cause-and-effect relationships cannot be assumed. We leave such considerations for further research.

Author Contributions

Conceptualization, methodology, formal analysis, investigation, resources, data curation, writing—original draft preparation, writing—review and editing, was undertaken colloboratively and all authors have equally contributed. All authors have read and agreed to the published version of the manuscript.

Funding

This research received no external funding.

Institutional Review Board Statement

The ethics approval for this research was obtained from the American University of Dubai.

Informed Consent Statement

Informed consent was obtained from all subjects involved in the study.

Data Availability Statement

The data presented in this study are available on request from the corresponding author.

Conflicts of Interest

The authors declare no conflict of interest.

Appendix A

Table A1. Full regression results.
VariableCoefficientt-Statistics
Constant−0.5629 ***−4.92
Hindsight bias0.7134 ***5.48
Self-serving bias0.5527 **2.47
Overconfidence bias I0.18030.56
Overconfidence bias II0.04950.19
Loss aversion bias0.4569 ***3.72
Representativeness bias0.5299 ***4.30
GenderFemale0.00730.09
Age31–450.04590.49
Age46–600.3786 ***2.76
Age60+0.18220.47
Income3001–10,0000.06230.49
Income10,001–29,000−0.0870−0.67
Income29,001–40,0000.02090.13
Income+40,001−0.0773−0.31
IncomePrefer not to say0.6349 *1.78
Note: ***, **, and * signify significance at the 1%, 5%, and 10% level, respectively.

Note

1
Financial shock refers to any expense or loss of income that individuals or households do not plan for when budgeting (Pew Trust 2015).
2
For brevity, the questionnaire questions have not been included; however, they are available upon request from the authors.
3
Another paper that follows this method is the work by Morgan and Trinh (2019). The authors apply these calculations in order to find the determinants of financial literacy in Cambodia and Vietnam.
4
To construct the financial literacy score, the total sum of the questions for each category is added up. Consequently, the score might range from 0 (total financial ignorance) to 105 (total financial literacy).
5
Note that we have five different behavioural biases, but six different bias variables. The reason is that overconfidence can be captured through two different behavioural patterns. Therefore, we assign two different variables to it.
6
The regression model under Equation (1) might potentially suffer from reverse-causality. That is, there might be feedback effects coming from the independent to the dependent variable and back. In order to avoid such a problem, instrumental variable estimation might be used. The data obtained, unfortunately, do not allow us to construct instruments to control for such an issue. We leave this shortcoming to further research.
7
The reader should be cautious about the interpretation of the results. Regression modelling in its present form solely means a statistically robust relationship between variables. It does not refer to causality. We leave the issue of causality between the variables for further research.
8
To not duplicate the information given, we refrain from discussing the results represented by Table 2 and encourage the reader to study Section 4.2: Empirical Evidence. Furthermore, the control variable gender is not presented. The reason is that the variable is a dummy variable, and therefore numerical analysis as shown in Table 2 is meaningless.
9
For ease of interpretation and display, the control variables have been omitted from Table 3. They were, nonetheless, included in the model, Equation (1). Furthermore, the results have been estimated considering a heteroscedasticity-consistent variance-covariance matrix.
10
As a robustness test, the same model was estimated using the method-of-moments estimation technique. In order to do so, we assumed predeterminedness and the moment condition of non-stochastic covariates. The quantitative and qualitative results remain the same.

References

  1. Agarwal, Sumit, Gene Amromin, Itzhak Ben-David, Souphala Chomsisengphet, and Douglas D. Evanoff. 2015. Financial literacy and financial planning: Evidence from India. Journal of Housing Economics 27: 4–21. [Google Scholar] [CrossRef]
  2. Agnew, Julie R., Hazel Bateman, and Susan Thorp. 2012. Financial Literacy and Retirement Planning in Australia. UNSW Australian School of Business Research Paper No. 2012ACTL16. Available online: https://ssrn.com/abstract=2198641 (accessed on 20 June 2021).
  3. Ameliawati, Meli, and Redianna Setiyani. 2018. The Influence of Financial Attitude, Financial Socialization, and Financial Experience to Financial Management Behavior with Financial Literacy as the Mediation Variable. Paper presented at the International Conference on Economics, Business and Economic Education 2018, Semarang, Indonesia, July 17–18; Dubai: KnE Publishing, pp. 811–32. [Google Scholar]
  4. ANZ Survey of Adult Financial Literacy in Australia. 2008. The Social Research Centre. Available online: https://www.anz.com/Documents/AU/Aboutanz/AN_5654_Adult_Fin_Lit_Report_08_Web_Report_full.pdf (accessed on 20 June 2021).
  5. Asbi, Ammar, Vikash Ramiah, Xi Yu, Damien Wallace, Nisreen Moosa, and Krishna Reddy. 2020. The determinants of recovery from the Black Saturday bushfire: Demographic factors, behavioural characteristics and financial literacy. Accounting and Finance 60: 15–46. [Google Scholar] [CrossRef]
  6. Atkinson, Adele, and Flore-Anne Messy. 2012. Measuring financial literacy: Results of the OECD/International Network on Financial Education (INFE) pilot study. In OECD Working Papers on Finance, Insurance and Private Pensions Measuring Financial Literacy. Paris: OECD. [Google Scholar] [CrossRef]
  7. Babiarz, Patryk, and Cliff A. Robb. 2014. Financial Literacy and Emergency Saving. Journal of Family and Economic Issues 35: 40–50. [Google Scholar] [CrossRef]
  8. Baker, Kent H., Satish Kumar, Nisha Goyal, and Vidhu Gaur. 2019. How financial literacy and demographic variables relate to behavioral biases. Managerial Finance 45: 124–46. [Google Scholar] [CrossRef]
  9. Barber, Brad M., and Terrance Odean. 2000. Trading Is Hazardous to Your Wealth: The Common Stock Investment Performance of Individual Investors. Journal of Finance LV: 772–806. [Google Scholar]
  10. Barberis, Nicholas, Andrei Shleifer, and Robert Vishny. 1998. A model of investor sentiment. Journal of Financial Economics 49: 307–43. [Google Scholar] [CrossRef]
  11. Bernasek, Alexandra, and Stephanie Shwiff. 2001. Gender, risk, and retirement. Journal of Economic Issues 35: 345–56. [Google Scholar] [CrossRef]
  12. Bernheim, B. Douglas, and Daniel M. Garrett. 2003. The effects of financial education in the workplace: Evidence from a survey of households. Journal of Public Economics 87: 1487–519. [Google Scholar] [CrossRef]
  13. Bezhani, Ivoni. 2010. Intellectual capital reporting at UK universities. Journal of Intellectual Capital 11: 179–207. [Google Scholar] [CrossRef]
  14. Bianchi, Milo. 2018. Financial literacy and portfolio dynamics. Journal of Finance 73: 831–59. [Google Scholar] [CrossRef] [Green Version]
  15. Bryce, Mitchell, Muhammad Jahangir Ali, and Paul R. Mather. 2021. Director expectations gap and hindsight bias. Accounting and Finance 61: 2965–96. [Google Scholar] [CrossRef]
  16. Bucher-Koenen, Tabea, and Michael Ziegelmeyer. 2014. Once burned, twice shy? Financial literacy and wealth losses during the financial crisis. European Finance Review 18: 2215–46. [Google Scholar] [CrossRef]
  17. Camerer, Colin, Geroge Loewenstein, and Martin Weber. 1989. The Curse of Knowledge in Economic Settings: An Experimental Analysis. Journal of Political Economy 97: 1232–54. [Google Scholar] [CrossRef] [Green Version]
  18. Carpena, Fenella, Shawn Cole, Jeremy Shapiro, and Bilal Zia. 2019. The ABCs of financial education: Experimental evidence on attitudes, behavior, and cognitive biases. Management Science 65: 346–69. [Google Scholar] [CrossRef] [Green Version]
  19. Chelley-Steeley, Patricia L., Brian D. Kluger, and James M. Steeley. 2015. Earnings and hindsight bias: An experimental study. Economics Letters 134: 130–32. [Google Scholar] [CrossRef] [Green Version]
  20. Chen, Gongmeng, Kenneth A. Kim, John R. Nofsinger, and Oliver M. Rui. 2007. Trading Performance, Disposition Effect, Overconfidence, Representativeness Bias, and Experience of Emerging Market Investors. Journal of Behavioral Decision Making 20: 425–51. [Google Scholar] [CrossRef]
  21. Chowk, Girija, Vikash Ramiah, and Imad Moosa. 2016. Behavioural biases of Australian financial planners. Paper presented at 23rd Annual Conference of the Multinational Finance Society, Stockholm, Sweden, June 26–29. [Google Scholar]
  22. Clare, Ross. 2013. Equity and Superannuation—The Real Issues. Canberra: Association of Superannuation Funds of Australia. [Google Scholar]
  23. Clark, Gordon L., Maurizio Fiaschetti, and Paul Gerrans. 2019. Determinants of seeking advice within defined contribution retirement savings schemes. Accounting and Finance 59: 563–91. [Google Scholar] [CrossRef]
  24. Daniel, Kent, David Hirshleifer, and Avanidhar Subrahmanyam. 1998. Investor psychology and security market under- and overreactions. Journal of Finance 53: 1839–86. [Google Scholar] [CrossRef] [Green Version]
  25. Delpachitra, Sarath, and Diana Beal. 2002. Factors influencing planning for retirement. Economic Papers: A Journal of Applied Economics and Policy 21: 1–13. [Google Scholar] [CrossRef] [Green Version]
  26. Fernandez, Prafula. 2007. The benefits of simplified superannuation reform. The Agricultural Industry 9: 1–9. [Google Scholar]
  27. Finch, Nigel. 2005. The trouble with MER: The disclosure of fees and charges in Australian superannuation and investment funds. Journal of Law and Financial Management 4: 32–50. [Google Scholar]
  28. Fischhoff, Baruch. 1975. Hindsight is not equal to foresight: The effect of outcome knowledge on judgment under uncertainty. Journal of Experimental Psychology: Human Perception and Performance 1: 288–99. [Google Scholar] [CrossRef]
  29. Fischhoff, Baruch, and Ruth Beyth. 1975. I knew it would happen: Remembered probabilities of once-future things. Organizational Behavior and Human Performance 13: 1–16. [Google Scholar] [CrossRef]
  30. Frank, Jerome D. 1935. Some psychological determinants of the level of aspiration. American Journal of Psychology 47: 285–93. [Google Scholar] [CrossRef]
  31. Fry, Tim, Richard Heaney, and Warren McKeown. 2007. Will investors change their superannuation fund given the choice? Accounting and Finance 47: 267–83. [Google Scholar] [CrossRef] [Green Version]
  32. Gallery, Natalie. 2002. Superannuation fund choice: Opening Pandora’s Box. Australian Review of Public Affairs, September 5. [Google Scholar]
  33. Gerth, Florian, Vikash Ramiah, Elissar Toufaily, and Glenn Muschert. 2021. Assessing the effectiveness of Covid-19 financial product innovations in supporting financially distressed firms and households in the UAE. Journal of Financial Services Marketing, 1–11. [Google Scholar] [CrossRef]
  34. Grable, John E., and So-Hyun Joo. 2001. A further examination of financial help-seeking behaviour. Journal of Financial Counselling and Planning 12: 55–66. [Google Scholar]
  35. Greer, Thomas V., Nuchai Chuchinprakarn, and Sudhindra Seshadri. 2000. Likelihood of participating in mail survey research: Business respondents’ perspectives. Industrial Marketing Management 29: 97–109. [Google Scholar] [CrossRef]
  36. Grether, David M. 1980. Bayes rule as a descriptive model: The representativeness heuristic. Quarterly Journal of Economics 95: 537–57. [Google Scholar] [CrossRef]
  37. Guthrie, Chris. 2003. Prospect Theory, Risk Preference, and the Law. Northwestern University Law Review 97: 1115–63. [Google Scholar] [CrossRef] [Green Version]
  38. Ingles, David. 2009. The Great Superannuation Tax Concession Rort. The Australia Institute for a Just, Sustainable, Peaceful Future. Available online: https://www.tai.org.au/sites/default/files/super_tax_concessions_final_7.pdf (accessed on 5 June 2021).
  39. Jefferson, Therese. 2005. Women and retirement incomes in Australia: A review. Economic Record 81: 273–91. [Google Scholar] [CrossRef]
  40. Jonsson, Sara, Inga-Lill Söderberg, and Mats Wilhelmsson. 2017. An investigation of the impact of financial literacy, risk attitude, and saving motives on the attenuation of mutual fund investors’ disposition bias. Managerial Finance 43: 282–98. [Google Scholar] [CrossRef]
  41. Kahneman, Daniel, and Amos Tversky. 1972. Subjective probability: A judgment of representativeness. Cognitive Psychology 3: 430–54. [Google Scholar] [CrossRef]
  42. Kahneman, Daniel, and Amos Tversky. 1979. Prospect theory: An analysis of decision under risk. Econometrica 47: 263–91. [Google Scholar] [CrossRef] [Green Version]
  43. Kiymaz, Halil, Belma Öztürkkal, and K. Ali Akkemik. 2016. Behavioral biases of finance professionals: Turkish evidence. Journal of Behavioral and Experimental Finance 12: 101–11. [Google Scholar] [CrossRef]
  44. Klapper, Leora, Annamaria Lusardi, and Georgios A. Panos. 2013. Financial literacy and its consequences: Evidence from Russia during the financial crisis. Journal of Banking and Finance 37: 3904–23. [Google Scholar] [CrossRef]
  45. Lin, Xi, Aaron Bruhn, and Jananie William. 2019. Extending financial literacy to insurance literacy: A survey approach. Accounting and Finance 59: 685–713. [Google Scholar] [CrossRef]
  46. Linsky, Arnold S. 1975. Stimulating responses to mailed questionnaires: A review. Public Opinion Quarterly 39: 82–101. [Google Scholar] [CrossRef]
  47. Lusardi, Annamaria, and Olivia S. Mitchell. 2007. Financial literacy and retirement preparedness: Evidence and implications for financial education. Business Economics 42: 35–44. [Google Scholar] [CrossRef] [Green Version]
  48. Lusardi, Annamaria, and Olivia S. Mitchell. 2011. Financial literacy and retirement planning in the United States. Journal of Pension Economics and Finance 10: 509–25. [Google Scholar] [CrossRef] [Green Version]
  49. Malmendier, Ulrike, and Geoffrey Tate. 2008. Who makes acquisitions? CEO overconfidence and the market’s reaction. Journal of Financial Economics 89: 20–43. [Google Scholar] [CrossRef] [Green Version]
  50. Mezulis, Amy H., Lyn Y. Abramson, Janet Hyde, and Benjamin L. Hankin. 2004. Is there a universal positivity bias in attributions? A meta-analytic review of individual, developmental, and cultural differences in the self-serving attributional bias. Psychological Bulletin 130: 711–47. [Google Scholar] [CrossRef] [Green Version]
  51. Miller, Dale T., and Michael Ross. 1975. Self-serving biases in the attribution of causality: Fact or fiction? Psychological Bulletin 82: 213–25. [Google Scholar] [CrossRef] [Green Version]
  52. Mitchell, Olivia S., and Stephen P. Utkus, eds. 2004. Lessons from behavioural finance for retirement plan design. In Pension Design and Structure: New Lessons from Behavioural Finance. Oxford: Oxford University Press, pp. 3–42. [Google Scholar]
  53. MLC. 2012. Federal Budget Analysis. May 8, pp. 1–5. Available online: https://www.abc.net.au/news/specials/federal-budget-2012/2012-05-08/businesses-sidelined-in-federal-budget/3998986 (accessed on 1 July 2021).
  54. Morgan, Peter J., and Long Q. Trinh. 2019. Determinants and impacts of financial literacy in Cambodia and Viet Nam. Journal of Risk and Financial Management 12: 19. [Google Scholar] [CrossRef] [Green Version]
  55. Morling, Steven, and Robert Subbaraman. 1995. Superannuation and Saving. Research Discussion Paper RDP 9511. Sydney: Reserve Bank of Australia, Economic Research Department. [Google Scholar]
  56. Newell, Graeme. 2006. The Significance of the Property in Industry-Based Superannuation Funds in Australia. Paper presented at Pacific Rim Real Estate Society Conference, Auckland, New Zealand, January 22–26. [Google Scholar]
  57. Ng, Tuan-Hock, Woan-Ying Tay, Nya-Ling Tan, and Ying-San Lim. 2011. Influence of investment experience and demographic factors on retirement planning intention. International Journal of Business and Management 6: 196–203. [Google Scholar] [CrossRef] [Green Version]
  58. Noctor, Michael, Sheila Stoney, and Robert Stradling. 1992. Financial Literacy: A Discussion of Concepts and Competencies of Financial Literacy and Opportunities for Its Introduction into Young People’s Learning. Report prepared for the National Westminster Bank. London: National Foundation for Education Research. [Google Scholar]
  59. Noone, Jack, Fiona Alpass, and Christine Stephens. 2010. Do men and women differ in their retirement planning? Testing a theoretical model of gendered pathways to retirement preparation. Research on Aging 32: 715–38. [Google Scholar] [CrossRef]
  60. OECD. 2013. OECD/Info Toolkit to Measure Financial Literacy and Financial Inclusion: Guidance, Core Questionnaire and Supplementary Questions. Available online: http://www.oecd.org/finance/financial-education/Toolkit-to-measure-fin-lit-2013.pdf (accessed on 12 May 2021).
  61. OECD/INFE. 2015. OECD/INFE Toolkit for Measuring Financial Literacy and Financial Inclusion. Available online: https://www.oecd.org/daf/fin/financial-education/2015_OECD_INFE_Toolkit_Measuring_Financial_Literacy.pdf (accessed on 28 May 2021).
  62. The Pew Charitable Trust. 2015. The Role of Emergency Savings in Family Financial Security How Do Families Cope with Financial Shocks? Available online: https://www.pewtrusts.org/~/media/assets/2015/10/emergency-savings-report-1_artfinal.pdf (accessed on 10 July 2021).
  63. Pompian, Michael. 2006. Behavioral Finance and Wealth Management—How to Build Optimal Portfolios That Account for Investor Biases. Hoboken: John Wiley & Sons. [Google Scholar]
  64. Rabin, Matthew. 1998. Psychology and economics. Journal of Economic Literature 36: 11–46. [Google Scholar]
  65. Ramiah, Vikash. 2013. The impact of the Boxing Day tsunami on the world capital markets. Review of Quantitative Finance and Accounting 40: 383–401. [Google Scholar] [CrossRef]
  66. Ramiah, Vikash, Yilang Zhao, and Imad Moosa. 2014. Working capital management during the global financial crisis: The Australian experience. Qualitative Research in Financial Markets 6: 332–51. [Google Scholar] [CrossRef]
  67. Ramiah, Vikash, Yilang Zhao, Imad Moosa, and Michael Graham. 2016. A behavioural finance approach to working capital management. European Journal of Finance 22: 662–68. [Google Scholar] [CrossRef]
  68. Rice, Michael, and Ian McEwin. 2002. Superannuation Fees and Competition. Sydney: Phillips Fox Actuaries and Consultants, pp. 1–35. [Google Scholar]
  69. Rothman, George. 2003. Tax Advantages of Investment in Superannuation—In Bad Times as Well as Good. Paper presented at the Eleventh Annual Colloquium of Superannuation Researchers, Sydney, Australia, July 7–8. [Google Scholar]
  70. Rothman, George P. 2011. Projecting the adequacy of Australian retirement incomes. Paper presented at the Nineteenth Colloquium of Superannuation Researchers, Sydney, Australia, July 14–15. [Google Scholar]
  71. Shalev, Jonathan. 1997. Loss Aversion in a Multi-Period Model. Mathematical Social Sciences 33: 203–26. [Google Scholar] [CrossRef]
  72. Statista. 2021. United Arab Emirates 2021: Statista Country Report. Available online: https://www.statista.com/study/48490/united-arab-emirates/ (accessed on 25 May 2021).
  73. Sudman, Seymour, Norman M. Bradburn, and Norbert Schwarz. 1996. Thinking about Answers: The Application of Cognitive Processes to Survey Methodology. San Francisco: Jossey-Bass Publishers. [Google Scholar]
  74. Truell, Allen D., James E. Bartlett, and Melody W. Alexander. 2002. Response rate, speed, and completeness: A comparison of Internet-based and mail surveys. Behaviour Research Methods, Instruments, and Computers 34: 46–49. [Google Scholar] [CrossRef] [PubMed] [Green Version]
  75. Tversky, Amos, and Daniel Kahneman. 1974. Judgment under uncertainty: Heuristics and biases. Science 185: 1124–31. [Google Scholar] [CrossRef]
  76. van Rooij, Maarten C. J., Clemens J. M. Kool, and Menriette H. Prast. 2007. Risk-return preferences in the pension domain: Are people able to choose? Journal of Public Economics 91: 701–22. [Google Scholar] [CrossRef] [Green Version]
  77. van Rooij, Maarten C. J., Annamarie Lusardi, and Rob Alessie. 2011. Financial literacy and stock market participation. Journal of Financial Economics 101: 449–72. [Google Scholar] [CrossRef] [Green Version]
  78. Wood, Gordon. 1978. The knew-it-all-along effect. Journal of Experimental Psychology: Human Perception and Performance 4: 345–53. [Google Scholar] [CrossRef]
  79. Xue, Rui, Adrian Gepp, Terry J. O’Neill, Steven Stern, and Bruce J. Vanstone. 2019. Financial literacy amongst elderly Australians. Accounting and Finance 59: 887–918. [Google Scholar] [CrossRef]
  80. Yoong, Joanne, and Vera R. D. M. Ferreira. 2013. Improving Financial Education Effectiveness through Behavioural Economics: OECD Key Findings and Way Forward. Paris: OECD Publishing, vol. 1, pp. 1926–82. [Google Scholar]
  81. Zuckerman, Miron. 1979. Attribution of success and failure revisited, or: The motivational bias is alive and well in attribution theory. Journal of Personality 47: 245–87. [Google Scholar] [CrossRef]
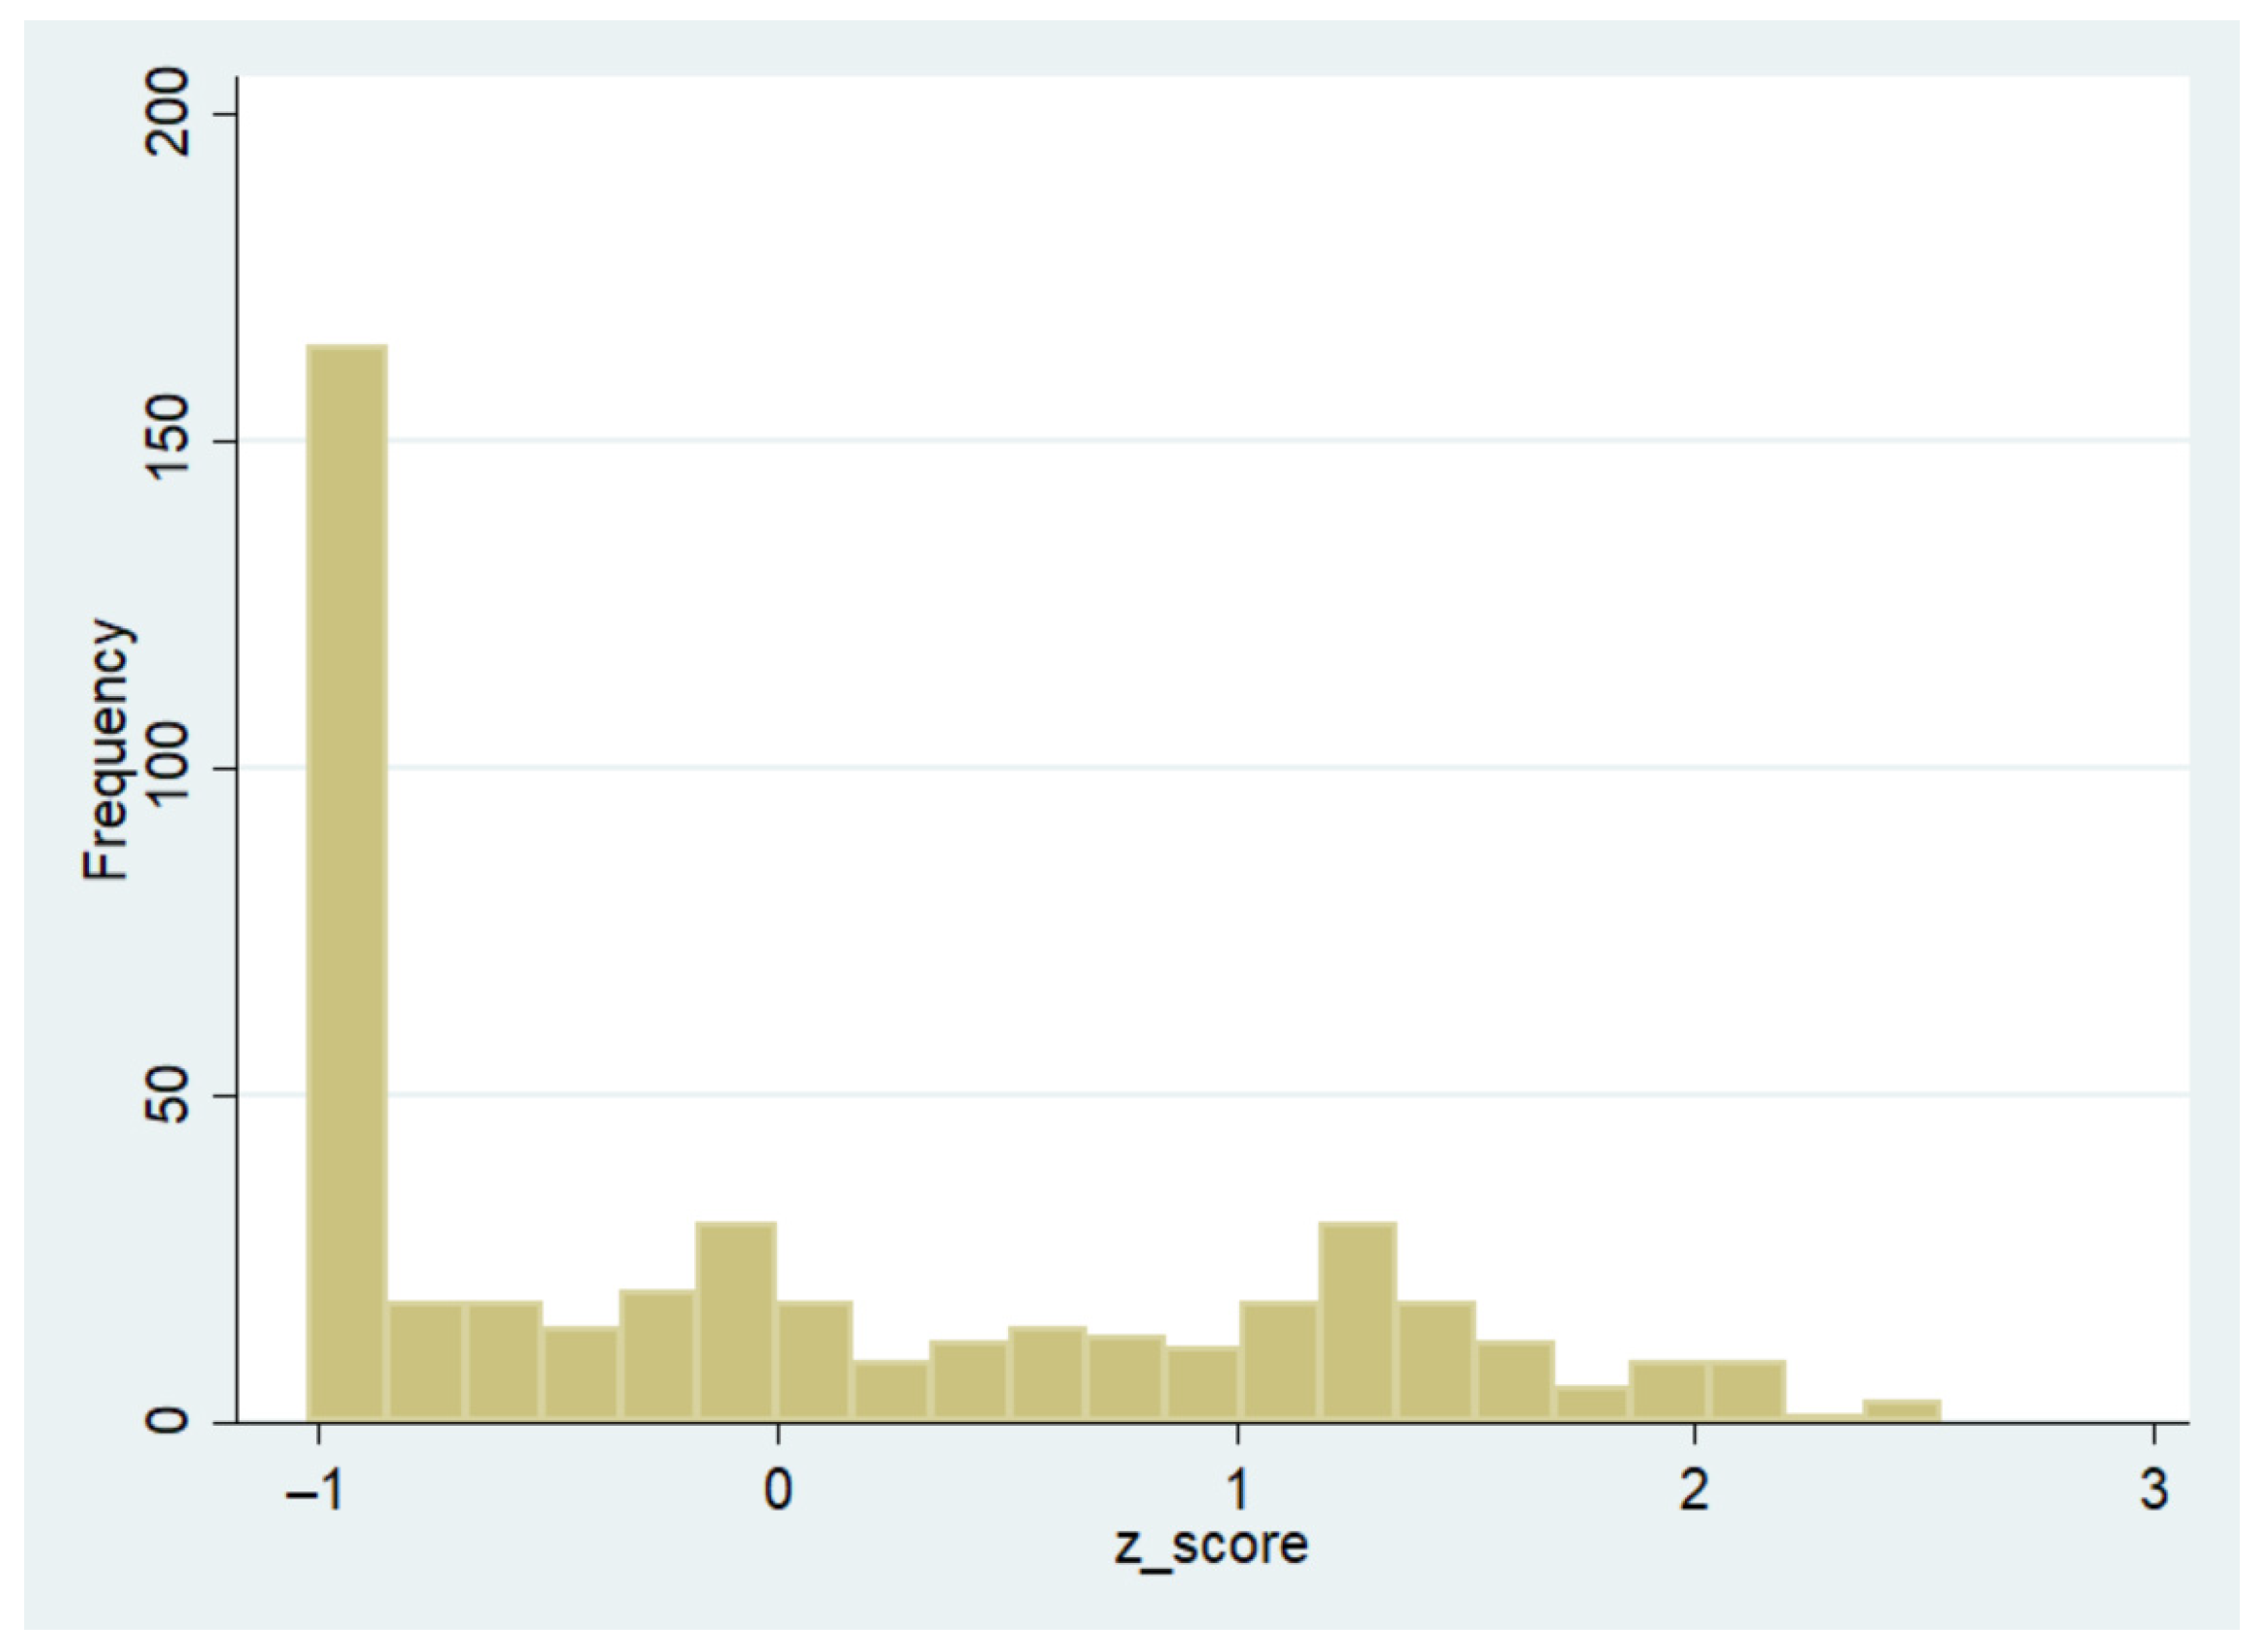
Figure 1. Histogram of financial literacy scores.
Jrfm 14 00395 g001
Figure 2. Financial literacy scores by gender.
Jrfm 14 00395 g002
Figure 3. Financial literacy scores by age group.
Jrfm 14 00395 g003
Figure 4. Financial literacy scores by income group.
Jrfm 14 00395 g004
Figure 5. Age decomposition.
Jrfm 14 00395 g005
Figure 6. Income decomposition.
Jrfm 14 00395 g006
Table 1. Behavioural biases.
GenderIncomeAge
BiasNMaleFemale>30003000–10,00010,001–29,00029,001–40,000>40,000Prefer Not to Say15–3031–4546–6061+
Hindsight bias6047134241311352226120
Self-serving bias302010447582121341
Overconfidence bias I141135232114901
Overconfidence bias II141314422115900
Loss aversion bias18011367205165251276687225
Representativeness bias17711067225562221246586233
Table 2. Summary statistics.
VariableNMeanMedianStd. Dev.Min.Max.
score44626.319.025.9092
scorez4460−0.281.0−1.072.54
Age446333810.52965
Income42816,56220,00012,247200055,000
Table 3. Regression results.
Hindsight BiasSelf-Serving BiasOverconfidence Bias IOverconfidence Bias IILoss Aversion BiasRepresentativeness Bias
0.71340.55270.18030.04950.45690.5299
(5.48 ***)(2.47 **)(0.56)(0.19)(3.72 ***)(4.30 ***)
Note: Values in brackets below the coefficients represent their respective t-statistics. ***, **, and * indicate significance at the 1%, 5%, and 10% level, respectively.
Publisher’s Note: MDPI stays neutral with regard to jurisdictional claims in published maps and institutional affiliations.